Embed Size (px)
Citation preview
HAL Id: hal-00192253https://hal.archives-ouvertes.fr/hal-00192253
Submitted on 27 Nov 2007
HAL is a multi-disciplinary open accessarchive for the deposit and dissemination of sci-entific research documents, whether they are pub-lished or not. The documents may come fromteaching and research institutions in France orabroad, or from public or private research centers.
L’archive ouverte pluridisciplinaire HAL, estdestinée au dépôt et à la diffusion de documentsscientifiques de niveau recherche, publiés ou non,émanant des établissements d’enseignement et derecherche français ou étrangers, des laboratoirespublics ou privés.
Potential role of compressional structures in generatingsubmarine slope failures in the Niger Delta
Nabil Sultan, Michel Voisset, Bruno Marsset, Tania Marsset, E. Cauquil, J.Colliat
To cite this version:Nabil Sultan, Michel Voisset, Bruno Marsset, Tania Marsset, E. Cauquil, et al.. Potential role ofcompressional structures in generating submarine slope failures in the Niger Delta. Marine Geology,Elsevier, 2007, 237 (3-4), pp.169-190. <10.1016/j.margeo.2006.11.002>. <hal-00192253>
Ple
ase
note
that
this
is a
n au
thor
-pro
duce
d P
DF
of a
n ar
ticle
acc
epte
d fo
r pub
licat
ion
follo
win
g pe
er re
view
. The
def
initi
ve p
ublis
her-a
uthe
ntic
ated
ver
sion
is a
vaila
ble
on th
e pu
blis
her W
eb s
ite
1
Marine Geology Vol. 237, Issues 3-4, 13 March 2007, Pages 169-190 http://dx.doi.org/10.1016/j.margeo.2006.11.002 © 2006 Elsevier B.V. All rights reserved
Archimer, archive institutionnelle de l’Ifremerhttp://www.ifremer.fr/docelec/
Potential role of compressional structures in generating submarine slope failures in the Niger Delta
N. Sultana,*, M. Voisseta, B. Marsseta, T. Marsseta, E. Cauquilb and Jean-Louis Colliatb
a IFREMER, Département Géosciences Marines, BP 70, Plouzané F-29280, France b TOTAL, France *: Corresponding author : [email protected]
Abstract:
The study area, offshore Nigeria, is located in one of the compressional zones within the Niger Delta, which is characterized by imbricate thrust structures. Although the low mean slope angle (around 2°), bathymetry data from the study area have shown the existence of several submarine landslides which coincide with known subsurface faulted compressive features.
In this paper, we have focused on a submarine slide occurring in water depths ranging between 1690 and 1750 m. Headwall scars, internal architecture and associated deposits have been characterized using a combination of 3D seismic data, near-bottom echosounder seismic profiles, Kullenberg cores and in-situ geotechnical measurements. The slide shows horseshoe shaped headwall scars and depositional lobes with positive relief. Monitoring of excess pore pressure for 12 months indicates the presence of negative hydraulic gradients, which is either an indication of a local present-day mechanical activity of subsurface faults or related to the regional extension of the Niger Delta and the possible creation of a regional depression in the hydraulic regime.
In order to identify the triggering mechanism of the observed landslide, a three-dimensional slope stability model (SAMU-3D) based on the upper bound theorem of plasticity was used. Calculation results have shown that the gravity loading generated by the sediment weight alone is not sufficient to explain the observed submarine slide. Cylindrical cavity expansion theory was used to locally simulate the compressional structure movements and to evaluate the strength generated within the upper sediment layers. Slope stability assessment carried out by considering this additional structural strength has shown that regional compressional gravity driven deformation can explain the observed submarine failures.
Keywords: compressional structures; modelling; Niger Delta; penetrometer; piezometer; slope stability
Introduction In the past few decades, significant efforts have been made to understand and identify the origin and flow behaviour of submarine slides on continental margins (Morgenstern and Price, 1965; Bugge et al., 1987; Mulder and Cochonat, 1996; Locat and Lee, 2002; Locat and Mienert, 2003; Canals et al., 2004; Sultan et al., 2004; Urgeles et al., 2006 among others). Thanks to oil industry exploration, numerous studies and projects on submarine slope instability and its effect on offshore structures, pipelines and marine construction have been carried out on the Norwegian Margin, in the Gulf of Guinea and the Gulf of Mexico. It was often shown that conditions of seafloor instability are complex and result from interaction of many causal and triggering factors. It was also often demonstrated that an integration of geophysical, geological and geotechnical approaches are needed for a better assessment and understanding of submarine slide mechanisms. The present work is carried out through a joint research project (NERIS) between Ifremer and TOTAL where multidisciplinary techniques and methods are used. The study area is the continental slope off Nigeria where a large number and variety of surveys have been carried out in recent years as a result of oil and gas industry interest. The continental slope off Nigeria is one of the areas where the occurrence near the seafloor of instability and deformation features have been detected previously by several authors (Damuth 1994; Cohen and McClay, 1996; Hovland et al., 1997; Brooks et al 2000; Graue 2000; Deptuck et al. 2003 among others). This type of shallow feature is of special interest to industrial development because it could become a major risk to any future oil development. The main aim of this work is to identify the geological and mechanical mechanisms at the origin of observed slope instability and deformation features in the study area in order to better anticipate any danger associated to future seafloor development. To accomplish this objective, the 3D seismic data performed by the industry with the geotechnical and geophysical site characterizations and in-situ monitoring carried out during two NERIS surveys are combined to define the internal architecture of the slope failure and to identify the local activity of the area. The risk assessment process and the detection of the triggering mechanism of the observed seafloor instabilities are carried out by using a three-dimensional slope stability model (SAMU-3D, Sultan et al. 2006).
Geological-Structural context and seafloor features The continental margin off the Niger Delta is undergoing deformation by gravity driven tectonism initiated in response to rapid seaward loading of sediments. The following regional structures styles have been identified (Damuth, 1994; Hospers, 1965; Burke, 1972; Mascle et al., 1973; Delteil et al, 1974; Emery et al., 1975; Weber and Daukoru, 1975; Lehner and De Ruiter, 1977; Evamy et al., 1978; Whiteman, 1982; Knox and Omatsola, 1989):
(1) an upper extensional zone beneath the outer continental shelf characterised by extensive listric growth faults. Growth faulting is induced by load, compaction and differential subsidence resulting from rapid sedimentation linked to the Niger river;
(2) an intermediate translational zone beneath the continental slope characterised by shale diapirs and ridges dividing the slope into separate intraslope basins. These basins are filled with ponded sediments (turbidites and mass transport deposits);
(3) a lower compressional zone beneath the lower continental slope and uppermost rise characterised by imbricate thrust structures (toe thrusts).
These structural styles indicate that large portions of the thick sedimentary prism are slowly moving downslope by gravity gliding or sliding on decollement surfaces located within the so
2
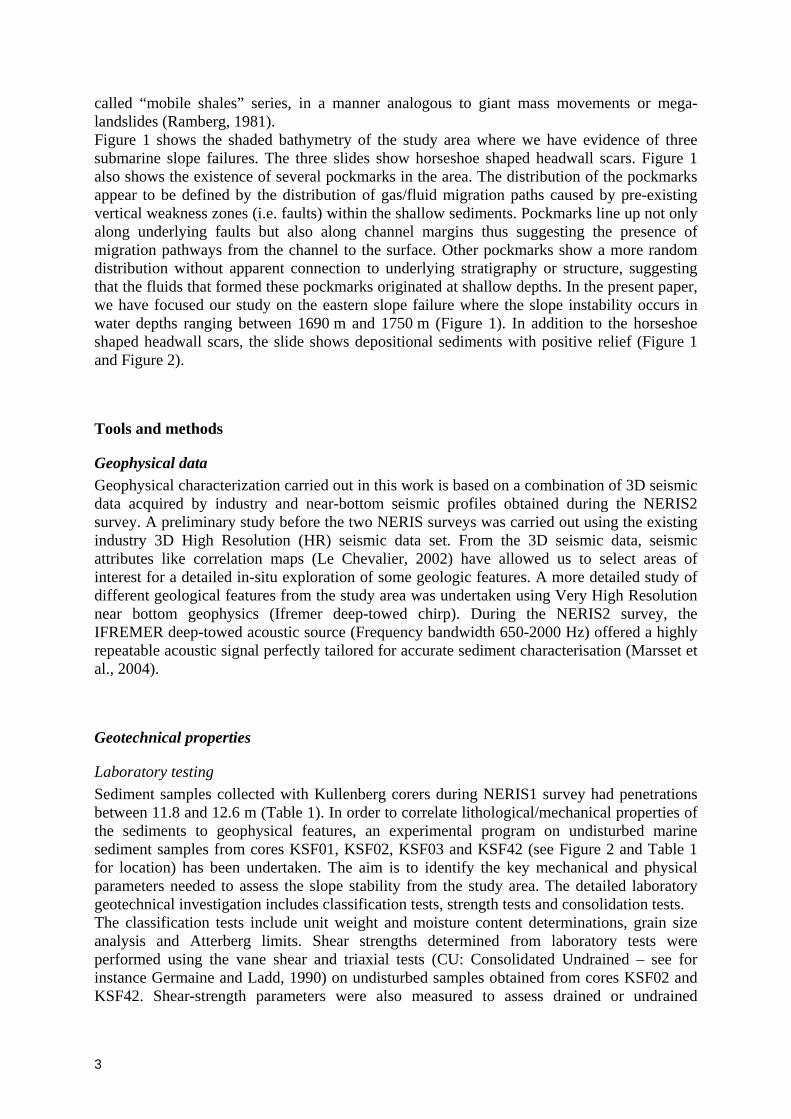
called “mobile shales” series, in a manner analogous to giant mass movements or mega-landslides (Ramberg, 1981). Figure 1 shows the shaded bathymetry of the study area where we have evidence of three submarine slope failures. The three slides show horseshoe shaped headwall scars. Figure 1 also shows the existence of several pockmarks in the area. The distribution of the pockmarks appear to be defined by the distribution of gas/fluid migration paths caused by pre-existing vertical weakness zones (i.e. faults) within the shallow sediments. Pockmarks line up not only along underlying faults but also along channel margins thus suggesting the presence of migration pathways from the channel to the surface. Other pockmarks show a more random distribution without apparent connection to underlying stratigraphy or structure, suggesting that the fluids that formed these pockmarks originated at shallow depths. In the present paper, we have focused our study on the eastern slope failure where the slope instability occurs in water depths ranging between 1690 m and 1750 m (Figure 1). In addition to the horseshoe shaped headwall scars, the slide shows depositional sediments with positive relief (Figure 1 and Figure 2).
Tools and methods
Geophysical data Geophysical characterization carried out in this work is based on a combination of 3D seismic data acquired by industry and near-bottom seismic profiles obtained during the NERIS2 survey. A preliminary study before the two NERIS surveys was carried out using the existing industry 3D High Resolution (HR) seismic data set. From the 3D seismic data, seismic attributes like correlation maps (Le Chevalier, 2002) have allowed us to select areas of interest for a detailed in-situ exploration of some geologic features. A more detailed study of different geological features from the study area was undertaken using Very High Resolution near bottom geophysics (Ifremer deep-towed chirp). During the NERIS2 survey, the IFREMER deep-towed acoustic source (Frequency bandwidth 650-2000 Hz) offered a highly repeatable acoustic signal perfectly tailored for accurate sediment characterisation (Marsset et al., 2004).
Geotechnical properties
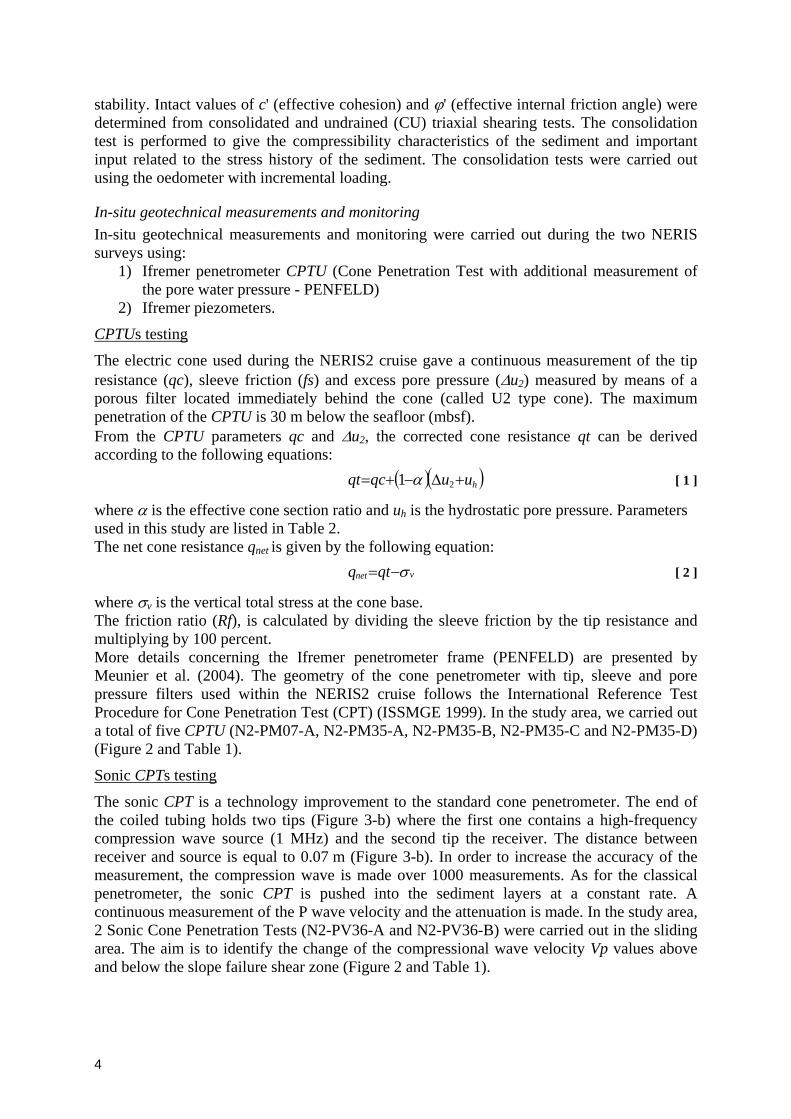
Laboratory testing Sediment samples collected with Kullenberg corers during NERIS1 survey had penetrations between 11.8 and 12.6 m (Table 1). In order to correlate lithological/mechanical properties of the sediments to geophysical features, an experimental program on undisturbed marine sediment samples from cores KSF01, KSF02, KSF03 and KSF42 (see Figure 2 and Table 1 for location) has been undertaken. The aim is to identify the key mechanical and physical parameters needed to assess the slope stability from the study area. The detailed laboratory geotechnical investigation includes classification tests, strength tests and consolidation tests. The classification tests include unit weight and moisture content determinations, grain size analysis and Atterberg limits. Shear strengths determined from laboratory tests were performed using the vane shear and triaxial tests (CU: Consolidated Undrained – see for instance Germaine and Ladd, 1990) on undisturbed samples obtained from cores KSF02 and KSF42. Shear-strength parameters were also measured to assess drained or undrained
3
stability. Intact values of c' (effective cohesion) and ϕ' (effective internal friction angle) were determined from consolidated and undrained (CU) triaxial shearing tests. The consolidation test is performed to give the compressibility characteristics of the sediment and important input related to the stress history of the sediment. The consolidation tests were carried out using the oedometer with incremental loading.
In-situ geotechnical measurements and monitoring In-situ geotechnical measurements and monitoring were carried out during the two NERIS surveys using:
1) Ifremer penetrometer CPTU (Cone Penetration Test with additional measurement of the pore water pressure - PENFELD)
2) Ifremer piezometers.
CPTUs testing
The electric cone used during the NERIS2 cruise gave a continuous measurement of the tip resistance (qc), sleeve friction (fs) and excess pore pressure (Δu2) measured by means of a porous filter located immediately behind the cone (called U2 type cone). The maximum penetration of the CPTU is 30 m below the seafloor (mbsf). From the CPTU parameters qc and Δu2, the corrected cone resistance qt can be derived according to the following equations:
( )( )huuqcqt +Δ−+= 21 α [ 1 ]
where α is the effective cone section ratio and uh is the hydrostatic pore pressure. Parameters used in this study are listed in Table 2. The net cone resistance qnet is given by the following equation:
vnet qtq σ−= [ 2 ]
where σv is the vertical total stress at the cone base. The friction ratio (Rf), is calculated by dividing the sleeve friction by the tip resistance and multiplying by 100 percent. More details concerning the Ifremer penetrometer frame (PENFELD) are presented by Meunier et al. (2004). The geometry of the cone penetrometer with tip, sleeve and pore pressure filters used within the NERIS2 cruise follows the International Reference Test Procedure for Cone Penetration Test (CPT) (ISSMGE 1999). In the study area, we carried out a total of five CPTU (N2-PM07-A, N2-PM35-A, N2-PM35-B, N2-PM35-C and N2-PM35-D) (Figure 2 and Table 1).
Sonic CPTs testing
The sonic CPT is a technology improvement to the standard cone penetrometer. The end of the coiled tubing holds two tips (Figure 3-b) where the first one contains a high-frequency compression wave source (1 MHz) and the second tip the receiver. The distance between receiver and source is equal to 0.07 m (Figure 3-b). In order to increase the accuracy of the measurement, the compression wave is made over 1000 measurements. As for the classical penetrometer, the sonic CPT is pushed into the sediment layers at a constant rate. A continuous measurement of the P wave velocity and the attenuation is made. In the study area, 2 Sonic Cone Penetration Tests (N2-PV36-A and N2-PV36-B) were carried out in the sliding area. The aim is to identify the change of the compressional wave velocity Vp values above and below the slope failure shear zone (Figure 2 and Table 1).
4
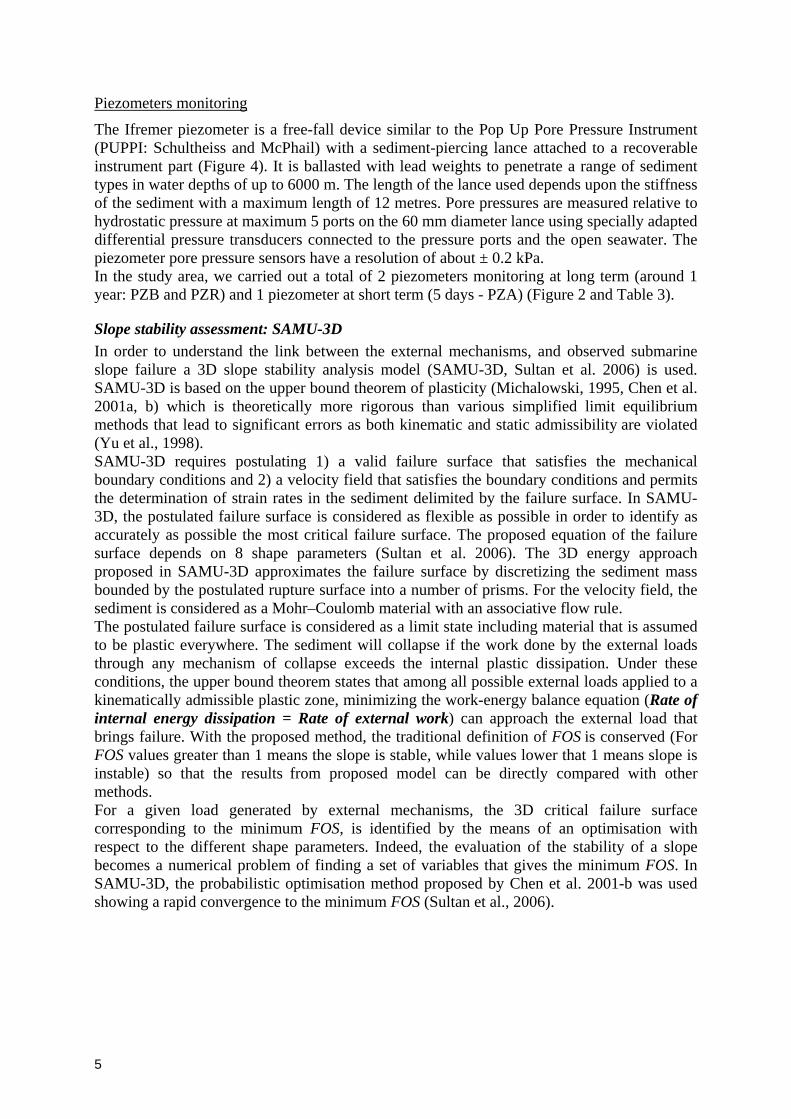
Piezometers monitoring
The Ifremer piezometer is a free-fall device similar to the Pop Up Pore Pressure Instrument (PUPPI: Schultheiss and McPhail) with a sediment-piercing lance attached to a recoverable instrument part (Figure 4). It is ballasted with lead weights to penetrate a range of sediment types in water depths of up to 6000 m. The length of the lance used depends upon the stiffness of the sediment with a maximum length of 12 metres. Pore pressures are measured relative to hydrostatic pressure at maximum 5 ports on the 60 mm diameter lance using specially adapted differential pressure transducers connected to the pressure ports and the open seawater. The piezometer pore pressure sensors have a resolution of about ± 0.2 kPa. In the study area, we carried out a total of 2 piezometers monitoring at long term (around 1 year: PZB and PZR) and 1 piezometer at short term (5 days - PZA) (Figure 2 and Table 3).
Slope stability assessment: SAMU-3D In order to understand the link between the external mechanisms, and observed submarine slope failure a 3D slope stability analysis model (SAMU-3D, Sultan et al. 2006) is used. SAMU-3D is based on the upper bound theorem of plasticity (Michalowski, 1995, Chen et al. 2001a, b) which is theoretically more rigorous than various simplified limit equilibrium methods that lead to significant errors as both kinematic and static admissibility are violated (Yu et al., 1998). SAMU-3D requires postulating 1) a valid failure surface that satisfies the mechanical boundary conditions and 2) a velocity field that satisfies the boundary conditions and permits the determination of strain rates in the sediment delimited by the failure surface. In SAMU-3D, the postulated failure surface is considered as flexible as possible in order to identify as accurately as possible the most critical failure surface. The proposed equation of the failure surface depends on 8 shape parameters (Sultan et al. 2006). The 3D energy approach proposed in SAMU-3D approximates the failure surface by discretizing the sediment mass bounded by the postulated rupture surface into a number of prisms. For the velocity field, the sediment is considered as a Mohr–Coulomb material with an associative flow rule. The postulated failure surface is considered as a limit state including material that is assumed to be plastic everywhere. The sediment will collapse if the work done by the external loads through any mechanism of collapse exceeds the internal plastic dissipation. Under these conditions, the upper bound theorem states that among all possible external loads applied to a kinematically admissible plastic zone, minimizing the work-energy balance equation (Rate of internal energy dissipation = Rate of external work) can approach the external load that brings failure. With the proposed method, the traditional definition of FOS is conserved (For FOS values greater than 1 means the slope is stable, while values lower that 1 means slope is instable) so that the results from proposed model can be directly compared with other methods. For a given load generated by external mechanisms, the 3D critical failure surface corresponding to the minimum FOS, is identified by the means of an optimisation with respect to the different shape parameters. Indeed, the evaluation of the stability of a slope becomes a numerical problem of finding a set of variables that gives the minimum FOS. In SAMU-3D, the probabilistic optimisation method proposed by Chen et al. 2001-b was used showing a rapid convergence to the minimum FOS (Sultan et al., 2006).
5
Results
Deep-towed seismic profile Figure 5 shows a deep-towed chirp profile (CH04) acquired during NERIS2 survey (for location see Figure 2). CPTU, Sonic CPT, piezometers and cores locations are projected on the CH04 profile. As it can be seen from Figure 5, the deep-towed seismic achieved remarkable results in term of penetration, resolution and quality of data (for details see Marsset et al. 2005). The CH04 profile (confined between 1680 and 1750 m water depth) provides us with further insight into different acoustic facies. The transition zone between the slide area and the normal sedimentary cover can be seen on the seismic profile CH04. CH04 profile exhibits a lateral transition between undisturbed sediment (continuous reflectors on the south-west side) and a remoulded area and layers (chaotic acoustic facies on the north-west side, Figure 5). Figure 5 also shows that heavy faulting takes place in the upper sedimentary layers below the sliding area (Marsset et al., 2005).
Geotechnical data from laboratory measurements Classification tests carried out on sedimentary cores have shown that sediments from the study area are characterized by a relatively low submerged unit weight (between 2.5 kN/m3 and 5 kN/m3). The water content at the top for the four cores is around 200 % and decrease slowly until 140 % at around 12 mbsf. The results of grain size distribution analyses carried out using laser diffraction method on the four cores did not show any abrupt lithology changes. Sediments from the four cores are mainly silty clay. The clay content is between 15 % and 20 %. It is important to mention that ultra-sounds were applied during 2 minutes to an untreated samples (dispersing agents) before the grain size distribution tests which may have underestimated the clay content (Thomas et al., 2005). The plasticity index (PI) from this area is between 20 and 40. From the four cores, change of the undrained shear strength Su with depth is gentle. For the two cores KSF01 and KSF02, the rate between Su and the vertical effective stress σ’v shows the behaviour of a normally consolidated to an over-consolidated sediment. For cores KSF03 and KSF42, the
v
Su'σ
rate indicates the existence of a slightly under-consolidated sediment
below 8 m for KSF03 and around 7 m for KSF42. For the four cores, the sensitivity St is between 2 and 4. Consolidated and undrained (CU) triaxial shearing tests were made at various confining pressures (20–100 kPa) on samples from KSF02 and KSF42. Sediment from the two cores is characterized by a high internal friction angle ϕ comprised between 36° and 46°. Results of the consolidation tests in terms of compressibility and consolidation states for cores KSF02, KSF03 and KSF42 are presented in Table 4. The Over-Consolidation Ratio (OCR) which is equal the ratio between preconsolidation pressure (σ’p) and vertical effective stress (σ’v) is presented in Table 4 and confirmed the normally consolidated state of the sediment from core KSF02. For the sample taken from core KSF03 at around 10 mbsf, the OCR was around 0.92. For core KSF42, the sample taken at around 9 mbsf shows an OCR equal to 0.92. Values of OCR less than 1 (core KSF03 and KSF42) obtained from Su values and the oedometer curves fit well with the chaotic reflector identified in the deep-towed chirp profile (CH04 profile - Figure 5).
Geotechnical data from in-situ testing In-situ testing results from site N2-PM35-B are shown in Figure 6 in terms of vertical effective stress, tip resistance, sleeve friction and pore pressure as a function of depth. For the
6
three other sites (N2-PM07, N2-PM35-A, N2-PM35-C and N2-PM35-D) CPTU testing results have shown a general similar tendency at the scale of Figure 6 even if locally some sleeve friction decreases was identified at different depths for the 5 different sites. Two geotechnical parameters were derived from the CPTU measurements:
1- The CPTU provides a continuous measurement of the tip resistance (indirectly of the net cone resistance qnet) and the excess pore pressure Δu . The q2 net parameters were used through an empirical coefficient Nk in order to derive Su (Lunne et al. 1997). Two values of Nk typically used for marine silty clay were considered (Nk=10 and Nk=15) in order to define an upper bound and lower bound of Su. From the excess pore pressure measurements, it is also possible to calculate Su using empirical parameters NΔu which was taken equal to 10 for the silty clay (Lunne et al. 1997).
2- St was also derived from the friction ratio Rf with a mean value of Ns equal to 7 for silty clay (Lunne et al. 1997).
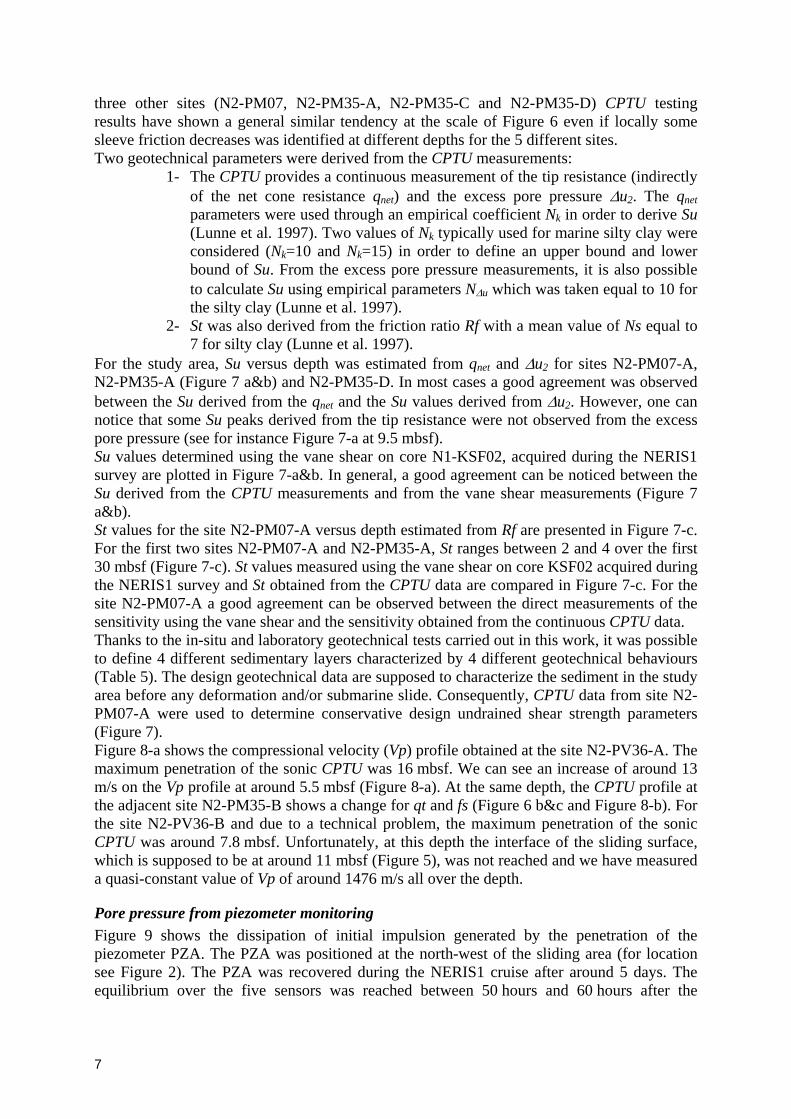
For the study area, Su versus depth was estimated from q and Δunet 2 for sites N2-PM07-A, N2-PM35-A (Figure 7 a&b) and N2-PM35-D. In most cases a good agreement was observed between the Su derived from the qnet and the Su values derived from Δu2. However, one can notice that some Su peaks derived from the tip resistance were not observed from the excess pore pressure (see for instance Figure 7-a at 9.5 mbsf). Su values determined using the vane shear on core N1-KSF02, acquired during the NERIS1 survey are plotted in Figure 7-a&b. In general, a good agreement can be noticed between the Su derived from the CPTU measurements and from the vane shear measurements (Figure 7 a&b). St values for the site N2-PM07-A versus depth estimated from Rf are presented in Figure 7-c. For the first two sites N2-PM07-A and N2-PM35-A, St ranges between 2 and 4 over the first 30 mbsf (Figure 7-c). St values measured using the vane shear on core KSF02 acquired during the NERIS1 survey and St obtained from the CPTU data are compared in Figure 7-c. For the site N2-PM07-A a good agreement can be observed between the direct measurements of the sensitivity using the vane shear and the sensitivity obtained from the continuous CPTU data. Thanks to the in-situ and laboratory geotechnical tests carried out in this work, it was possible to define 4 different sedimentary layers characterized by 4 different geotechnical behaviours (Table 5). The design geotechnical data are supposed to characterize the sediment in the study area before any deformation and/or submarine slide. Consequently, CPTU data from site N2-PM07-A were used to determine conservative design undrained shear strength parameters (Figure 7). Figure 8-a shows the compressional velocity (Vp) profile obtained at the site N2-PV36-A. The maximum penetration of the sonic CPTU was 16 mbsf. We can see an increase of around 13 m/s on the Vp profile at around 5.5 mbsf (Figure 8-a). At the same depth, the CPTU profile at the adjacent site N2-PM35-B shows a change for qt and fs (Figure 6 b&c and Figure 8-b). For the site N2-PV36-B and due to a technical problem, the maximum penetration of the sonic CPTU was around 7.8 mbsf. Unfortunately, at this depth the interface of the sliding surface, which is supposed to be at around 11 mbsf (Figure 5), was not reached and we have measured a quasi-constant value of Vp of around 1476 m/s all over the depth.
Pore pressure from piezometer monitoring Figure 9 shows the dissipation of initial impulsion generated by the penetration of the piezometer PZA. The PZA was positioned at the north-west of the sliding area (for location see Figure 2). The PZA was recovered during the NERIS1 cruise after around 5 days. The equilibrium over the five sensors was reached between 50 hours and 60 hours after the
7
installation of the piezometer. In Figure 9-b is presented the pore pressure gradient, which shows a transient regime with a downward hydraulic gradient (between -0.3 and -0.9 kPa/m). The PZB was positioned just behind the sliding area (for location see Figure 2). The length of the piezometer was equal to 10.10 m and it was equipped with five sensors (at –1.1 m, –4.1 m, -5.6 m, -8.6 m and –10.10 m). The equilibrium over the five sensors was reached between 50 hours and 60 hours after the installation of the piezometer. The pore pressure gradient determined from the site PZB shows a transient regime with a small upward hydraulic gradient (between 0.25 and 0.3 kPa/m). Around 8 days after the installation of PZB, the five sensors had recorded a decrease of the pore pressure between 7 and 9 kPa. It is important to mention that the sensors and the acquisition cards of the five sensors are electronically independent which means that this sudden decrease of the pore pressure is true and is not related to a technical problem.
Figure 2The PZR was positioned in the scar of the sliding area ( ). The length of the piezometer was equal to 10.30 m and it was equipped by 4 sensors (at –1.1 m, –4.1 m, -7.1 m and -10.1 m). Unfortunately only two sensors (at –1.1 m and -10.1 m) have recorded the pore pressure variation. In this site, the equilibrium was not reached after around 1 year of data acquisition showing a continuous small changes of the hydraulic regime. A sudden pore pressure decreases (around 0.5 kPa) was also recorded at this site and corresponds approximately (2 days later) to the beginning of the sudden decrease of the pore pressure recorded with PZB. The pore pressure gradient from PZR shows a transient regime with a small downward hydraulic gradient (between -0.3 kPa and –0.35 kPa/m).
8
Data interpretation, modelling results and discussion
Internal architecture of the sliding area The CPTU testing is often used to characterize the mechanical properties of the sediment but it can be also used to identify shear zones along which the upper mass sediment is moving in a slope failure zone. Indeed, Leroueil et al. (1995) and Demers et al. (1999) have demonstrate in zones of high shearing where the clay was remoulded, both the penetration tip resistance and the penetration pore pressure were low relative to the undistributed clay at the same depth. These observations were confirmed by Mahmoud et al. (2000) showing that the CPTU can be used to identify softened zones within a marine clay deposit. Due to the very soft nature of the marine sediment in this study area, we have observed that the shear zone characterized by the presence of remoulded sediment is more pronounced on the fs profile (measured over 150 cm2 of friction sleeve surface) than on the qt profile (measured over 10 cm2 of tip surface) (Figure 6 a&b). Figure 10 shows the sleeve friction as a function of depth for the sites N2-PM07-A (Figure 10-a), N2-PM35-A (Figure 10-b), N2-PM35-B (Figure 10-c), N2-PM35-C (Figure 10-d) and N2-PM35-D (Figure 10-e). From Figure 10-d and Figure 10-e, one can see clearly the upper several meters where the sediment is characterized by a very low sleeve friction. This very low friction is probably the result of sediment flow coming from the area where the slide scar is located (i.e. upslope). On the other hand, zones of high shearing where the sediment was probably remoulded due to mass sediment movement and creeping is clearly characterized by a decrease of the sleeve friction with respect to the surrounding sediment (Figure 10). The dashed line presented in Figure 10 (b, c, d and e) defines the base of this decrease in sleeve friction, which corresponds to the base of the shear zone. On the other hand, the Vp profile obtained at the site N2-PV36-A (equivalent to PM-35-B) has shown at the same depth below the seafloor (at around 5.5 mbsf) and for the same thickness a clear decrease of the Vp values (Figure 8-a). The sudden decrease of sleeve friction and the P-wave velocities fits well with the area characterized by chaotic reflectors from the chirp profile (CH04 - Figure 5). Geotechnical data and seismic profile make it possible to draw a sketch of the internal architecture of the sliding area (Figure 11). The sliding area is characterized by a shear zone (between 3 and 5 m thickness) pinching-out at the level of the slope-failure scar (Figure 11). The upper sediment flow coming from the slide scar was also identified by CPTU measurements and the chirp profile. Upper faults, which take place in the upper sedimentary layers below the sliding area obtained from the chirp profile (Figure 5), are added to Figure 11.
Faults and regional structure The study area is located at the frontier of the present day syn-sedimentary compressional zone within the Niger Delta where according to Damuth (1994) sediments are being thrust and squeezed upward and outward onto the seafloor. Figure 12-a shows a vertical section through the 3D seismic cube beneath the submarine slope failure observed in Figure 2 (cross section A-A in Figure 2). The structural style observed on the 3D seismic profile of Figure 2 confirms that this is a zone of compressional stress. The interpreted profile obtained from the 3D seismic cube and presented in Figure 12-b shows an uplift of the sedimentary bodies, which increases with the depth below the seafloor. Two faults were also pointed out in Figure 12-b confirming the existence of a lateral followed by an upward tectonic forces. Deposition of bedded sediments can be observed to the south-west of the headwall scar (red lines in Figure 12-b). The two main faults detected from the 3D seismic data and presented in Figure 12-b match well with shallow faults identified from deep-towed chirp profile (Figure 11).
9
Figure 13 shows a correlation map obtained from the 3D seismic data of a deep horizon integrating the data over a window of 128 ms TWT (Le Chevalier, 2002). The 3 slide scars identified from the bathymetry (Figure 1) are also added to Figure 13 where one can clearly notice the alignment of the 3 scars with the border of the regional faults. The 3D seismic profile presented in Figure 12 and the correlation map presented in Figure 13 show that the studied submarine landslide coincides with known anticlines and faults that generate compressional strengths in the upper sedimentary layers generating an uplift of the upper sedimentary bodies. The expression of those faults at a regional scale obtained from the 3D seismic data and at the local scale of the upper deformed sediment obtained from the chirp profile is probably the expression of a high concentration of the regional compressive strengths.
Evaluation of the compressional stress and the sedimentary upward movement from 3D seismic data and cylindrical cavity expansion theory In order to quantify the upward movement generated by the compressional structure, the initial geometry of the sediment bodies or reflectors was assumed to be tangent to reflectors at the toe of the slope failure area (Figure 14-a). We are aware of the fact that sedimentation forming the upper layers has occurred over deformed geometry and consequently reference profiles cannot be always considered linear. However, from the available data, we are not able to determine the evolution of the deformation of the different layers. Therefore, the vertical displacement of the sediment layers is overestimated and in addition subsidence of the sediment layers and its evolution with time is not considered. Figure 14-b shows the vertical displacement of the reflectors, which increase with depth below the seafloor. In order to evaluate the compressional stress at the origin of the upward movement of the sediment strata, the effect of the regional compressional structure was assimilated locally to the expansion of a deep cylindrical cavity (Figure 12-b). The cavity expansion is a simple theory that has found many applications in geotechnical engineering. Analytical solution of spherical/cylindrical cavity in a soil modelled as elastic, non-linear elastic or elasto-plastic are now available in literature (Cao et al., 2002). Due to the lack of mechanical parameters of deep sediment in the study area, the used approach consists in finding an analytical solution that fits with the observed vertical displacements presented in Figure 15-a. We consider a simple case where the sediment is homogenous, elastic and isotropic. The analytical solution of the cylindrical cavity expansion must obey the following two conditions:
a) the limit conditions concerning the null radial stress at the seafloor and the geometry of the deep cavity (Figure 12-b).
b) the radial displacements presented in Figure 15-a. USince the displacement field is irrotational around the cylindrical cavity, the Navier-Stocks
equation leads to: ( ) cstUdiv = [ 3 ]
UThe strain tension ε is related to the displacement field by the following equation :
10
( ) ( )[ ]⎥⎥⎥⎥⎥⎥
⎦
⎤
⎢⎢⎢⎢⎢⎢
⎣
⎡
=⎟⎠⎞⎜
⎝⎛ +=
dzdv
ru
drdu
UgradUgradT
00
00
00
21ε [ 4 ]
where u is the radial displacement and v is the displacement along the z axis which is normal to the plane of Figure 14. For elastic and isotropic sediment, the stress tensor σ is related to the strain tensor ε by the following equation:
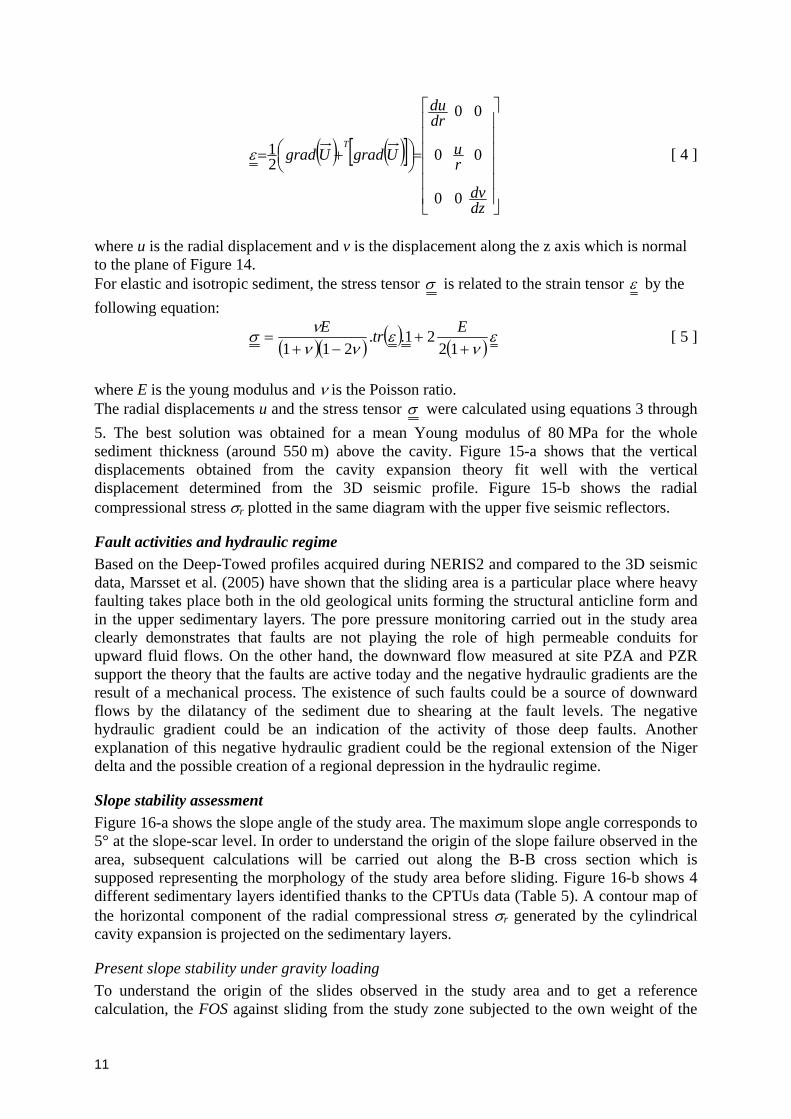
( )( ) ( ) ( )ενε
νννσ
++
−+=
1221..
211EtrE [ 5 ]
where E is the young modulus and ν is the Poisson ratio. The radial displacements u and the stress tensor σ were calculated using equations 3 through 5. The best solution was obtained for a mean Young modulus of 80 MPa for the whole sediment thickness (around 550 m) above the cavity. Figure 15-a shows that the vertical displacements obtained from the cavity expansion theory fit well with the vertical displacement determined from the 3D seismic profile. Figure 15-b shows the radial compressional stress σ plotted in the same diagram with the upper five seismic reflectors. r
Fault activities and hydraulic regime Based on the Deep-Towed profiles acquired during NERIS2 and compared to the 3D seismic data, Marsset et al. (2005) have shown that the sliding area is a particular place where heavy faulting takes place both in the old geological units forming the structural anticline form and in the upper sedimentary layers. The pore pressure monitoring carried out in the study area clearly demonstrates that faults are not playing the role of high permeable conduits for upward fluid flows. On the other hand, the downward flow measured at site PZA and PZR support the theory that the faults are active today and the negative hydraulic gradients are the result of a mechanical process. The existence of such faults could be a source of downward flows by the dilatancy of the sediment due to shearing at the fault levels. The negative hydraulic gradient could be an indication of the activity of those deep faults. Another explanation of this negative hydraulic gradient could be the regional extension of the Niger delta and the possible creation of a regional depression in the hydraulic regime.
Slope stability assessment Figure 16-a shows the slope angle of the study area. The maximum slope angle corresponds to 5° at the slope-scar level. In order to understand the origin of the slope failure observed in the area, subsequent calculations will be carried out along the B-B cross section which is supposed representing the morphology of the study area before sliding. Figure 16-b shows 4 different sedimentary layers identified thanks to the CPTUs data (Table 5). A contour map of the horizontal component of the radial compressional stress σr generated by the cylindrical cavity expansion is projected on the sedimentary layers.
Present slope stability under gravity loading To understand the origin of the slides observed in the study area and to get a reference calculation, the FOS against sliding from the study zone subjected to the own weight of the
11
sediment is considered. The geotechnical characterization of the area showing the 3D geometry of sediment units and their geotechnical properties previously identified (Figure 16 and Table 5) are used. When sediment is sheared under applied stress, excess pore pressure is produced that may (drained conditions) or may not (undrained conditions) escape depending on the permeability of the sediment and the time available. That is why, in the following, and even for slow loading scenario, stability analyses include both undrained strength analysis (fast loading) and effective stress analysis (drained conditions), with a special focus on the analysis type giving the lowest FOS. The calculation was carried out under gravity loading by considering only the unit weight of the sediment and under drained and undrained condition. Optimisation procedures described by Sultan et al. (2006) were performed in order to obtain the minimum FOS with the most critical failure surface. 5000 step calculations were necessary to obtain the most critical failure surface in the study zone. The output in Figure 17-a shows the projection of the most critical failure surface on the bathymetry of the study area under undrained conditions. The calculation has confirmed the stable state of the area where the most critical failure surface has a FOS of 2.62 under undrained conditions and around 15 under drained conditions. Figure 17-b and c show the shape of the critical failure surface respectively in the x-y and x-z planes with two cross sections NL (Neutral Line: corresponds to the axis of symmetry in the x-y plane) and AL (Arbitrary Line). The maximum depth below the seafloor of the critical surface along the Neutral Line is around 23 m. The deformed mesh presented in Figure 17-b was derived from the velocity field. Only the direction and the rate of the movement of the failure surfaces could be considered as an output of the modelling results, the amplitude of each velocity vector is relative to the supposed virtual plastic velocity applied at the first wedge of NL. The calculation of the FOS based on geotechnical properties and physical parameters of the sediment and on the morphology of the area allows us to conclude that in the absence of external factors, the study area from the Nigerian slope is presently safe. A second calculation was carried out under drained conditions by considering the effect of an excess pore-pressure generated by an upward fluid flow on the slope stability. Indeed, in the study area, different sedimentary features such as pockmarks, which are probably associated with fluid flow, can be observed in the Western part of the study area (see Figure 1). In the proposed analysis, the fluid flow as an external mechanism is considered through the “rate of external work” of the work-energy balance equation. The rate of external work done by the equivalent pore-water force over the virtual plastic velocity V* is equal to T*V*. An excess pore pressure equivalent to 90 % of the vertical effective stress was needed to generate a failure surface equivalent to the observed one. Remoulded sediment layers from the sliding area identified by in-situ geotechnical data and chirp profile shows that the slope failure is relatively recent and that probably the external mechanism at the origin of the sediment failure is still active. On the other hand, in-situ monitoring of the pore pressure did not show any high excess pore pressure which eliminate as discussed previously the scenario of an upward fluid flow as a triggering mechanism of the observed sediment failures in the study area.
Effect of the compressional structure on the present slope stability As was discussed before, seismic profiles obtained from the 3D seismic cube shows a deformation of the sedimentary bodies. The regional compressive structure is probably at the origin of the observed deformation and the slope failures observed in the study area. In this paragraph, the horizontal component of the radial compressional stress σ presented in r Figure 16–b, which is a driving force for slope instability, is considered as a trigger mechanism. The
12
geotechnical characterization of the area showing the 3D geometry of sediment units and their geotechnical properties previously identified (Figure 16 and Table 5) are used. In this paragraph, calculation was carried out under drained and undrained conditions and by considering the radial compressional stress generated by the compressive structure as an external mechanism (Figure 16-b). Optimisation procedures (Sultan et al. 2006) were performed in order to obtain the minimum FOS with the most critical failure surface. 5000 step calculations were necessary to obtain the most critical failure surface in the study zone. The output in Figure 18-a shows the projection of the critical failure surface under undrained conditions on the bathymetry of the study area. The calculation shows the sensitivity of the slope to the regional compressive structure where the FOS drops down to 1.02. Figure 18-b and c show the shape of the critical failure surface respectively in the x-y and x-z planes with two cross sections NL and AL. The maximum depth below the seafloor of the critical surface along the Neutral Line is around 21 m. The deformed mesh presented in Figure 18-b was derived from the velocity field. Although the compressive structure has generated the failure of the slope, comparison between the predicted failure surface and the observed one shows a good agreement concerning the position the depth and the width of the slope failure but not the length (Figure 18). While the length of the observed failure surface is around 1.1 km (from bathymetric map - Figure 1 and shear zone geometry - Figure 11) the predicted one is around 0.4 km. Under drained conditions the FOS was around 7. The predicted failure surface is positioned above the influence area of the compressional structure presented in Figure 16-b and it depends strongly on the geometry of the cylindrical cavity expansion presented in Figure 12-b. Substituting the effect of the regional compressive structure by a larger cylindrical cavity will certainly generate a longer failure surface. Figure 18-a shows the projection on the bathymetry of the study area of another failure surface with a shape and geometry comparable to the observed one. This failure surface is characterised by a FOS of 1.62. As it was discussed before, the width of the influence area of the compressional structure presented in Figure 16-b is at the origin of the relatively high FOS. Any increase of the radius of the cavity expansion area will cause a decrease of the FOS until failure. However, due to the lack of any data concerning the stress distribution in the upper sedimentary layers generated by the compressive structures the used approach remains qualitative but it demonstrates clearly that compressive structure in the Niger delta could be a triggering mechanism of the observed submarine slope failures. However, the gentle slope of the studied area cannot explain the post failure process and the relative important movement of the sediment flow as shown in Figure 1 and Figure 2. This sediment flow could be a result of a lateral spreading due to local slope steepness generated by a localised uplift of the surface strata.
Conclusion The study area, offshore Nigeria, is located in the south compressional zone within the Niger Delta, which is characterized by imbricate thrust structure (Danuth 1994). Despite the low mean slope angle (around 2°), bathymetry data from the study area have shown the existence of several submarine landslides, which coincide with known anticlines and faults in the area. In our study, we have focused on a submarine slide occurring in water depths ranging between 1690 and 1750 m. Headwall scars, internal architecture and associated deposits have been characterised using a combination of 3D seismic data, near-bottom echosounder seismic profiles, kullenberg cores and in-situ geotechnical measurements. The sliding area is characterized by a shear zone along which the upper mass sediment is moving in the slope failure zone (between 3 m and 5 m thickness) and it is pinching-out at the level of the slope-
13
failure scar (Figure 11). This shear zone probably corresponds to the failure interface where shearing, dilatancy and possible creeping have completely remoulded the sediment. Upper sediment flow coming from the slide scar was also identified by CPTU measurements and seismic data. The 3D seismic profile and the correlation map show that the studied submarine landslide coincides with known anticlines and faults that generate compressional strengths in the upper sedimentary layers generating an uplift of the upper sedimentary bodies. The expression of those faults at a regional scale and at the local scale of the upper deformed sediment is probably the expression of a high concentration of the regional compressive strengths. The pore pressure monitoring carried out in the study area clearly demonstrates that faults are not playing the role of high permeable conduits for upward fluid flows. On the other hand, the downward flow measured at site PZA and PZR support the theory that the faults are active today and the negative hydraulic gradients are the result of a mechanical process (dilatancy generated by faults movement). Another explanation of this negative hydraulic gradient could be the regional extension of the Niger delta and the possible creation of a regional depression in the hydraulic regime. Cylindrical cavity expansion theory together with seismic reflector geometries obtained from 3D seismic data were used to simulate the compressional structure movements and to evaluate the strength generated within the upper sediment layers. In order to identify the triggering mechanism of the observed landslides, a three-dimensional slope stability model based on the upper bound theorem of plasticity was used (Sultan et al., 2006). Slope stability assessment has demonstrated that compressive structure could be a triggering mechanism of the observed slope failures in the study area.
Acknowledgement: The support by officers and crew during NERIS1 and NERIS2 cruises is greatly appreciated, as is the dedication of the PENFELD staff during the NERIS2 cruise. The authors acknowledge Didier Drapeau for useful suggestions and remarks. Constructive comments by Roger Urgeles and an anonymous reviewer helped improve the manuscript significantly.
14
References Brooks, J.M., Bryant, W.R., Bernard, B.B., Cameron, N.R., 2000. The nature of gas hydrates on the Nigerian continental slope. Gas Hydrates: Challenges for the Future, Annals of the New York Academy of Sciences, 912, 2000, pp. 76– 93. Bugge, T., Befring, S., Belderson, R.H., Eidvin, T., Jansen, E., Kenyon, N.H., Sejrup, H.P., 1987. A giant three-stage submarine slide off Norway. Geo-Marine Letters. 7, 191-198. Burke, K., 1972. Longshore drift, submarine canyons, and submarine fans in development of Niger Delta. Bull. Am. Assoc. Petrol. Geol. 56 (10), 1975-1983. Canals, M., Lastras, G., Urgeles, R., Casamor, J.L., Mienert, J., Cattaneo, A., De Batist, M., Haflidason, H., Imbo, Y., Laberg, J.S., Locat, J., Long, D., Longva, O., Masson, D., Sultan, N., Trincardi, F., Bryn, P., 2004. Slope failure dynamics and impacts from seafloor and sub seafloor shallow geophysical data: an overview. Mar. Geol. 213, 9 – 72. Cao, L.F., Chang, M.-F., 2002. Analysis of undrained cavity expansion in elasto-plastic soils with non-linear elasticity. International Journal for Numerical and Analytical Methods in Geomechanics. 26, 25-52. Chen, Z., Wang, X., Haberfield, C., Yin, J., Wang, Y., 2001-a. A three-dimensional slope stability analysis method using the upper bound theorem, Part I: Theory and methods. International Journal of Rock Mechanics and Mining Sciences. 38, 369-378. Chen, Z., Wang, J., Yin, J., Wang, Y., Haberfield, C., 2001-b. A three-dimensional slope stability analysis method using the upper bound theorem, Part II: Numerical approaches, applications and extensions. International Journal of Rock Mechanics and Mining Sciences. 38, 379–397. Cohen, H.A, McClay, K., 1996. Sedimentation and shale tectonics of the northwestern Niger Delta front. Marine and Petroleum Geology. 13, 313-328. Damuth, J. E., 1994, Neogene gravity tectonics and depositional processes on the deep Niger Delta continental margin: Marine and Petroleum Geology. 11(3), 320-346. Delteil, J.R., Valery, P., Monatdert, L., Fondeur, C., Patriat, P., Mascle, J., 1974. Continental margin in the northern part of the Gulf of Guinee, in: Burk, C.A, Drake, C.L. (Eds.), The Geology of Continental Margins. Springer-Verlag, pp. 297-331. Demers, D., Leroueil, S., d’Astous, J. 1999. Investigation of a landslide in Maskinongé, Québec. Canadian Geotechnical Journal. 36, 1001–1014. Deptuck, M.E., Steffens, G.S., Barton, M.D., Pirmez, C., 2003. Architecture and evolution of upper fan channel belts on the Niger Delta slope and in the Arabian Sea. Marine and Petroleum Geology. 20, 649–676. Emery, K. O., Uchupi, E., Phillips, J., Bowin, C., Mascle, J., 1975. Continental Margin off Western Africa: Angola to Sierra Leona. AAPG Bulletin. 59, 2209-2265.
15
Evamy, B.D., Haremboure, J., Kamerling, P., Knaap, W. A., Molloy, F.A., Rowlands, P.H., 1978. Hydrocarbon habitat of tertiary Niger Delta. AAPG Bulletin. 62, 1–39. Germaine, J.T., Ladd, C.C., 1990. Triaxial testing of saturated cohesive soils. ASTM. 977, 421-459. Graue, K., 2000. Mud volcanoes in deepwater Nigeria. Marine and Petroleum Geology. 17, 959-974. Hospers, J., 1965, Gravity field and structure of the Niger Delta, Nigeria, West Africa. Geological Society of American Bulletin. 76, 407-422. Hovland, M., Gallagher, J.W., Clennell, M.B., Kekvam, K., 1997. Gas hydrate and free gas volumes in marine sediments: example from the Niger Delta front. Marine and Petroleum Geology. 14 (3), 245-255. ISSMGE International Society of Soil Mechanics and Geotechnical Engineering, 1999. “International Reference Test Procedure for the Cone Penetration Test (CPT) and the Cone Penetration Test with Pore Pressure (CPTU)”, Report of the ISSMGE Technical Committee 16 on Ground Property Characterisation from In-Situ Testing, Proceedings of the Twelfth European Conference on Soil Mechanics and Geotechnical Engineering, Amsterdam, Edited by Barends et al., 3, pp. 2195-2222. Knox, G. J., Omatsola, E. M., 1989. Development of the Cenozoic Niger Delta in terms of the "Escalator Regression" model and impact on hydrocarbon distribution, in Van der Linden, W. J. M., Cloetingh, S. A. P., Kaasschieter, J. P. K., Van der Graaf, W. J. E., Vandenberghe, J., Van der Gun, J. A. M. (Eds.), Symposium Coastal Lowlands, Geology and Geotechnology. Kluwer Academic Publishers, Dordrecht, pp. 181-202. Le Chevalier, V., 2002. Application of seismic attribute for deep offshore seabed features characterization: preliminary results for the NERIS project, internal rapport, ENSPM. Lehner, P., De Ruiter, P.A.C., 1977. Structural history of Atlantic Margin of Africa: American Association of Petroleum Geologists Bulletin. 61, 961-981. Leroueil, S., Demers, D., La Rochelle, P., Martel, G., Virely, D., 1995. Practical use of the piezocone in eastern Canada clays, in: CPT’95, Proceedings of the International Symposium on Cone Penetration Testing, pp. 515–521. Locat, J., and Lee, H.J., 2002. Submarine landslides: Advances and challenges: Canadian Geotechnical Journal. 39, 193-212. Locat, J., Mienert, J., eds., 2003. Submarine mass movements and their consequences, Kluwer Acad. Publ., Dordrecth, The Nederlands, 540 pp. Lunne T., Robertson P.K., Powell J.J.M., 1997. Cone penetration testing in geotechnical practice, Blackie Academic & Professional, London, 312 pp.
16
Mahmoud, M., Woeller, D., Robertson, P.K., 2000. Detection of shear zones in a natural clay slope using the cone penetration test and continuous dynamic sampling. Can. Geotech. J. 37(3), 652-661. Marsset, B., Le Gall, Y., Derrien, M., Didailler, S., Regnault, J.P., 2004. Deep-towed high-resolution seismic surveying, in: SeaTechWeek conference, Brest. Marsset T., Marsset B., Vagner P., Sultan N., Voisset M., Cauquil E., 2005. Geohazard investigation on the Niger continental slope: New insights from near bottom geophysics. Ifremer/Total internal report 03/1.214.722. Mascle, J., Bornhold, B. D., Renard V., 1973. Diapiric structures off Niger delta. Amer. Assoc. Petrol. Geol. Bull. 57(9), 1672-1678. Meunier, J., Sultan, N., Jegou, P, Harmegnies F., 2004. First tests of Penfeld: a new seabed penetrometer,in: Proceedings of The Fourteenth International Offshore and Polar Engineering Conference, pp. 338-345. Michalowski, R. L., 1995. Slope stability analysis: a kinematical approach. Géotechnique. 45(2), 283-293. Morgenstern, N. R., Price, V. E., 1965. The analysis of the stability of generalised slip surfaces. Géotechnique. 15, 79-93. Mulder, T., Cochonat, P., 1996. Classification of offshore mass movements. Journal of Sedimentary Research. 66, 43-57. Ramberg, H., 1981. Gravity, deformation and the earth's crust, Academic Press, London, 452 pp. Schultheiss, P.J., McPhail, S.D., 1986. Direct indication of pore water advection from pore pressure measurements in the Madeira Abyssal Plain sediments. Nature. 320, 348–350. Sultan, N., Cochonat, P., Canals, M., Cattaneo, A., Dennielou, B., Haflidason, H., Laberg, J.S., Long, D., Mienert, J., Trincardi, F., Urgeles, R., Vorren, T., Wilson, C., 2004. Triggering mechanisms of slope instability processes and sediment failures on continental margins: a geotechnical approach. Mar. Geol. 213, 291– 321. Sultan, N., Gaudin, M., Berné, S., Canals, M., Urgeles, R., in press. Analysis of slope failures in canyon heads: example from the gulf of lions. Journal of Geophysical research. Thomas, F., Rebours, B., Nauroy, J-F, Meunier, J., 2005. Mineralogical characteristics of the Gulf of Guinea deep water sediments, in: ISFOG, Australia, pp. 1055-1061. Urgeles, R., Leynaud, D., Lastras, G., Canals, M., Mienert, J., 2006. Back-analysis and failure mechanisms of a large submarine slide on the Ebro slope, NW Mediterranean. Marine Geology. 226, 185-206. Weber, K.J., Daukoru, E., 1975. Petroleum geology of the Niger Delta, in: Ninth World Petroleum Congress Proceedings, pp. 209-221.
17

Whiteman, A., 1982. Nigeria: Its Petroleum Geology, Resources and Potential, Graham and Trotman, London, 394 pp. Yu, H.S., Salgado, R., Sloan, S.W., Kim, J.M., 1998, Limit analysis versus limit equilibrium for slope stability. J. Geotech. and Geoenvir. Engrg. 124(1), 1-11.
18
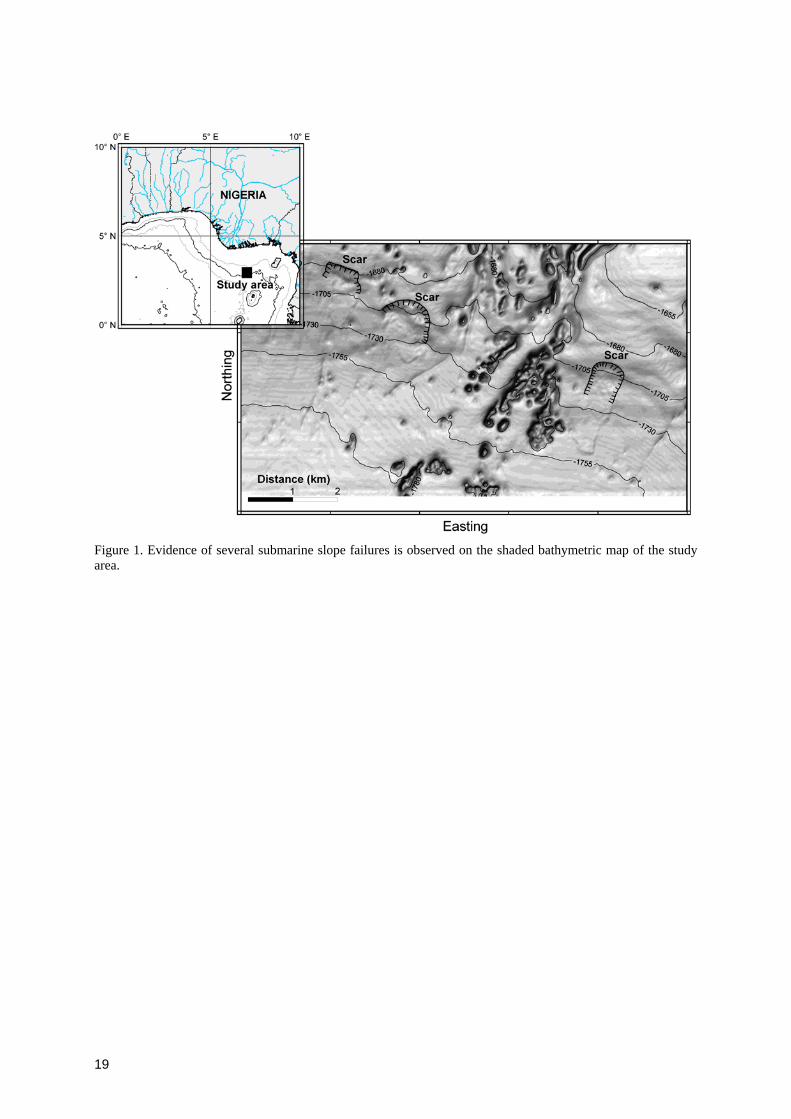
Figure 1. Evidence of several submarine slope failures is observed on the shaded bathymetric map of the study area.
19
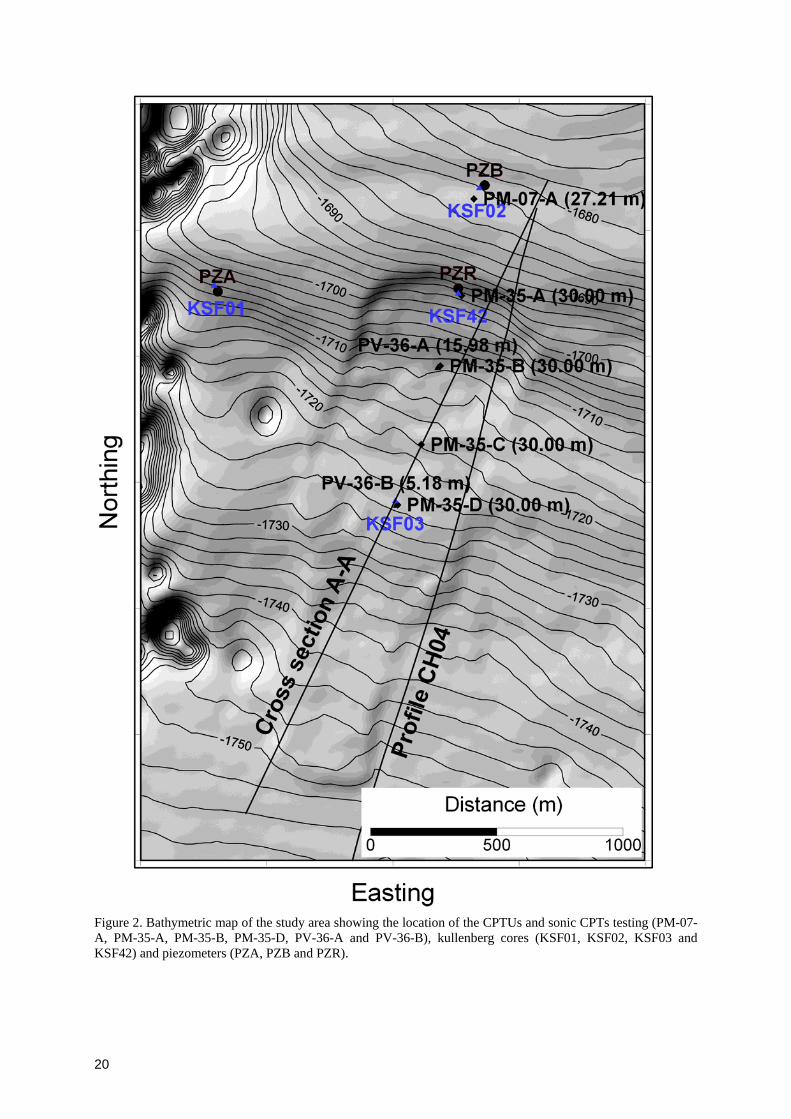
Figure 2. Bathymetric map of the study area showing the location of the CPTUs and sonic CPTs testing (PM-07-A, PM-35-A, PM-35-B, PM-35-D, PV-36-A and PV-36-B), kullenberg cores (KSF01, KSF02, KSF03 and KSF42) and piezometers (PZA, PZB and PZR).
20
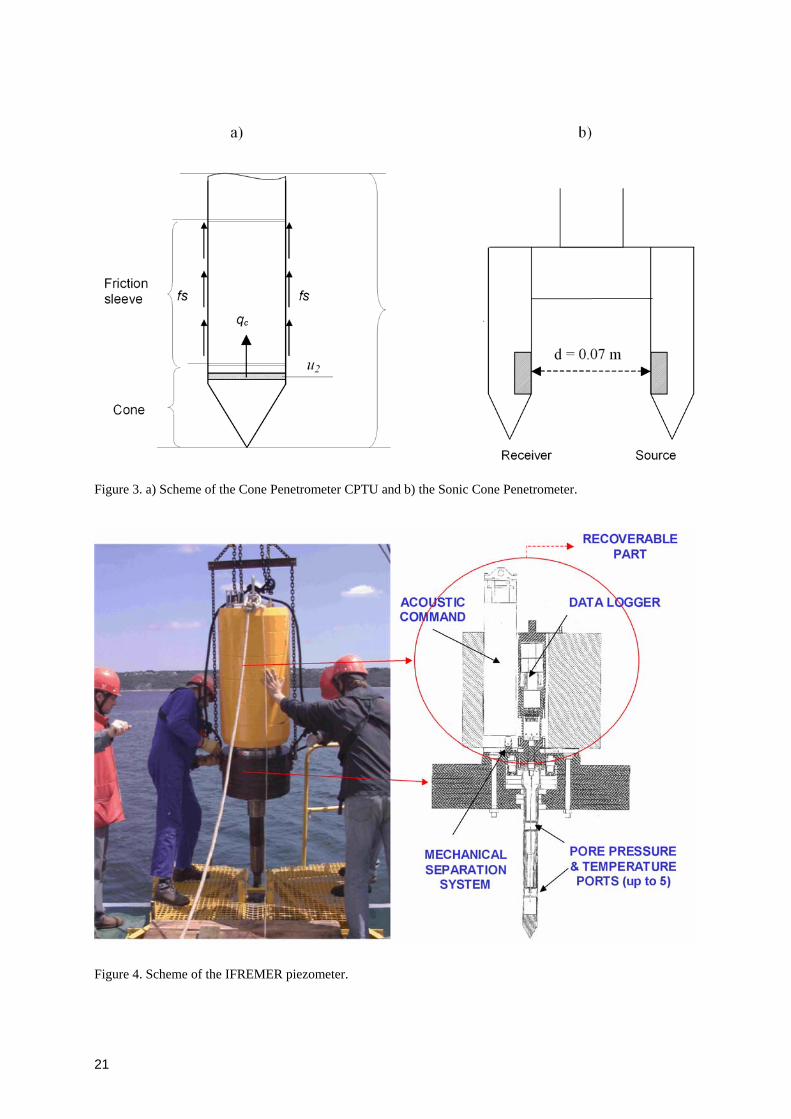
Figure 3. a) Scheme of the Cone Penetrometer CPTU and b) the Sonic Cone Penetrometer.
Figure 4. Scheme of the IFREMER piezometer.
21
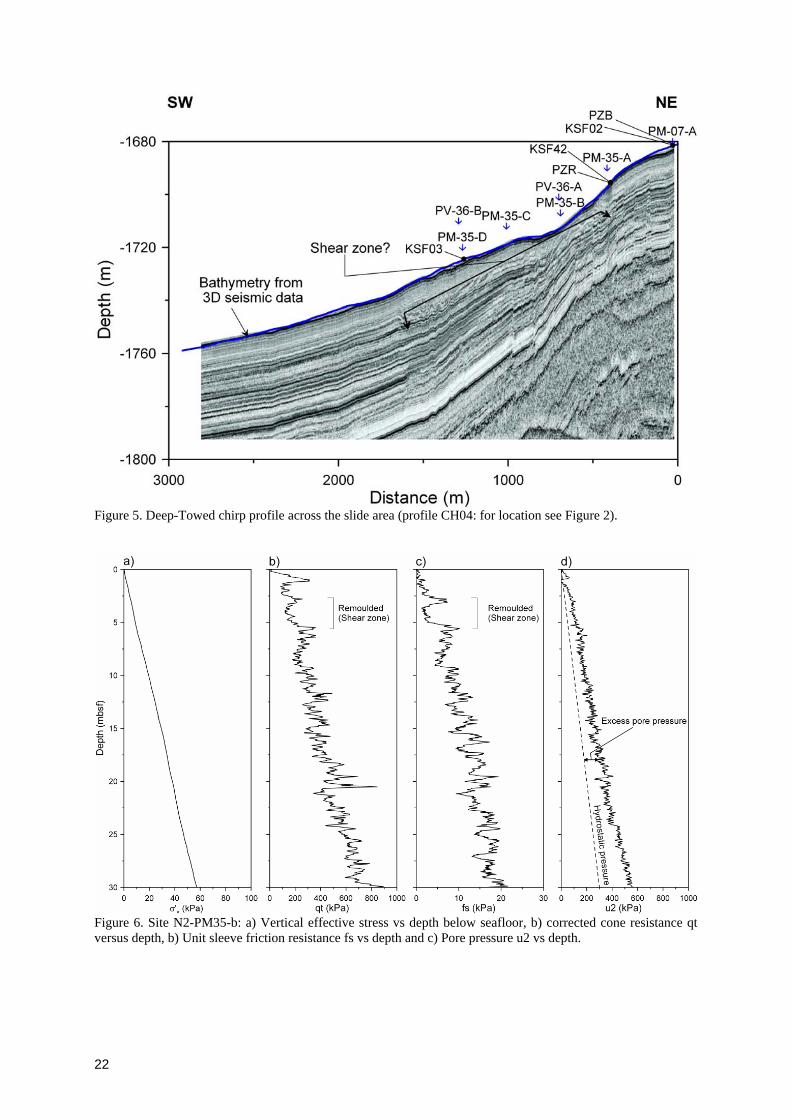
Figure 5. Deep-Towed chirp profile across the slide area (profile CH04: for location see Figure 2).
Figure 6. Site N2-PM35-b: a) Vertical effective stress vs depth below seafloor, b) corrected cone resistance qt versus depth, b) Unit sleeve friction resistance fs vs depth and c) Pore pressure u2 vs depth.
22
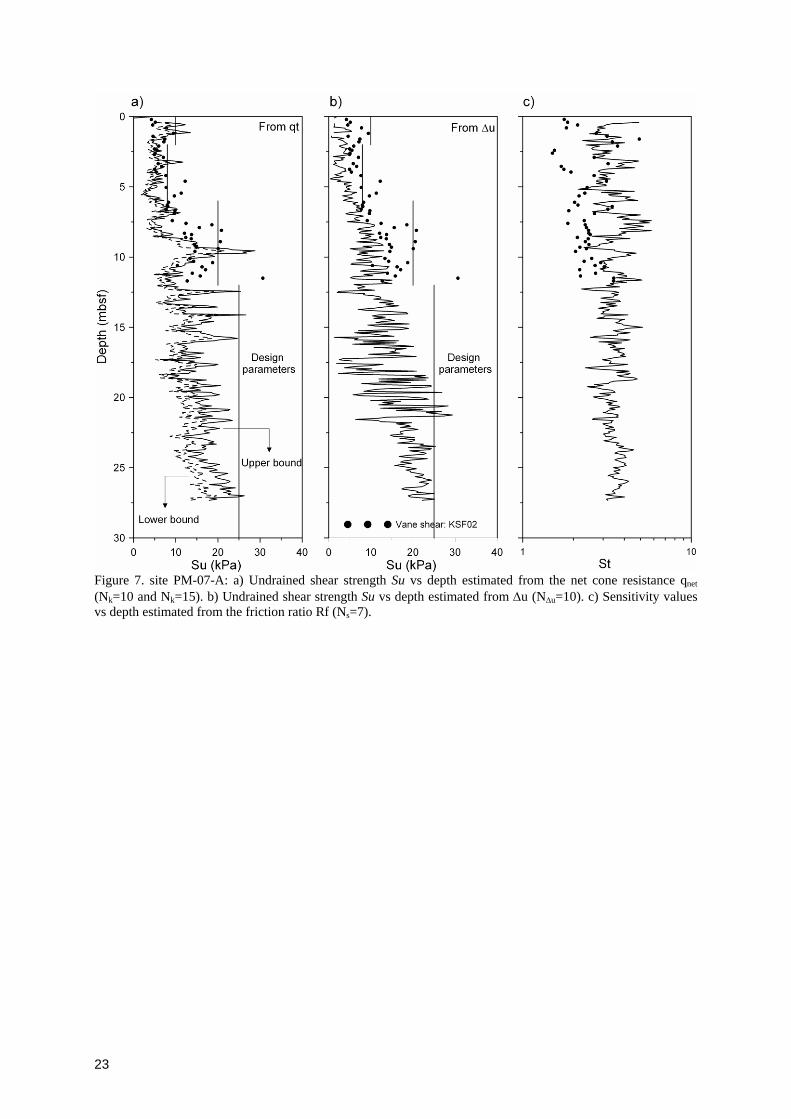
Figure 7. site PM-07-A: a) Undrained shear strength Su vs depth estimated from the net cone resistance qnet (Nk=10 and Nk=15). b) Undrained shear strength Su vs depth estimated from Δu (NΔu=10). c) Sensitivity values vs depth estimated from the friction ratio Rf (Ns=7).
23
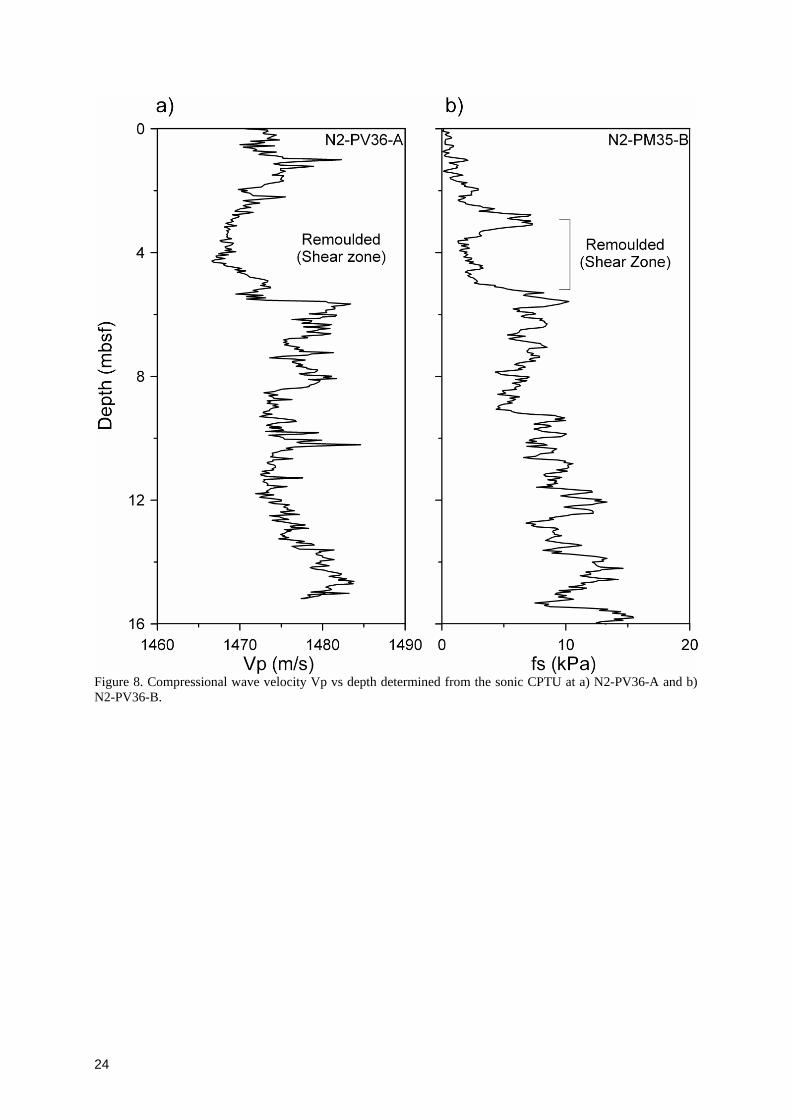
Figure 8. Compressional wave velocity Vp vs depth determined from the sonic CPTU at a) N2-PV36-A and b) N2-PV36-B.
24
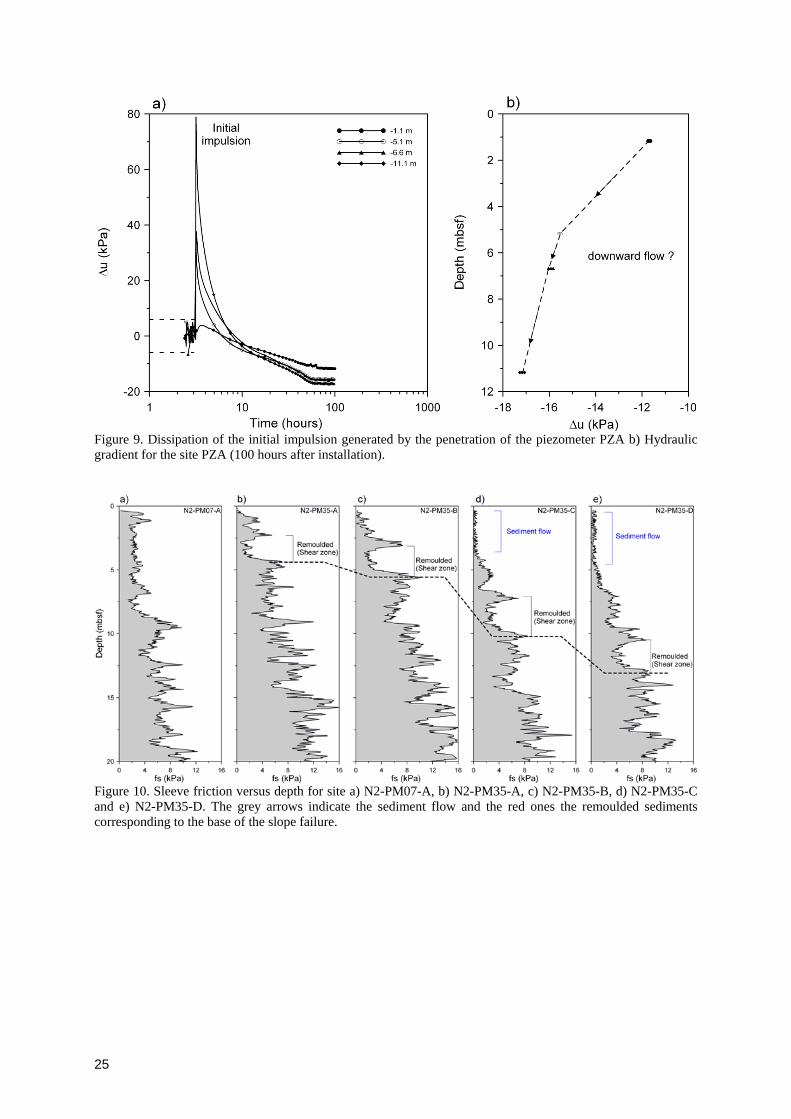
Figure 9. Dissipation of the initial impulsion generated by the penetration of the piezometer PZA b) Hydraulic gradient for the site PZA (100 hours after installation).
Figure 10. Sleeve friction versus depth for site a) N2-PM07-A, b) N2-PM35-A, c) N2-PM35-B, d) N2-PM35-C and e) N2-PM35-D. The grey arrows indicate the sediment flow and the red ones the remoulded sediments corresponding to the base of the slope failure.
25
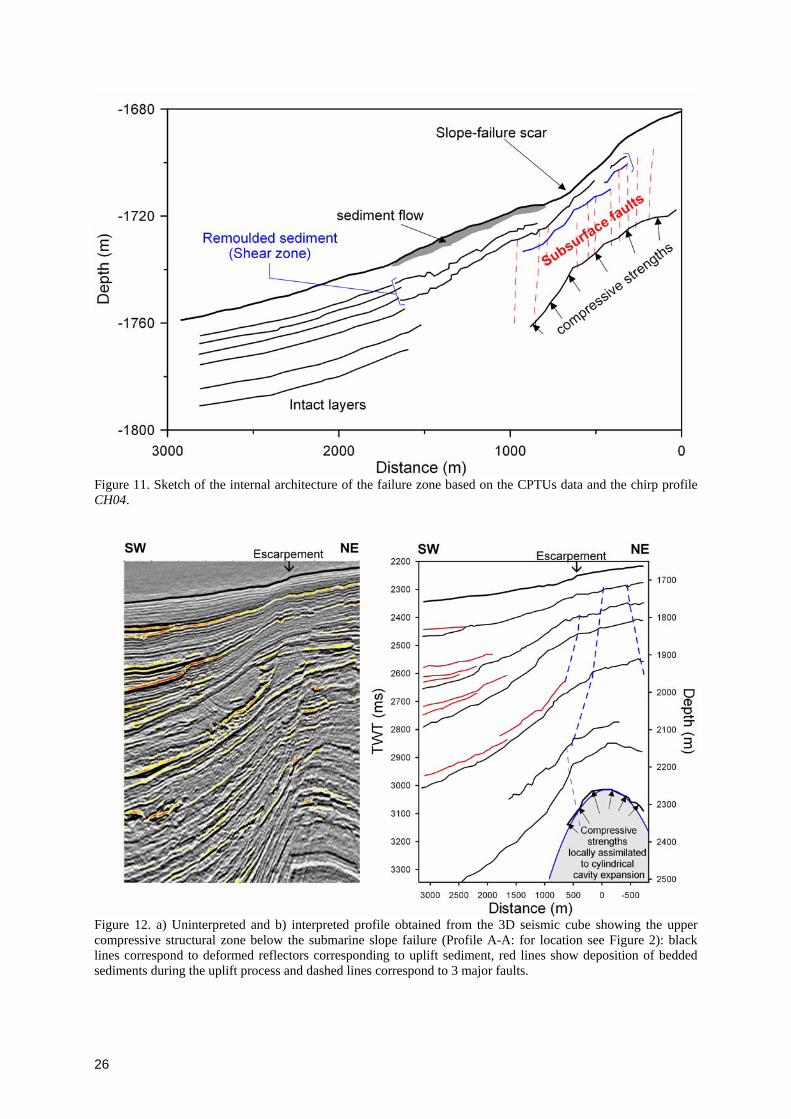
Figure 11. Sketch of the internal architecture of the failure zone based on the CPTUs data and the chirp profile CH04.
Figure 12. a) Uninterpreted and b) interpreted profile obtained from the 3D seismic cube showing the upper compressive structural zone below the submarine slope failure (Profile A-A: for location see Figure 2): black lines correspond to deformed reflectors corresponding to uplift sediment, red lines show deposition of bedded sediments during the uplift process and dashed lines correspond to 3 major faults.
26
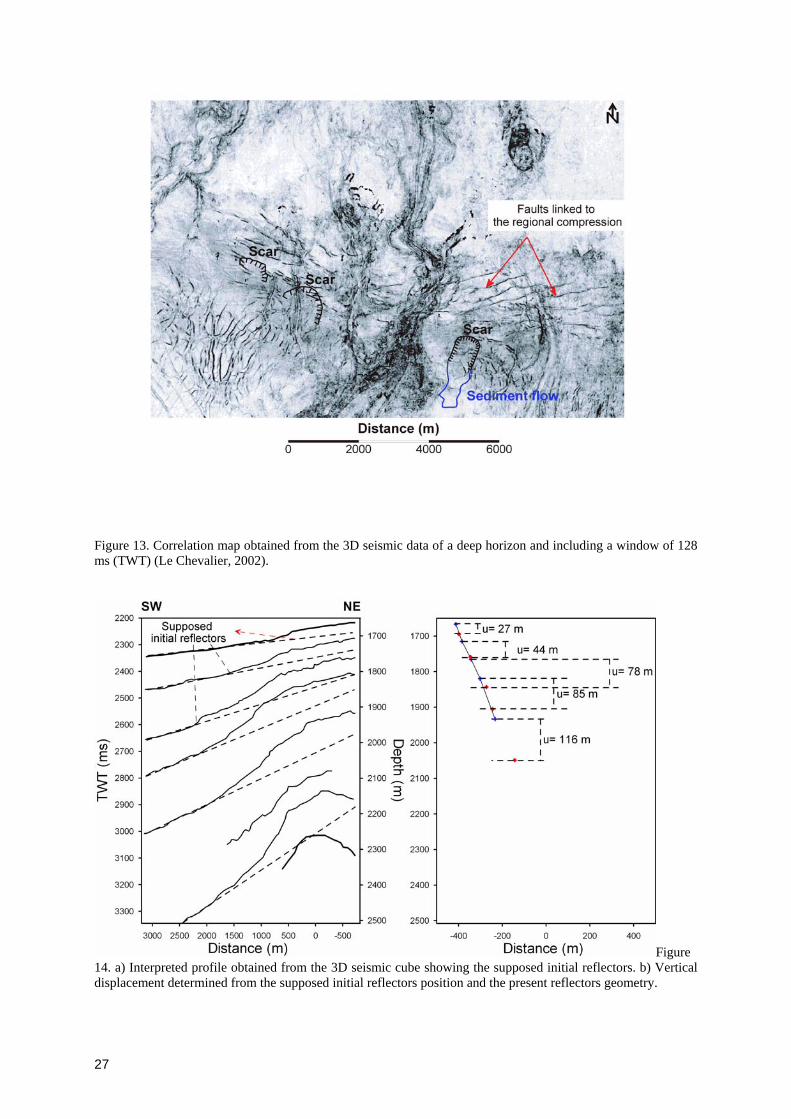
Figure 13. Correlation map obtained from the 3D seismic data of a deep horizon and including a window of 128 ms (TWT) (Le Chevalier, 2002).
Figure 14. a) Interpreted profile obtained from the 3D seismic cube showing the supposed initial reflectors. b) Vertical displacement determined from the supposed initial reflectors position and the present reflectors geometry.
27
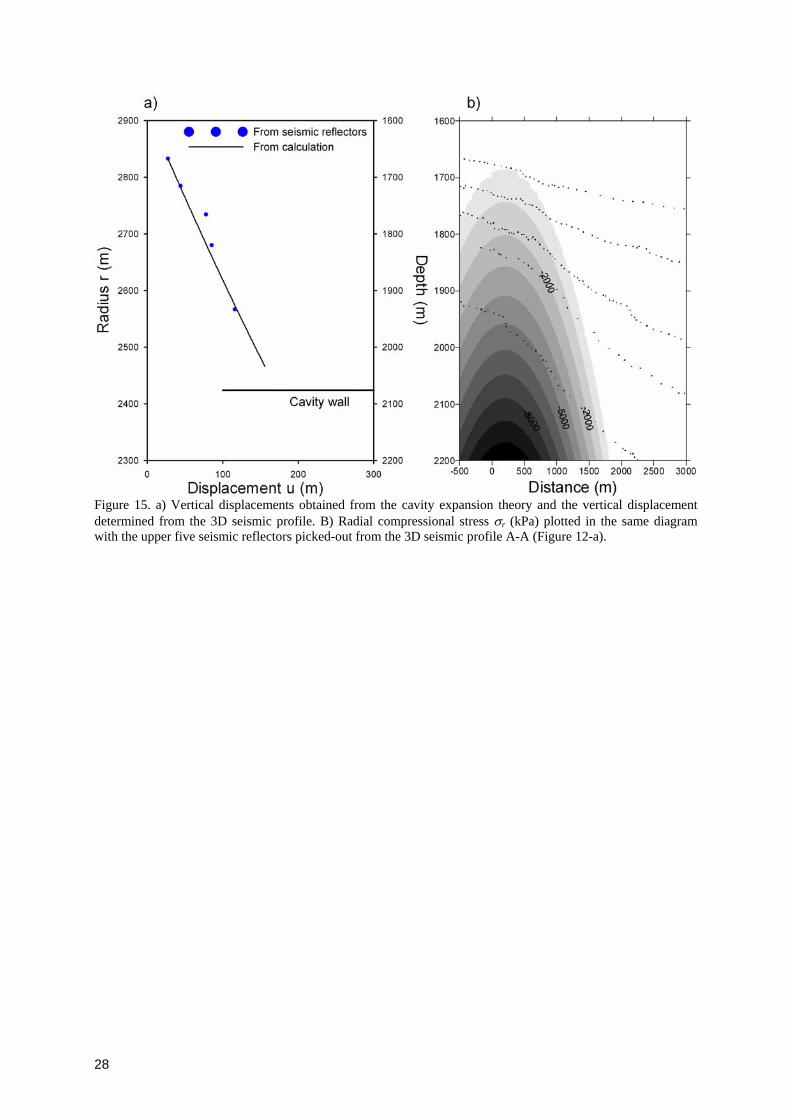
Figure 15. a) Vertical displacements obtained from the cavity expansion theory and the vertical displacement determined from the 3D seismic profile. B) Radial compressional stress σr (kPa) plotted in the same diagram with the upper five seismic reflectors picked-out from the 3D seismic profile A-A (Figure 12-a).
28
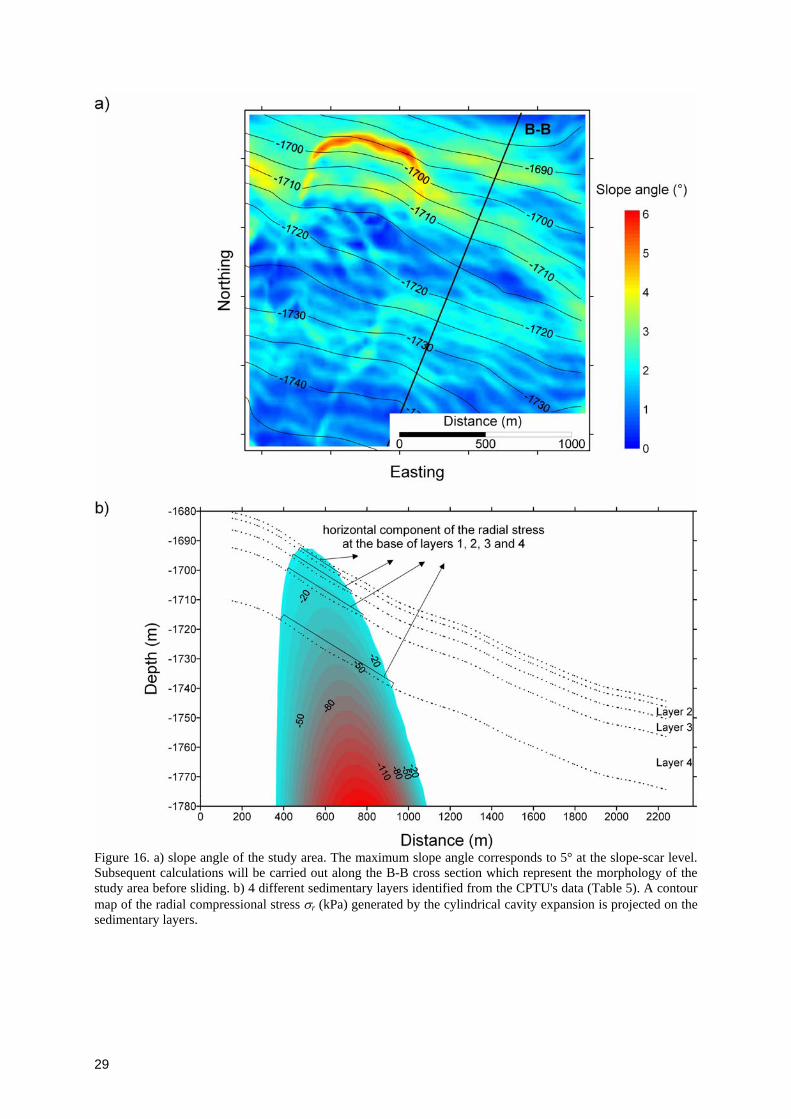
Figure 16. a) slope angle of the study area. The maximum slope angle corresponds to 5° at the slope-scar level. Subsequent calculations will be carried out along the B-B cross section which represent the morphology of the study area before sliding. b) 4 different sedimentary layers identified from the CPTU's data (Table 5). A contour map of the radial compressional stress σr (kPa) generated by the cylindrical cavity expansion is projected on the sedimentary layers.
29
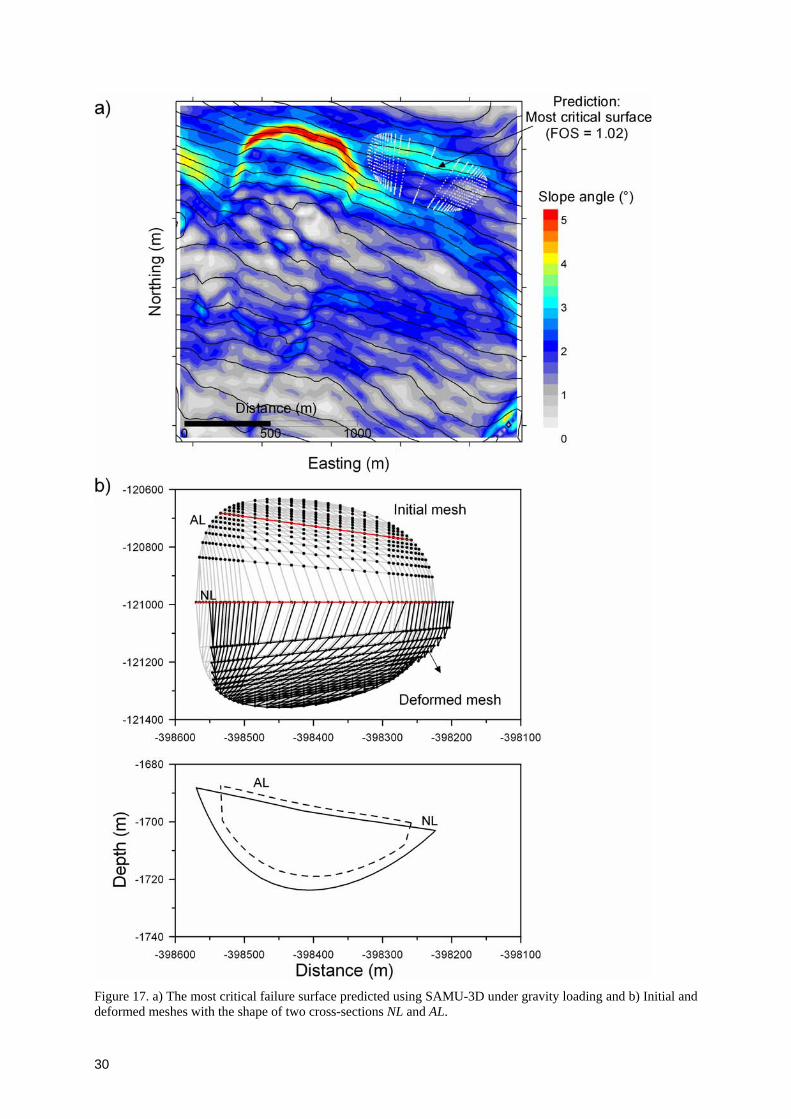
Figure 17. a) The most critical failure surface predicted using SAMU-3D under gravity loading and b) Initial and deformed meshes with the shape of two cross-sections NL and AL.
30
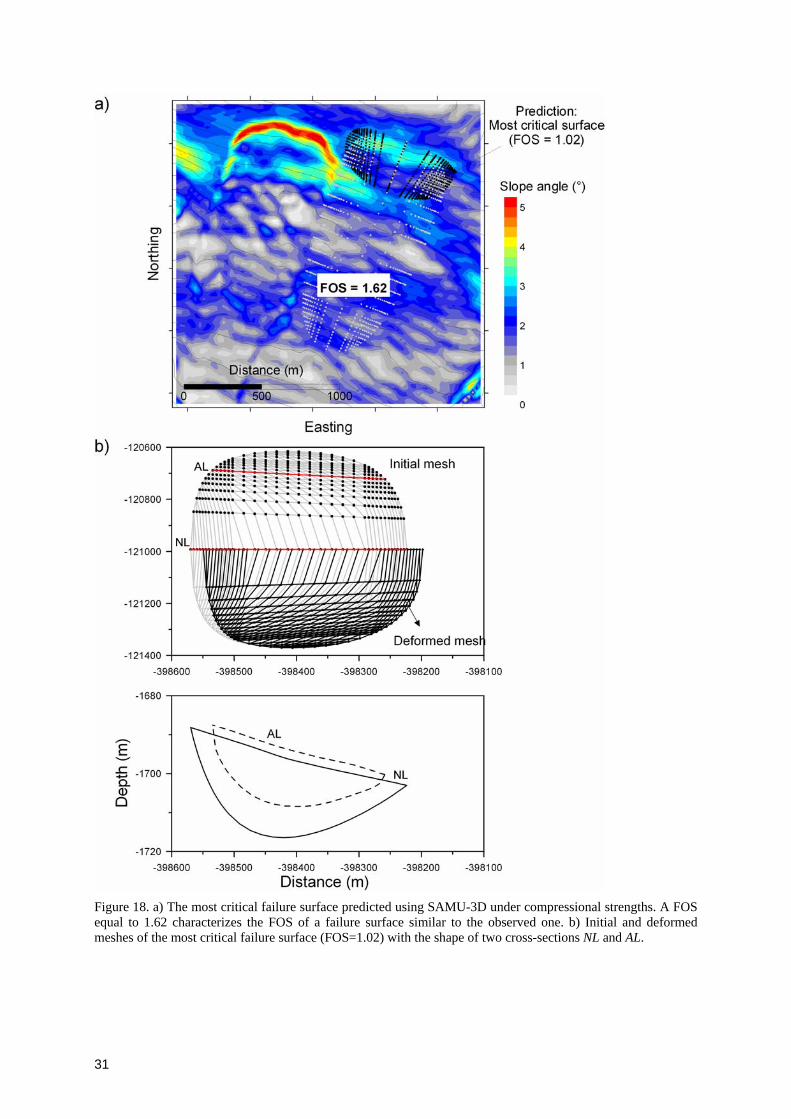
Figure 18. a) The most critical failure surface predicted using SAMU-3D under compressional strengths. A FOS equal to 1.62 characterizes the FOS of a failure surface similar to the observed one. b) Initial and deformed meshes of the most critical failure surface (FOS=1.02) with the shape of two cross-sections NL and AL.
31
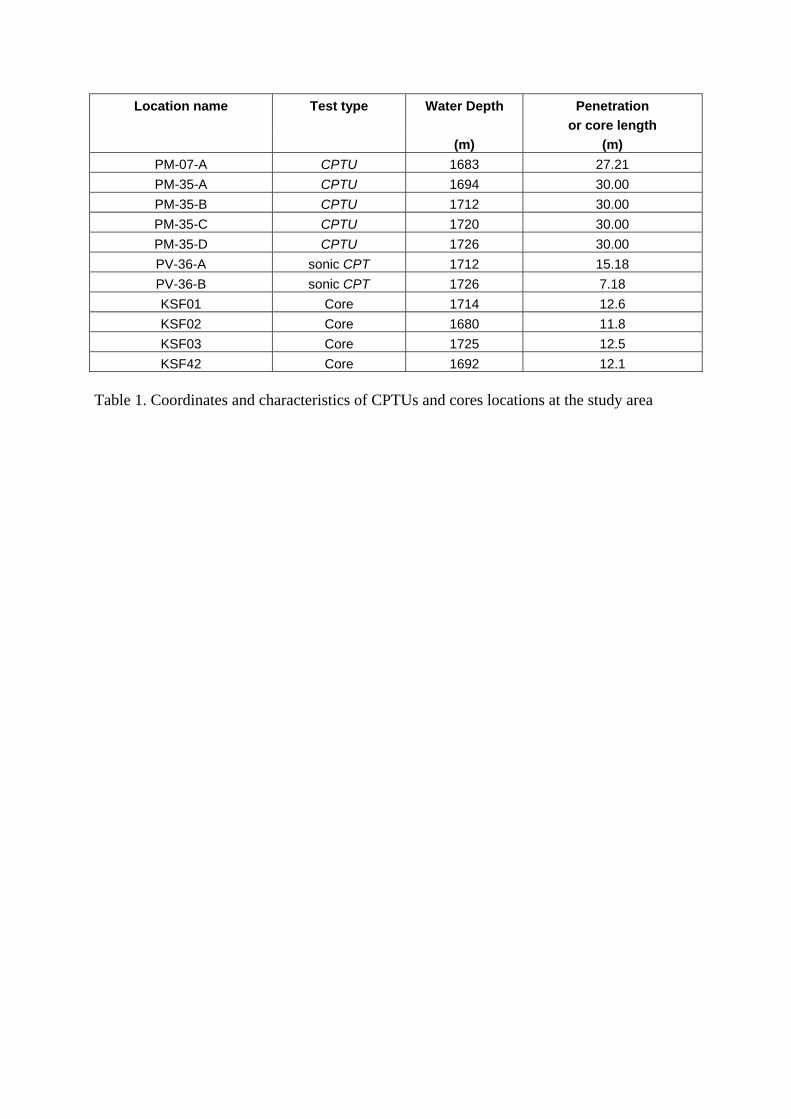
Location name Test type Water Depth Penetration or core length
(m) (m) PM-07-A CPTU 1683 27.21 PM-35-A CPTU 1694 30.00 PM-35-B CPTU 1712 30.00 PM-35-C CPTU 1720 30.00 PM-35-D CPTU 1726 30.00 PV-36-A sonic CPT 1712 15.18 PV-36-B sonic CPT 1726 7.18 KSF01 Core 1714 12.6 KSF02 Core 1680 11.8 KSF03 Core 1725 12.5 KSF42 Core 1692 12.1
Table 1. Coordinates and characteristics of CPTUs and cores locations at the study area
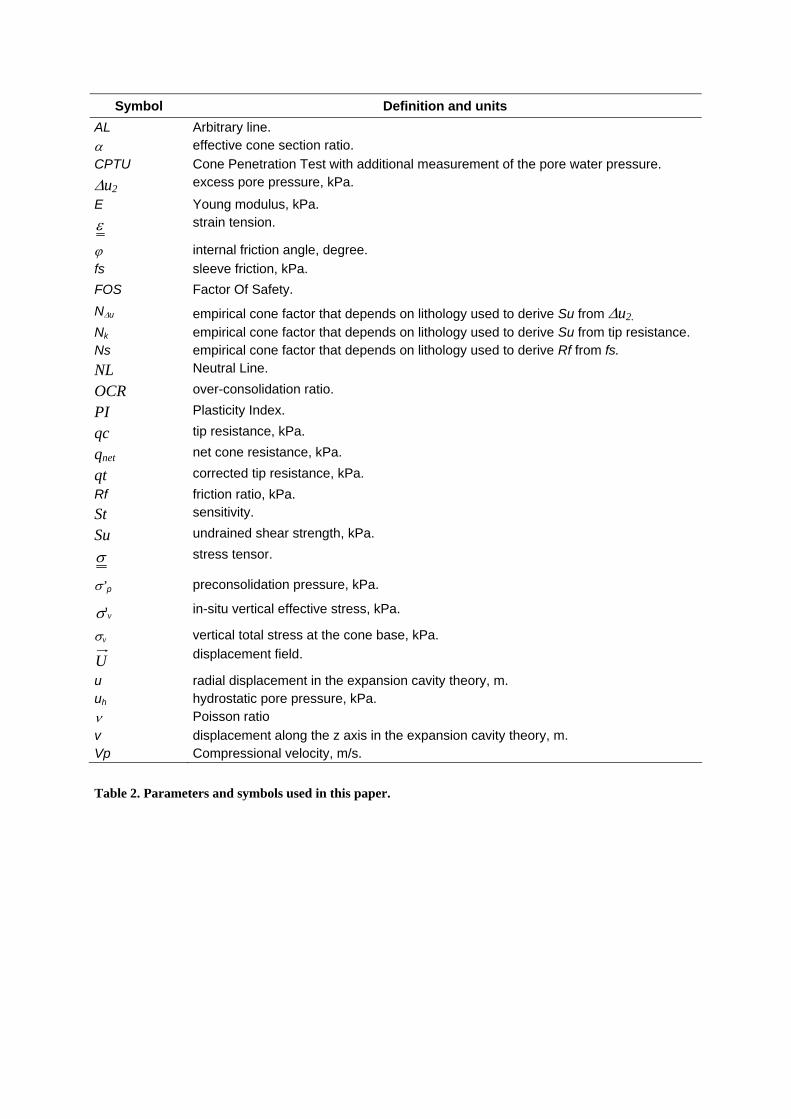
Symbol Definition and units AL Arbitrary line. α effective cone section ratio. CPTU Cone Penetration Test with additional measurement of the pore water pressure. Δu2 excess pore pressure, kPa.
E Young modulus, kPa. ε strain tension.
ϕ internal friction angle, degree. fs sleeve friction, kPa. FOS Factor Of Safety. NΔu empirical cone factor that depends on lithology used to derive Su from Δu2.Nk empirical cone factor that depends on lithology used to derive Su from tip resistance. Ns empirical cone factor that depends on lithology used to derive Rf from fs. NL Neutral Line.
OCR over-consolidation ratio.
PI Plasticity Index.
qc tip resistance, kPa.
qnet net cone resistance, kPa.
qt corrected tip resistance, kPa. Rf friction ratio, kPa. St sensitivity.
Su undrained shear strength, kPa.
σ stress tensor.
σ’p preconsolidation pressure, kPa.
v'σ in-situ vertical effective stress, kPa.
σv vertical total stress at the cone base, kPa.
U displacement field.
u radial displacement in the expansion cavity theory, m. uh hydrostatic pore pressure, kPa. ν Poisson ratio v displacement along the z axis in the expansion cavity theory, m. Vp Compressional velocity, m/s. Table 2. Parameters and symbols used in this paper.

Location name Test type Water Depth Length (m) (m)
PZA piezometer 1699 11.36 PZB piezometer 1671 10.36 PZR piezometer 1689 10.30
Table3. Coordinates and characteristics of piezometer locations at the study area

Core Depth
(mbsf) Vertical effective
stress (kPa) Preconsolidation
pressure (kPa) OCR
4 13.0 10 0.80 6 20.0 21 1.05 8 27.5 27 0.98
KSF02
10 36.5 37 1.01 6 21.5 28.0 1.30
KSF03 10 35.5 33.0 0.92 7 25.5 30.0 1.17
KSF42 9 33.5 31.0 0.92
Table 4. Over-Consolidation Ratio (OCR) from oedometer tests.
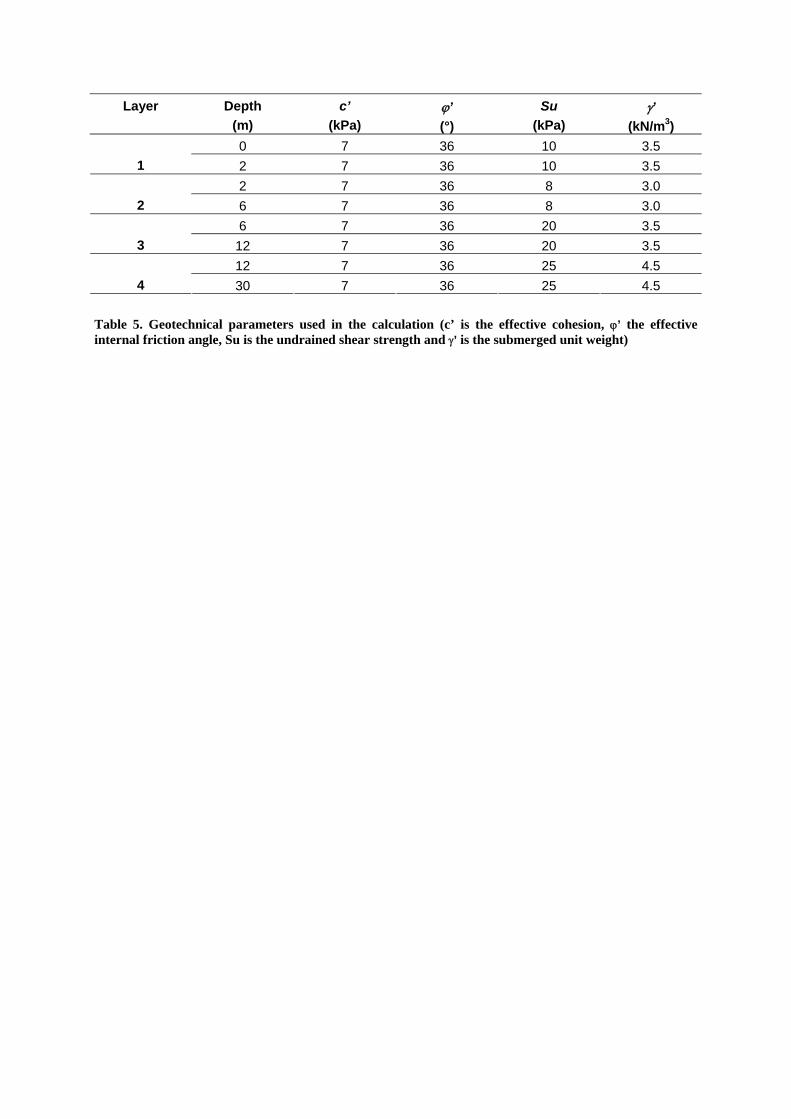
Layer Depth (m)
c’ (kPa)
ϕ’ (°)
Su (kPa)
γ’ (kN/m3)
0 7 36 10 3.5 1 2 7 36 10 3.5
2 7 36 8 3.0 2 6 7 36 8 3.0
6 7 36 20 3.5 3 12 7 36 20 3.5
12 7 36 25 4.5 4 30 7 36 25 4.5
Table 5. Geotechnical parameters used in the calculation (c’ is the effective cohesion, ϕ’ the effective internal friction angle, Su is the undrained shear strength and γ’ is the submerged unit weight)