Embed Size (px)
Citation preview
Piara Singh, Vijaya, D., Chinh, N.T., Aroon Pongkanjana, Prasad, K.S., Srinivas, K.,
and Wani, S.P. 2001. Potential productivity and yield gap of selected crops in the rainfed regions
of India, Thailand, and Vietnam. Natural Resource Management Program Report no. 5.
Patancheru 502 324, Andhra Pradesh, India: International Crops Research Institute for the Semi-
Arid Tropics. 50 pp.
Potential Productivity and Yield Gap of Selected Crops in the Rainfed Regions of India,
Thailand, and Vietnam
An Open Access Journal published by ICRISAT________________________________________________________________________________________________________
SAT eJournal | ejournal.icrisat.org August 2006 | Volume 2 | Issue 1
1
Executive summary
Before any improvements to crop management practices are made, it is useful to know the
potential yield of the crop in the region of interest, and the gap between the potential yield and
the actual yield obtained by the growers. This analysis helps to know the major factors causing
the difference between the actual and the attainable yield for a given site. Under the Asian
Development Bank (ADB)-supported project on integrated watershed management we carried
out such analysis for selected crops predominantly grown in the regions where the project is
operational. We used CROPGRO-soybean model to determine the yield potential (water-limited
yields) and yield gap of soybean crop for several locations in India. For northeastern Thailand
and northern Vietnam we compared the experimental yields obtained at the research farms with
the farmers’ current crop yields in the region to estimate the yield gaps.
For the eleven selected sites in India, the potential yield of soybean ranged from 1249 to
3050 kg ha-1
whereas the observed yields ranged from 570 to 1120 kg ha-1
giving yield gaps
ranging from 235 to 1955 kg ha-1
(19–65% of potential yield). For northeastern Thailand the
yield gaps ranged from 1370 to 2320 kg ha-1
(38–65%) in paddy rice, 175 to 270 kg ha-1
(11–18%) in upland rice, 1210 to 3180 kg ha-1
(25–67%) in maize, 625 to 940 kg ha-1
(32–49%)
in soybean, and 190 to 570 kg ha-1
(11–33%) in groundnut. In northern Vietnam the farmers
were able to harvest almost two-third of the potential yield of maize; however, in groundnut and
soybean the yield gap was wider and ranged from 40% to 60% of potential yield.
Various constraints limiting the crop yields in these regions have been highlighted. It is
suggested that location-specific integrated approaches would be needed to bridge the yield gap of
the predominant crops grown in the target regions.
An Open Access Journal published by ICRISAT________________________________________________________________________________________________________
SAT eJournal | ejournal.icrisat.org August 2006 | Volume 2 | Issue 1
2
Introduction
Assessment of potential yield and the yield gap between potential and actual yield is essential
before any investment for improving crop production for a location is made. Potential yield is
determined by solar radiation, temperature, photoperiod, atmospheric concentration of carbon
dioxide, and genotype characteristics assuming water, nutrients, pests, and diseases are not
limiting crop growth. This is also called water non-limiting potential yield. Under rainfed
situation where the water supply for crop production is not fully under the control of the grower,
water-limiting yield may be considered as the maximum attainable yield for yield gap analysis
assuming other factors are not limiting crop production. However, there may be season-to-season
variability in potential yield caused by weather variability, particularly rainfall. Once the yield
gap between water-limiting yield and actual yield is determined, then the relative contribution of
other major constraints and limitations causing yield gap can be assessed in order to focus on the
priority research or crop management needs to bridge the yield gap.
Water-limiting potential yield for a site could be determined by growing crops without any
growth constraints, except water availability. Alternatively, crop simulation models could be
used to estimate the potential yields provided the required soils and climatic input data for the
site are available for model execution. For the ADB-supported watershed project we have
estimated the potential yields and yield gaps of selected crops grown in India, Thailand, and
Vietnam. In these countries land degradation caused by water erosion, soil fertility depletion, and
waterlogging are the major constraints limiting crop yields and sustainability on relatively high
water-holding capacity soils. The production problems are further amplified by the existence of
biotic and socioeconomic constraints in these regions. The crops selected were soybean for India;
rice, maize, soybean, groundnut, and sunflower for northeastern Thailand; and maize, groundnut,
and soybean for northern Vietnam. As the soils and climatic data were available for India,
CROPGRO-soybean model was used to estimate potential yields of soybean. For northeastern
Thailand and northern Vietnam experimental yields obtained at the research stations were taken
as the potential yields and compared with the on-farm actual yields to determine the yield gap.
This report presents the current productivity levels, potential yields, and the yield gap of the
selected crops for the regions where the ADB-supported watershed management project is in
operation. Suggestions have also been made for bridging the yield gap through crop management
and conservation and use of natural resources of the target regions.
An Open Access Journal published by ICRISAT________________________________________________________________________________________________________
SAT eJournal | ejournal.icrisat.org August 2006 | Volume 2 | Issue 1
3
Section 1: Productivity and yield gap of soybean in India
India ranks third after Argentina and Brazil to have registered a phenomenal growth in the
production of soybean. Soybean cultivation in India has steadily increased. It was a minor crop
during the early 1970s but at present, it occupies third place in the oilseed production in India.
The area under soybean in India has rapidly increased from 0.03 million ha in 1970 to 2.6
million ha in 1990 and to 5.6 million ha in 1997 (Directorate of Economics and Statistics,
Government of India 1970–92, Directorate of Economics and Statistics 1993–2000).
Increased soybean production is mainly driven by increased area sown to the crop. In 1998,
the soybean production was 5.2 million t. While the progress in soybean production is most
impressive, these growth figures belie the fact that the productivity continues to remain low and
major steps are required to enhance production by increasing productivity rather than increasing
area under the crop. The average soybean productivity for India has hovered around 1 t ha-1
during 1983–2000 (Fig. 1.1).
The study of long-term growth trend does not indicate any appreciable contribution towards
productivity gains by improved agricultural technologies in soybean cultivation except the
maintenance of yield. Despite the release of short-duration and high-yielding varieties in recent
years, there is no evidence of yield increase in the state of Madhya Pradesh, which is the
heartland of soybean production in India. Thus, it can be averred that the growth in production is
primarily led by an increased area sown under the crop.
Major soybean-producing states of India
In India, soybean crop is primarily cultivated in the states of Madhya Pradesh, Rajasthan,
Maharashtra, and Uttar Pradesh. Figure 1.2 shows the distribution of the crop in two epochs:
1985 and 1997. Efforts to grow soybean in the submountane plains of India commenced in the
early 1960s. The crop was promising in Madhya Pradesh, Maharashtra, and Uttar Pradesh but
not in Gujarat. Currently Madhya Pradesh accounts for nearly 87% of the area under the crop in
the country and contributes about 83% of the total national production. In Uttar Pradesh, the area
under soybean increased until mid-1980s, but a sharp decline was noted in 1987. This is clearly
seen in comparing the area distribution pattern maps for 1985 and 1997. As in Gujarat, the crop
did not hold ground initially in Maharashtra as well. However, by 1990, Maharashtra regained
the position of the second largest soybean producing state in India.
Classification of soybean-producing districts
The soybean area distribution presented in Figure 1.2 reveals a selective, concentrated adaptation
of the crop in India. This is more clearly evident in the area and production data of 1997 which
show that only 14 districts in Madhya Pradesh account for 61% of the national area under the
An Open Access Journal published by ICRISAT________________________________________________________________________________________________________
SAT eJournal | ejournal.icrisat.org August 2006 | Volume 2 | Issue 1
4
crop and contribute as much as 75% to the total national soybean production. Such a
development pattern raises an important question: How are these (high spread) districts different
in terms of their natural resource endowments and socioeconomic infrastructure compared to the
other districts that show a low spread of soybean crop? The resources could be defined in terms
of regional soil type, annual or seasonal rainfall, irrigation facilities, use of fertilizers, adoption
of high-yielding varieties, cropping patterns, location of soybean processing industries, etc. To
provide an answer to the above question, it is necessary to identify those factors of production
that render some districts as high density soybean producers and some as low density producers.
Based on soybean productivity levels and contribution of soybean area in the districts to their
gross cropped area (GCA) and to total soybean area in India, we grouped soybean-producing
districts of India into three zones: primary, secondary, and tertiary. For this purpose the available
data of the last three seasons (1994/95, 1995/96, and 1996/97) were used. A district was
considered primary if it had at least 15% of GCA under soybean, at least 1% of total soybean
area in the country, and soybean productivity levels more than the national average (0.95 t ha-1
).
The districts meeting all the three conditions in any one season were grouped under the primary
zone. After separating the primary districts, the secondary districts were identified from the
remaining districts. The secondary zone constituted those districts which had at least 5% of GCA
under soybean, at least 0.5% of total soybean area in the country, and soybean productivity levels
more than 0.5 t ha-1
. The remaining districts which grew soybean but did not fall in the above
two categories were grouped under the tertiary zone. The map of these zones was overlayed on
the map of agroecological zones (AEZs) of India (Sehgal et al. 1995). The AEZs of interest from
soybean production point of view are AEZs 4, 5, 6, 9, 10, 11, 12, and 14 (Fig. 1.3).
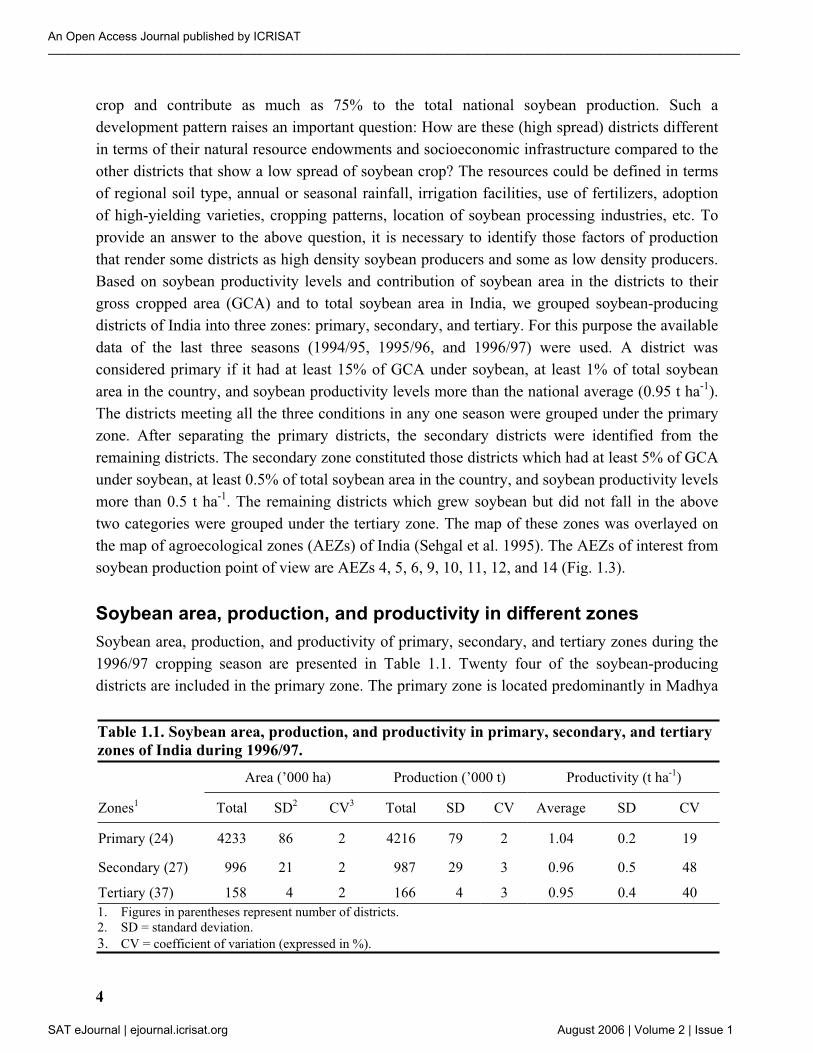
Soybean area, production, and productivity in different zones
Soybean area, production, and productivity of primary, secondary, and tertiary zones during the
1996/97 cropping season are presented in Table 1.1. Twenty four of the soybean-producing
districts are included in the primary zone. The primary zone is located predominantly in Madhya
Table 1.1. Soybean area, production, and productivity in primary, secondary, and tertiary
zones of India during 1996/97.
Area (’000 ha) Production (’000 t) Productivity (t ha-1)
Zones1 Total SD2 CV3 Total SD CV Average SD CV
Primary (24) 4233 86 2 4216 79 2 1.04 0.2 19
Secondary (27) 996 21 2 987 29 3 0.96 0.5 48
Tertiary (37) 158 4 2 166 4 3 0.95 0.4 40
1. Figures in parentheses represent number of districts.
2. SD = standard deviation.
3. CV = coefficient of variation (expressed in %).
An Open Access Journal published by ICRISAT________________________________________________________________________________________________________
SAT eJournal | ejournal.icrisat.org August 2006 | Volume 2 | Issue 1
5
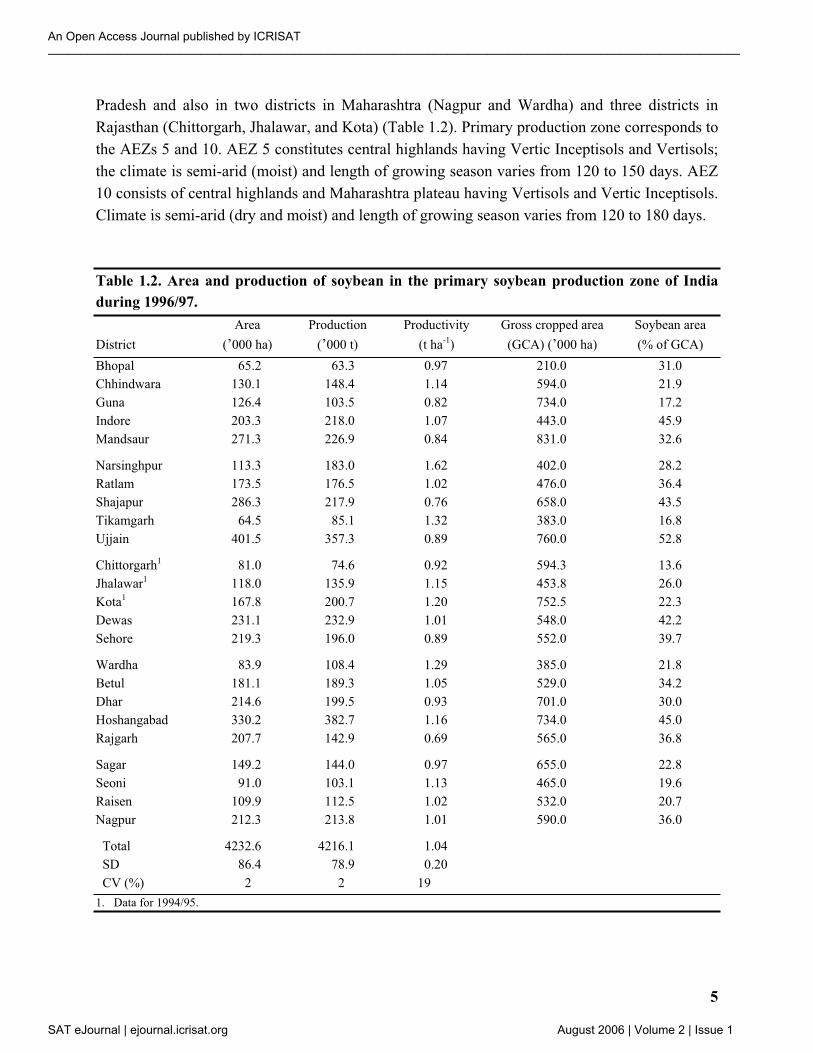
Pradesh and also in two districts in Maharashtra (Nagpur and Wardha) and three districts in
Rajasthan (Chittorgarh, Jhalawar, and Kota) (Table 1.2). Primary production zone corresponds to
the AEZs 5 and 10. AEZ 5 constitutes central highlands having Vertic Inceptisols and Vertisols;
the climate is semi-arid (moist) and length of growing season varies from 120 to 150 days. AEZ
10 consists of central highlands and Maharashtra plateau having Vertisols and Vertic Inceptisols.
Climate is semi-arid (dry and moist) and length of growing season varies from 120 to 180 days.
Table 1.2. Area and production of soybean in the primary soybean production zone of India
during 1996/97.
Area Production Productivity Gross cropped area Soybean area
District (’000 ha) (’000 t) (t ha-1) (GCA) (’000 ha) (% of GCA)
Bhopal 65.2 63.3 0.97 210.0 31.0
Chhindwara 130.1 148.4 1.14 594.0 21.9
Guna 126.4 103.5 0.82 734.0 17.2
Indore 203.3 218.0 1.07 443.0 45.9
Mandsaur 271.3 226.9 0.84 831.0 32.6
Narsinghpur 113.3 183.0 1.62 402.0 28.2
Ratlam 173.5 176.5 1.02 476.0 36.4
Shajapur 286.3 217.9 0.76 658.0 43.5
Tikamgarh 64.5 85.1 1.32 383.0 16.8
Ujjain 401.5 357.3 0.89 760.0 52.8
Chittorgarh1 81.0 74.6 0.92 594.3 13.6
Jhalawar1 118.0 135.9 1.15 453.8 26.0
Kota1 167.8 200.7 1.20 752.5 22.3
Dewas 231.1 232.9 1.01 548.0 42.2
Sehore 219.3 196.0 0.89 552.0 39.7
Wardha 83.9 108.4 1.29 385.0 21.8
Betul 181.1 189.3 1.05 529.0 34.2
Dhar 214.6 199.5 0.93 701.0 30.0
Hoshangabad 330.2 382.7 1.16 734.0 45.0
Rajgarh 207.7 142.9 0.69 565.0 36.8
Sagar 149.2 144.0 0.97 655.0 22.8
Seoni 91.0 103.1 1.13 465.0 19.6
Raisen 109.9 112.5 1.02 532.0 20.7
Nagpur 212.3 213.8 1.01 590.0 36.0
Total 4232.6 4216.1 1.04
SD 86.4 78.9 0.20
CV (%) 2 2 19
1. Data for 1994/95.
An Open Access Journal published by ICRISAT________________________________________________________________________________________________________
SAT eJournal | ejournal.icrisat.org August 2006 | Volume 2 | Issue 1
6
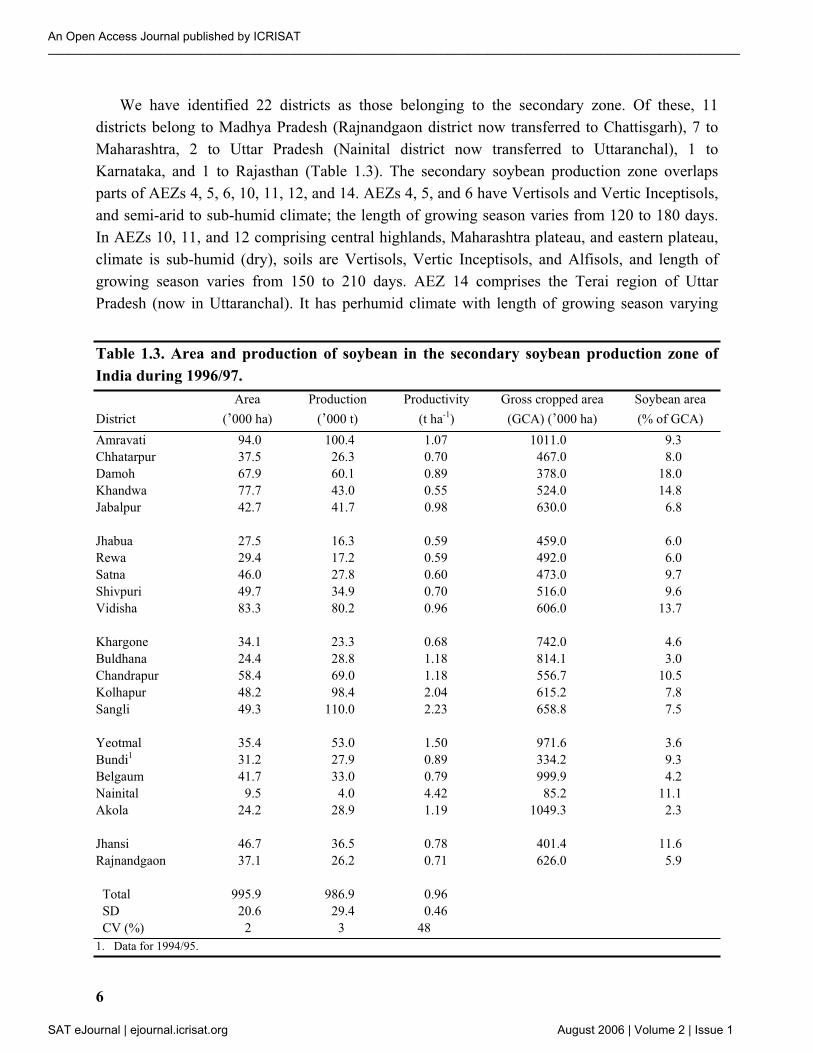
We have identified 22 districts as those belonging to the secondary zone. Of these, 11
districts belong to Madhya Pradesh (Rajnandgaon district now transferred to Chattisgarh), 7 to
Maharashtra, 2 to Uttar Pradesh (Nainital district now transferred to Uttaranchal), 1 to
Karnataka, and 1 to Rajasthan (Table 1.3). The secondary soybean production zone overlaps
parts of AEZs 4, 5, 6, 10, 11, 12, and 14. AEZs 4, 5, and 6 have Vertisols and Vertic Inceptisols,
and semi-arid to sub-humid climate; the length of growing season varies from 120 to 180 days.
In AEZs 10, 11, and 12 comprising central highlands, Maharashtra plateau, and eastern plateau,
climate is sub-humid (dry), soils are Vertisols, Vertic Inceptisols, and Alfisols, and length of
growing season varies from 150 to 210 days. AEZ 14 comprises the Terai region of Uttar
Pradesh (now in Uttaranchal). It has perhumid climate with length of growing season varying
Table 1.3. Area and production of soybean in the secondary soybean production zone of
India during 1996/97.
Area Production Productivity Gross cropped area Soybean area
District (’000 ha) (’000 t) (t ha-1) (GCA) (’000 ha) (% of GCA)
Amravati 94.0 100.4 1.07 1011.0 9.3
Chhatarpur 37.5 26.3 0.70 467.0 8.0
Damoh 67.9 60.1 0.89 378.0 18.0
Khandwa 77.7 43.0 0.55 524.0 14.8
Jabalpur 42.7 41.7 0.98 630.0 6.8
Jhabua 27.5 16.3 0.59 459.0 6.0
Rewa 29.4 17.2 0.59 492.0 6.0
Satna 46.0 27.8 0.60 473.0 9.7
Shivpuri 49.7 34.9 0.70 516.0 9.6
Vidisha 83.3 80.2 0.96 606.0 13.7
Khargone 34.1 23.3 0.68 742.0 4.6
Buldhana 24.4 28.8 1.18 814.1 3.0
Chandrapur 58.4 69.0 1.18 556.7 10.5
Kolhapur 48.2 98.4 2.04 615.2 7.8
Sangli 49.3 110.0 2.23 658.8 7.5
Yeotmal 35.4 53.0 1.50 971.6 3.6
Bundi1 31.2 27.9 0.89 334.2 9.3
Belgaum 41.7 33.0 0.79 999.9 4.2
Nainital 9.5 4.0 4.42 85.2 11.1
Akola 24.2 28.9 1.19 1049.3 2.3
Jhansi 46.7 36.5 0.78 401.4 11.6
Rajnandgaon 37.1 26.2 0.71 626.0 5.9
Total 995.9 986.9 0.96
SD 20.6 29.4 0.46
CV (%) 2 3 48
1. Data for 1994/95.
An Open Access Journal published by ICRISAT________________________________________________________________________________________________________
SAT eJournal | ejournal.icrisat.org August 2006 | Volume 2 | Issue 1
7
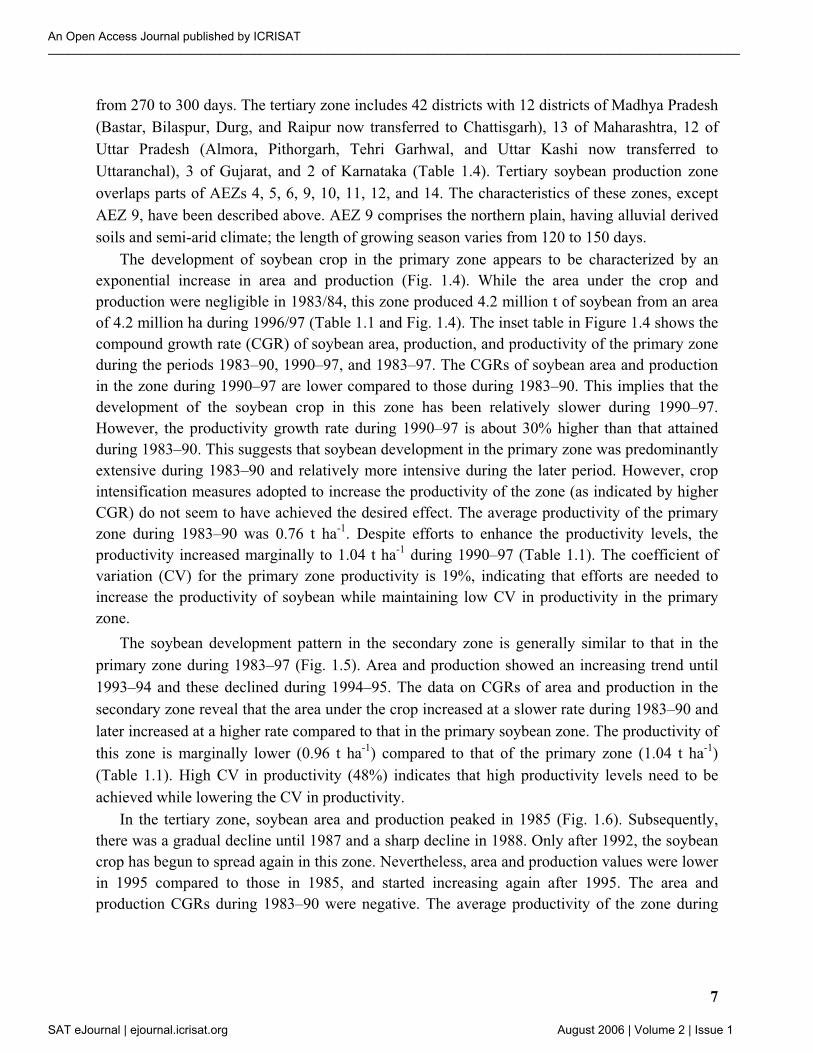
from 270 to 300 days. The tertiary zone includes 42 districts with 12 districts of Madhya Pradesh
(Bastar, Bilaspur, Durg, and Raipur now transferred to Chattisgarh), 13 of Maharashtra, 12 of
Uttar Pradesh (Almora, Pithorgarh, Tehri Garhwal, and Uttar Kashi now transferred to
Uttaranchal), 3 of Gujarat, and 2 of Karnataka (Table 1.4). Tertiary soybean production zone
overlaps parts of AEZs 4, 5, 6, 9, 10, 11, 12, and 14. The characteristics of these zones, except
AEZ 9, have been described above. AEZ 9 comprises the northern plain, having alluvial derived
soils and semi-arid climate; the length of growing season varies from 120 to 150 days.
The development of soybean crop in the primary zone appears to be characterized by an
exponential increase in area and production (Fig. 1.4). While the area under the crop and
production were negligible in 1983/84, this zone produced 4.2 million t of soybean from an area
of 4.2 million ha during 1996/97 (Table 1.1 and Fig. 1.4). The inset table in Figure 1.4 shows the
compound growth rate (CGR) of soybean area, production, and productivity of the primary zone
during the periods 1983–90, 1990–97, and 1983–97. The CGRs of soybean area and production
in the zone during 1990–97 are lower compared to those during 1983–90. This implies that the
development of the soybean crop in this zone has been relatively slower during 1990–97.
However, the productivity growth rate during 1990–97 is about 30% higher than that attained
during 1983–90. This suggests that soybean development in the primary zone was predominantly
extensive during 1983–90 and relatively more intensive during the later period. However, crop
intensification measures adopted to increase the productivity of the zone (as indicated by higher
CGR) do not seem to have achieved the desired effect. The average productivity of the primary
zone during 1983–90 was 0.76 t ha-1
. Despite efforts to enhance the productivity levels, the
productivity increased marginally to 1.04 t ha-1
during 1990–97 (Table 1.1). The coefficient of
variation (CV) for the primary zone productivity is 19%, indicating that efforts are needed to
increase the productivity of soybean while maintaining low CV in productivity in the primary
zone.
The soybean development pattern in the secondary zone is generally similar to that in the
primary zone during 1983–97 (Fig. 1.5). Area and production showed an increasing trend until
1993–94 and these declined during 1994–95. The data on CGRs of area and production in the
secondary zone reveal that the area under the crop increased at a slower rate during 1983–90 and
later increased at a higher rate compared to that in the primary soybean zone. The productivity of
this zone is marginally lower (0.96 t ha-1
) compared to that of the primary zone (1.04 t ha-1
)
(Table 1.1). High CV in productivity (48%) indicates that high productivity levels need to be
achieved while lowering the CV in productivity.
In the tertiary zone, soybean area and production peaked in 1985 (Fig. 1.6). Subsequently,
there was a gradual decline until 1987 and a sharp decline in 1988. Only after 1992, the soybean
crop has begun to spread again in this zone. Nevertheless, area and production values were lower
in 1995 compared to those in 1985, and started increasing again after 1995. The area and
production CGRs during 1983–90 were negative. The average productivity of the zone during
An Open Access Journal published by ICRISAT________________________________________________________________________________________________________
SAT eJournal | ejournal.icrisat.org August 2006 | Volume 2 | Issue 1
8
Table 1.4. Area and production of soybean in the tertiary soybean production zone of India
during 1996/97.
Area Production Productivity Gross cropped area Soybean area
District (’000 ha) (’000 t) (t ha-1) (GCA) (’000 ha) (% of GCA)
Balaghat 0.3 0.4 1.33 353.0 0.1
Bastar 0.3 0.3 1.00 906.0 0.0
Bilaspur 5.9 4.8 0.81 1072.0 0.6
Datia 3.0 2.8 0.93 147.0 2.0
Durg 7.9 4.8 0.61 804.0 1.0
Gwalior 6.6 10.9 1.65 307.0 2.1
Mandla 12.1 10.8 0.89 574.0 2.1
Morena 14.0 17.9 1.28 484.0 2.9
Panna 5.6 3.7 0.66 280.0 2.0
Raipur 0.8 0.8 1.00 1188.0 0.1
Shahdol 5.7 3.2 0.56 576.0 1.0
Sidhi 0.7 0.4 0.57 483.0 0.1
Ahmednagar 0.8 1.1 1.38 1441.4 0.1
Aurangabad 3.5 4.5 1.29 941.0 0.4
Bhandara 11.2 12.9 1.15 416.0 2.7
Dhule 2.0 3.4 1.70 804.9 0.2
Jalgaon 3.6 5.5 1.53 1172.0 0.3
Nanded 1.8 3.0 1.67 816.0 0.2
Nasik 1.9 2.6 1.37 977.9 0.2
Parbhani 5.2 6.6 1.27 1285.1 0.4
Satara 9.8 14.8 1.51 685.0 1.4
Almora 0.4 0.2 0.47 174.1 0.2
Banda 2.7 2.1 0.77 600.9 0.4
Bareilly 0.4 0.3 0.76 522.4 0.1
Chamoli 0.1 0.1 0.48 66.7 0.2
Garhwal 0.9 0.4 0.4 135.8 0.7
Hamirpur 2.6 2.0 0.77 357.0 0.7
Jalaun 6.6 5.1 0.77 388.7 1.7
Pithorgarh 1.4 0.7 0.47 117.9 1.2
Shajahanpur 0.3 0.3 0.74 585.0 0.1
Tehri Garhwal 0.3 0.2 0.47 107.4 0.3
Uttar Kashi 0.1 0.0 0.47 46.6 0.2
Broach1 2.2 1.5 0.68 431.1 0.5
Dangs1 0.7 0.3 0.43 56.7 1.2
Vadodara1 7.6 10.6 1.40 567.1 1.3
Lalitpur 11.5 12.1 1.05 306.1 3.8
Beed 0.9 1.0 1.11 913.4 0.1
Jalna 4.0 3.3 0.83 722.7 0.6
Latur 4.2 4.6 1.10 69.3 0.6
Osmanabad 1.4 1.5 1.07 718.3 0.2
Bijapur 4.3 3.0 0.69 1554.0 0.3
Dharwad 2.5 2.0 0.78 1355.7 0.2
Total 158.0 166.5 0.95
SD 3.7 4.5 0.38
CV (%) 2 3 40
1. Data for 1994/95.
An Open Access Journal published by ICRISAT________________________________________________________________________________________________________
SAT eJournal | ejournal.icrisat.org August 2006 | Volume 2 | Issue 1
9
this period was about 0.75 t ha-1
. During 1990–97, average soybean productivity in the tertiary
zone was higher than that of the secondary zone and comparable to that of the primary zone.
Although the average productivity levels of primary and tertiary production zones are similar, the
variability associated with soybean yields in the tertiary zone is about twice that in the primary
zone (Table 1.1), indicating that productivity gains are needed along with reduction in variability
in yields in this zone.
Soybean in the primary zone
As seen in Table 1.2, the primary production zone accounted for 4.2 million ha (78% of the total
soybean area) and produced 4.2 million t (78% of the annual production) of soybean in 1996–97.
In contrast, negligible area was under soybean cultivation during 1983/84. Within a span of a
decade or so, the primary zone has attained the status of a leading soybean producer in the
country. This raises a few questions: How was such an impressive rate of growth in soybean
cultivation achieved? Was it at the cost of other crops in the zone? To answer these questions, we
analyzed the cropping pattern in the primary zone during 1983–95. Based on this analysis, the
following observations have been noted.
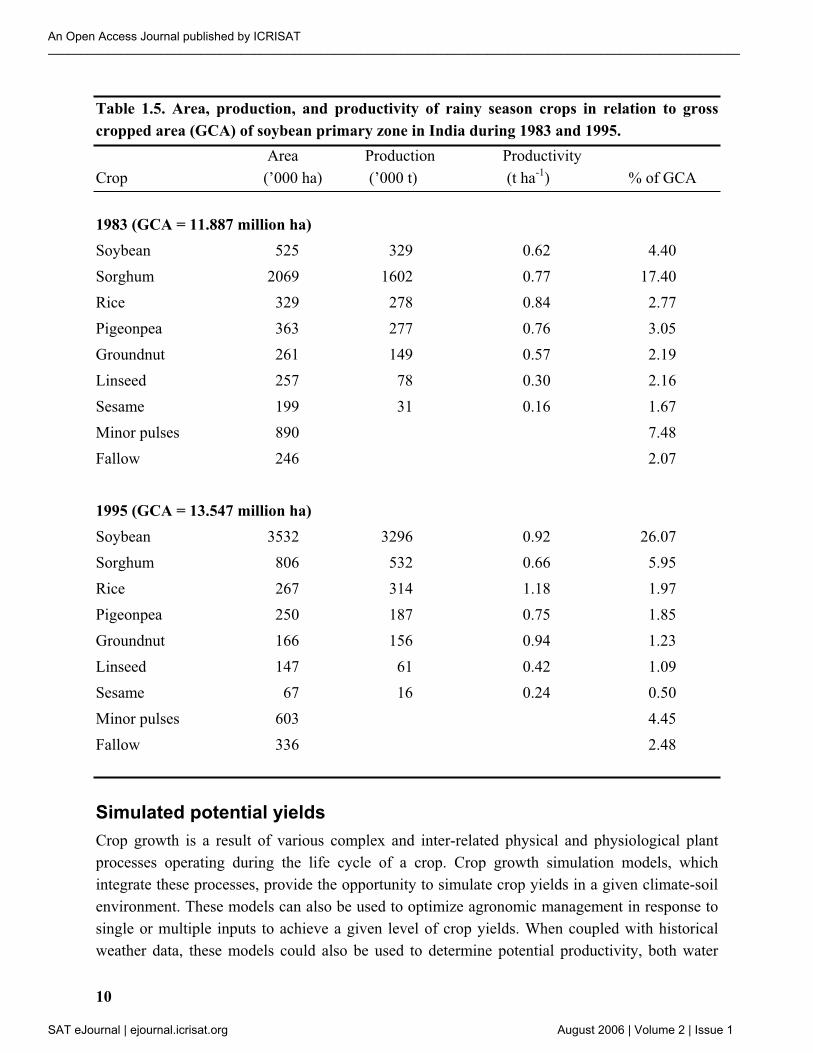
Trends in area and production of important crops and land area left fallow in the primary
zone during 1983–95 are shown in Figures 1.7 and 1.8 and Table 1.5. The primary zone
produced 1.6 million t of sorghum from an area of 2.1 million ha during 1983/84. However, by
1994/95, the area under this crop was drastically reduced to 0.81 million ha with a production of
0.53 million t. It is clearly seen in Figure 1.7 that sorghum cultivation declined linearly during
1983–95. This is also evident from the negative CGRs of sorghum crop (see the inset table in
Fig. 1.7). Initially, the rate of decline in sorghum area was slow (2.6% yr-1
during 1983–90).
However, there was a pronounced decline (10.3% yr-1
) during 1990–95 (with an overall rate of
decline of 5.5% yr-1
during 1983–95). Other important crops of the primary zone such as rice and
pigeonpea also showed a similar trend during 1983–95. The rates of decline in area under rice
and pigeonpea during this period were 1.8% and 1.7% respectively. However, these rates of
decline were lower than that of sorghum. The trend in the annual fallow land shows an increase
in the area until 1991/92 and a subsequent decrease. In recent years, the fallow land declined at
the rate of 3.6% per year.
While area under sorghum, rice, pigeonpea, and fallow land have declined during 1983–95 in
the primary zone, the area under soybean has continuously increased. Area sown to other minor
crops in the zone also decreased from 1983 to 1995 (Table 1.5). Thus, we can conclude that
soybean area has been expanding in the primary zone in the areas that were previously sown to
sorghum, rice, pigeonpea, and other crops or left as cultivated fallow during the rainy cropping
season (Fig. 1.8 and Table 1.5).
An Open Access Journal published by ICRISAT________________________________________________________________________________________________________
SAT eJournal | ejournal.icrisat.org August 2006 | Volume 2 | Issue 1
10
Table 1.5. Area, production, and productivity of rainy season crops in relation to gross
cropped area (GCA) of soybean primary zone in India during 1983 and 1995.
Area Production Productivity
Crop (’000 ha) (’000 t) (t ha-1
) % of GCA
1983 (GCA = 11.887 million ha)
Soybean 525 329 0.62 4.40
Sorghum 2069 1602 0.77 17.40
Rice 329 278 0.84 2.77
Pigeonpea 363 277 0.76 3.05
Groundnut 261 149 0.57 2.19
Linseed 257 78 0.30 2.16
Sesame 199 31 0.16 1.67
Minor pulses 890 7.48
Fallow 246 2.07
1995 (GCA = 13.547 million ha)
Soybean 3532 3296 0.92 26.07
Sorghum 806 532 0.66 5.95
Rice 267 314 1.18 1.97
Pigeonpea 250 187 0.75 1.85
Groundnut 166 156 0.94 1.23
Linseed 147 61 0.42 1.09
Sesame 67 16 0.24 0.50
Minor pulses 603 4.45
Fallow 336 2.48
Simulated potential yields
Crop growth is a result of various complex and inter-related physical and physiological plant
processes operating during the life cycle of a crop. Crop growth simulation models, which
integrate these processes, provide the opportunity to simulate crop yields in a given climate-soil
environment. These models can also be used to optimize agronomic management in response to
single or multiple inputs to achieve a given level of crop yields. When coupled with historical
weather data, these models could also be used to determine potential productivity, both water
An Open Access Journal published by ICRISAT________________________________________________________________________________________________________
SAT eJournal | ejournal.icrisat.org August 2006 | Volume 2 | Issue 1
11
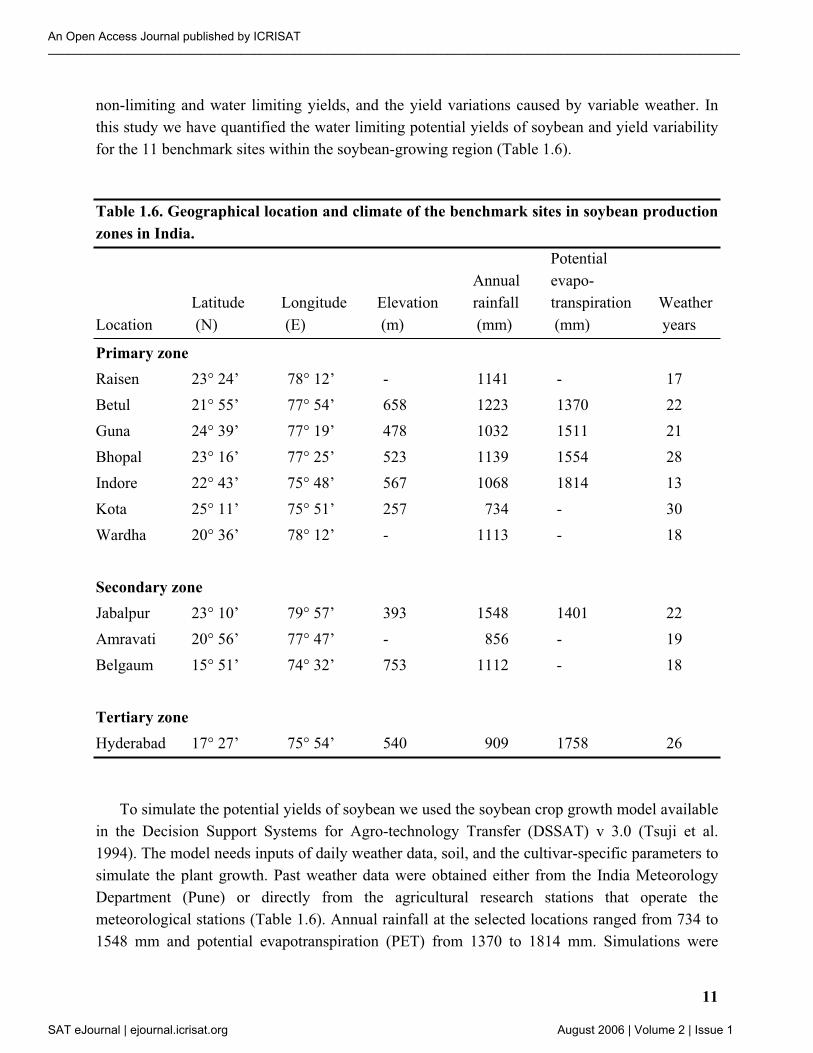
non-limiting and water limiting yields, and the yield variations caused by variable weather. In
this study we have quantified the water limiting potential yields of soybean and yield variability
for the 11 benchmark sites within the soybean-growing region (Table 1.6).
Table 1.6. Geographical location and climate of the benchmark sites in soybean production
zones in India.
Potential
Annual evapo-
Latitude Longitude Elevation rainfall transpiration Weather
Location (N) (E) (m) (mm) (mm) years
Primary zone
Raisen 23° 24’ 78° 12’ - 1141 - 17
Betul 21° 55’ 77° 54’ 658 1223 1370 22
Guna 24° 39’ 77° 19’ 478 1032 1511 21
Bhopal 23° 16’ 77° 25’ 523 1139 1554 28
Indore 22° 43’ 75° 48’ 567 1068 1814 13
Kota 25° 11’ 75° 51’ 257 734 - 30
Wardha 20° 36’ 78° 12’ - 1113 - 18
Secondary zone
Jabalpur 23° 10’ 79° 57’ 393 1548 1401 22
Amravati 20° 56’ 77° 47’ - 856 - 19
Belgaum 15° 51’ 74° 32’ 753 1112 - 18
Tertiary zone
Hyderabad 17° 27’ 75° 54’ 540 909 1758 26
To simulate the potential yields of soybean we used the soybean crop growth model available
in the Decision Support Systems for Agro-technology Transfer (DSSAT) v 3.0 (Tsuji et al.
1994). The model needs inputs of daily weather data, soil, and the cultivar-specific parameters to
simulate the plant growth. Past weather data were obtained either from the India Meteorology
Department (Pune) or directly from the agricultural research stations that operate the
meteorological stations (Table 1.6). Annual rainfall at the selected locations ranged from 734 to
1548 mm and potential evapotranspiration (PET) from 1370 to 1814 mm. Simulations were
An Open Access Journal published by ICRISAT________________________________________________________________________________________________________
SAT eJournal | ejournal.icrisat.org August 2006 | Volume 2 | Issue 1
12
performed for the period ranging from 13 to 30 years depending upon the availability of data for
the benchmark site. Wherever solar radiation data were not available, these were estimated from
maximum and minimum temperatures.
The soils in the soybean-growing regions in India are mainly Vertisols and associated soils.
The soils data were obtained from the soil survey reports published by the National Bureau of
Soil Survey and Land Use Planning, Nagpur, India (Lal et al. 1994). For a given benchmark site
the data of the nearest soil series were used for this analysis. The soils data file needed to execute
the soybean model was created by using the software available in DSSAT and the data on soil
characteristics of a location. This program estimated saturation, upper and lower limits of water
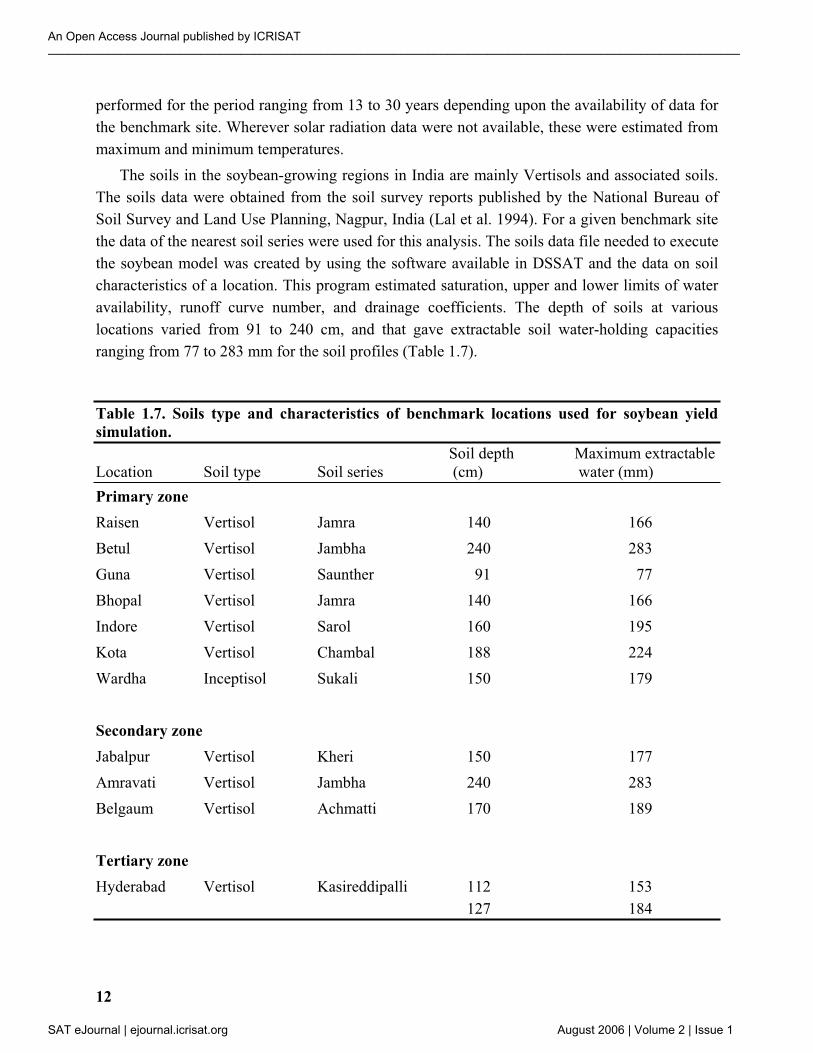
availability, runoff curve number, and drainage coefficients. The depth of soils at various
locations varied from 91 to 240 cm, and that gave extractable soil water-holding capacities
ranging from 77 to 283 mm for the soil profiles (Table 1.7).
Table 1.7. Soils type and characteristics of benchmark locations used for soybean yield
simulation.
Soil depth Maximum extractable
Location Soil type Soil series (cm) water (mm)
Primary zone
Raisen Vertisol Jamra 140 166
Betul Vertisol Jambha 240 283
Guna Vertisol Saunther 91 77
Bhopal Vertisol Jamra 140 166
Indore Vertisol Sarol 160 195
Kota Vertisol Chambal 188 224
Wardha Inceptisol Sukali 150 179
Secondary zone
Jabalpur Vertisol Kheri 150 177
Amravati Vertisol Jambha 240 283
Belgaum Vertisol Achmatti 170 189
Tertiary zone
Hyderabad Vertisol Kasireddipalli 112 153
127 184
An Open Access Journal published by ICRISAT________________________________________________________________________________________________________
SAT eJournal | ejournal.icrisat.org August 2006 | Volume 2 | Issue 1
13
The simulations were performed for a widely cultivated cultivar (PK 472) for which the
genetic coefficients were determined using crop growth and development data from the
International Crops Research Institute for the Semi-Arid Tropics (ICRISAT), Patancheru, India.
This cultivar matures in about 95–100 days. A plant population of 35 plants m-2
at 30-cm row
spacing was considered throughout the simulation study. The simulations were performed for a
sowing window of June 1 to July 28. The simulated crop was sown on a day when the soil
moisture content in the top 30-cm soil depth reached at least 40% of the extractable water-
holding capacity. Sowing was not done if this condition was not satisfied. The model outputs for
each year were: sowing and harvest dates, biomass and seed yields, and water balance
components of soybean. The means, standard deviations, and the minimum and maximum values
were also determined.
Simulated yields and yield gaps
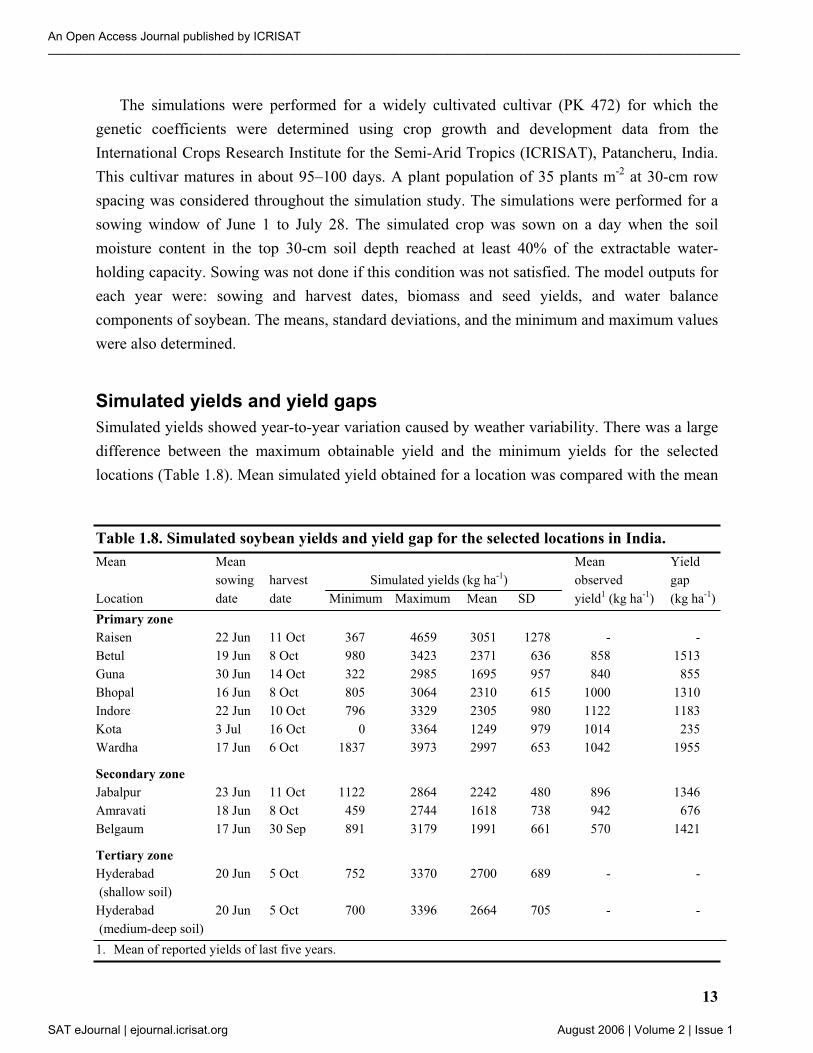
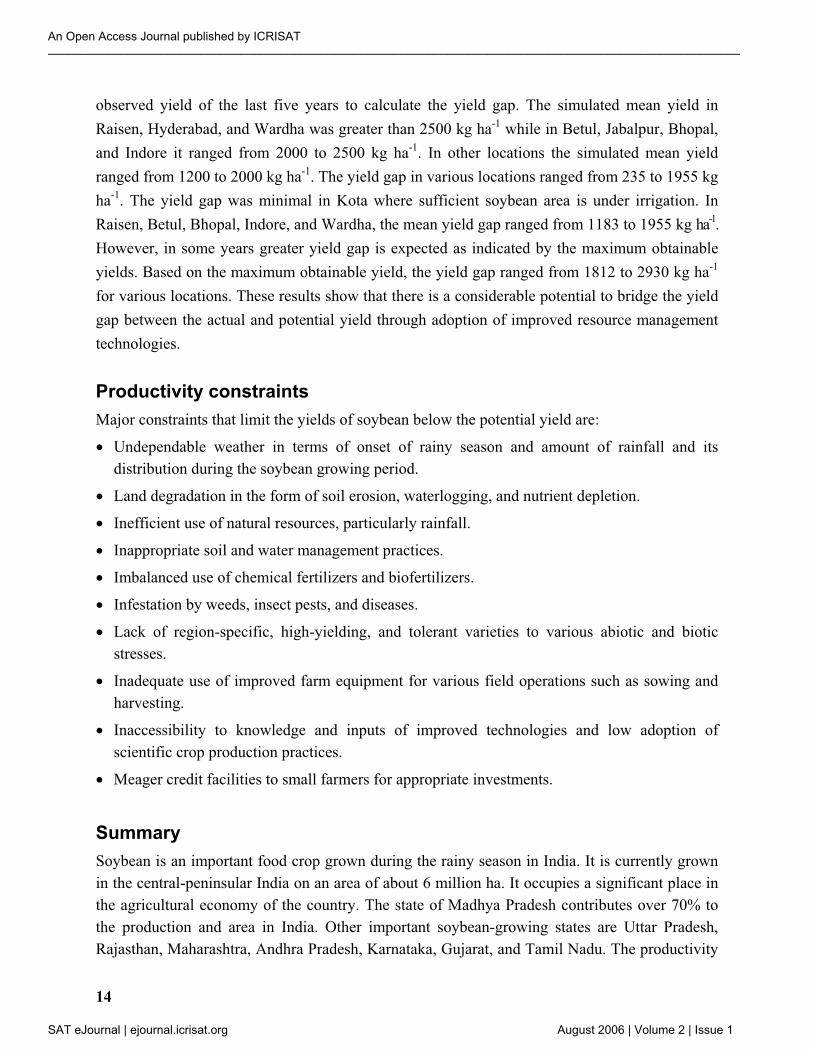
Simulated yields showed year-to-year variation caused by weather variability. There was a large
difference between the maximum obtainable yield and the minimum yields for the selected
locations (Table 1.8). Mean simulated yield obtained for a location was compared with the mean
Table 1.8. Simulated soybean yields and yield gap for the selected locations in India.
Mean Mean Mean Yield
sowing harvest Simulated yields (kg ha-1) observed gap
Location date date Minimum Maximum Mean SD yield1 (kg ha-1) (kg ha-1)
Primary zone
Raisen 22 Jun 11 Oct 367 4659 3051 1278 - -
Betul 19 Jun 8 Oct 980 3423 2371 636 858 1513
Guna 30 Jun 14 Oct 322 2985 1695 957 840 855
Bhopal 16 Jun 8 Oct 805 3064 2310 615 1000 1310
Indore 22 Jun 10 Oct 796 3329 2305 980 1122 1183
Kota 3 Jul 16 Oct 0 3364 1249 979 1014 235
Wardha 17 Jun 6 Oct 1837 3973 2997 653 1042 1955
Secondary zone
Jabalpur 23 Jun 11 Oct 1122 2864 2242 480 896 1346
Amravati 18 Jun 8 Oct 459 2744 1618 738 942 676
Belgaum 17 Jun 30 Sep 891 3179 1991 661 570 1421
Tertiary zone
Hyderabad 20 Jun 5 Oct 752 3370 2700 689 - -
(shallow soil)
Hyderabad 20 Jun 5 Oct 700 3396 2664 705 - -
(medium-deep soil)
1. Mean of reported yields of last five years.
An Open Access Journal published by ICRISAT________________________________________________________________________________________________________
SAT eJournal | ejournal.icrisat.org August 2006 | Volume 2 | Issue 1
14
observed yield of the last five years to calculate the yield gap. The simulated mean yield in
Raisen, Hyderabad, and Wardha was greater than 2500 kg ha-1
while in Betul, Jabalpur, Bhopal,
and Indore it ranged from 2000 to 2500 kg ha-1
. In other locations the simulated mean yield
ranged from 1200 to 2000 kg ha-1
. The yield gap in various locations ranged from 235 to 1955 kg
ha-1
. The yield gap was minimal in Kota where sufficient soybean area is under irrigation. In
Raisen, Betul, Bhopal, Indore, and Wardha, the mean yield gap ranged from 1183 to 1955 kg ha-1.
However, in some years greater yield gap is expected as indicated by the maximum obtainable
yields. Based on the maximum obtainable yield, the yield gap ranged from 1812 to 2930 kg ha-1
for various locations. These results show that there is a considerable potential to bridge the yield
gap between the actual and potential yield through adoption of improved resource management
technologies.
Productivity constraints
Major constraints that limit the yields of soybean below the potential yield are:
Undependable weather in terms of onset of rainy season and amount of rainfall and its
distribution during the soybean growing period.
Land degradation in the form of soil erosion, waterlogging, and nutrient depletion.
Inefficient use of natural resources, particularly rainfall.
Inappropriate soil and water management practices.
Imbalanced use of chemical fertilizers and biofertilizers.
Infestation by weeds, insect pests, and diseases.
Lack of region-specific, high-yielding, and tolerant varieties to various abiotic and biotic
stresses.
Inadequate use of improved farm equipment for various field operations such as sowing and
harvesting.
Inaccessibility to knowledge and inputs of improved technologies and low adoption of
scientific crop production practices.
Meager credit facilities to small farmers for appropriate investments.
Summary
Soybean is an important food crop grown during the rainy season in India. It is currently grown
in the central-peninsular India on an area of about 6 million ha. It occupies a significant place in
the agricultural economy of the country. The state of Madhya Pradesh contributes over 70% to
the production and area in India. Other important soybean-growing states are Uttar Pradesh,
Rajasthan, Maharashtra, Andhra Pradesh, Karnataka, Gujarat, and Tamil Nadu. The productivity
An Open Access Journal published by ICRISAT________________________________________________________________________________________________________
SAT eJournal | ejournal.icrisat.org August 2006 | Volume 2 | Issue 1
15
of soybean, however, continues to be low, and it is estimated at less than 1 t ha-1
. Most of the
increase in soybean production has come from area increase over the years. Potential mean
yields across locations ranged from 1249 to 3050 kg ha-1
, whereas the observed yields ranged
from 570 to 1120 kg ha-1
. Thus the mean yield gap across locations ranged from 235 to 1955 kg
ha-1
. If water availability is not limiting soybean production, then the yield gap across locations
ranges from 1810 to 2930 kg ha-1
. These results indicate that there is a tremendous scope for
improving soybean yields. Currently the majority of the farmers do not use recommended plant
protection or soil fertility management measures. Soil erosion is high in the Vertisol areas, thus
reducing plant nutrients in the soil. The farmers add plant nutrients that are just adequate to meet
the nutrient losses, and thus the yields are sustained at low levels. In order to bridge the yield
gap, improved soil, water, and nutrient management practices on watershed basis, along with
pest management, improved cultivars, use of improved farm machinery, and credit facilities to
the small and marginal farmers are recommended for increasing productivity of soybean-based
systems.
A good potential exists in India to increase soybean productivity. The soybean-growing
region is endowed with relatively good quality soils and rainfall, which varies from 730 to 1550
mm annually. Through adoption of integrated watershed management approach, productivity of
soybean-based systems could be substantially improved. However, the small and marginal
farmers in the rural areas are constrained with inaccessibility to knowledge and scientific inputs
and lack of credit availability. There is a scope for at least doubling the soybean productivity in
the region by appropriate policy development and strengthening execution at grass-root level.
An Open Access Journal published by ICRISAT________________________________________________________________________________________________________
SAT eJournal | ejournal.icrisat.org August 2006 | Volume 2 | Issue 1
16
Section 2: Potential yields and yield gaps of selected crops
in northeastern Thailand
Northeastern Thailand is situated between 14–19° N latitude and 101–106° E longitude. The area
is about 17 million ha or one-third of the whole country. It covers 19 provinces: Ka La Sin, Khon
Kaen, Chaiyaphum, Yasothon, Nakhon Phanom, Nakhon Ratchasima, Burirum, Maha Sarakham,
Roi Et, Loei, Sri Sa Ket, Sakon Nakhon, Surin, Nong Kai, Udon Thani, Ubon Ratchathani,
Mukdahan, Nong Bua Lam Phu, and Amnat Charoen (Fig. 2.1).
Despite the same amount of rainfall, northeastern Thailand is drier than northern and central
Thailand because of the short rainy season. Farming is the main occupation and only 20% of
total agricultural area is under irrigation. Land has potentially low productivity. The existing
problems are salt affected soil, sandy soil, and soil erosion.
Topography
Northeastern Thailand or the “Khorat Plateau” is characterized by shallow basin (saucer-shaped
basin) and slopes rather gently southeastward. The plateau consists of flat-topped mountain and
dissected peneplain surface with undulating features. The elevation varies from 200 m above
mean sea level (msl). The rim of the plateau is lifted and thus forms cuestas like mountain; steep
escarpment bounded the plateau on the south and the west of the region. The elevation may rise
to about 200–1000 m above msl. On the middle and the north of the region, Pu Pan range is
located with bended shape directionally northwest and southeast. The elevation is greater than
600 m above msl. Considering differences in the geology, this region can be divided into 6 parts
as given below.
Western Highland
The area is distinct by hilly to mountainous topography, except the area close to northeastern part
which is undulating to rolling. It covers the province of Loei and some part of Udon Thani, Khon
Kaen, Chaiyaphum, and Nakhon Ratchasima.
Northern Highland
The area is formed as thin strip on the northernmost part of the region. The topography is rolling
to hilly lying underlaid by lower and middle Khorat group. It covers some part of Nong Kai
province and Nakhon Phanom province.
An Open Access Journal published by ICRISAT________________________________________________________________________________________________________
SAT eJournal | ejournal.icrisat.org August 2006 | Volume 2 | Issue 1
17
Sakhon Nakhon Basin
The basin is in the north of the region. Sakon Nakhon province is located in the middle of the
basin. The basin covers the provinces of Nakhon Phanom, Sakon Nakhon, Udon Thani, and
Nong Kai.
Central Highland
The area is characterized by rolling to hilly topography. The range of Pu Pan is situated in the
southeastern part.
Khorat Basin
The basin is located in the south of the region. Roi Et province and the north of Nakhon
Ratchasima province are in the middle of the basin. Khorat Basin also covers the provinces of
Surin, Sri Sa Ket, Nakhon Ratchasima, Ubon Ratchathani, Roi Et, Burirum, Maha Sarakham,
Chaiyaphum, Yasothon, Khon Kaen, and Ka La Sin. The topography is flat or almost flat to
undulating.
Southern Lowland
The area is situated on the southernmost part of the region, where Panom Dong Rak range is
formed as a strip on the southernmost part. The topography slopes northward towards Mun river,
and is characterized by flat to undulating land with some hilly topography in many areas
especially the provinces of Surin and Burirum and the southeast of Nakhon Ratchasima province.
From the characterization given above, northeastern Thailand can be broadly divided into
highlands, uplands, and lowlands (Fig. 2.2).
Climate
The northeastern Thailand, located in the low latitude, is influenced by tropical low rainfall
climate and wet-dry monsoonal or tropical Savannah climate. During November to February, the
area is influenced by the northeast monsoon from the Eurasian continent resulting in cooler and
dry weather over the whole region. Southwest monsoon lasting from May to September brings
warm and moist weather from the Indian Ocean to the region.
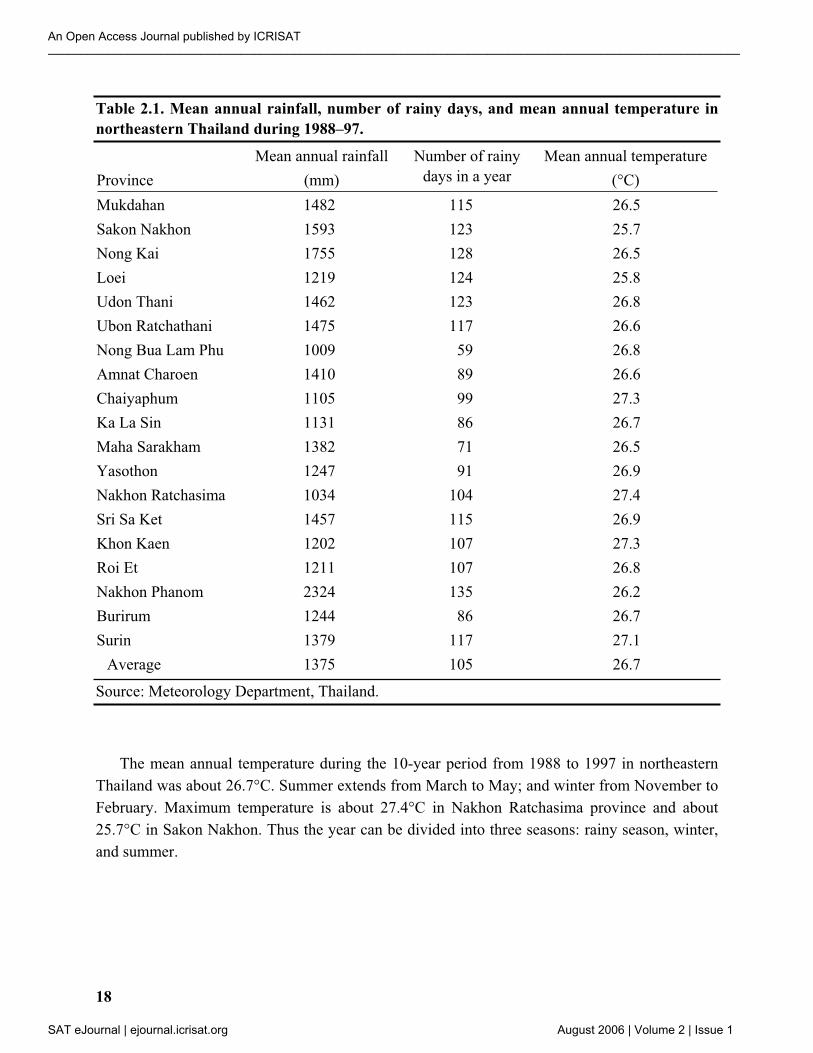
The mean annual rainfall in northeastern Thailand is 1,375 mm (Table 2.1 and Fig. 2.3). In
the west and the middle of the region such as Chaiyaphum, Nakhon Ratchasima, Loei, Khon
Kaen, and Roi Et province, the rainfall is lower than in the east and the north and is about 1,000–
1,400 mm. Average number of rainy days in a year in this area is 108. On the east and the north
such as Nakhon Phanom, Sakon Nakhon, Nong Kai, Ubon Ratchathani, Udon Thani, and
Mukdahan provinces, the annual rainfall is about 1,500–2,300 mm. The highest rainfall (2324
mm) is in Nakhon Phanom province.
An Open Access Journal published by ICRISAT________________________________________________________________________________________________________
SAT eJournal | ejournal.icrisat.org August 2006 | Volume 2 | Issue 1
18
Table 2.1. Mean annual rainfall, number of rainy days, and mean annual temperature in
northeastern Thailand during 1988–97.
Province
Mean annual rainfall
(mm)
Number of rainy
days in a year
Mean annual temperature
(°C)
Mukdahan 1482 115 26.5
Sakon Nakhon 1593 123 25.7
Nong Kai 1755 128 26.5
Loei 1219 124 25.8
Udon Thani 1462 123 26.8
Ubon Ratchathani 1475 117 26.6
Nong Bua Lam Phu 1009 59 26.8
Amnat Charoen 1410 89 26.6
Chaiyaphum 1105 99 27.3
Ka La Sin 1131 86 26.7
Maha Sarakham 1382 71 26.5
Yasothon 1247 91 26.9
Nakhon Ratchasima 1034 104 27.4
Sri Sa Ket 1457 115 26.9
Khon Kaen 1202 107 27.3
Roi Et 1211 107 26.8
Nakhon Phanom 2324 135 26.2
Burirum 1244 86 26.7
Surin 1379 117 27.1
Average 1375 105 26.7
Source: Meteorology Department, Thailand.
The mean annual temperature during the 10-year period from 1988 to 1997 in northeastern
Thailand was about 26.7°C. Summer extends from March to May; and winter from November to
February. Maximum temperature is about 27.4°C in Nakhon Ratchasima province and about
25.7°C in Sakon Nakhon. Thus the year can be divided into three seasons: rainy season, winter,
and summer.
An Open Access Journal published by ICRISAT________________________________________________________________________________________________________
SAT eJournal | ejournal.icrisat.org August 2006 | Volume 2 | Issue 1
19
Rainy season
Rainy season starts from May end or the beginning of June and extends up to the beginning of
October due to the effect of the southwest monsoon. Because the ranges of Pnetchabun on the
northeast and Dong Phayayen on the west, and the ranges of San Khampaeng and Phanom Dong
Rak on the south serve as barriers, the rainfall due to the southwest monsoon is lower than the
rainfall due to the depression from the South China Sea.
Winter
Winter lasts from mid-October to mid-February and is caused by the northeast monsoon from
China which brings cool and dry climatic mass without vapor to the area. Thus it remains cooler
in the north while the south remains warm.
Summer
The season extends from February to the end of May and is caused by the southeast monsoon
from the South China Sea and the Gulf of Thailand. Because the northeast region is located far
away from the Gulf of Thailand, the climate is hot and very dry in the region.
Soils
As recorded by the Survey Division, Thailand in 1996, northeastern Thailand has 9 soil sub-
orders. These are: Usterts, Aquepts, Tropepts, Ustolls, Aqualfs, Ustalfs, Aquults, Ustults, and
Udults (Fig. 2.4). The soils are characterized by sandy or sandy loam to sandy clay loam texture
with low to medium fertility. Ustults is the largest one and mainly used for field crops, while
Aquults is less than Ustults which is flat and mainly used for paddy rice.
Watershed area
Severity of land shortage and increased population has resulted in the encroachment of forest
area for annual cultivation. Changes in economic system from agriculture to industry has resulted
in increased demand for water. Unfortunately, surface water is available only in rainy season and
some of it flows into the sea.
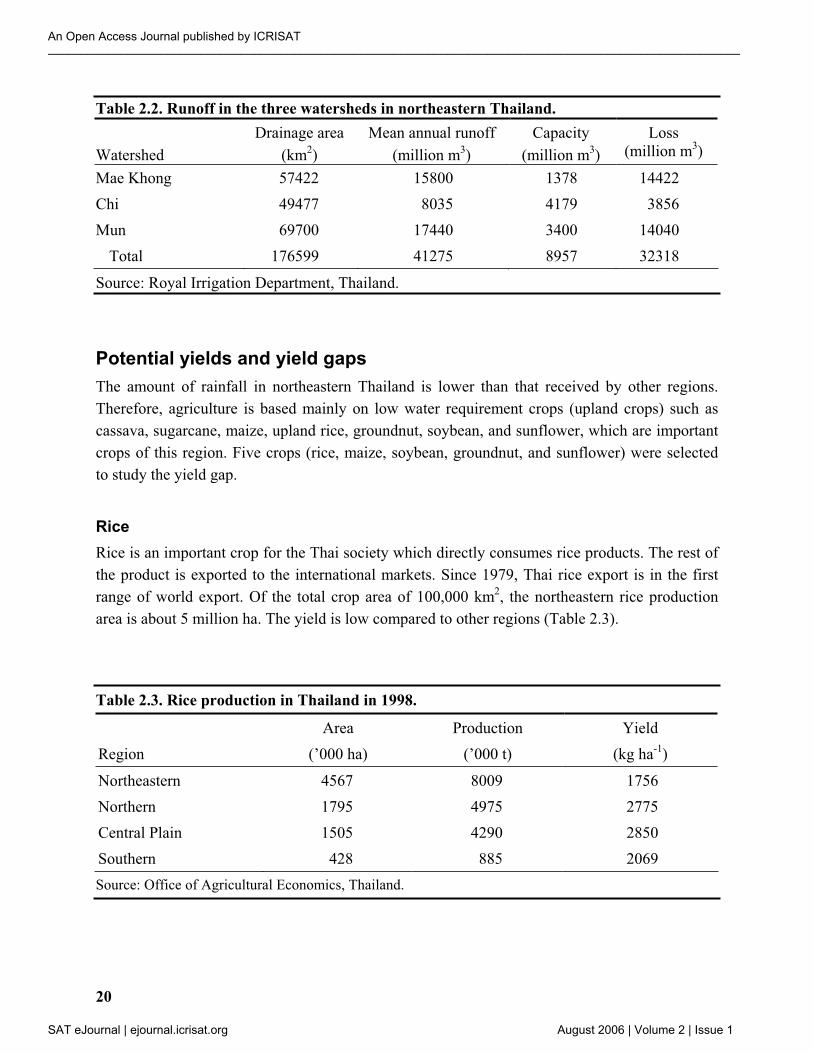
Soil erosion is the main cause of degradation of natural resources (Table 2.2 and Fig. 2.5).
Sedimentation is the secondary process after soil erosion. The sediments may be transported to
streams or reservoirs. Soil erosion has caused loss of nutrients from the soil. This has resulted in
decreased crop production and increase in fertilizer application every year.
An Open Access Journal published by ICRISAT________________________________________________________________________________________________________
SAT eJournal | ejournal.icrisat.org August 2006 | Volume 2 | Issue 1
20
Table 2.2. Runoff in the three watersheds in northeastern Thailand.
Watershed
Drainage area
(km2)
Mean annual runoff
(million m3)
Capacity
(million m3)
Loss
(million m3)
Mae Khong
Chi
Mun
57422
49477
69700
15800
8035
17440
1378
4179
3400
14422
3856
14040
Total 176599 41275 8957 32318
Source: Royal Irrigation Department, Thailand.
Potential yields and yield gaps
The amount of rainfall in northeastern Thailand is lower than that received by other regions.
Therefore, agriculture is based mainly on low water requirement crops (upland crops) such as
cassava, sugarcane, maize, upland rice, groundnut, soybean, and sunflower, which are important
crops of this region. Five crops (rice, maize, soybean, groundnut, and sunflower) were selected
to study the yield gap.
Rice
Rice is an important crop for the Thai society which directly consumes rice products. The rest of
the product is exported to the international markets. Since 1979, Thai rice export is in the first
range of world export. Of the total crop area of 100,000 km2, the northeastern rice production
area is about 5 million ha. The yield is low compared to other regions (Table 2.3).
Table 2.3. Rice production in Thailand in 1998.
Region
Area
(’000 ha)
Production
(’000 t)
Yield
(kg ha-1
)
Northeastern
Northern
Central Plain
Southern
4567
1795
1505
428
8009
4975
4290
885
1756
2775
2850
2069
Source: Office of Agricultural Economics, Thailand.
An Open Access Journal published by ICRISAT________________________________________________________________________________________________________
SAT eJournal | ejournal.icrisat.org August 2006 | Volume 2 | Issue 1
21
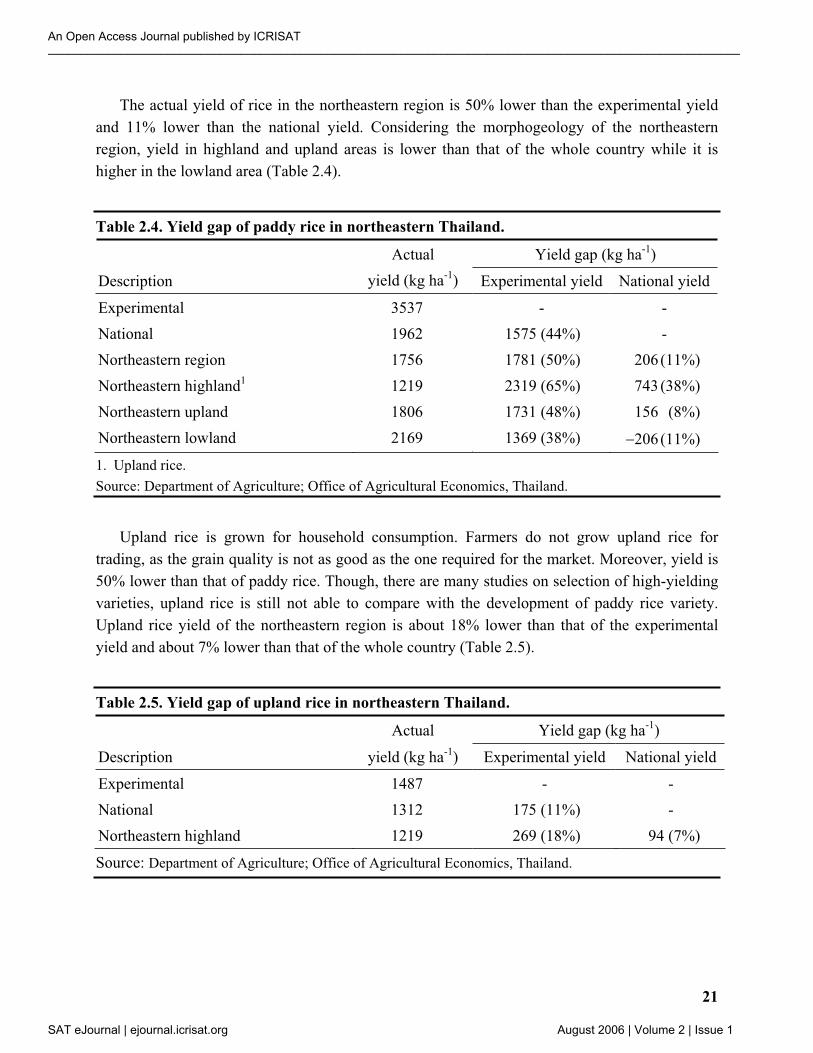
The actual yield of rice in the northeastern region is 50% lower than the experimental yield
and 11% lower than the national yield. Considering the morphogeology of the northeastern
region, yield in highland and upland areas is lower than that of the whole country while it is
higher in the lowland area (Table 2.4).
Table 2.4. Yield gap of paddy rice in northeastern Thailand.
Yield gap (kg ha-1
)
Description
Actual
yield (kg ha-1
) Experimental yield National yield
Experimental
National
Northeastern region
Northeastern highland1
Northeastern upland
Northeastern lowland
3537
1962
1756
1219
1806
2169
-
1575 (44%)
1781 (50%)
2319 (65%)
1731 (48%)
1369 (38%)
-
-
206 (11%)
743 (38%)
156 (8%)
206 (11%)
1. Upland rice.
Source: Department of Agriculture; Office of Agricultural Economics, Thailand.
Upland rice is grown for household consumption. Farmers do not grow upland rice for
trading, as the grain quality is not as good as the one required for the market. Moreover, yield is
50% lower than that of paddy rice. Though, there are many studies on selection of high-yielding
varieties, upland rice is still not able to compare with the development of paddy rice variety.
Upland rice yield of the northeastern region is about 18% lower than that of the experimental
yield and about 7% lower than that of the whole country (Table 2.5).
Table 2.5. Yield gap of upland rice in northeastern Thailand.
Actual Yield gap (kg ha-1
)
Description yield (kg ha-1
) Experimental yield National yield
Experimental
National
Northeastern highland
1487
1312
1219
-
175 (11%)
269 (18%)
-
-
94 (7%)
Source: Department of Agriculture; Office of Agricultural Economics, Thailand.
An Open Access Journal published by ICRISAT________________________________________________________________________________________________________
SAT eJournal | ejournal.icrisat.org August 2006 | Volume 2 | Issue 1
22
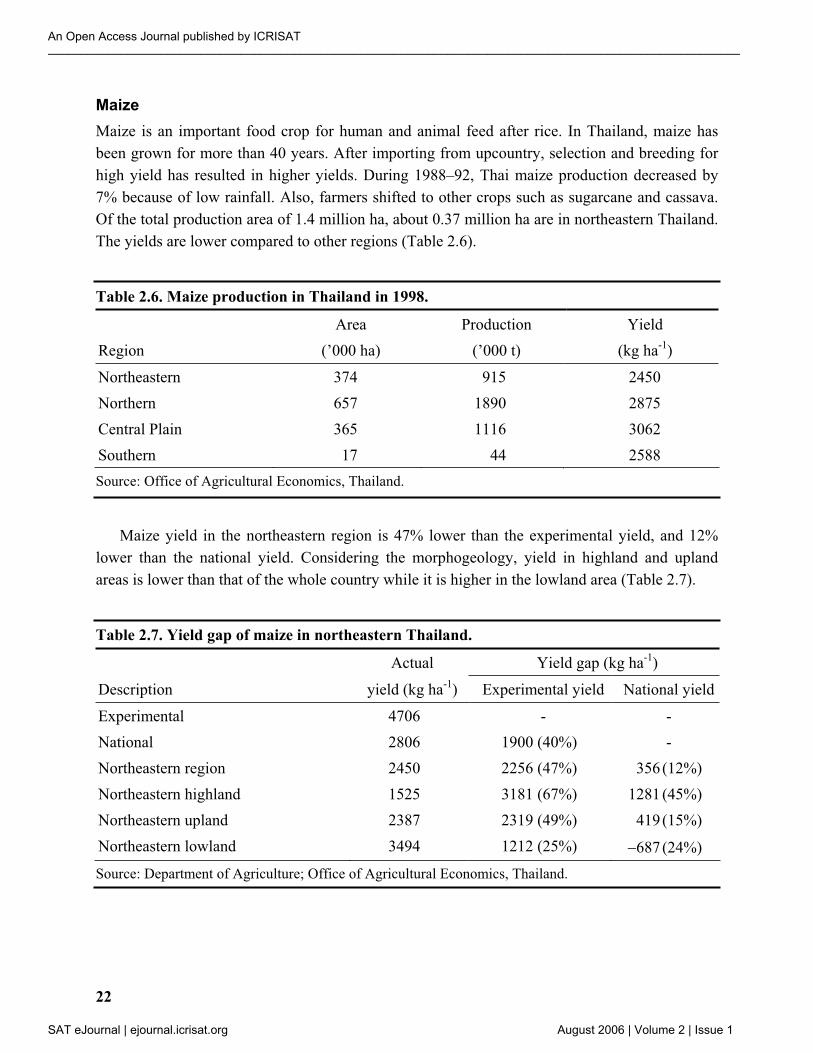
Maize
Maize is an important food crop for human and animal feed after rice. In Thailand, maize has
been grown for more than 40 years. After importing from upcountry, selection and breeding for
high yield has resulted in higher yields. During 1988–92, Thai maize production decreased by
7% because of low rainfall. Also, farmers shifted to other crops such as sugarcane and cassava.
Of the total production area of 1.4 million ha, about 0.37 million ha are in northeastern Thailand.
The yields are lower compared to other regions (Table 2.6).
Table 2.6. Maize production in Thailand in 1998.
Region
Area
(’000 ha)
Production
(’000 t)
Yield
(kg ha-1
)
Northeastern
Northern
Central Plain
Southern
374
657
365
17
915
1890
1116
44
2450
2875
3062
2588
Source: Office of Agricultural Economics, Thailand.
Maize yield in the northeastern region is 47% lower than the experimental yield, and 12%
lower than the national yield. Considering the morphogeology, yield in highland and upland
areas is lower than that of the whole country while it is higher in the lowland area (Table 2.7).
Table 2.7. Yield gap of maize in northeastern Thailand.
Actual Yield gap (kg ha-1
)
Description yield (kg ha-1
) Experimental yield National yield
Experimental
National
Northeastern region
Northeastern highland
Northeastern upland
Northeastern lowland
4706
2806
2450
1525
2387
3494
-
1900 (40%)
2256 (47%)
3181 (67%)
2319 (49%)
1212 (25%)
-
-
356 (12%)
1281 (45%)
419 (15%)
687 (24%)
Source: Department of Agriculture; Office of Agricultural Economics, Thailand.
An Open Access Journal published by ICRISAT________________________________________________________________________________________________________
SAT eJournal | ejournal.icrisat.org August 2006 | Volume 2 | Issue 1
23
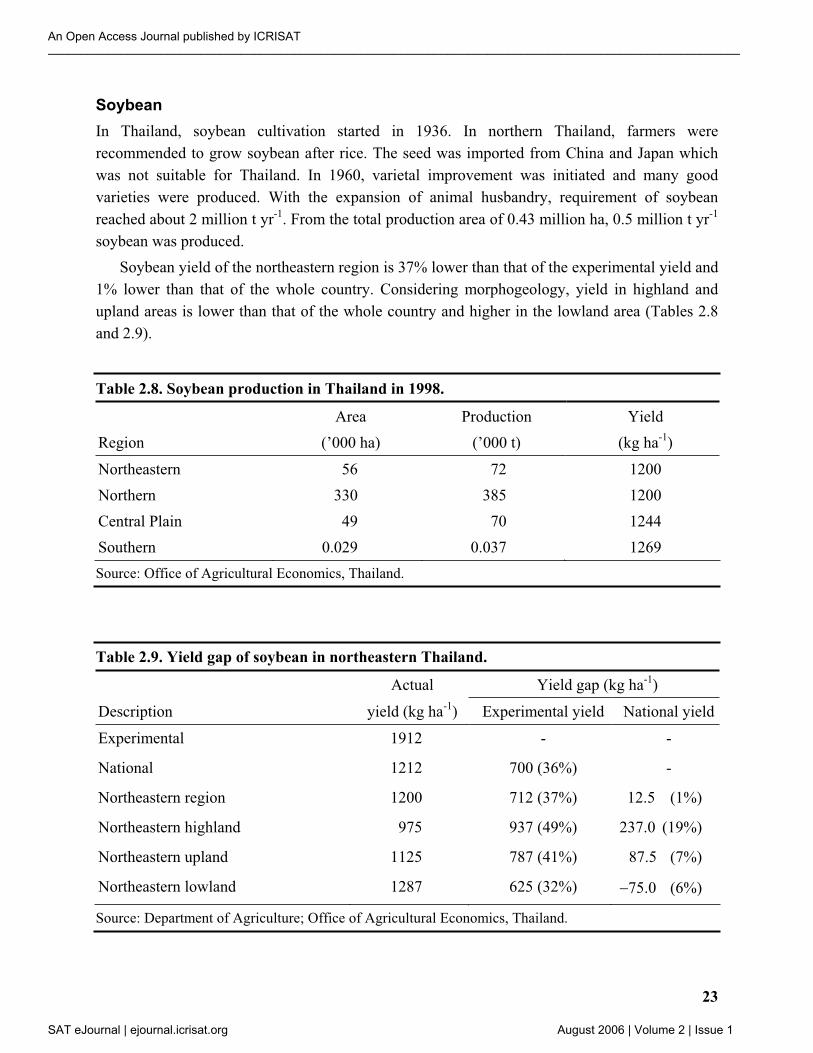
Soybean
In Thailand, soybean cultivation started in 1936. In northern Thailand, farmers were
recommended to grow soybean after rice. The seed was imported from China and Japan which
was not suitable for Thailand. In 1960, varietal improvement was initiated and many good
varieties were produced. With the expansion of animal husbandry, requirement of soybean
reached about 2 million t yr-1
. From the total production area of 0.43 million ha, 0.5 million t yr-1
soybean was produced.
Soybean yield of the northeastern region is 37% lower than that of the experimental yield and
1% lower than that of the whole country. Considering morphogeology, yield in highland and
upland areas is lower than that of the whole country and higher in the lowland area (Tables 2.8
and 2.9).
Table 2.8. Soybean production in Thailand in 1998.
Region
Area
(’000 ha)
Production
(’000 t)
Yield
(kg ha-1
)
Northeastern
Northern
Central Plain
Southern
56
330
49
0.029
72
385
70
0.037
1200
1200
1244
1269
Source: Office of Agricultural Economics, Thailand.
Table 2.9. Yield gap of soybean in northeastern Thailand.
Actual Yield gap (kg ha-1
)
Description yield (kg ha-1
) Experimental yield National yield
Experimental
National
Northeastern region
Northeastern highland
Northeastern upland
Northeastern lowland
1912
1212
1200
975
1125
1287
-
700 (36%)
712 (37%)
937 (49%)
787 (41%)
625 (32%)
-
-
12.5 (1%)
237.0 (19%)
87.5 (7%)
75.0 (6%)
Source: Department of Agriculture; Office of Agricultural Economics, Thailand.
An Open Access Journal published by ICRISAT________________________________________________________________________________________________________
SAT eJournal | ejournal.icrisat.org August 2006 | Volume 2 | Issue 1
24
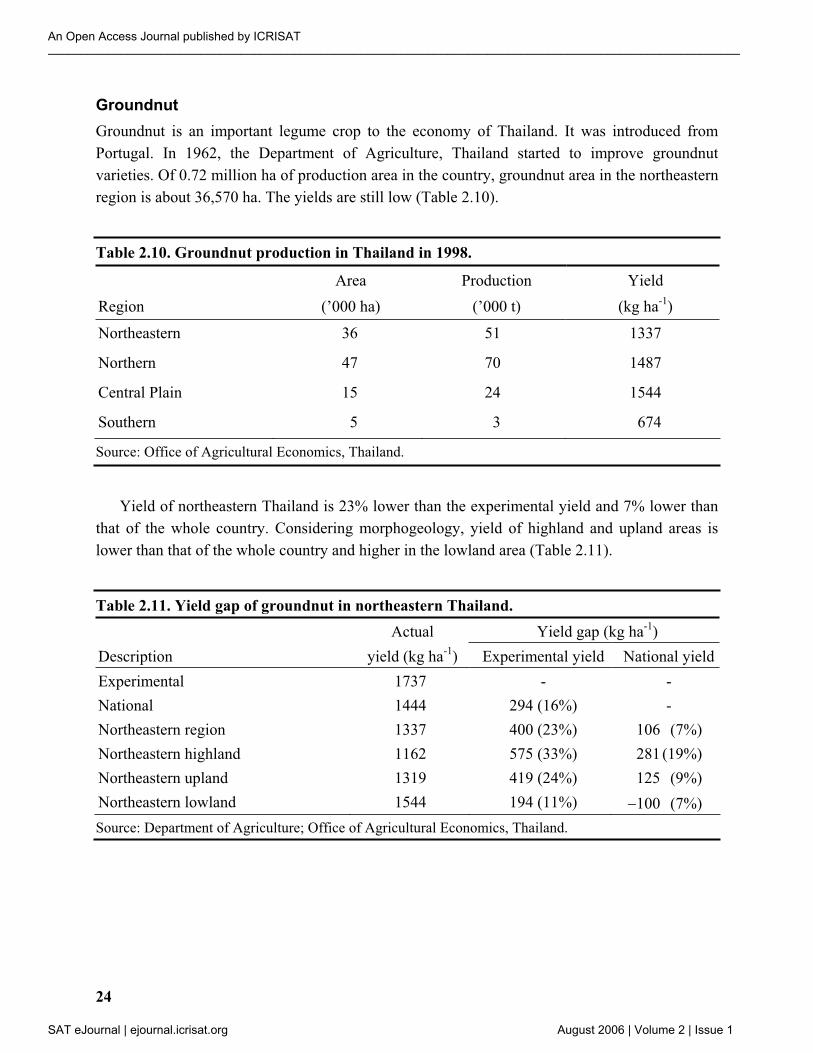
Groundnut
Groundnut is an important legume crop to the economy of Thailand. It was introduced from
Portugal. In 1962, the Department of Agriculture, Thailand started to improve groundnut
varieties. Of 0.72 million ha of production area in the country, groundnut area in the northeastern
region is about 36,570 ha. The yields are still low (Table 2.10).
Table 2.10. Groundnut production in Thailand in 1998.
Region
Area
(’000 ha)
Production
(’000 t)
Yield
(kg ha-1
)
Northeastern
Northern
Central Plain
Southern
36
47
15
5
51
70
24
3
1337
1487
1544
674
Source: Office of Agricultural Economics, Thailand.
Yield of northeastern Thailand is 23% lower than the experimental yield and 7% lower than
that of the whole country. Considering morphogeology, yield of highland and upland areas is
lower than that of the whole country and higher in the lowland area (Table 2.11).
Table 2.11. Yield gap of groundnut in northeastern Thailand.
Actual Yield gap (kg ha-1
)
Description yield (kg ha-1
) Experimental yield National yield
Experimental
National
Northeastern region
Northeastern highland
Northeastern upland
Northeastern lowland
1737
1444
1337
1162
1319
1544
-
294 (16%)
400 (23%)
575 (33%)
419 (24%)
194 (11%)
-
-
106 (7%)
281 (19%)
125 (9%)
100 (7%)
Source: Department of Agriculture; Office of Agricultural Economics, Thailand.
An Open Access Journal published by ICRISAT________________________________________________________________________________________________________
SAT eJournal | ejournal.icrisat.org August 2006 | Volume 2 | Issue 1
25
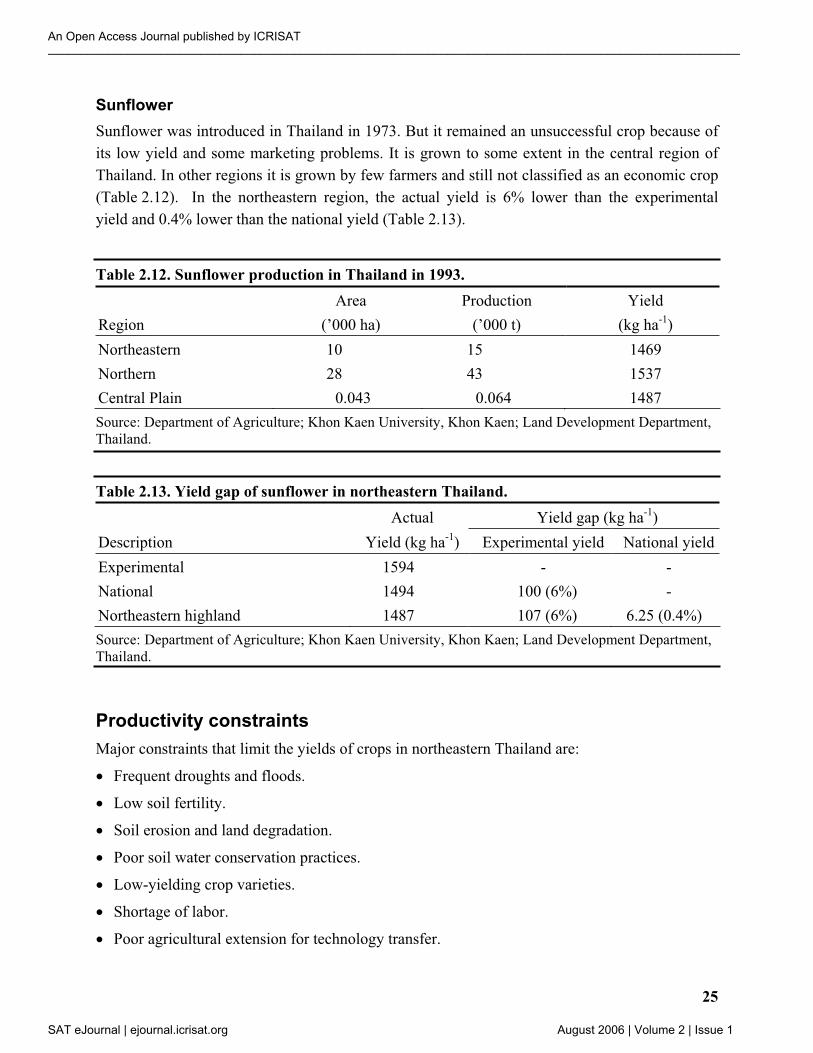
Sunflower
Sunflower was introduced in Thailand in 1973. But it remained an unsuccessful crop because of
its low yield and some marketing problems. It is grown to some extent in the central region of
Thailand. In other regions it is grown by few farmers and still not classified as an economic crop
(Table 2.12). In the northeastern region, the actual yield is 6% lower than the experimental
yield and 0.4% lower than the national yield (Table 2.13).
Table 2.12. Sunflower production in Thailand in 1993.
Region
Area
(’000 ha)
Production
(’000 t)
Yield
(kg ha-1
)
Northeastern
Northern
Central Plain
10
28
0.043
15
43
0.064
1469
1537
1487
Source: Department of Agriculture; Khon Kaen University, Khon Kaen; Land Development Department,
Thailand.
Table 2.13. Yield gap of sunflower in northeastern Thailand.
Actual Yield gap (kg ha-1
)
Description Yield (kg ha-1
) Experimental yield National yield
Experimental
National
Northeastern highland
1594
1494
1487
-
100 (6%)
107 (6%)
-
-
6.25 (0.4%)
Source: Department of Agriculture; Khon Kaen University, Khon Kaen; Land Development Department,
Thailand.
Productivity constraints
Major constraints that limit the yields of crops in northeastern Thailand are:
Frequent droughts and floods.
Low soil fertility.
Soil erosion and land degradation.
Poor soil water conservation practices.
Low-yielding crop varieties.
Shortage of labor.
Poor agricultural extension for technology transfer.
An Open Access Journal published by ICRISAT________________________________________________________________________________________________________
SAT eJournal | ejournal.icrisat.org August 2006 | Volume 2 | Issue 1
26
Uncertainty of prices and marketing problems.
Uncertainty of tenure as a disincentive to invest in land development.
Poor credit facilities and high interest rates by private money lenders.
Summary
Northeastern Thailand has 17 million ha or constitutes one-third of the country. It covers 19
provinces and plays a significant role in the agricultural economy of the country. Despite the
same amount of rainfall as in the northern and central Thailand, northeastern Thailand is drier
and has relatively short rainy season. Northeastern Thailand can be broadly divided into
highlands, uplands, and lowlands. Mean rainfall in the region is about 1375 mm. Soils are sandy
or sandy loam to sandy clay loam in texture with low to medium soil fertility. Increased
population and shortage of land has resulted in encroachment of forest area for annual
cultivation. This in turn has resulted in land degradation because of soil erosion and loss of soil
fertility and thus crop yields obtained are lower than the potential yields. Yield gap of paddy rice
ranges from 1369 to 2319 kg ha-1
(38 to 65%) and that of upland rice ranges from 175 to 269 kg
ha-1
(11 to 18%) across northeastern Thailand. The yield gap of upland crops ranges from 1212
to 3181 kg ha-1
(25 to 67%) in maize, 32 to 49% in soybean (625 to 937 kg ha-1
), and 11 to 33%
in groundnut (194 to 575 kg ha-1
). Sunflower has not been able to establish as a successful crop
with the farmers. Bridging the yield gap of upland cropping systems would require adoption of
improved soil and water conservation practices, integrated soil fertility management including
the greater use of legumes, improved cultivars, stable land tenure system, affordable credit
facilities and assured prices, and marketing of agricultural produce.
An Open Access Journal published by ICRISAT________________________________________________________________________________________________________
SAT eJournal | ejournal.icrisat.org August 2006 | Volume 2 | Issue 1
27
Section 3: Potential yields and yield gaps of selected crops in northern Vietnam
Vietnam lies between 8° 33’ to 23° 21’ N and 102° 10’ to 109° 26’ E. Administratively, the
country is divided into 62 provinces. Although a humid country, it has tropical, subtropical, and
temperate climates in pockets. This diverse climate provides for harnessing ecological
productivity through various crops and cropping systems. Rice and maize among cereals, and
groundnut, soybean, and mung bean among legumes are important crops in Vietnam (Chinh et
al. 2001). Although land area of Vietnam is more than 330,000 km2, about 75% is covered by
mountains and midlands. Cultivated area is about 8.3 million ha, of which 4.2 million ha is
occupied by rice. Arable area can be expanded up to 100 million ha or more, in plateau and
slopes (<15% slope) with probability of drought and unfavorable growth conditions for crops.
Average area for cultivation per head is approximately 0.1 ha. It is therefore necessary to
enhance use of improved land management methods to ensure sustainability of land resources.
Agroecological zones of Vietnam
Vietnam has been divided into 9 AEZs based on soil type, rainfall, temperature, and length of
growing period (Fig. 3.1). These zones are:
AEZ I – North-west
AEZ II – North-Hoang Lien Son
AEZ III – North-east
AEZ IV – Red River Delta
AEZ V – North-central Coast
AEZ VI – Central Highlands
AEZ VII – South-central Coast
AEZ VIII – North-east South
AEZ IX – Mekong River Delta
Northern Vietnam – the study area
Northern Vietnam comprises AEZ I to AEZ IV (Fig. 3.1). There are 25 provinces in AEZ I to
AEZ IV (Fig. 3.2). The relief of the area consists of highlands, uplands, and lowlands (Fig. 3.3).
About one-third area of northern Vietnam comprises of rainfed sloping lands. The yield gap
study was conducted in the four provinces, namely Phu Tho, Vinh Phuc, Ha Tay, and Ninh Binh.
An Open Access Journal published by ICRISAT________________________________________________________________________________________________________
SAT eJournal | ejournal.icrisat.org August 2006 | Volume 2 | Issue 1
28
Physical environment
Topography
The rainfed sloping lands vary from densely packed hills to plains with isolated knolls. Hills are
rounded, with level tops and convex slopes of 5–40°. Most slopes are 20–25° with elevations
ranging between 15 m and 200 m above sea level. Between the hills are narrow valleys with
alluvial soils used for irrigated rice cultivation (Long et al. 1999).
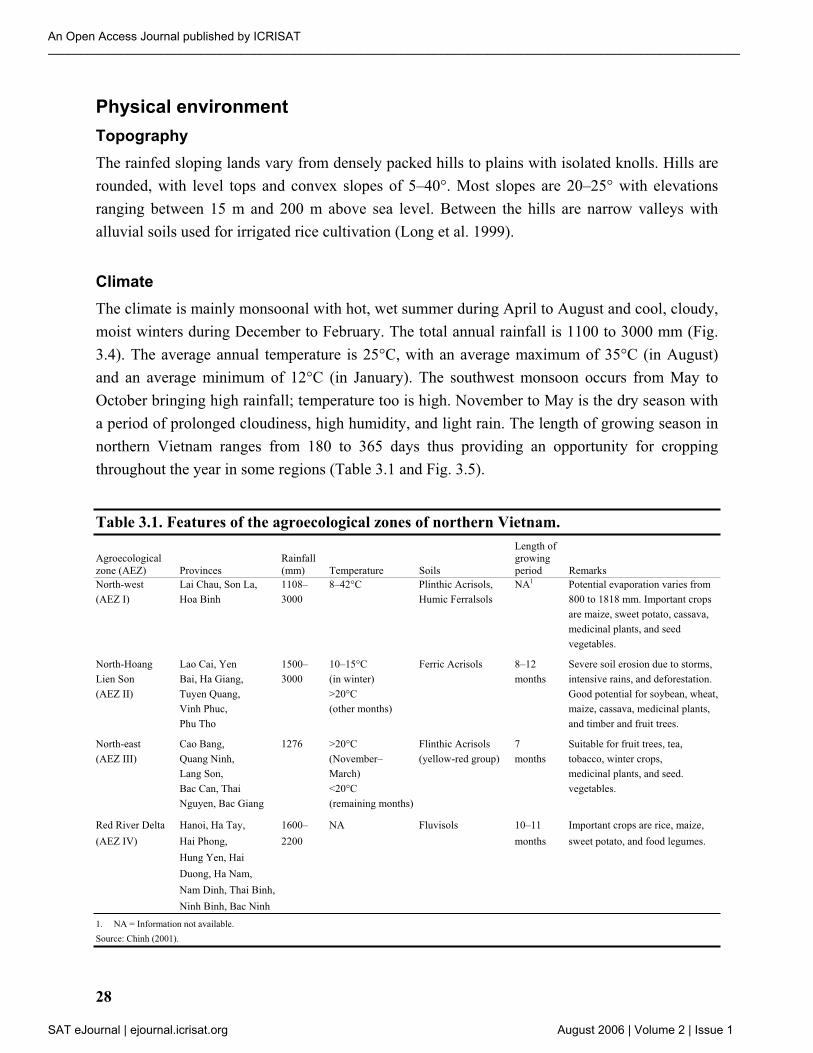
Climate
The climate is mainly monsoonal with hot, wet summer during April to August and cool, cloudy,
moist winters during December to February. The total annual rainfall is 1100 to 3000 mm (Fig.
3.4). The average annual temperature is 25°C, with an average maximum of 35°C (in August)
and an average minimum of 12°C (in January). The southwest monsoon occurs from May to
October bringing high rainfall; temperature too is high. November to May is the dry season with
a period of prolonged cloudiness, high humidity, and light rain. The length of growing season in
northern Vietnam ranges from 180 to 365 days thus providing an opportunity for cropping
throughout the year in some regions (Table 3.1 and Fig. 3.5).
Table 3.1. Features of the agroecological zones of northern Vietnam.
Length of
Agroecological Rainfall growing
zone (AEZ) Provinces (mm) Temperature Soils period Remarks
North-west Lai Chau, Son La, 1108– 8–42°C Plinthic Acrisols, NA1 Potential evaporation varies from
(AEZ I) Hoa Binh 3000 Humic Ferralsols 800 to 1818 mm. Important crops
are maize, sweet potato, cassava,
medicinal plants, and seed
vegetables.
North-Hoang Lao Cai, Yen 1500– 10–15°C Ferric Acrisols 8–12 Severe soil erosion due to storms,
Lien Son Bai, Ha Giang, 3000 (in winter) months intensive rains, and deforestation.
(AEZ II) Tuyen Quang, >20°C Good potential for soybean, wheat,
Vinh Phuc, (other months) maize, cassava, medicinal plants,
Phu Tho and timber and fruit trees.
North-east Cao Bang, 1276 >20°C Flinthic Acrisols 7 Suitable for fruit trees, tea,
(AEZ III) Quang Ninh, (November– (yellow-red group) months tobacco, winter crops,
Lang Son, March) medicinal plants, and seed.
Bac Can, Thai <20°C vegetables.
Nguyen, Bac Giang (remaining months)
Red River Delta Hanoi, Ha Tay, 1600– NA Fluvisols 10–11 Important crops are rice, maize,
(AEZ IV) Hai Phong, 2200 months sweet potato, and food legumes.
Hung Yen, Hai
Duong, Ha Nam,
Nam Dinh, Thai Binh,
Ninh Binh, Bac Ninh
1. NA = Information not available.
Source: Chinh (2001).
An Open Access Journal published by ICRISAT________________________________________________________________________________________________________
SAT eJournal | ejournal.icrisat.org August 2006 | Volume 2 | Issue 1
29
Soils
Soils are complex and varied. The basic process of soil formation is ferralitic, through
weathering of the parent material, leading to accumulation of rather high amounts of iron and
aluminum, with leaching silica and most base cations. The most common soil type is the red-
yellow ferralitic (Plinthic or Ferric Acrisols, Humic Ferralsols) (Fig. 3.6). These soils accumulate
iron and aluminum to form laterite. Mineralization is rapid, and organic substances quickly break
down resulting in low humus content. Intensive surface cultivation and deep leaching processes
make the soil very acidic and poor in nutrients. Nitrogen, phosphate, and cations are easily
dissolved or carried away to such an extent that these soils cannot be cultivated for long before
they suffer serious degradation. In extreme cases of erosion, a hardpan of laterite nodules is
exposed (Long et al. 1999).
Vegetation
The monsoon tropical climate with high humidity prevailing in the rainfed sloping lands of
northern Vietnam is quite favorable for forest growth and development. Originally these were
almost completely covered by forest. At present, planted and natural forest covers only about
26% (Long et al. 1999).
Major crops
Rice, cassava, sweet potato, maize, tea, and groundnut are the most important crops in the
production system of the rainfed sloping lands. The strategy of cultivation is mixed intensive
lowland cultivation, so that land is covered by vegetation year-round (Long et al. 1999). The
production system has a fixed topographic location. The lowland and terrace irrigated
agricultural systems are used to grow rice. Crops such as cassava, maize, groundnut, mung bean,
and soybean are found on the gentler upland slopes. Plantations for cash crops are located on the
upper and medium slopes. These include tea, lacquer trees, and other forest plantations.
Rice
Rice is the most important food crop. It is the main source of nutrition for people and constitutes
the basis of the daily diet. Until recently, the goal at both the district and household levels was to
be self-sufficient in rice. The paddy fields are located where people prefer to concentrate their
labor in preference to work on other crops. Cultivation is highly intensive and employs advanced
technology, including pesticides, improved seed varieties, and fertilizer (both chemical and
organic).
Two crops are grown: spring and summer. The first crop is sown in December and
transplanted in late January to early February, and harvested in late May or early June. The
second cropping season starts in June with preparation of the seedbed and sowing. Transplanting
is performed in July; during October and early November, the crop is harvested. Both the
cropping periods have problems. For the spring crop there is a shortage of water, and in the
summer there is often a surplus so that flooding is a hazard. There is more land with sufficient
An Open Access Journal published by ICRISAT________________________________________________________________________________________________________
SAT eJournal | ejournal.icrisat.org August 2006 | Volume 2 | Issue 1
30
water during summer which makes the summer crop production higher than the spring crop
production. With minor adjustment of the rice planting schedules, it is possible to produce
vegetables in between the two rice crops or to grow winter catch crops (mung bean, soybean,
sweet potato, potato, maize) on drained paddy fields following the harvest of the summer rice
crop.
Maize
In terms of land area, maize is the most important crop after rice. Maize is generally grown on
gentle slopes and is also a popular catch crop on drained paddy lands in the off-season.
Productivity of the maize crop is low, with annual average of about 1.7 t ha-1
; productivity of
winter crops is slightly higher. Maize grains are used for both human consumption and livestock
feed.
Sweet potato
Sweet potato is the most popular winter catch crop on drained paddy lands. Sweet potato tubers
and leaves are used for both human consumption and animal feed.
Cassava
Cassava is an important crop because it can substitute for rice as a staple food when rice
production is low. Cassava tubers also provide feed for pigs, and the leaves are fed to the fish.
Soil conservation is seldom practiced in cassava cultivation; consequently soils are rapidly
degraded and eroded. Due to low soil fertility, cassava yields are low, about 8–10 t ha-1
per year.
Higher yields of 15–18 t ha-1
are possible on newly opened lands.
Groundnut
Groundnut is one of the main foreign exchange earning crops apart from being the source of oil
and protein for people and fodder for cattle. Spring (February to June) is most important for
production of the crop. The autumn crop is mainly for obtaining high quality seed for the spring
crop. Spring groundnut is grown under rainfed production systems in northern Vietnam. It is
predominantly grown as a sole crop, but in some areas it is intercropped with sugarcane, maize,
cassava, and upland rice during rainy season. A noticeable increase in area under groundnut
production has been observed since 1994. Total area under groundnut in Vietnam is >250,000 ha
and northern Vietnam has a share of about 112,100 ha (Fig. 3.7).
Soybean
Soybean is the second most important legume in Vietnam. About 65% of soybean is grown in
highlands on soils with low fertility (Fig. 3.8). Red River Delta (northern Vietnam) and Mekong
River Delta (southern Vietnam) are also important areas for soybean production since soybean
can be grown all round the year in various cropping systems. Spring crop (February to July) is
An Open Access Journal published by ICRISAT________________________________________________________________________________________________________
SAT eJournal | ejournal.icrisat.org August 2006 | Volume 2 | Issue 1
31
grown under favorable weather conditions, while summer or summer-autumn crop (May–
September) experience high temperature and rainfall during growth and development stages. In
winter (mid-September to December), low temperature and terminal drought are the main
production constraints. Soybean is mainly grown after spring and autumn rice in the Red River
Delta.
Mung bean
Mung bean is the third most important legume after soybean and groundnut. It occupies about
60,000 to 70,000 ha with a production potential of 0.6 to 0.8 t ha-1
. In Red River Delta, mung
bean is grown round the year under irrigation and high input conditions for vegetable purpose
with good yield (about 1.0 t ha-1
). It is cultivated extensively in North-east ecoregion covering
about 26% of the total cultivated area. However, yields are low (0.5 t ha-1
) due to lack of suitable
genotypes with resistance to diseases and pests.
Potential yields and yield gaps
In this study the potential yield is defined as the maximum yield obtained in research station field
experiments conducted under optimal management. Such experiments were conducted at five
sites (Table 3.2). Potential yield ranged from 4199 to 5420 kg ha-1
for maize, 2530 to 3255 kg ha-1
for groundnut, and 2900 to 3050 kg ha-1
for soybean. On-farm yields of the three crops were
obtained by monitoring yields of 50 farmers at each site. The average on-farm yields were
variable across sites and farmers (Table 3.2). Average maize yield ranged from 3000 to 3700 kg
ha-1
across five sites. The yield gap, which is defined as the difference in experimental yield and
on-farm yields, ranged from 1199 to 1961 kg ha-1
representing 28.5 to 39.5% of potential yield.
On-farm yields of groundnut ranged from 1400 to 1600 kg ha-1
giving a yield gap of 1055 to
1655 kg ha-1
, which amounted to 41.3 to 50.8% of potential yield possible at five locations. On-
farm soybean yields ranged from 1200 to 1500 kg ha-1
giving a yield gap of 1600 to 1800 kg ha-1,
which amounted to 50.8 to 60% of potential yield. The above results on yield gap show that the
farmers are able to get almost two-third of the potential yield of maize. However, for groundnut
and soybean, the yield gap is wide (40 to 60% potential yield) which needs to be bridged by
improving management of these legumes.
Productivity constraints
It appears that the legumes have major constraints for production than cereals in Vietnam. Major
abiotic, biotic, and socioeconomic constraints to production of legumes have been reviewed by
Chinh et al. (2001). These are lack of credit facilities, low and unstable market price, lack of
high-yielding varieties with drought tolerance, disease and insect pest resistance, and lack of
improved production practices including soil, water, and nutrient management options. Legume
production in Vietnam can be increased substantially by addressing these production constraints,
extending legume cultivation in rice fallows and through crop diversification. Major problem
with cereals is the excessive use of nitrogen fertilizer to obtain higher yields. This needs to be
replaced with organic sources of nitrogen supply or by introducing legumes into the rotation with
cereals in order to minimize environmental degradation.
An Open Access Journal published by ICRISAT________________________________________________________________________________________________________
SAT eJournal | ejournal.icrisat.org August 2006 | Volume 2 | Issue 1
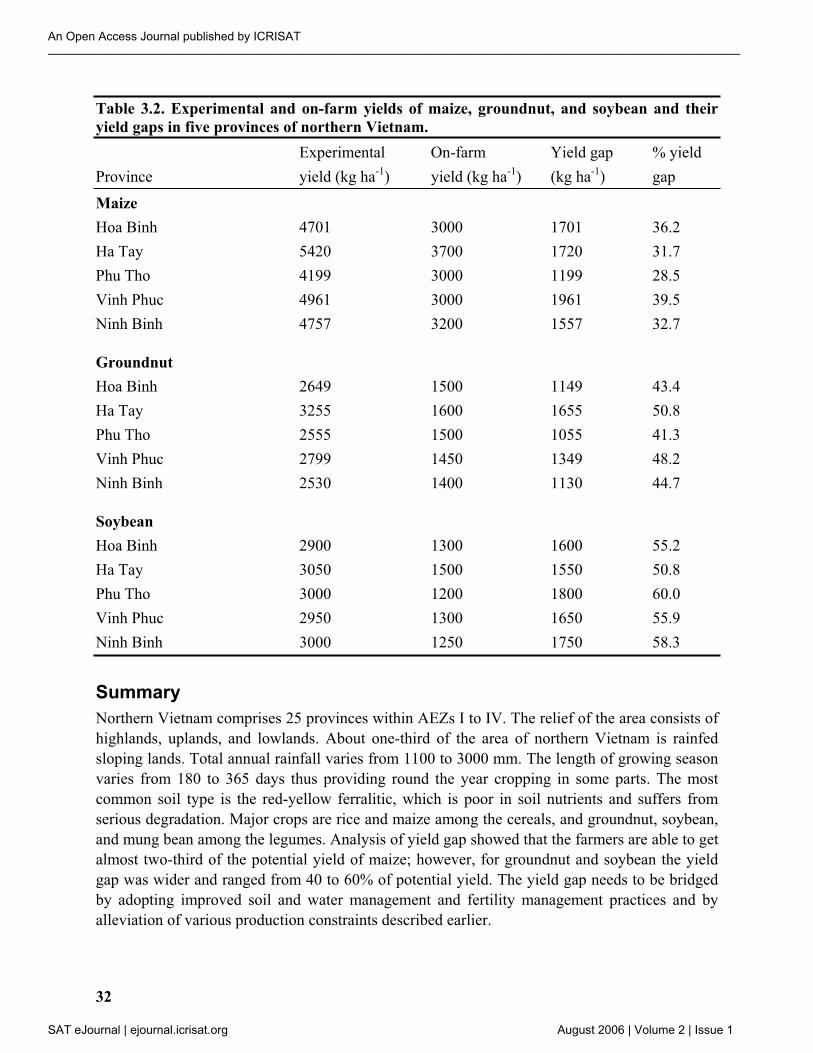
32
Table 3.2. Experimental and on-farm yields of maize, groundnut, and soybean and their
yield gaps in five provinces of northern Vietnam.
Experimental On-farm Yield gap % yield
Province yield (kg ha-1
) yield (kg ha-1
) (kg ha-1
) gap
Maize
Hoa Binh 4701 3000 1701 36.2
Ha Tay 5420 3700 1720 31.7
Phu Tho 4199 3000 1199 28.5
Vinh Phuc 4961 3000 1961 39.5
Ninh Binh 4757 3200 1557 32.7
Groundnut
Hoa Binh 2649 1500 1149 43.4
Ha Tay 3255 1600 1655 50.8
Phu Tho 2555 1500 1055 41.3
Vinh Phuc 2799 1450 1349 48.2
Ninh Binh 2530 1400 1130 44.7
Soybean
Hoa Binh 2900 1300 1600 55.2
Ha Tay 3050 1500 1550 50.8
Phu Tho 3000 1200 1800 60.0
Vinh Phuc 2950 1300 1650 55.9
Ninh Binh 3000 1250 1750 58.3
Summary
Northern Vietnam comprises 25 provinces within AEZs I to IV. The relief of the area consists of
highlands, uplands, and lowlands. About one-third of the area of northern Vietnam is rainfed
sloping lands. Total annual rainfall varies from 1100 to 3000 mm. The length of growing season
varies from 180 to 365 days thus providing round the year cropping in some parts. The most
common soil type is the red-yellow ferralitic, which is poor in soil nutrients and suffers from
serious degradation. Major crops are rice and maize among the cereals, and groundnut, soybean,
and mung bean among the legumes. Analysis of yield gap showed that the farmers are able to get
almost two-third of the potential yield of maize; however, for groundnut and soybean the yield
gap was wider and ranged from 40 to 60% of potential yield. The yield gap needs to be bridged
by adopting improved soil and water management and fertility management practices and by
alleviation of various production constraints described earlier.
An Open Access Journal published by ICRISAT________________________________________________________________________________________________________
SAT eJournal | ejournal.icrisat.org August 2006 | Volume 2 | Issue 1
33
References
Chinh, N.T., Dzung, D.T., Long, T.D., Tam, H.M., Ramakrishna, A., and Johansen, C.
2001. Legumes in Vietnam: constraints and opportunities. Pages 111 to 125 in Legumes in rice-
based cropping systems in tropical Asia: Constraints and opportunities. Patancheru 502 324,
Andhra Pradesh, India: International Crops Research Institute for the Semi-Arid Tropics.
Directorate of Economics and Statistics, Government of India. 1970–92. Agricultural
Situation in India (various issues).
Directorate of Economics and Statistics. 1993–2000. Reports on Agricultural Statistics, 1993
to 2000. Government of Madhya Pradesh, Maharashtra, Uttar Pradesh, Gujarat, Karnataka, and
Rajasthan.
Lal, S., Deshpande, S.B., and Sehgal, J. (eds.) 1994. Soil series of India. Soils Bulletin 40.
Nagpur, India: National Bureau of Soil Survey and Land Use Planning. 684 pp.
Long, T.D., Ramakrishna, A., Viet, N.V., Chinh, N.T., and Tam, H.M. 1999. Sustaining
agriculture in the rainfed sloping lands of northern Vietnam. Presented at the 4th
Assembly of the
Management of Soil Erosion Consortium (MSEC), 24–30 October 1999, Cagayan de Oro City,
Philippines.
Sehgal, J.L., Mandal, D.K., Mandal, C., and Vadivelu, S. (eds.) 1995. Agro-ecological
subregions of India. Technical Bulletin, NBSS Publication-43. Nagpur, India: National Bureau
of Soil Survey and Land Use Planning. 35 pp.
Tsuji, G.Y., Jones, J.W., and Balas, S. (eds.) 1994. DSSAT v3. Honolulu, Hawaii, USA:
University of Hawaii.
An Open Access Journal published by ICRISAT________________________________________________________________________________________________________
SAT eJournal | ejournal.icrisat.org August 2006 | Volume 2 | Issue 1