Embed Size (px)
Citation preview
Potential of Unmanned Aerial Vehicles (UAV) and remote sensing to
accurately estimatepasture biomass in intensively grazed dairy pastures
Matthew Rowbottom
This thesis is submitted in partial fulfilment of the requirements for a Bachelor of Science
(Honours, Agricultural)
SCIE4501-04 Research Dissertation
Faculty of Science
University of Western Australia
October 2015
Supervisors:
Dr Kenneth Flower (School of Plant Biology, University of Western Australia)
Dr Nik Callow (School of Earth and Environment, University of Western Australia)
Dr Martin Staines (Department of Agriculture and Food Western Australia, Bunbury)
Formatted in accordance with the Journal of Dairy Science
Word Count: 8754
2
Abstract:
Australian pasture-based dairy systems have been able to remain competitive and persistent in
the global market due to their ability to produce and utilize ―home-grown‖ feed. Increased
pressure for high productivity and the slow improvement in pasture management has seen
dairy farms resort to purchased feeds with associated higher feed costs following. The
accurate estimation of pasture biomass allows for critical decisions to be made regarding
grazing management and feed budgeting. Objective methods of pasture estimation are poorly
adopted within the farming community due to inaccuracies, time constraints, and labour costs.
This study aimed to determine the potential of remotely sensed imagery collected from an
unmanned aerial vehicle (UAV) as means to accurately estimate pasture biomass. It was
hypothesized that the performance of the UAV would be similar to that of a current objective
pasture estimation method, the rising plate meter (RPM). Two flights were conducted over a
dairy pasture mix of annual Italian Ryegrass (Lolium multiflorum) and White Clover
(Trifolium repens) to estimate biomass and assess multi-date changes. The performance of
common vegetation indices (VI), radiometric normalisation methods and image formats was
conducted. Production of pasture on offer maps were derived from the relationship between
pasture biomass and VI to demonstrate the application to grazing management and feed
budgeting. Contrary to initial predictions, the UAV did not perform similar to the RPM, with
the RPM (r2 = 0.66) explaining more variation in pasture biomass than the difference
vegetation index (DVI) (r2 = 0.42) and green difference index (GDI) (r
2 = 0.15), the best
performing VI for each flight. Poor results for radiometric normalisation and the second flight
inhibited multi-date comparisons. Jpeg image format out-performed RAW image format
yielding better results for estimating biomass. Production of pasture on offer maps was
successful in demonstrating within field variability in biomass and was shown to be useful for
grazing management and feed budgeting. These results have demonstrated that UAV can
estimate and map dairy pastures but are mostly limited by the sensor used, in this case a low-
cost consumer grade camera. Future development in UAV and remote sensing will most
definitely provide better sensors, workflow and useability to the dairy industry.
3
Table of Contents:
Abstract: 2
Acknowledgements: 4
Introduction: 5
Materials and Methods: 10
Trial site 10
Rising plate meter and biomass measurements 10
Camera and UAV system 12
Unmanned Aerial Vehicle flights 13
Image mosaicking and georeferencing 13
Radiometric normalisation 14
Calculation of Vegetation Indices (VI) 16
Spatial distribution maps of pasture biomass 17
Statistical analysis 17
Results: 19
Pasture biomass and height 19
Radiometric normalisation 20
Calibration of UAV data with hyperspectral data 20
Effect of radiometric normalisation 20
Relationship between VI and pasture biomass 23
Validation of the DVI vegetation index using the RPM method 26
Spatial distribution maps of pasture biomass 27
Discussion: 32
Rising plate meter and UAV 32
Performance of VI 32
UAV camera and hyperspectral camera 33
Radiometric normalisation 34
Image format 36
Implication for UAV in the dairy industry 36
Recommendations and implications for future research 37
Conclusions: 39
References: 40
4
Acknowledgements:
Firstly I would like to thank my supervisors Kenneth Flower, Nik Callow and Martin Staines.
The wide range in knowledge and experience that you have brought to the table has made
bringing this thesis together much easier and your individual perspectives has helped shape it.
To Western Dairy for the funding and support you have given me to get this project up and
running. The unexpected publicity from this project has allowed me to network all over the
country, even overseas. It has definitely put me out of my comfort zone and help develop my
professional and communication skills.
To Sam Taylor for originally suggesting the project and getting me interested in the
technology.
To Todd Griffin and Griffin Spatial & Mapping for flying and supplying the UAV imagery.
To all the hard workers that helped me out in the field and lab, without you it would have
made my project very gruelling! Thanks to Martin, Leonarda, Lisa, Marcus, Jess, Stephanie
and Jenny.
Finally, a special thanks to my Mum, Jenny and girlfriend, Sasha for giving me the
encouragement to persist at the times when I just didn't want to write anymore!
5
Introduction:
The Australian dairy industry is considered the third largest rural industry contributing $13
billion from farm, food manufacturing and export sectors, with a total milk production of
9,239 million litres (Dairy Australia, 2013). The single highest variable cost to dairy farms is
the supply of feed to cows (Davies, 1999), with Australian pasture-based dairy systems being
able to sustain a strong competitive advantage in the global market due to their ability to
produce and utilise low-cost, ―home-grown‖ feed (Davies, 1999, Dillon et al., 2005, García
and Fulkerson, 2005, Dillon, 2007). Improvements in pasture management and productivity
have not been sufficient to supply changes in Australian herd requirements (Doyle and Kelly,
1998), with this deficit largely filled with a heavier reliance on purchased feed used to fill the
‗feed gap‘, driving up operational costs and undermining the comparative and competitive
advantage of Australian pasture-based dairy systems (Thorrold and Doyle, 2007, Chapman et
al., 2008). To remain competitive in an increasingly globalised agricultural industry,
improvements need to be made in which the industry can efficiently produce, conserve and
manage ―home-grown‖ feed (Pembleton et al., 2015).
Pasture utilisation, defined as total net annual pasture dry matter (DM) per hectare that is
consumed by the animals (Future Dairy, 2011), is a primary factor related to the profitability
of pasture based systems (Holmes, 2002). It is estimated that potential production for pasture
systems can reach 20 t DM/ha/year (García and Fulkerson, 2005), yet actual pasture
utilisation in some of Australia‘s most favourable dairy regions does not exceed 7 t
DM/ha/year (Kisielewitz, 1998, García et al., 2007). Knowing the amount of pasture biomass
available on farm (before and after grazing events) is a key driver for achieving high pasture
utilisation, farm profitability and efficient management decisions (Hedley et al., 2006,
Romera et al., 2010). It is clear there is room for improvement when it comes to pasture
utilisation and ways in which this can be increased would be beneficial to Australian dairy
farms.
Grazing management, which is based on optimising the grazing interval, intensity and
duration (Macdonald et al., 2010), and feed budgeting (i.e. management of feed surplus and
deficits with respect to herd feed requirements, see Dobos et al. (2004)), are essentially
governed by on accurate knowledge of farm pasture biomass production (kg/DM/ha) (Piggot,
6
1986). The associated benefits of grazing management and feed budgeting has been
demonstrated to improve farm efficiencies, help make critical farm decisions (field selection
for grazing, grazing rotation lengths, stocking rates etc.) and prediction of feed surplus and
deficits (Sanderson et al., 2001, Gray et al., 2003, Dillon, 2007, Macdonald et al., 2008a). The
accurate allocation of pasture to herds has also been shown to increase feed use efficiency,
pasture growth rates, milk production and reduce pasture wastage (Fulkerson et al., 2005).
Sound grazing management results in a consistent amount of plant leaf material remaining
after grazing (i.e.post-grazing pasture height) which allows for healthy pasture regrowth and
persistence whilst upholding the nutritional value of the pasture (White et al., 2002, Lee et al.,
2008a, Macdonald et al., 2008a, Chapman et al., 2012). Although the benefits of grazing
management and feed budgeting are often recognised by farmers, barriers to adoption include;
time constraints, resource requirements, difficulty in predicting weather, and inaccuracies in
estimating DM of pasture (Gray et al., 2003).
The estimation of pasture DM is difficult and tedious to measure, even though it forms the
basis for key farm decisions (Doyle and Kelly, 1998, Fulkerson et al., 2005, García and
Fulkerson, 2005).Parker et al. (1993) found only 19% of farmers were using objective
methods to measure pasture biomass and only 35% were actually estimating pasture growth
rates. Whereas, 90% of farmers, including those that used objective methods, use subjective
visual assessments to measure pasture biomass. It is apparent that there is a general lack in
confidence from farmers in the accuracy of current pasture estimation methods, constraining
adoption within the industry and resulting in the use of potentially less accurate subjective
methods (Campbell and Arnold, 1973, Parker, 1999, Eastwood and Kenny, 2009).
Current methods for estimating pasture biomass include quadrat cuts (Piggot, 1986), visual
assessments (Stockdale, 1984b), electronic capacitance meters (Fletcher and Robinson,
1956)and various tools for measuring pasture height, including the rising plate meter (RPM)
(Earle and McGowan, 1979), C-Dax pasture meter(Lawrence et al., 2007). Accurate
estimations of pasture biomass can be determined from quadrats cuts although this method is
often tedious, time consuming and prevents the repeated sampling of plots in future due to its
destructive nature (Tucker, 1980, Catchpole and Wheeler, 1992). Quadrat cuts still play a key
role in biomass estimation as they are required for calibration of many non-destructive
methods (Stockdale and Kelly, 1984, Gourley and McGowan, 1991, Fulkerson and Slack,
1993, Murphy et al., 1995). The convenience, simplicity, cost-effectiveness and ability to fit
7
into daily routines of farmers make visual assessments of pasture biomass popular(Tucker,
1980, Moran et al., 1997, Eastwood and Kenny, 2009), yet to achieve consistently accurate
estimations, observers need training to account for changes in pasture height, densities, and
species composition (Campbell and Arnold, 1973, Cayley and Bird, 1996).
There are mixed results with the accuracy of some tools to indirectly estimate pasture
biomass(Earle and McGowan, 1979, Stockdale and Kelly, 1984, Murphy et al., 1995). The
use of tools to measure biomass is reported to reduce labour, associated costs and improve
time efficiencies; the use of non-destructive methods have aided grazing management and
pasture growth rate experiments (Tucker, 1980, Vickery et al., 1980, Gourley and McGowan,
1991, Murphy et al., 1995). Use of electronic capacitance meters, which use the relationship
between pasture water content and biomass, have reported variable accuracy due to the effects
of temperature, humidity, calibration drift and with use under wet conditions (Earle and
McGowan, 1979, Tucker, 1980, Murphy et al., 1995, Sanderson et al., 2001).Whereas, RPM
incur problems due to hoof indentations, trampling/lodging of vegetation, rough soil surfaces
and operator error affecting RPM measurements (Stockdale and Kelly, 1984, Murphy et al.,
1995, Sanderson et al., 2001). The C-Dax, however, is able to reduce operator error due to
minimal manual involvement in the pasture measurement (King et al., 2010).There is strong
consensus that the use of generic calibration equations for tools, often provided by the
supplier/maker, to predict pasture biomass should be used cautiously due to lack of specificity
to regional variations in pasture botanical composition, climate and management (Earle and
McGowan, 1979, Sanderson et al., 2001, King et al., 2010, Oudshoorn et al., 2011). Despite
its inherent problems the RPM continues to be recommended in the dairy industry for whole
farm pasture monitoring, decision making, planning and assessment of pasture utilisation
(Lile et al., 2001, La Grange, 2009).
Remote sensing of pastures, via satellite platforms, offer the ability to monitor large areas that
assist in daily and future management decisions for grazing systems (Taylor et al., 1985,
Edirisinghe et al., 2004). It has been shown, via Pasture from Space®, that increased pasture
utilisation and farm profits can be achieved by sheep producers of Western Australia when
supplied with information on pasture growth rates (PGR®) and feed on offer (FOO
®)
(Edirisinghe et al., 2000, Gherardi and Oldham, 2003, Edirisinghe et al., 2004, Hill et al.,
2004). Application of Pastures from Space®
for use by the dairy industry in Australia and
New Zealand has been evaluated but problems with cloud cover, low spatial resolution (250m
8
x 250m), timely data delivery, accurate pasture estimation, and appropriate support structures
for data interpretation have seen low adoption (Eastwood and Kenny, 2009, Eastwood et al.,
2009, Mata et al., 2011).
Remote sensing, via Unmanned Aerial Vehicles (UAV), is an emerging technique, with
applications that have included rangeland monitoring (Rango et al., 2006, Laliberte et al.,
2010, Laliberte et al., 2011a, Laliberte et al., 2011b), pasture management for livestock
(Shepherd et al., 2013, Von Bueren and Yule, 2013), crop monitoring (Hunt et al., 2003, Hunt
et al., 2005, Lelong et al., 2008, Hunt et al., 2010, Swain et al., 2010), orchard and vineyard
management (Berni et al., 2009, Turner et al., 2011) and environmental research (Hardin and
Hardin, 2010). Benefits of using UAVs as a platform for remote sensing include flexibility of
deployment, high spatial resolution(ideal for identification of within field variation), low
acquisition costs (compared to other remote sensing platforms), ability to cover large areas,
and versatility in terms of sensor capabilities (Moran et al., 1997, Hunt et al., 2003, Hardin
and Hardin, 2010, Laliberte et al., 2010, Swain et al., 2010, Laliberte et al., 2011a, Laliberte et
al., 2011b). UAV-based remote sensing has the potential to overcome cloud cover issues,
allow timely and flexible data acquisition with limited labour involvement, which could aid in
more objective pasture estimation methods being adopted within the dairy industry.
Pasture-based dairy systems of Western Australia have limited adoption of current objective
pasture estimation methods (M. Staines, DAFWA, Bunbury, W.A, personal communication).
UAVs are attractive to the industry as they could provide useful information about pasture
biomass in a timely manner, at high spatial resolutions to aid farm decisions, however the
accuracy of this method is at present unknown. For a new method of pasture estimation to be
viable within the dairy industry it would need to meet the performance of the current method.
The aim of this study is to assess the potential for a UAV, as a remote sensing platform, to
accurately estimate pasture biomass in intensively grazed dairy pastures and their possible
role in facilitating grazing management and feed budgeting decisions. To allow for direct
comparison to the most commonly used quantitative industry pasture estimation method, the
UAV remote sensing approach will be benchmarked against the RPM for performance in
estimating above-ground pasture, in comparison to direct measurement by quadrat cuts. The
research hypothesis is: that UAV will perform at a similar level of accuracy to the current
pasture measurement method using RPM for estimating pasture biomass. Development of
high spatial resolution maps will also be created to show within field variability of pasture
biomass, with the intention of supplying pre- and post-grazing pasture cover information to

9
demonstrate the applicability and usefulness of UAV to aid farm decisions, relative to
conventional point-based measurement and estimation techniques.
10
Materials and Methods:
Trial site
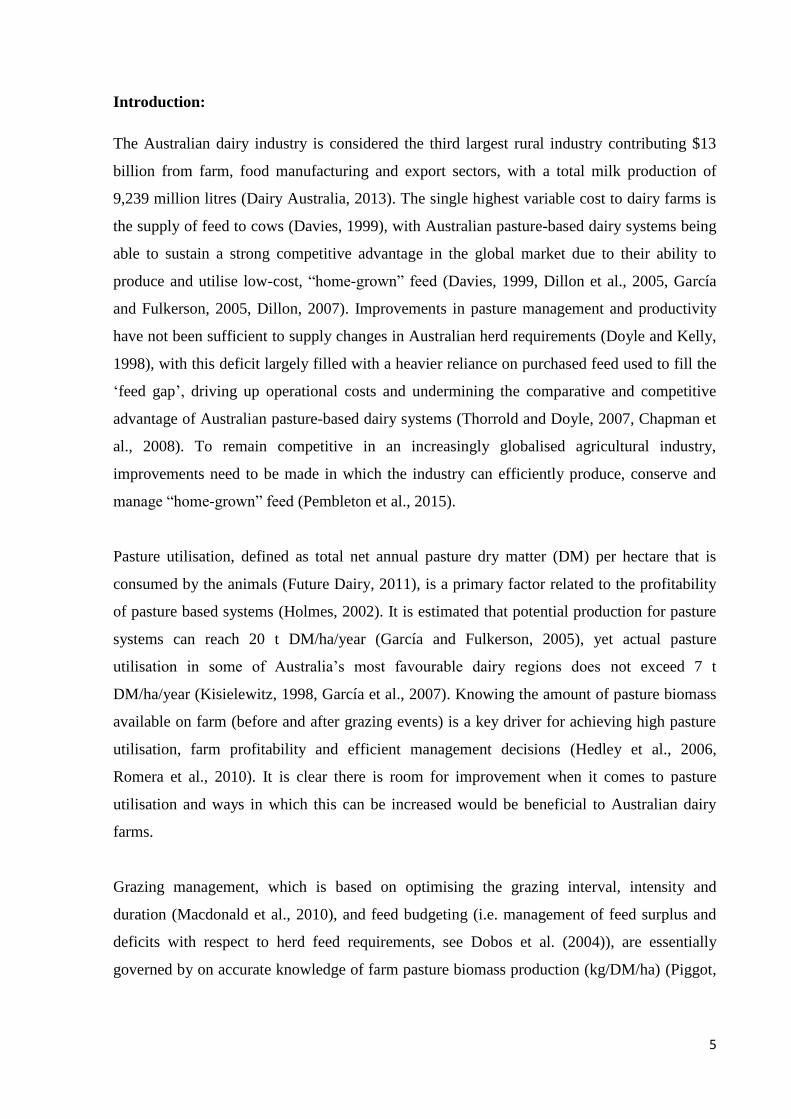
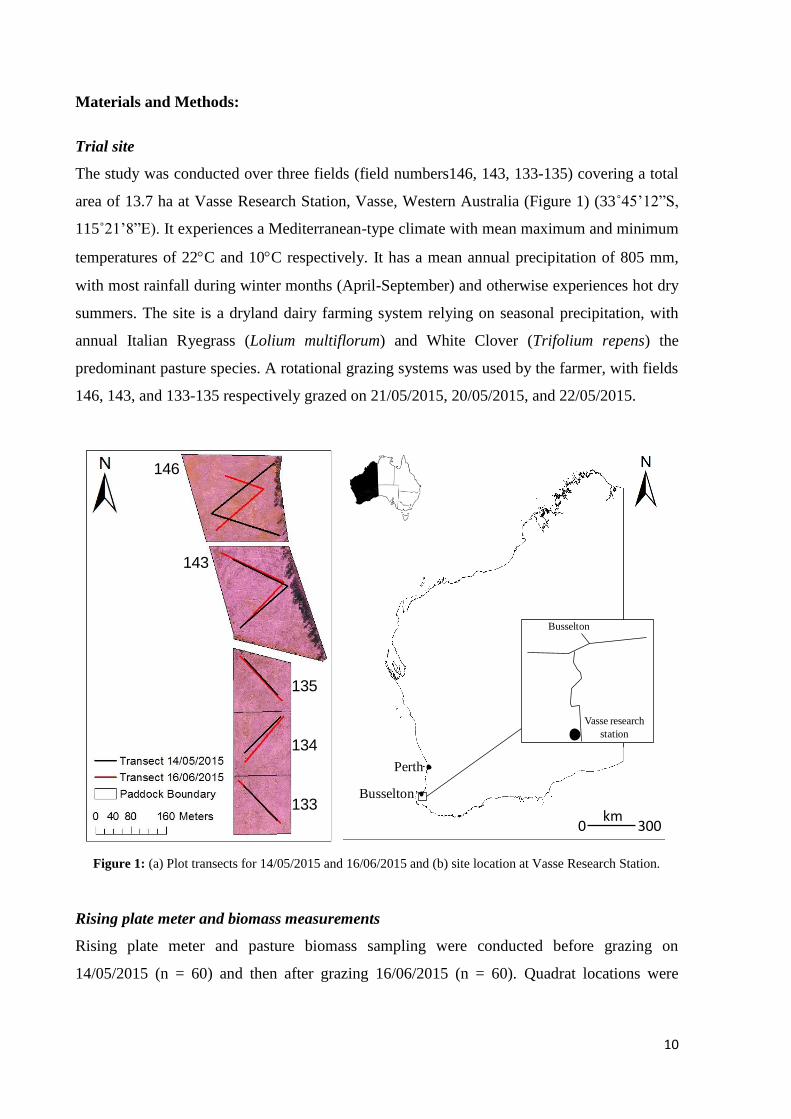
The study was conducted over three fields (field numbers146, 143, 133-135) covering a total
area of 13.7 ha at Vasse Research Station, Vasse, Western Australia (Figure 1) (33˚45‘12‖S,
115˚21‘8‖E). It experiences a Mediterranean-type climate with mean maximum and minimum
temperatures of 22C and 10C respectively. It has a mean annual precipitation of 805 mm,
with most rainfall during winter months (April-September) and otherwise experiences hot dry
summers. The site is a dryland dairy farming system relying on seasonal precipitation, with
annual Italian Ryegrass (Lolium multiflorum) and White Clover (Trifolium repens) the
predominant pasture species. A rotational grazing systems was used by the farmer, with fields
146, 143, and 133-135 respectively grazed on 21/05/2015, 20/05/2015, and 22/05/2015.
Figure 1: (a) Plot transects for 14/05/2015 and 16/06/2015 and (b) site location at Vasse Research Station.
Rising plate meter and biomass measurements
Rising plate meter and pasture biomass sampling were conducted before grazing on
14/05/2015 (n = 60) and then after grazing 16/06/2015 (n = 60). Quadrat locations were
Perth
Busselton
Busselton
Vasse research
station
0 300km
146
143
135
134
133
11
determined at random before each flight (to collect remote sensing data) along V-shaped or
diagonal transects (see Figure 1), similar to the approach of Edirisinghe et al. (2011). To
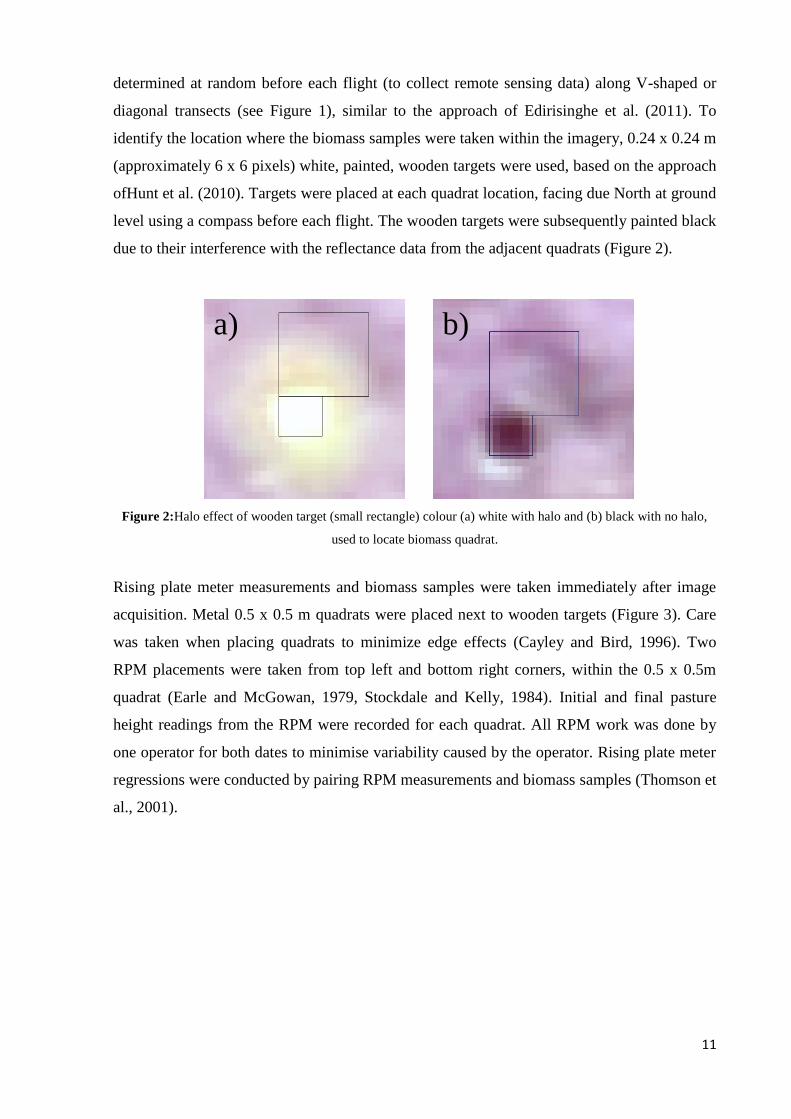
identify the location where the biomass samples were taken within the imagery, 0.24 x 0.24 m
(approximately 6 x 6 pixels) white, painted, wooden targets were used, based on the approach
ofHunt et al. (2010). Targets were placed at each quadrat location, facing due North at ground
level using a compass before each flight. The wooden targets were subsequently painted black
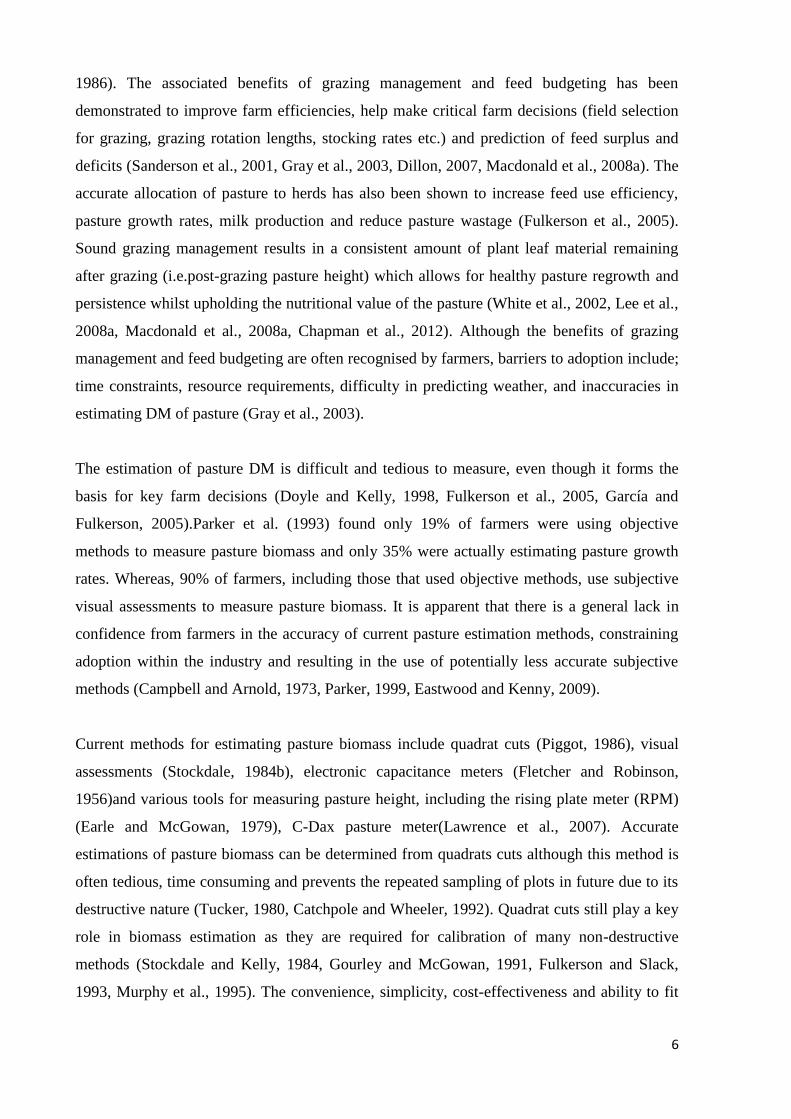
due to their interference with the reflectance data from the adjacent quadrats (Figure 2).
Figure 2:Halo effect of wooden target (small rectangle) colour (a) white with halo and (b) black with no halo,
used to locate biomass quadrat.
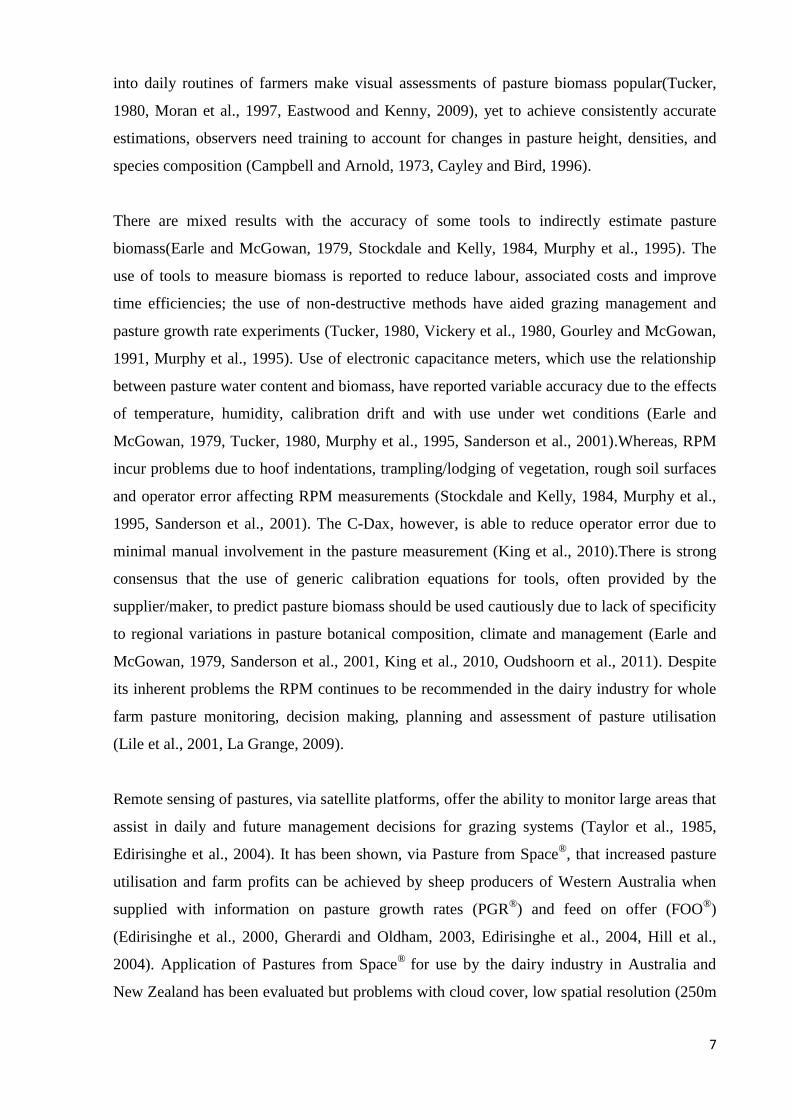
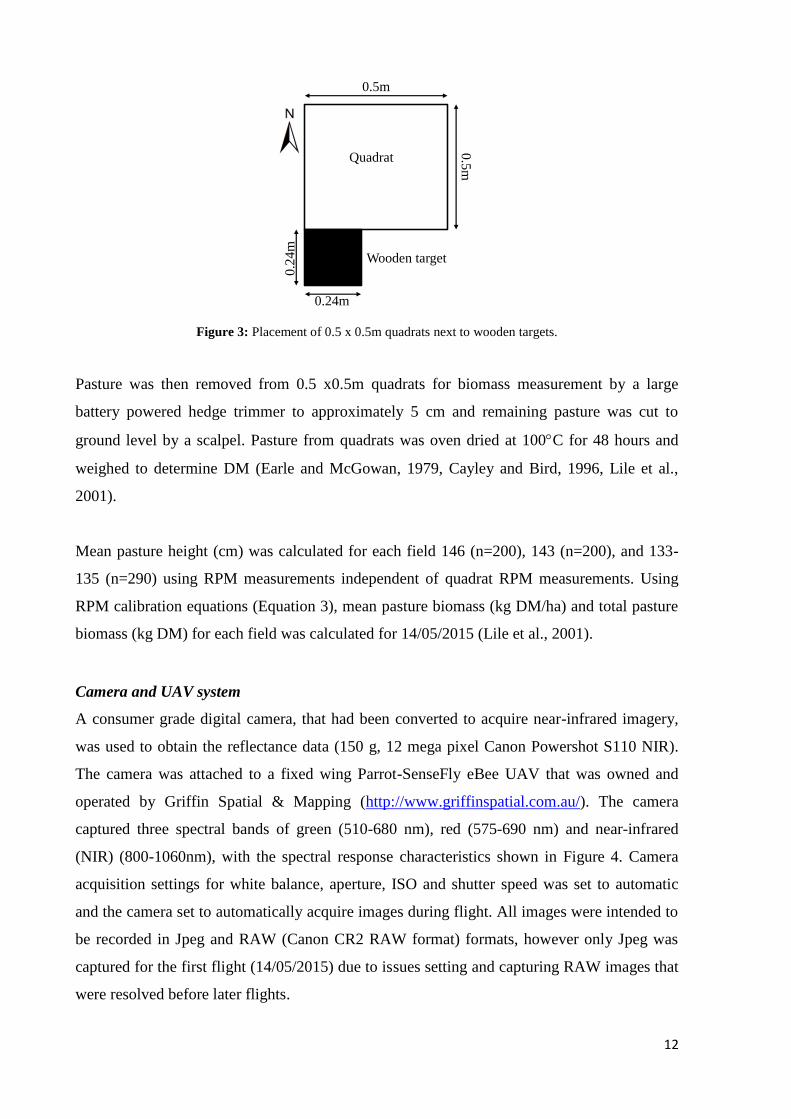
Rising plate meter measurements and biomass samples were taken immediately after image
acquisition. Metal 0.5 x 0.5 m quadrats were placed next to wooden targets (Figure 3). Care
was taken when placing quadrats to minimize edge effects (Cayley and Bird, 1996). Two
RPM placements were taken from top left and bottom right corners, within the 0.5 x 0.5m
quadrat (Earle and McGowan, 1979, Stockdale and Kelly, 1984). Initial and final pasture
height readings from the RPM were recorded for each quadrat. All RPM work was done by
one operator for both dates to minimise variability caused by the operator. Rising plate meter
regressions were conducted by pairing RPM measurements and biomass samples (Thomson et
al., 2001).
a) b)
12
Figure 3: Placement of 0.5 x 0.5m quadrats next to wooden targets.
Pasture was then removed from 0.5 x0.5m quadrats for biomass measurement by a large
battery powered hedge trimmer to approximately 5 cm and remaining pasture was cut to
ground level by a scalpel. Pasture from quadrats was oven dried at 100C for 48 hours and
weighed to determine DM (Earle and McGowan, 1979, Cayley and Bird, 1996, Lile et al.,
2001).
Mean pasture height (cm) was calculated for each field 146 (n=200), 143 (n=200), and 133-
135 (n=290) using RPM measurements independent of quadrat RPM measurements. Using
RPM calibration equations (Equation 3), mean pasture biomass (kg DM/ha) and total pasture
biomass (kg DM) for each field was calculated for 14/05/2015 (Lile et al., 2001).
Camera and UAV system
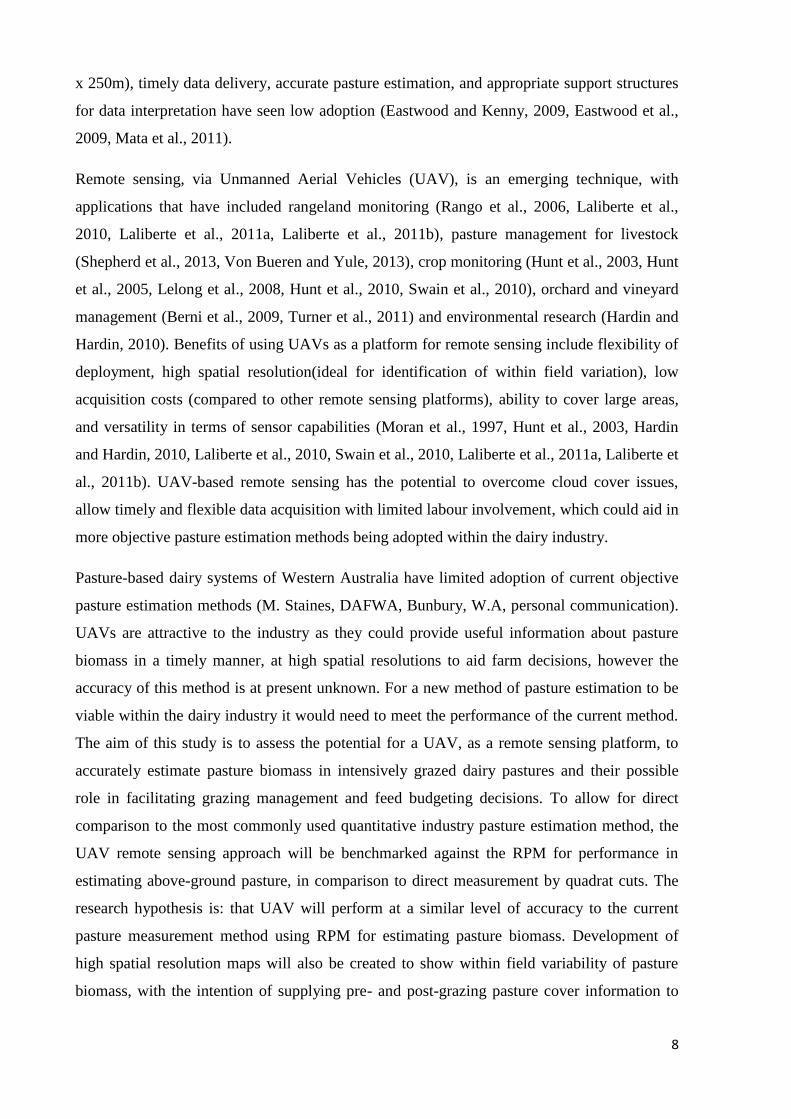
A consumer grade digital camera, that had been converted to acquire near-infrared imagery,
was used to obtain the reflectance data (150 g, 12 mega pixel Canon Powershot S110 NIR).
The camera was attached to a fixed wing Parrot-SenseFly eBee UAV that was owned and
operated by Griffin Spatial & Mapping (http://www.griffinspatial.com.au/). The camera
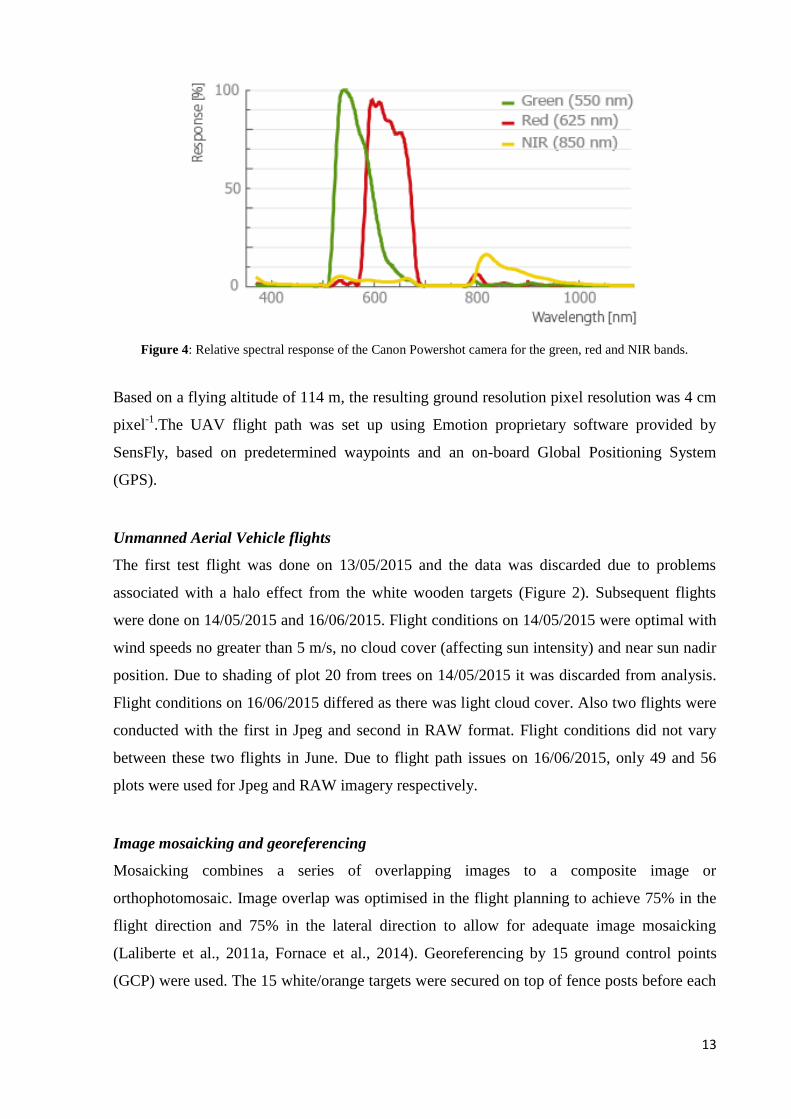
captured three spectral bands of green (510-680 nm), red (575-690 nm) and near-infrared
(NIR) (800-1060nm), with the spectral response characteristics shown in Figure 4. Camera
acquisition settings for white balance, aperture, ISO and shutter speed was set to automatic
and the camera set to automatically acquire images during flight. All images were intended to
be recorded in Jpeg and RAW (Canon CR2 RAW format) formats, however only Jpeg was
captured for the first flight (14/05/2015) due to issues setting and capturing RAW images that
were resolved before later flights.
Quadrat
0.5m
0.5
m
0.2
4m
0.24m
Wooden target
13
Figure 4: Relative spectral response of the Canon Powershot camera for the green, red and NIR bands.
Based on a flying altitude of 114 m, the resulting ground resolution pixel resolution was 4 cm
pixel-1
.The UAV flight path was set up using Emotion proprietary software provided by
SensFly, based on predetermined waypoints and an on-board Global Positioning System
(GPS).
Unmanned Aerial Vehicle flights
The first test flight was done on 13/05/2015 and the data was discarded due to problems
associated with a halo effect from the white wooden targets (Figure 2). Subsequent flights
were done on 14/05/2015 and 16/06/2015. Flight conditions on 14/05/2015 were optimal with
wind speeds no greater than 5 m/s, no cloud cover (affecting sun intensity) and near sun nadir
position. Due to shading of plot 20 from trees on 14/05/2015 it was discarded from analysis.
Flight conditions on 16/06/2015 differed as there was light cloud cover. Also two flights were
conducted with the first in Jpeg and second in RAW format. Flight conditions did not vary
between these two flights in June. Due to flight path issues on 16/06/2015, only 49 and 56
plots were used for Jpeg and RAW imagery respectively.
Image mosaicking and georeferencing
Mosaicking combines a series of overlapping images to a composite image or
orthophotomosaic. Image overlap was optimised in the flight planning to achieve 75% in the
flight direction and 75% in the lateral direction to allow for adequate image mosaicking
(Laliberte et al., 2011a, Fornace et al., 2014). Georeferencing by 15 ground control points
(GCP) were used. The 15 white/orange targets were secured on top of fence posts before each
14
flight and georeferenced using a Trimble R10 RTK-GPS (Trimble Navigation Ltd.,
Sunnyvale, CA, USA) connected to the virtual reference station (VRS) network to achieve a
manufactured quoted horizontal accuracy of ±2 cm.
Unprocessed RAW images were convert to Tagged Image File Format (TIFF)using XnView
v2.33, a freeware package (http://www.xnview.com/en/). Image processing was done using
Agisoft Photoscan Professional Edition (Agisoft LLC, St. Petersburg, Russia), selected on the
basis of findings by Turner et al. (2014) that this program outperformed comparable software
products. The total XYZ error for flights on the 14/05/2015 Jpeg and 16/06/2015 Jpeg and
RAW were 0.015m, 0.022 m and 0.023 m respectively. From here building of image
geometry was done to create a surface model to orthocorrect the images to create the final
rectified photomosaic. Using image geometry an orthophoto was created and exported as a
TIFF file ready for image analysis in ArcGIS (v10.3 for desktop, ESRI Ltd., CA, USA).
Radiometric normalisation
To account for the effects of images captured under different irradiance conditions and allow
multi-date comparison (14/05/2015 and 16/06/2015), radiometric normalisation was applied
(Lebourgeois et al., 2008). Two methods of radiometric normalisation were tested including
normalisation with Teflon panels (Nansen et al., 2013) and normalisation using invariant
targets (Lebourgeois et al., 2008).
Teflon is a surface that reflects across the visible to NIR portion of the spectrum and is widely
used to calibrate images in remote sensing (Bruegge et al., 1993). Four Teflon panels of 0.25
x 0.25 m were distributed throughout the study site before each flight. Using ArcGIS,
polygons were drawn around the Teflon panels to extract the mean digital number (DN)
values from each camera band (G, R, NIR) within orthophotos. All pixels for individual bands
were normalized to the Teflon reflectance values using the raster calculator function in
ArcGIS and Equation 1 (Nansen et al., 2013).
Teflon normalized DN values = (DNinitial/mean Teflon DN) (1)
Invariant targets (or also known as pseudo-invariant targets) are ground targets that have
(relatively) consistent spectral response that allow between-image and -date calibration to
produce radiometrically consistent images (Heo and FitzHugh, 2000). Four Teflon panels and
15
three invariant targets or wooden panels painted white, grey and black were used meeting the
criteria outlined by Heo and FitzHugh (2000).
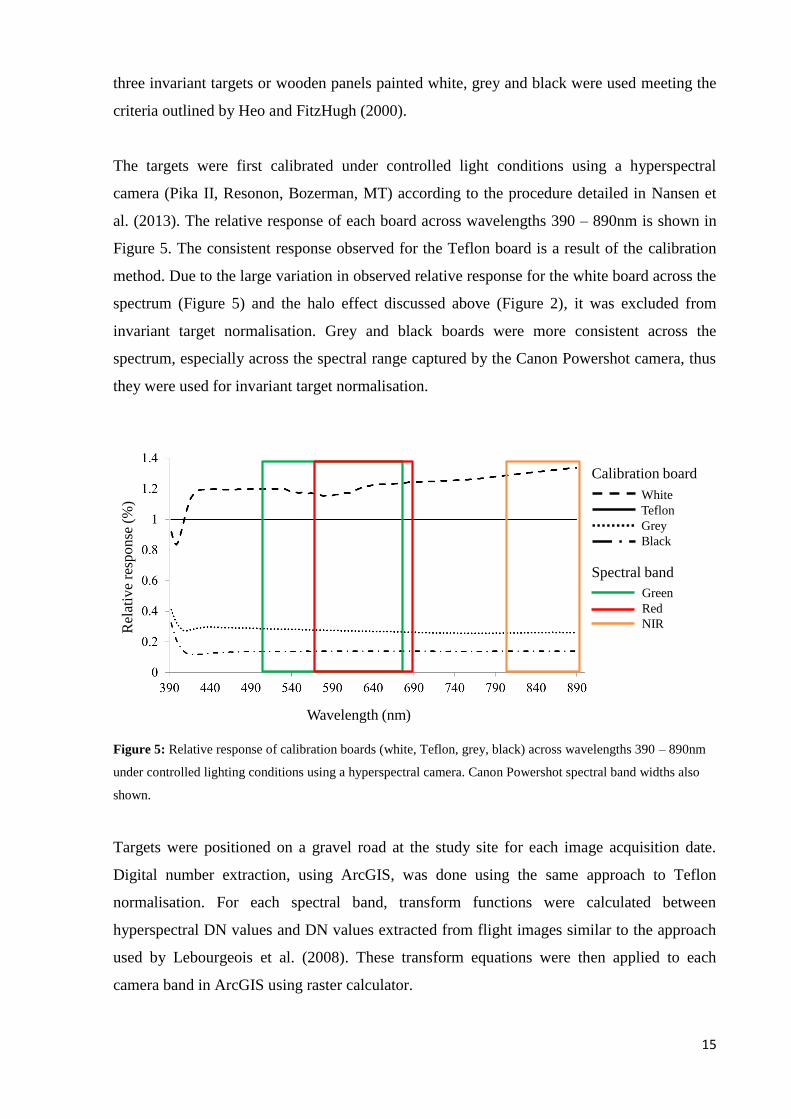
The targets were first calibrated under controlled light conditions using a hyperspectral
camera (Pika II, Resonon, Bozerman, MT) according to the procedure detailed in Nansen et
al. (2013). The relative response of each board across wavelengths 390 – 890nm is shown in
Figure 5. The consistent response observed for the Teflon board is a result of the calibration
method. Due to the large variation in observed relative response for the white board across the
spectrum (Figure 5) and the halo effect discussed above (Figure 2), it was excluded from
invariant target normalisation. Grey and black boards were more consistent across the
spectrum, especially across the spectral range captured by the Canon Powershot camera, thus
they were used for invariant target normalisation.
Figure 5: Relative response of calibration boards (white, Teflon, grey, black) across wavelengths 390 – 890nm
under controlled lighting conditions using a hyperspectral camera. Canon Powershot spectral band widths also
shown.
Targets were positioned on a gravel road at the study site for each image acquisition date.
Digital number extraction, using ArcGIS, was done using the same approach to Teflon
normalisation. For each spectral band, transform functions were calculated between
hyperspectral DN values and DN values extracted from flight images similar to the approach
used by Lebourgeois et al. (2008). These transform equations were then applied to each
camera band in ArcGIS using raster calculator.
White
Teflon
Grey
Black
Wavelength (nm)
Rel
ativ
e re
spo
nse
(%
)
Green
Red
NIR
Calibration board
Spectral band
16
Calculation of Vegetation Indices (VI)
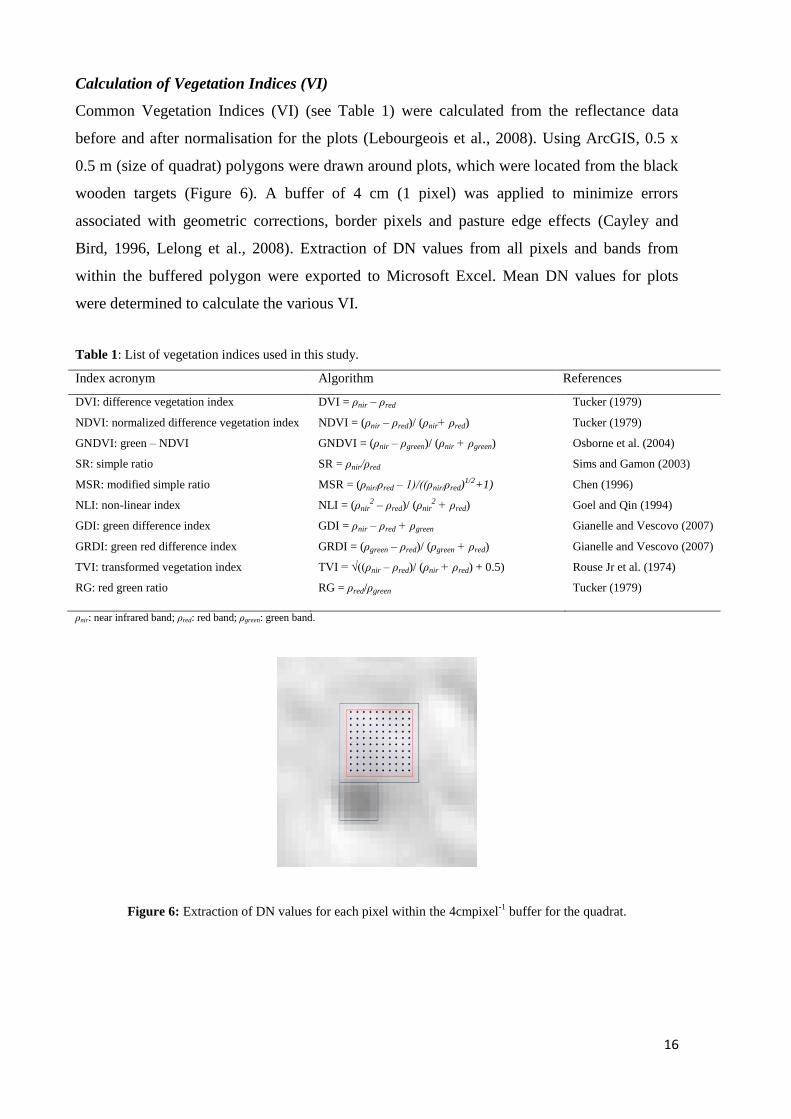
Common Vegetation Indices (VI) (see Table 1) were calculated from the reflectance data
before and after normalisation for the plots (Lebourgeois et al., 2008). Using ArcGIS, 0.5 x
0.5 m (size of quadrat) polygons were drawn around plots, which were located from the black
wooden targets (Figure 6). A buffer of 4 cm (1 pixel) was applied to minimize errors
associated with geometric corrections, border pixels and pasture edge effects (Cayley and
Bird, 1996, Lelong et al., 2008). Extraction of DN values from all pixels and bands from
within the buffered polygon were exported to Microsoft Excel. Mean DN values for plots
were determined to calculate the various VI.
Table 1: List of vegetation indices used in this study.
Index acronym Algorithm References
DVI: difference vegetation index
NDVI: normalized difference vegetation index
GNDVI: green – NDVI
SR: simple ratio
MSR: modified simple ratio
NLI: non-linear index
GDI: green difference index
GRDI: green red difference index
TVI: transformed vegetation index
RG: red green ratio
DVI = ρnir – ρred
NDVI = (ρnir – ρred)/ (ρnir+ ρred)
GNDVI = (ρnir – ρgreen)/ (ρnir + ρgreen)
SR = ρnir/ρred
MSR = (ρnir/ρred – 1)/((ρnir/ρred)1/2+1)
NLI = (ρnir2 – ρred)/ (ρnir
2 + ρred)
GDI = ρnir – ρred + ρgreen
GRDI = (ρgreen – ρred)/ (ρgreen + ρred)
TVI = √((ρnir – ρred)/ (ρnir + ρred) + 0.5)
RG = ρred/ρgreen
Tucker (1979)
Tucker (1979)
Osborne et al. (2004)
Sims and Gamon (2003)
Chen (1996)
Goel and Qin (1994)
Gianelle and Vescovo (2007)
Gianelle and Vescovo (2007)
Rouse Jr et al. (1974)
Tucker (1979)
ρnir: near infrared band; ρred: red band; ρgreen: green band.
Figure 6: Extraction of DN values for each pixel within the 4cmpixel-1
buffer for the quadrat.
17
Spatial distribution maps of pasture biomass
Using ArcGIS an index map was created from the DVI (see Table 1) using reflectance data.
Secondly, pasture on offer maps (pasture biomass maps) were derived based on the
relationship between DVI and pasture biomass (from DM cuts) (Equation 2).
Pasture biomass (kg DM/ha) = 80.4*DVI+1228 (2)
To demonstrate the application of pasture on offer maps for grazing management and feed
budgeting purposes, pre-grazing pasture cover (pasture biomass present before grazing event)
and post-grazing residual maps (pasture biomass present after grazing event) were created.
Both maps were formed based on certain criteria and followed a ―traffic light‖ system that
determined their management option. For the pre-grazing pasture cover map, the green ―ready
to graze (>2600 kg DM/ha)‖ criteria was chosen based on findings of La Grange (2009) for
pre-grazing cover and herd intake requirements. Criteria for yellow ―residual target (1500-
1600 kg DM/ha)‖ from post-grazing residual maps was based on an acceptable range that
complemented plant regrowth and nutritional factors (Shannon and Tyndall, 2006, Lee et al.,
2008a). Mean (kg DM/ha) and total (kg DM) pasture biomass was calculated for field 146,
143 and 133-135 using zonal statistics function in ArcGIS.
Differences in spatial distribution of pasture biomass between RPM and UAV methods was
shown using pasture on offer maps. Maps derived for the RPM used the relationship between
pasture height (estimated from the RPM) and pasture biomass (from DM cuts) (Equation 3).
Pasture biomass (kg DM/ha) = 381.6*pasture height (cm) -743 (3)
Applying the spatial interpolation method of kriging, pasture biomass maps were then created.
UAV maps were identical to method detailed above using Equation 2.
Statistical analysis
Statistical analysis of the extracted data was performed using Genstat (17th
Ed VSN
International Ltd). Assumption of normality was confirmed using Wilk-Shapiro test before
any data analysis was performed. Descriptive statistics was used to evaluate pasture biomass
and height. Correlation coefficients (r) and coefficient of variation (CV) was used to evaluate
the relationship between pasture biomass and spectral bands for the data before and after
18
normalisation (Kawamura et al., 2011). Linear regressions between pasture biomass, pasture
height and VI was evaluated using coefficient of determination (r2) and root mean square
error (RMSE) (Sanderson et al., 2001, Loris and Damiano, 2006).
19
Results:
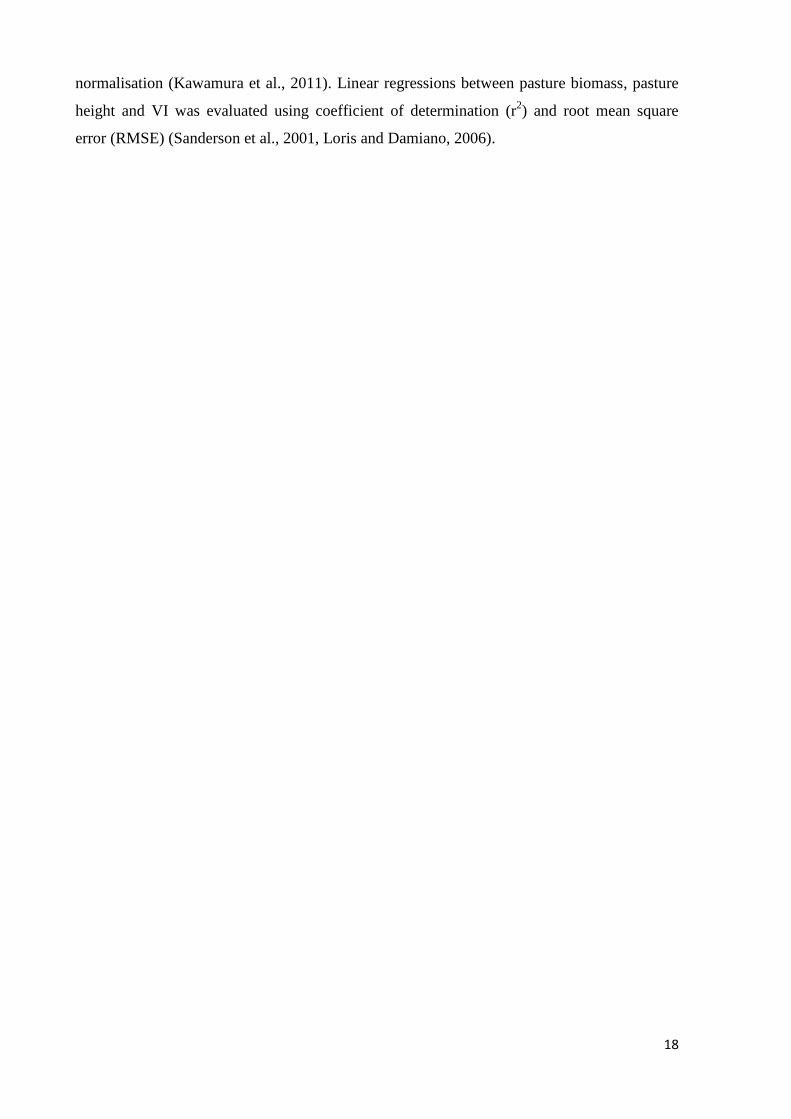
Pasture biomass and height
Mean pasture biomass and height was measured from direct harvesting of quadrats and RPM
measurements respectively with results showing significant variation between flight dates
(Table 2). Pasture biomass for 14/05/2015 was lower with a greater variability (2282 kg
DM/ha ±155) compared with that taken on 16/06/2015 (2768 kg DM/ha ±87). A similar trend
was observed for pasture height, with mean pasture height for 14/05/2015 and 16/06/2015 of
7.9cm (±0.33) and 11.2cm (±0.23), respectively.
Table 2: Descriptive statistics (mean, range, SD, CV) for pasture parameters for both flight dates.
Date Pasture Parameters
(n = 60)
Mean Range SEa
CVb
14/05/2015
Biomass (kg/ha)
2282
5468
155
52
Height (cm) 7.89 11.5 0.33 32
16/06/2015
Biomass (kg/ha)
2768
3104
87
24
Height (cm) 11.19 8.25 0.23 15 a Standard Error
b Coefficient of variation
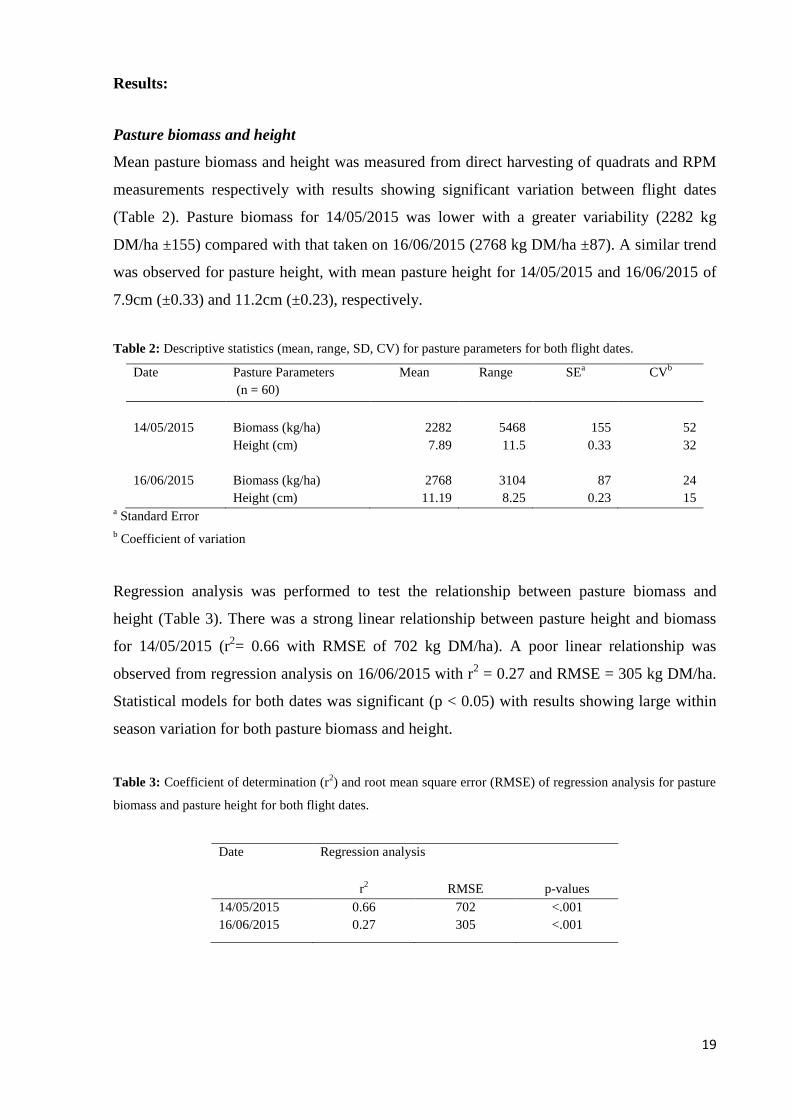
Regression analysis was performed to test the relationship between pasture biomass and
height (Table 3). There was a strong linear relationship between pasture height and biomass
for 14/05/2015 (r2= 0.66 with RMSE of 702 kg DM/ha). A poor linear relationship was
observed from regression analysis on 16/06/2015 with r2 = 0.27 and RMSE = 305 kg DM/ha.
Statistical models for both dates was significant (p < 0.05) with results showing large within
season variation for both pasture biomass and height.
Table 3: Coefficient of determination (r2) and root mean square error (RMSE) of regression analysis for pasture
biomass and pasture height for both flight dates.
Date Regression analysis
r2
RMSE p-values
14/05/2015 0.66 702 <.001
16/06/2015 0.27 305 <.001
20
Radiometric normalisation
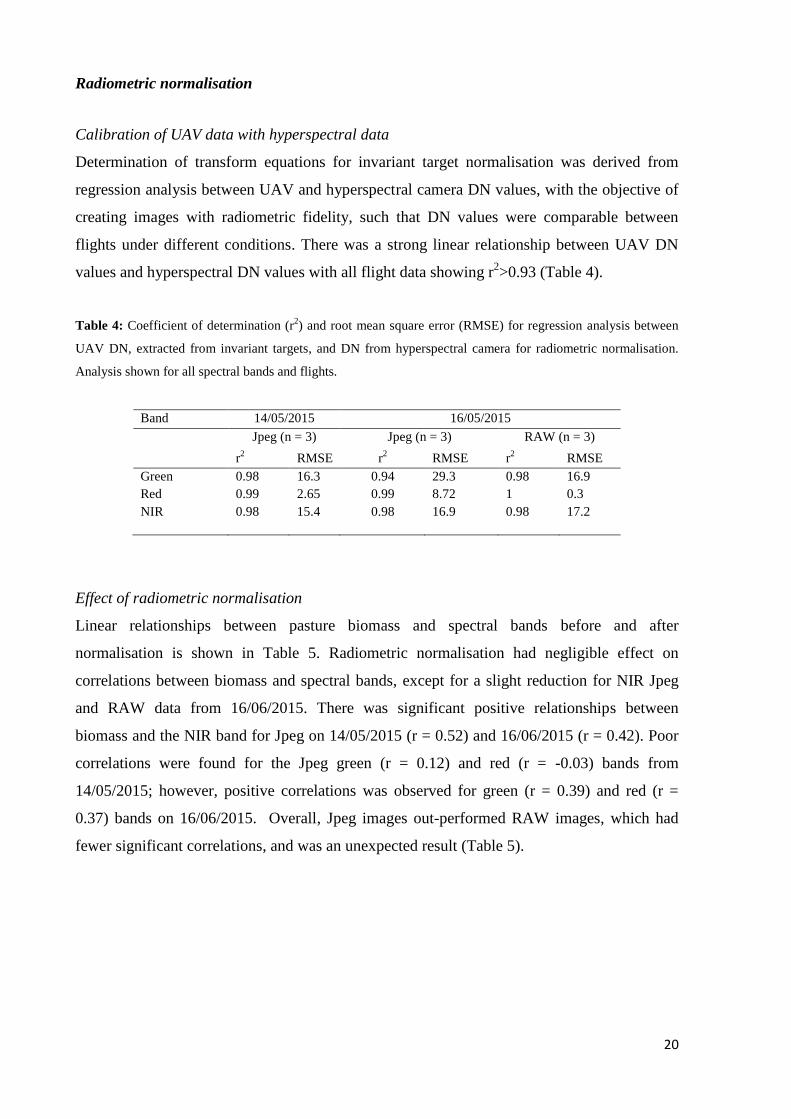
Calibration of UAV data with hyperspectral data
Determination of transform equations for invariant target normalisation was derived from
regression analysis between UAV and hyperspectral camera DN values, with the objective of
creating images with radiometric fidelity, such that DN values were comparable between
flights under different conditions. There was a strong linear relationship between UAV DN
values and hyperspectral DN values with all flight data showing r2>0.93 (Table 4).
Table 4: Coefficient of determination (r2) and root mean square error (RMSE) for regression analysis between
UAV DN, extracted from invariant targets, and DN from hyperspectral camera for radiometric normalisation.
Analysis shown for all spectral bands and flights.
Band 14/05/2015 16/05/2015
Jpeg (n = 3) Jpeg (n = 3) RAW (n = 3)
r2
RMSE r2 RMSE r
2 RMSE
Green
Red
NIR
0.98
0.99
0.98
16.3
2.65
15.4
0.94
0.99
0.98
29.3
8.72
16.9
0.98
1
0.98
16.9
0.3
17.2
Effect of radiometric normalisation
Linear relationships between pasture biomass and spectral bands before and after
normalisation is shown in Table 5. Radiometric normalisation had negligible effect on
correlations between biomass and spectral bands, except for a slight reduction for NIR Jpeg
and RAW data from 16/06/2015. There was significant positive relationships between
biomass and the NIR band for Jpeg on 14/05/2015 (r = 0.52) and 16/06/2015 (r = 0.42). Poor
correlations were found for the Jpeg green (r = 0.12) and red (r = -0.03) bands from
14/05/2015; however, positive correlations was observed for green (r = 0.39) and red (r =
0.37) bands on 16/06/2015. Overall, Jpeg images out-performed RAW images, which had
fewer significant correlations, and was an unexpected result (Table 5).
21
Table 5: Correlation coefficient (r), mean and coefficient of variation (CV) for relationships between spectral
bands and pasture biomass, for different methods of radiometric normalisation, from all flights.
Radiometric
normalisation
Band 14/05/2015 16/06/2015
Jpeg (n = 59) Jpeg (n = 49) RAW (n = 56)
r Mean CV r Mean CV r Mean CV
Pre-normalised Green
Red
NIR
0.12
-0.03
0.52*
215
115
128
4.2
6.5
9.5
0.39*
0.37*
0.42*
216
113
142
3.5
5.9
5.4
0.19
0.12
0.22*
181
85
105
5.7
6.5
6.1
Teflon Green
Red
NIR
0.11
-0.03
0.52*
216
140
232
4.2
6.5
7.5
0.39*
0.37*
0.35*
221
137
244
3.5
5.9
3.4
0.19
0.12
0.17
185
107
241
5.7
6.5
4.1
Invariant targets Green
Red
NIR
0.11
-0.03
0.52*
181
110
235
9.5
10.7
6.6
0.39*
0.37*
0.36*
176
103
245
9.0
10
3.2
0.19
0.12
0.17
138
66
241
13
13
4.0
*significant correlations p < 0.05
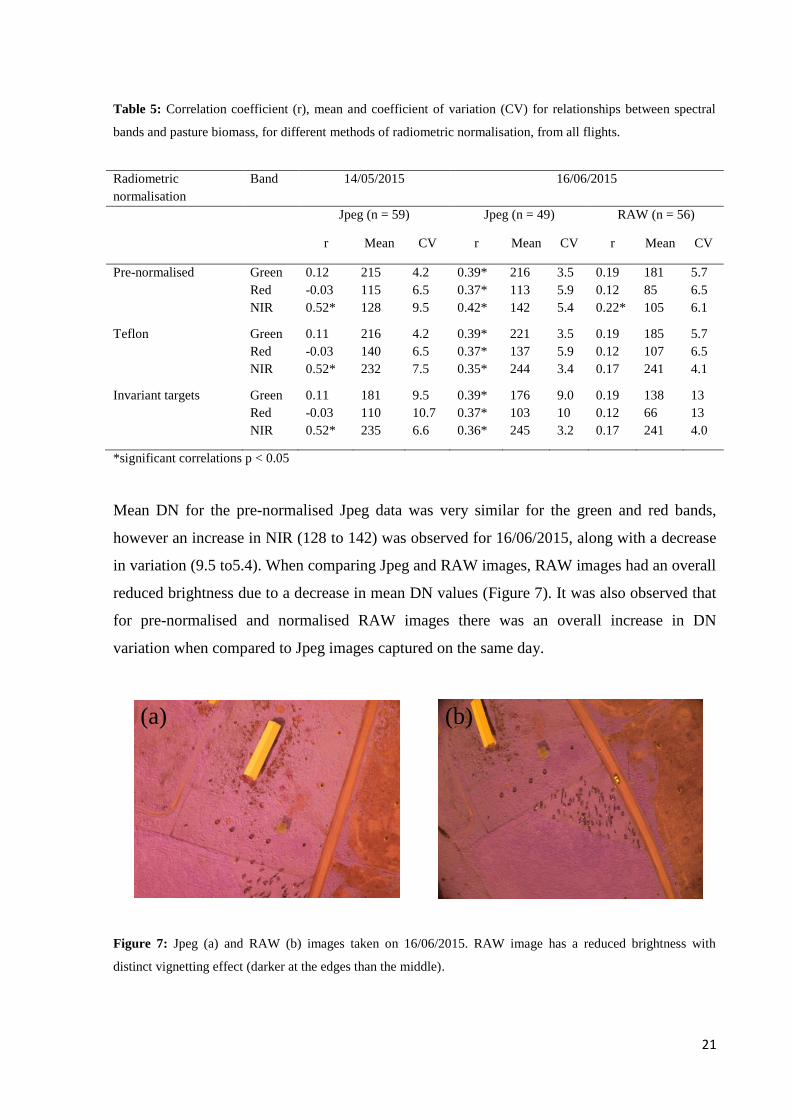
Mean DN for the pre-normalised Jpeg data was very similar for the green and red bands,
however an increase in NIR (128 to 142) was observed for 16/06/2015, along with a decrease
in variation (9.5 to5.4). When comparing Jpeg and RAW images, RAW images had an overall
reduced brightness due to a decrease in mean DN values (Figure 7). It was also observed that
for pre-normalised and normalised RAW images there was an overall increase in DN
variation when compared to Jpeg images captured on the same day.
Figure 7: Jpeg (a) and RAW (b) images taken on 16/06/2015. RAW image has a reduced brightness with
distinct vignetting effect (darker at the edges than the middle).
(a) (b)
22
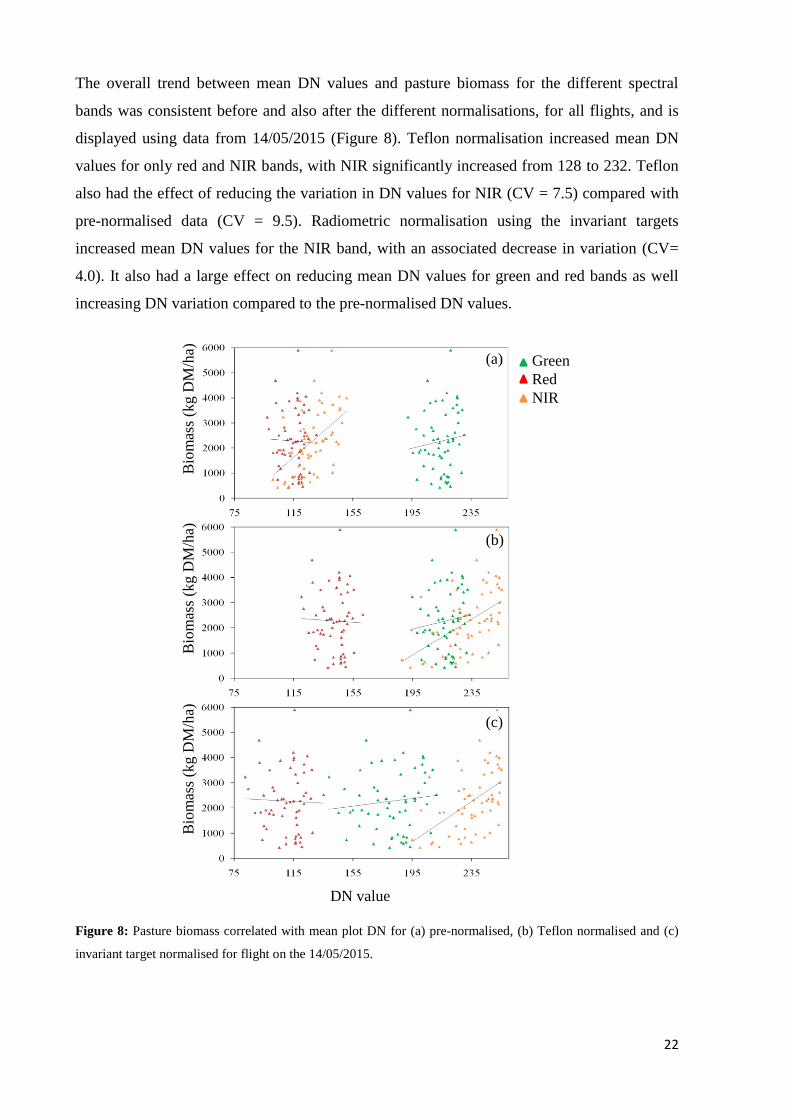
The overall trend between mean DN values and pasture biomass for the different spectral
bands was consistent before and also after the different normalisations, for all flights, and is
displayed using data from 14/05/2015 (Figure 8). Teflon normalisation increased mean DN
values for only red and NIR bands, with NIR significantly increased from 128 to 232. Teflon
also had the effect of reducing the variation in DN values for NIR (CV = 7.5) compared with
pre-normalised data (CV = 9.5). Radiometric normalisation using the invariant targets
increased mean DN values for the NIR band, with an associated decrease in variation (CV=
4.0). It also had a large effect on reducing mean DN values for green and red bands as well
increasing DN variation compared to the pre-normalised DN values.
Figure 8: Pasture biomass correlated with mean plot DN for (a) pre-normalised, (b) Teflon normalised and (c)
invariant target normalised for flight on the 14/05/2015.
Bio
mas
s (k
g D
M/h
a)
DN value
Bio
mas
s (k
g D
M/h
a)B
iom
ass
(kg
DM
/ha)
(a)
(c)
(b)
Green
Red
NIR
23
Relationship between VI and pasture biomass
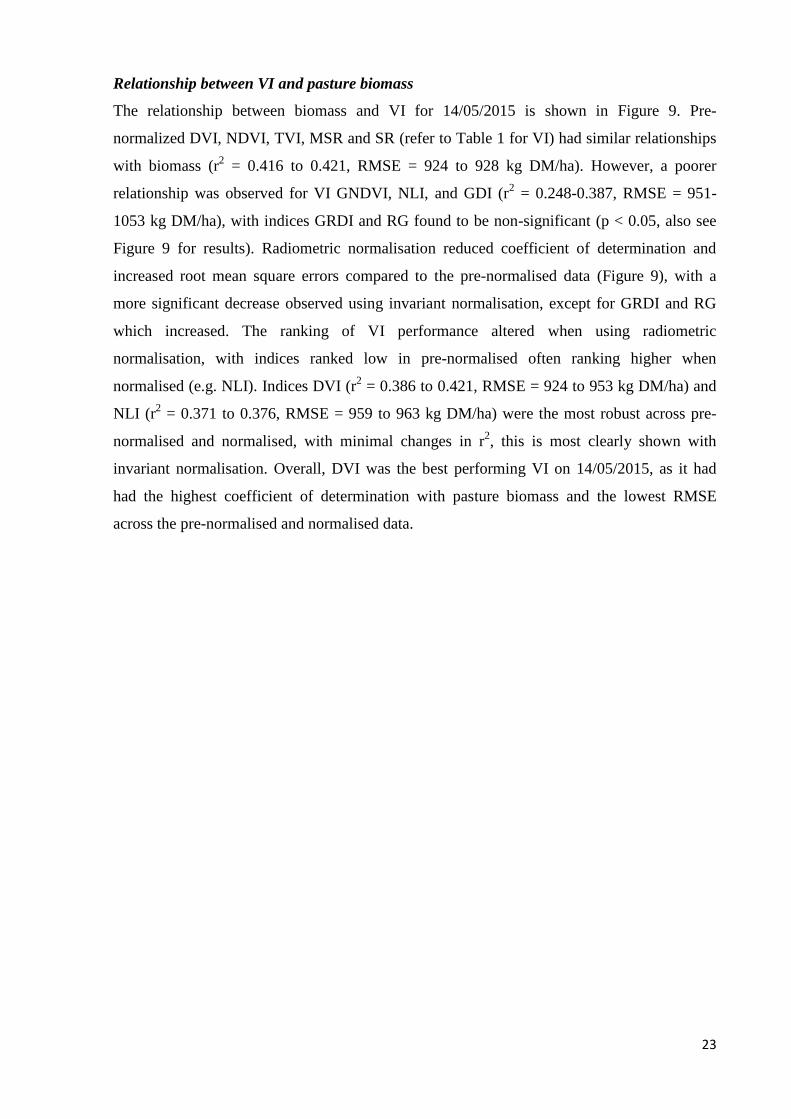
The relationship between biomass and VI for 14/05/2015 is shown in Figure 9. Pre-
normalized DVI, NDVI, TVI, MSR and SR (refer to Table 1 for VI) had similar relationships
with biomass (r2 = 0.416 to 0.421, RMSE = 924 to 928 kg DM/ha). However, a poorer
relationship was observed for VI GNDVI, NLI, and GDI (r2 = 0.248-0.387, RMSE = 951-
1053 kg DM/ha), with indices GRDI and RG found to be non-significant (p < 0.05, also see
Figure 9 for results). Radiometric normalisation reduced coefficient of determination and
increased root mean square errors compared to the pre-normalised data (Figure 9), with a
more significant decrease observed using invariant normalisation, except for GRDI and RG
which increased. The ranking of VI performance altered when using radiometric
normalisation, with indices ranked low in pre-normalised often ranking higher when
normalised (e.g. NLI). Indices DVI (r2 = 0.386 to 0.421, RMSE = 924 to 953 kg DM/ha) and
NLI (r2 = 0.371 to 0.376, RMSE = 959 to 963 kg DM/ha) were the most robust across pre-
normalised and normalised, with minimal changes in r2, this is most clearly shown with
invariant normalisation. Overall, DVI was the best performing VI on 14/05/2015, as it had
had the highest coefficient of determination with pasture biomass and the lowest RMSE
across the pre-normalised and normalised data.
24
Figure 9: Coefficient of determination (r2) and root mean square error (RMSE) of regression analysis between
pasture biomass and vegetation indices for pre-normalised (a,d), Teflon normalised (b,e) and invariant target
normalised (c,f) for flight on 14/05/2015. Significant correlation (p < 0.05) shown by histograms in black.
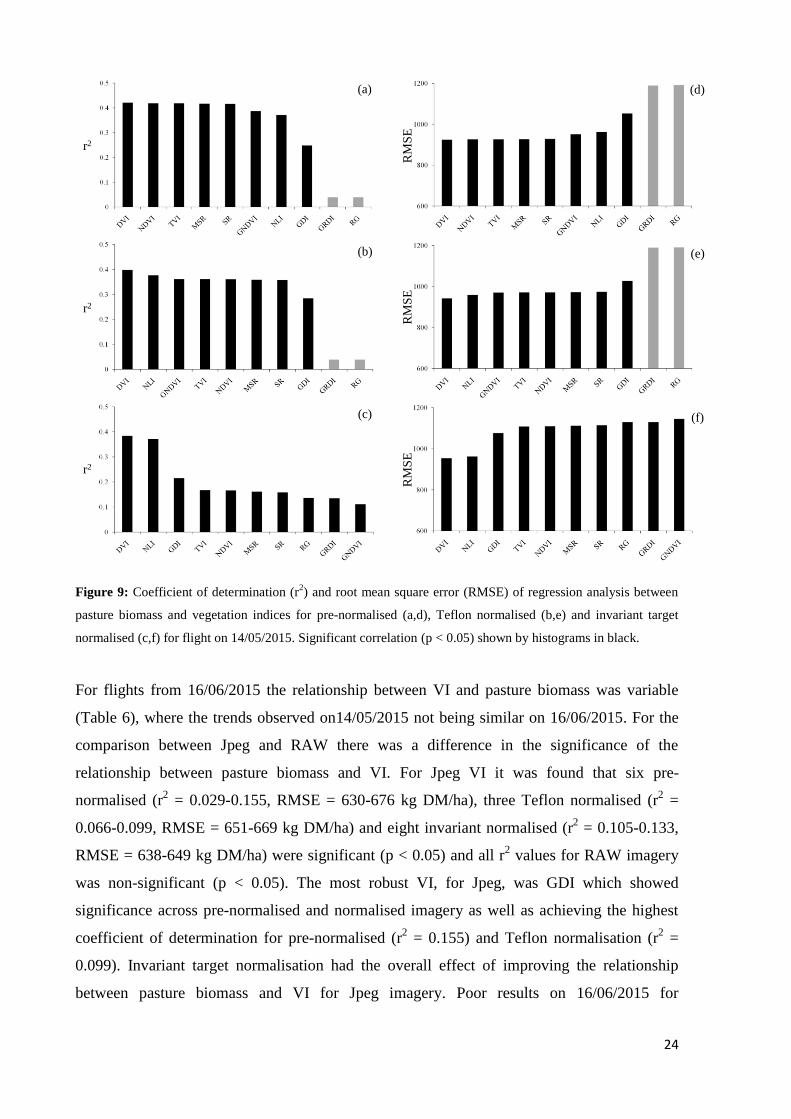
For flights from 16/06/2015 the relationship between VI and pasture biomass was variable
(Table 6), where the trends observed on14/05/2015 not being similar on 16/06/2015. For the
comparison between Jpeg and RAW there was a difference in the significance of the
relationship between pasture biomass and VI. For Jpeg VI it was found that six pre-
normalised (r2 = 0.029-0.155, RMSE = 630-676 kg DM/ha), three Teflon normalised (r
2 =
0.066-0.099, RMSE = 651-669 kg DM/ha) and eight invariant normalised (r2 = 0.105-0.133,
RMSE = 638-649 kg DM/ha) were significant (p < 0.05) and all r2 values for RAW imagery
was non-significant (p < 0.05). The most robust VI, for Jpeg, was GDI which showed
significance across pre-normalised and normalised imagery as well as achieving the highest
coefficient of determination for pre-normalised (r2 = 0.155) and Teflon normalisation (r
2 =
0.099). Invariant target normalisation had the overall effect of improving the relationship
between pasture biomass and VI for Jpeg imagery. Poor results on 16/06/2015 for
(a)
(b)
(c)
r2
r2
r2
(d)
(e)
(f) R
MS
ER
MS
ER
MS
E
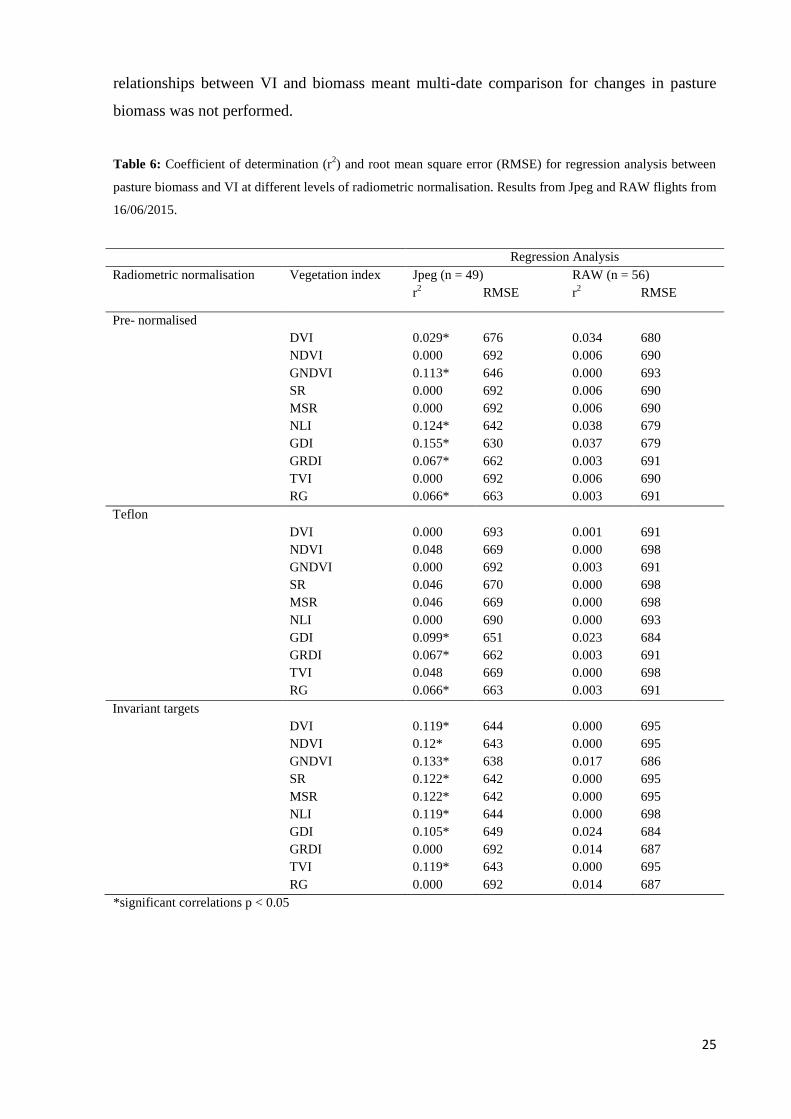
25
relationships between VI and biomass meant multi-date comparison for changes in pasture
biomass was not performed.
Table 6: Coefficient of determination (r2) and root mean square error (RMSE) for regression analysis between
pasture biomass and VI at different levels of radiometric normalisation. Results from Jpeg and RAW flights from
16/06/2015.
Regression Analysis
Radiometric normalisation Vegetation index Jpeg (n = 49) RAW (n = 56)
r2 RMSE r
2 RMSE
Pre- normalised
DVI 0.029* 676 0.034 680
NDVI 0.000 692 0.006 690
GNDVI 0.113* 646 0.000 693
SR 0.000 692 0.006 690
MSR 0.000 692 0.006 690
NLI 0.124* 642 0.038 679
GDI 0.155* 630 0.037 679
GRDI 0.067* 662 0.003 691
TVI 0.000 692 0.006 690
RG 0.066* 663 0.003 691
Teflon
DVI 0.000 693 0.001 691
NDVI 0.048 669 0.000 698
GNDVI 0.000 692 0.003 691
SR 0.046 670 0.000 698
MSR 0.046 669 0.000 698
NLI 0.000 690 0.000 693
GDI 0.099* 651 0.023 684
GRDI 0.067* 662 0.003 691
TVI 0.048 669 0.000 698
RG 0.066* 663 0.003 691
Invariant targets
DVI 0.119* 644 0.000 695
NDVI 0.12* 643 0.000 695
GNDVI 0.133* 638 0.017 686
SR 0.122* 642 0.000 695
MSR 0.122* 642 0.000 695
NLI 0.119* 644 0.000 698
GDI 0.105* 649 0.024 684
GRDI 0.000 692 0.014 687
TVI 0.119* 643 0.000 695
RG 0.000 692 0.014 687
*significant correlations p < 0.05
26
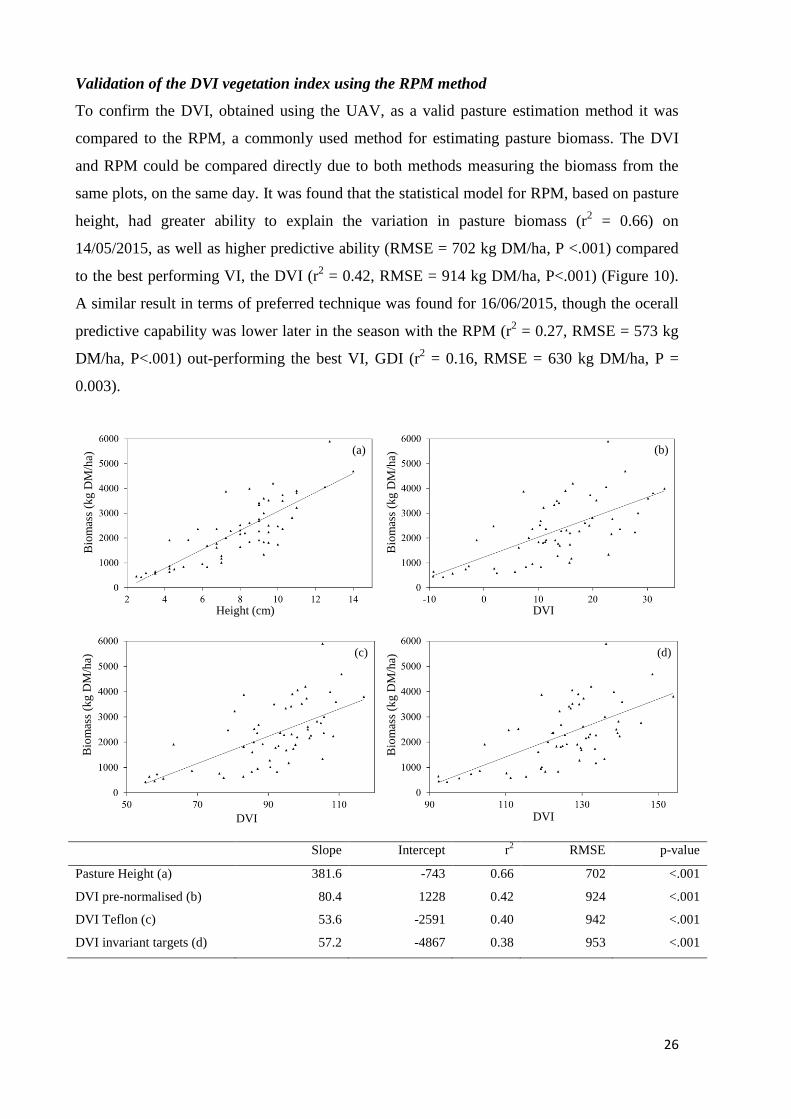
Validation of the DVI vegetation index using the RPM method
To confirm the DVI, obtained using the UAV, as a valid pasture estimation method it was
compared to the RPM, a commonly used method for estimating pasture biomass. The DVI
and RPM could be compared directly due to both methods measuring the biomass from the
same plots, on the same day. It was found that the statistical model for RPM, based on pasture
height, had greater ability to explain the variation in pasture biomass (r2 = 0.66) on
14/05/2015, as well as higher predictive ability (RMSE = 702 kg DM/ha, P <.001) compared
to the best performing VI, the DVI (r2 = 0.42, RMSE = 914 kg DM/ha, P<.001) (Figure 10).
A similar result in terms of preferred technique was found for 16/06/2015, though the ocerall
predictive capability was lower later in the season with the RPM (r2 = 0.27, RMSE = 573 kg
DM/ha, P<.001) out-performing the best VI, GDI (r2 = 0.16, RMSE = 630 kg DM/ha, P =
0.003).
Slope
Intercept r2
RMSE p-value
Pasture Height (a) 381.6 -743 0.66 702 <.001
DVI pre-normalised (b) 80.4 1228 0.42 924 <.001
DVI Teflon (c) 53.6 -2591 0.40 942 <.001
DVI invariant targets (d) 57.2 -4867 0.38 953 <.001
Height (cm)
DVI
Bio
mas
s (k
g D
M/h
a)
Bio
mas
s (k
g D
M/h
a)B
iom
ass
(kg
DM
/ha)
Bio
mas
s (k
g D
M/h
a)
(a) (b)
(d)(c)
DVI
DVI
27
Figure 10: Relationship between (a) pasture biomass and height, (b) DVI pre-normalised, (c) DVI Teflon
normalised and (d) DVI invariant target normalised. Slope and intercept are shown with associated r2, RMSE
and significance (p < 0.05). Data acquisition from 14/05/2015.
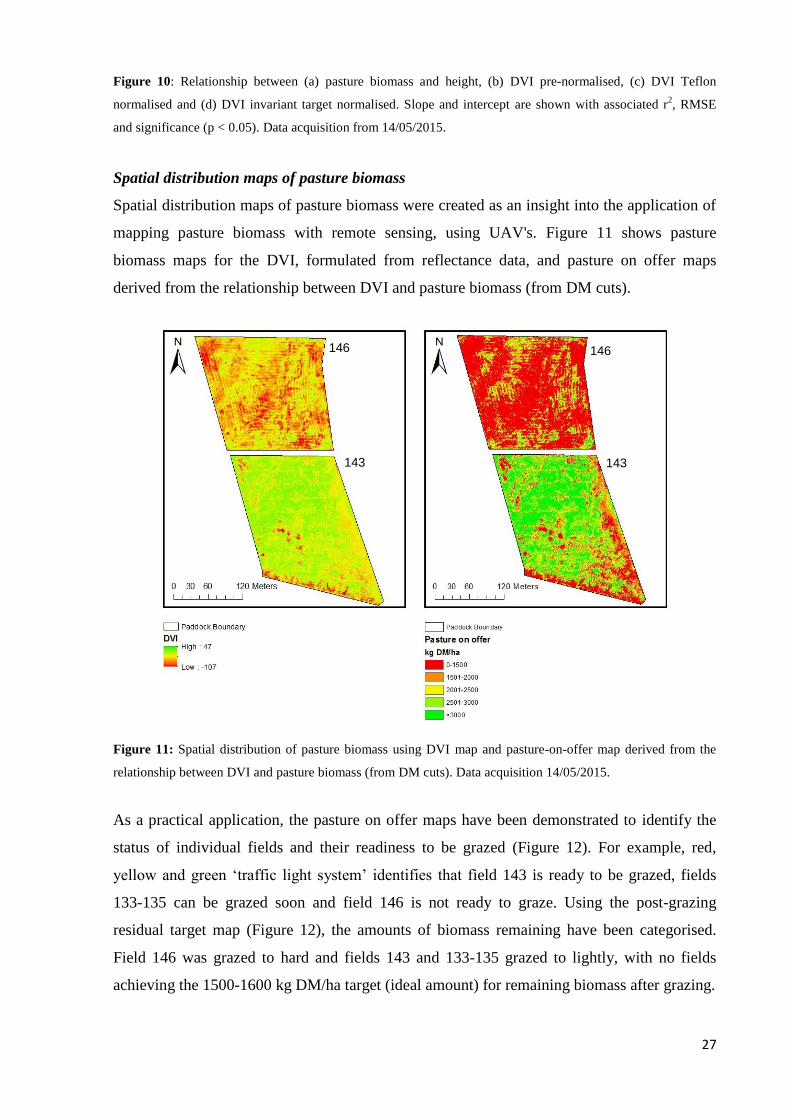
Spatial distribution maps of pasture biomass
Spatial distribution maps of pasture biomass were created as an insight into the application of
mapping pasture biomass with remote sensing, using UAV's. Figure 11 shows pasture
biomass maps for the DVI, formulated from reflectance data, and pasture on offer maps
derived from the relationship between DVI and pasture biomass (from DM cuts).
Figure 11: Spatial distribution of pasture biomass using DVI map and pasture-on-offer map derived from the
relationship between DVI and pasture biomass (from DM cuts). Data acquisition 14/05/2015.
As a practical application, the pasture on offer maps have been demonstrated to identify the
status of individual fields and their readiness to be grazed (Figure 12). For example, red,
yellow and green ‗traffic light system‘ identifies that field 143 is ready to be grazed, fields
133-135 can be grazed soon and field 146 is not ready to graze. Using the post-grazing
residual target map (Figure 12), the amounts of biomass remaining have been categorised.
Field 146 was grazed to hard and fields 143 and 133-135 grazed to lightly, with no fields
achieving the 1500-1600 kg DM/ha target (ideal amount) for remaining biomass after grazing.
146
143
146
143
28
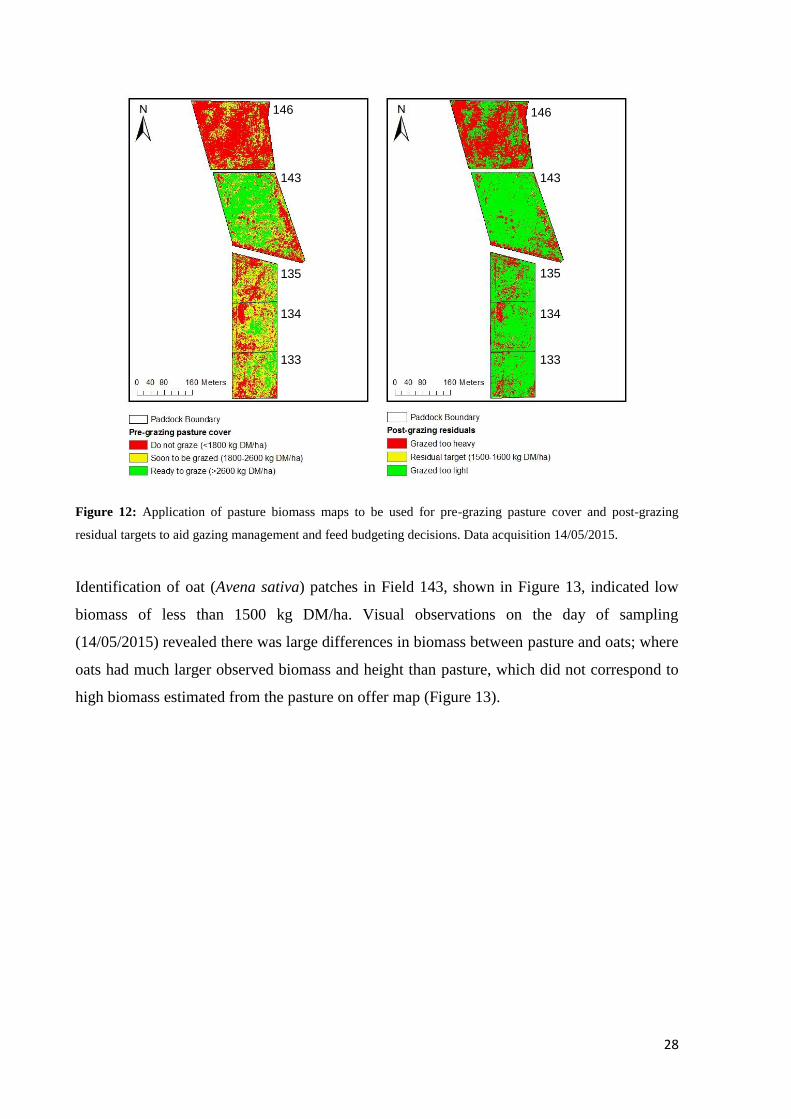
Figure 12: Application of pasture biomass maps to be used for pre-grazing pasture cover and post-grazing
residual targets to aid gazing management and feed budgeting decisions. Data acquisition 14/05/2015.
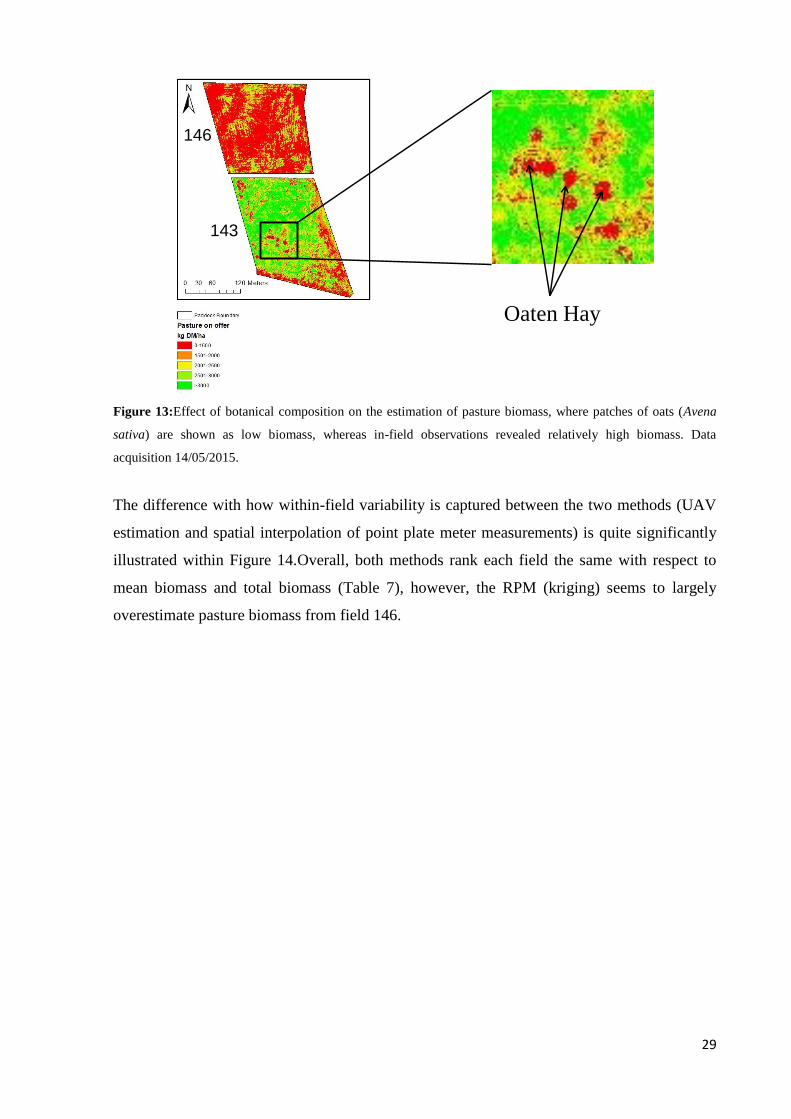
Identification of oat (Avena sativa) patches in Field 143, shown in Figure 13, indicated low
biomass of less than 1500 kg DM/ha. Visual observations on the day of sampling
(14/05/2015) revealed there was large differences in biomass between pasture and oats; where
oats had much larger observed biomass and height than pasture, which did not correspond to
high biomass estimated from the pasture on offer map (Figure 13).
146146
143
135
143
134
135
133
134
133
29
Figure 13:Effect of botanical composition on the estimation of pasture biomass, where patches of oats (Avena
sativa) are shown as low biomass, whereas in-field observations revealed relatively high biomass. Data
acquisition 14/05/2015.
The difference with how within-field variability is captured between the two methods (UAV
estimation and spatial interpolation of point plate meter measurements) is quite significantly
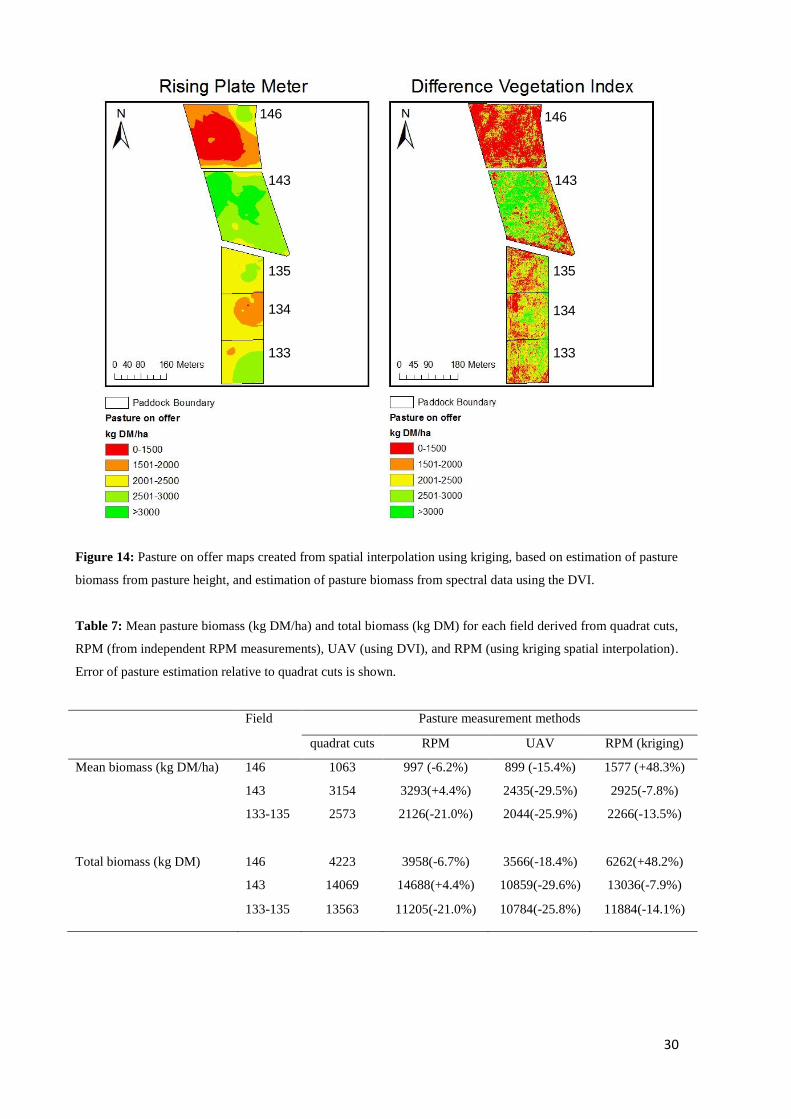
illustrated within Figure 14.Overall, both methods rank each field the same with respect to
mean biomass and total biomass (Table 7), however, the RPM (kriging) seems to largely
overestimate pasture biomass from field 146.
Oaten Hay
146
143
30
Figure 14: Pasture on offer maps created from spatial interpolation using kriging, based on estimation of pasture
biomass from pasture height, and estimation of pasture biomass from spectral data using the DVI.
Table 7: Mean pasture biomass (kg DM/ha) and total biomass (kg DM) for each field derived from quadrat cuts,
RPM (from independent RPM measurements), UAV (using DVI), and RPM (using kriging spatial interpolation).
Error of pasture estimation relative to quadrat cuts is shown.
Field Pasture measurement methods
quadrat cuts RPM UAV RPM (kriging)
Mean biomass (kg DM/ha) 146 1063 997 (-6.2%) 899 (-15.4%) 1577 (+48.3%)
143 3154 3293(+4.4%) 2435(-29.5%) 2925(-7.8%)
133-135 2573 2126(-21.0%) 2044(-25.9%) 2266(-13.5%)
Total biomass (kg DM) 146 4223 3958(-6.7%) 3566(-18.4%) 6262(+48.2%)
143 14069 14688(+4.4%) 10859(-29.6%) 13036(-7.9%)
133-135 13563 11205(-21.0%) 10784(-25.8%) 11884(-14.1%)
146146
143
135
143
134
135
133
134
133
31
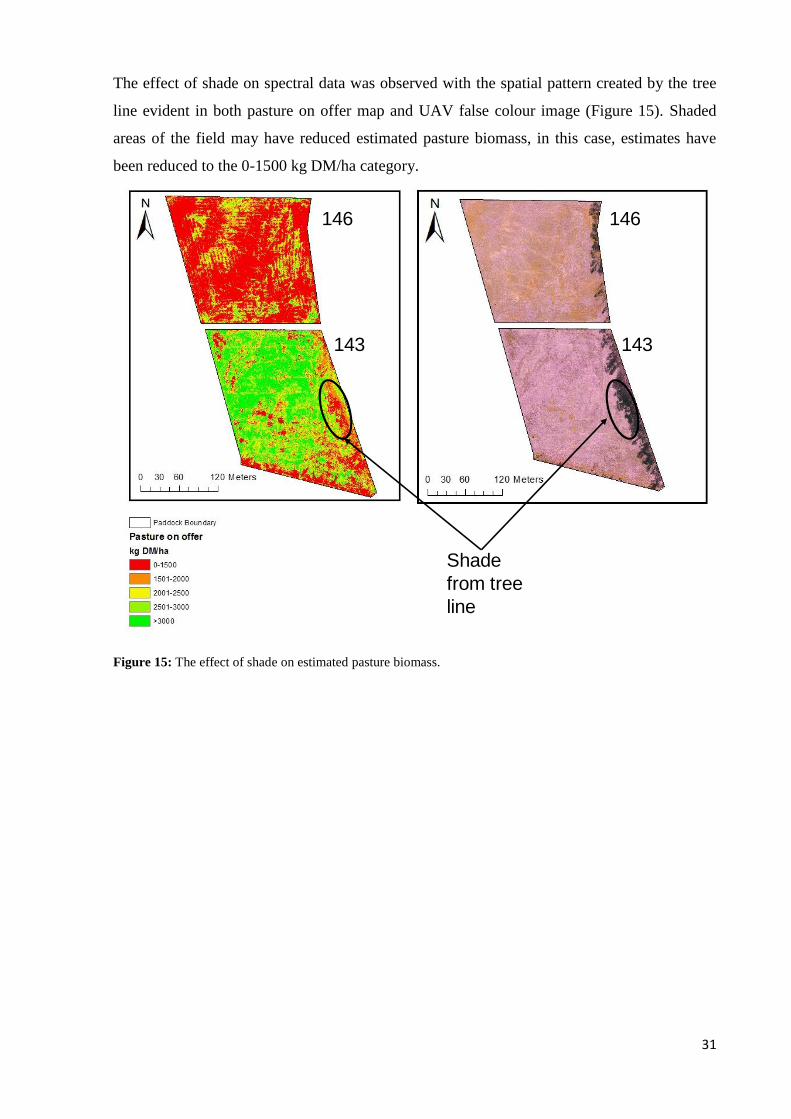
The effect of shade on spectral data was observed with the spatial pattern created by the tree
line evident in both pasture on offer map and UAV false colour image (Figure 15). Shaded
areas of the field may have reduced estimated pasture biomass, in this case, estimates have
been reduced to the 0-1500 kg DM/ha category.
Figure 15: The effect of shade on estimated pasture biomass.
Shade
from tree
line
146
143
146
143
32
Discussion:
Rising plate meter and UAV
Due to limited research on the use of UAV and their nature as an emerging technology, this
study represents the first known work to directly evaluate UAV remote sensing methods to
the most commonly used and recommended industry method, the RPM, when evaluating
pasture biomass for dairy systems. Previous experience with the RPM have shown it to be
accurate for research purposes, with its automated function and simplicity making it
applicable to aid farm decisions (Earle and McGowan, 1979, Lile et al., 2001, Thomson et al.,
2001). It was hypothesized that the UAV, using VI, would perform similar to the RPM, which
uses pasture height, in estimating pasture biomass. However, this hypothesis was rejected,
with the RPM explaining 24% and 11% more variation in pasture biomass than the indices
DVI (14/05/2015) and GDI (16/06/2015) respectively, the best performing VI for each date.
A range of results for the performance of RPM are reported in the literature (r2 = 0.31 to 0.92)
for similar species composition to those in this study (Stockdale, 1984a, Stockdale and Kelly,
1984, Scrivner et al., 1986, Murphy et al., 1995, Sanderson et al., 2001). This study showed
that the RPM performed within this range, however, coefficient of variation (15-32%) was
found to be greater than other studies (11-22%) (Stockdale, 1984a, Stockdale and Kelly,
1984). Earle and McGowan (1979) showed that within operator variation of RPM
measurements resulted in yield estimate errors of less than 3%, but they found significant
variation in yield estimation between operators, mainly due to technique differences whilst
operating the RPM. One operator was used for all RPM measurements in this study, which
reduced the likelihood of operator error and therefore estimates of pasture biomass. Any error
discrepancies associated with the RPM were thought to arise from uneven soil surface, cow
dung, senescent vegetation and potential inclusion of other pasture species within the quadrat
(Earle and McGowan, 1979, Stockdale and Kelly, 1984, Sanderson et al., 2001).
Performance of VI
The use of green and red band VI showed poor results, that were similar to that of Gianelle
and Vescovo (2007) and Tucker (1979) using spectrometers. Vegetation indices using red and
NIR bands consistently outperformed VI containing the green band, suggesting use of the
green band inappropriate for estimating pasture biomass. The good performance of red and
NIR bands is due to the strong relationship between red and NIR areas of the spectrum with
33
physical and physiological properties of vegetation (Knipling, 1970, Tucker, 1979, Peñuelas
and Filella, 1998).
Relatively high r2
values were obtained on 14/05/2015, compared with 16/05/2015. The low r2
for the second date, in terms of estimating in pasture biomass, made multi-date comparisons
less reliable in this study. However, poor results for the RPM on 16/05/2015 indicated that
camera performance (i.e. VI) and environmental conditions were not solely to blame, and that
choice of quadrats potentially failed to accommodate sufficient range in biomass to achieve
similar results as on 14/05/2015. A smaller range in pasture biomass, hence smaller range in
corresponding pasture height (for RPM) and VI, has been shown to have a large influence
over r2 values (Cornell and Berger, 1987). The data for the second date could have been
improved if the farmer had grazed some of paddocks just prior to taking the measurements, to
make the range in biomass greater. Different acquisition dates within season cannot be ruled
out in affecting the result of the relationship between biomass and pasture height or VI as this
is often observed in the literature (e.g.(Earle and McGowan, 1979, Michell, 1982, Lelong et
al., 2008, Edirisinghe et al., 2011).
Further discrepancies between individual spectral bands and biomass, where significant
correlation was only established for the NIR band on 14/05/2015, whereas, significant
correlations were drawn for all bands on 16/06/2015, could have influenced VI results. This is
an inherent problem when dealing with consumer-grade digital cameras using wide
bandwidths, large band overlaps, and restrictive use of broadband VI (von Bueren et al.,
2015). The use of consumer-grade digital cameras to predict quantitative values will be less
accurate than more expensive sensors with narrow spectral bands and use of specific
bandwidths to assess different biophysical parameters (Mutanga and Skidmore, 2004, Berni et
al., 2009, Kawamura et al., 2011, Vescovo et al., 2012, von Bueren et al., 2015).
UAV camera and hyperspectral camera
Established relationships exist between VI and various biophysical parameters such as leaf
area index, above ground biomass, green ratio, and absorption of photosynthetically active
radiation. These have been derived/calibrated from monitoring vegetation/crops/pastures
using field spectrometers (Asrar et al., 1984, Weiser et al., 1986, Boschetti et al., 2007,
Gianelle and Vescovo, 2007, Flynn et al., 2008, Vescovo et al., 2012). Due to this,
cameras/sensors on board UAVs for monitoring vegetation/crop/pasture are assessed for their
34
performance or calibrated against spectrometers. Primicerio et al. (2012) tested a multispectral
camera (Tetracam) for vineyard management and showed strong correlation (r2 = 0.97) of
NDVI values to a field spectrometer. Furthermore, Swain et al. (2010) and von Bueren et al.
(2015) found similar correlations between multispectral cameras and spectrometers (r2 =
0.897 and 0.92 respectively).
The lack of a field spectrometer in this study meant ground spectral reflectance of quadrant
biomass and calibration targets could not be determined at time of image acquisition. Instead,
an in-situ hyperspectral camera, under controlled light conditions was used to calibrate
targets, consisting of wooden, coloured, boards, for invariant target normalisation only.
Preliminary regressions between hyperspectral and UAV camera showed very strong
correlations (r2> 0.93) for all dates, image formats and bands inferring use of transform
equations for invariant target normalisation was reliable. However, calibration of targets
occurred under different light conditions to that in the field and this has potential to introduce
calibration error. The wooden targets were easily deployed in the field and avoided many
major limitations outlined by Moran et al. (2001) when using tarps. Negligible differences in
r2
indicated that calibration targets were spectrally consistent over changes in time, irradiance
and spectral bands. Using a Canon PowerShot SD 780 IS von Bueren et al. (2015) established
a good correlation with a high-resolution spectrometer (r2 = 0.65). If a field spectrometer was
available it would be expected similar correlations could be achieved considering the camera
in this study was similar (Canon Powershot S110 NIR).
Radiometric normalisation
Radiometric calibration (relative or absolute) aims at reducing environmental effects, such as
illumination levels due to changes in angle from sun, target and sensor, by achieving
consistent levels of radiance at the surface level both temporally and spatially by improving
at-sensor radiance (Hunt et al., 2003, Kelcey and Lucieer, 2012). Radiometric normalisation
(also known as relative radiometric calibration) was expected to improve the relationship
between pasture biomass and VI by accounting for these changes. Neither radiometric
normalisation methods, Teflon and invariant target, followed the expected results, in fact, the
reverse was observed and pre-normalised VI were found to estimate pasture biomass with
higher accuracy. Invariant target normalisation had a greater negative effect on the
relationship between biomass and VI than that of Teflon normalisation.
35
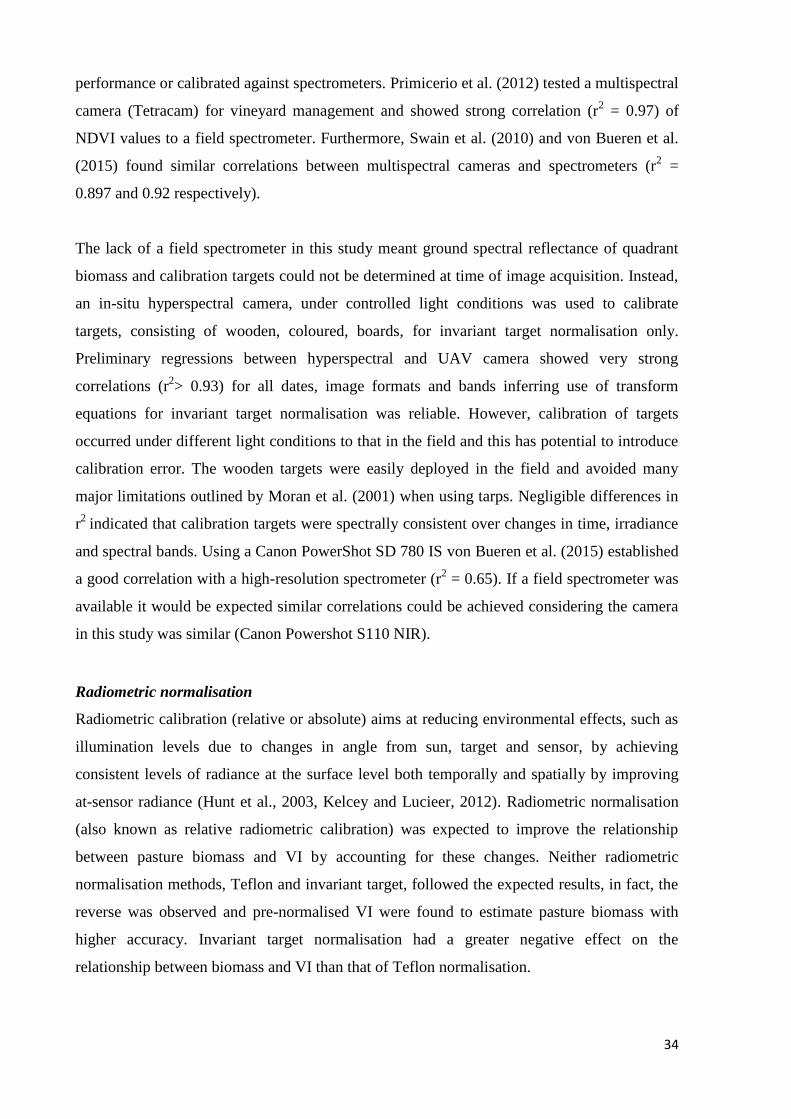
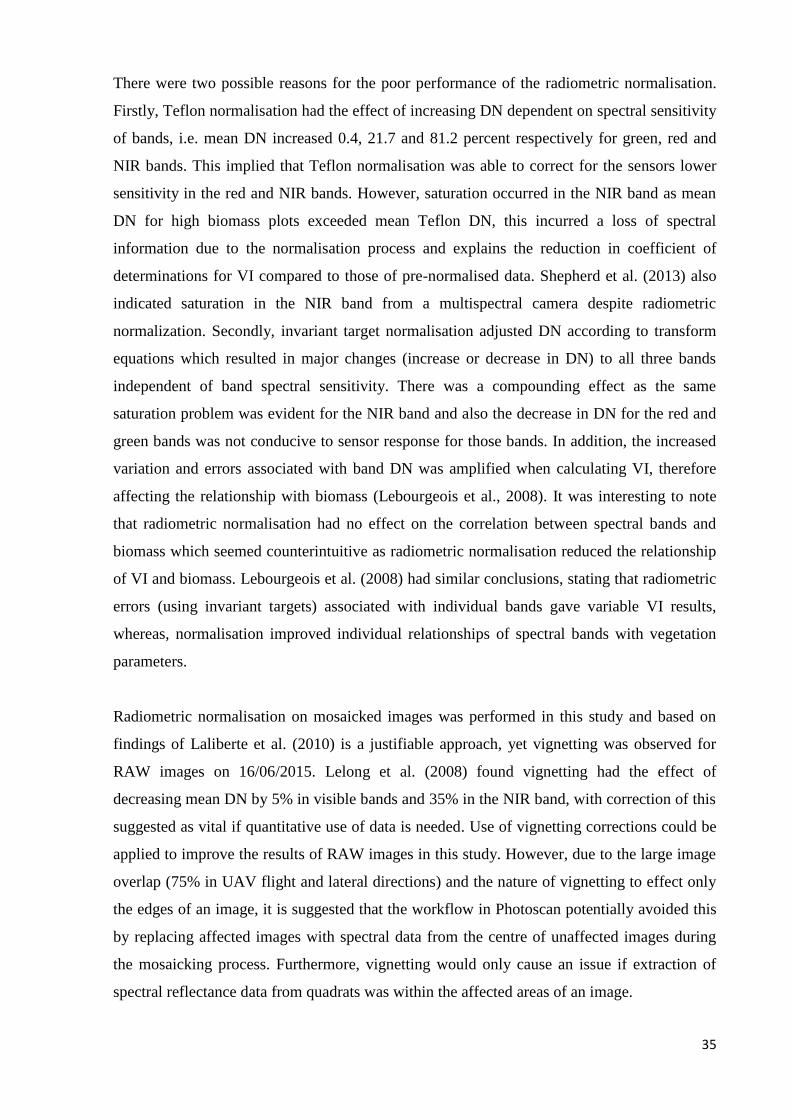
There were two possible reasons for the poor performance of the radiometric normalisation.
Firstly, Teflon normalisation had the effect of increasing DN dependent on spectral sensitivity
of bands, i.e. mean DN increased 0.4, 21.7 and 81.2 percent respectively for green, red and
NIR bands. This implied that Teflon normalisation was able to correct for the sensors lower
sensitivity in the red and NIR bands. However, saturation occurred in the NIR band as mean
DN for high biomass plots exceeded mean Teflon DN, this incurred a loss of spectral
information due to the normalisation process and explains the reduction in coefficient of
determinations for VI compared to those of pre-normalised data. Shepherd et al. (2013) also
indicated saturation in the NIR band from a multispectral camera despite radiometric
normalization. Secondly, invariant target normalisation adjusted DN according to transform
equations which resulted in major changes (increase or decrease in DN) to all three bands
independent of band spectral sensitivity. There was a compounding effect as the same
saturation problem was evident for the NIR band and also the decrease in DN for the red and
green bands was not conducive to sensor response for those bands. In addition, the increased
variation and errors associated with band DN was amplified when calculating VI, therefore
affecting the relationship with biomass (Lebourgeois et al., 2008). It was interesting to note
that radiometric normalisation had no effect on the correlation between spectral bands and
biomass which seemed counterintuitive as radiometric normalisation reduced the relationship
of VI and biomass. Lebourgeois et al. (2008) had similar conclusions, stating that radiometric
errors (using invariant targets) associated with individual bands gave variable VI results,
whereas, normalisation improved individual relationships of spectral bands with vegetation
parameters.
Radiometric normalisation on mosaicked images was performed in this study and based on
findings of Laliberte et al. (2010) is a justifiable approach, yet vignetting was observed for
RAW images on 16/06/2015. Lelong et al. (2008) found vignetting had the effect of
decreasing mean DN by 5% in visible bands and 35% in the NIR band, with correction of this
suggested as vital if quantitative use of data is needed. Use of vignetting corrections could be
applied to improve the results of RAW images in this study. However, due to the large image
overlap (75% in UAV flight and lateral directions) and the nature of vignetting to effect only
the edges of an image, it is suggested that the workflow in Photoscan potentially avoided this
by replacing affected images with spectral data from the centre of unaffected images during
the mosaicking process. Furthermore, vignetting would only cause an issue if extraction of
spectral reflectance data from quadrats was within the affected areas of an image.
36
Image format
It has been reported that the use of Jpeg or TIFF images in remote sensing results in reduced
image quality due to radiometric degradation (Lelong et al., 2008, von Bueren et al., 2015).
Radiometric resolution is lowered by camera specific operations during Jpeg ‗lossy‘
compression and DN having a non-linear relationship with brightness throughout the image
(Lebourgeois et al., 2008). Many authors recommend the use of unprocessed (RAW) images
for best radiometric performance (Lebourgeois et al., 2008, Lelong et al., 2008, von Bueren et
al., 2015). It was expected that RAW images would out-perform Jpeg images at estimating
pasture biomass from VI; however, this was not observed, with Jpeg VI performing better
overall than RAW format, regardless of radiometric normalisation method on 16/06/2015.
Correlations between spectral bands and biomass was consistently lower for RAW images
explaining the poor performance of VI. Summing of radiometric errors outlined before and by
Lebourgeois et al. (2008) support the results that no improvements were found from RAW
radiometric normalisation. Conversion of RAW images to TIFF was performed before image
mosaicking. TIFF compression is ‗lossless‘, therefore any radiometric degradation is thought
to be negligible from this process (Bauer and Becker, 2011).
Implication for UAV in the dairy industry
The availability of pasture biomass at a whole farm scale is a key driver for achieving high
pasture utilisation, farm profitability and efficient management decisions (Hedley et al., 2006,
Romera et al., 2010). This study has validated that UAV and remote sensing can provide, at a
field scale, reliable estimates of pasture biomass availability. It has shown the need to move
away from qualitative remote sensing (DVI map) that only indicate areas of low and high
biomass which is open to interpretation, to more quantitative remote sensing (pasture on offer
map) that can provide useful information that will drive grazing management and feed
budgeting decisions.
The present study has demonstrated that post- and pre-grazing information can be derived
from mapping pasture biomass and be presented in a way which is conducive to easy data
interpretation, ideal for time-poor farmers. If the approach used in this study was applied to a
whole-farm scale it is has implications for grazing intervals and intensities which can avoid
over- and under-grazing, beneficial to plant persistence, regrowth and nutritional status
(White et al., 2002, Lee et al., 2008a, b, Macdonald et al., 2008a, Chapman et al., 2012). Pre-
grazing pasture cover maps allows direct application of the ―feed wedge‖ management tool
37
(www.dairynz.co.nz) that enables ranking of a farms fields based on individual performance,
promoting correct grazing intervals or rotations tailored to the readiness of a field to be
grazed. Pre-grazing pasture cover maps that can provide spatial identification of within field
pasture biomass, along with mean and/or total field biomass, can be used as a tool to integrate
the appropriate stocking rates and pasture allocation based on animal requirements. The
benefits of correct stocking rate and accurately allocating pasture to cows has been shown to
positively affect milk production (Fulkerson et al., 2005, Macdonald et al., 2008b). Post-
grazing residual maps provide a further validation whether the grazing management decisions
imposed are adequate. Indication of over- or under-grazing of fields supplies the farmer with
direct and powerful feedback on past decisions about feed supply to animals, which presents
itself to better future decisions in the allocation of feed as pasture or as supplements in the
diary to meet that optimum post-grazing residual.
The concept that frequent mapping of farm pasture availability, via UAVs, is possible lends
itself to be useful in feed budgeting. For the medium to long term planning, UAVs can
provide a holistic approach to what on-farm pasture biomass is doing throughout the season
which can help identify surplus or deficits at critical times of the year. For example, early
season detection of pasture biomass can assist in deciding when to commence grazing or,
during spring, when pasture growth rates start to exceed animal requirement, identification of
fields that should be locked up for forage conservation. Furthermore, there is a range of
software packages available to farmers/advisors to conduct feed budgeting or planning, for
example FeedPlan (Dobos et al., 2004). One of the main inputs these packages require is
pasture availability or biomass which is initially an educated guess with the possibility of
objective estimation coming later (Dobos et al., 2004). The ability of the UAV to estimate
available pasture biomass at the field and whole farm scale allows the potential to feed such
information directly into feed budgeting tools.
Recommendations and implications for future research
The use of wooden targets to extract spectral data from ground measurements was found to be
simple, accurate and robust. The methodology is repeatable and can be easily adopted in
future research for other remote sensing applications
Radiometric normalisation was not a useful component of this study, potentially due to the
limitations of the low cost consumer grade sensor, not the radiometric normalisation method.
The sensor used in the study did not provide adequate radiometric resolution for successful
38
normalisation. It is inevitable that multi-date comparison and seasonal calibration will be
required for UAV much the same as other objective methods. For that reason radiometric
normalisation will be a necessity to achieve consistent and comparable results over time.
Future improvement and/or evaluation of higher grade sensors in estimating biophysical
parameters may improve results. As development and investment in UAV technologies drives
down the costs and weight of higher spectral fidelity sensors, this may see an increasing
availability of higher quality sensors at a low cost.
The use of Jpeg format had a superior performance in comparison to RAW format. The
shorter processing time required for Jpeg is an advantage, however for high quality results,
minimizing radiometric degradation, RAW image would be the preferred format for future
studies.
It was evident that multi-date comparison of pasture biomass estimation was variable and this
has limitations when it comes to an industry that needs frequent and reliable information to
make critical decisions. The dairy industry would need a robust algorithm that is resistant to
changing conditions within and between seasons for accurate pasture estimation specific to
the chosen VI. This would only come about from repeated calibration of the UAV throughout
the growing season. An alternative approach to estimating pasture biomass that uses climatic,
soil and plant data to derive pasture growth models, (e.g.(Hill et al., 2004, Edirisinghe et al.,
2011, Rahman et al., 2014) could reduce repeated ground calibration measurements.
There is an ever growing concerns for the environment due to intensification of dairy farms,
increased effluent production and fertilizers use, such as nitrogen and phosphorus (Gourley et
al., 2007, Monaghan et al., 2007). Lelong et al. (2008) demonstrated UAVs can estimate and
map spatial variability of nitrogen in wheat crops. The use of UAVs to determine and
spatially map pasture nutrient requirements would be extremely valuable to the dairy industry
in terms of nutrient budgeting, reduced input costs, variable rate application and mitigation of
environmental issues such as runoff in to waterways.
This was a pilot study to test the potential of UAV in the dairy industry. It did not focus on
efficient workflow methods that could reduce time between image acquisition and production
of useful pasture biomass maps. This is not only a problem for this study but a general UAV
remote sensing problem that will most notably improve in time. However, it did demonstrate
that data from UAV could be easily interpreted but work needs to be done to develop a
workflow that provides the output within a timely manner. The results from this study,
39
confirm that this method is able to produce reliable estimates of pasture biomass, that are
comparable (though slightly less accurate for point measurements) to industry best practice
methods such as RPM, but with the significant advantage of powerful maps of the spatial
distribution of pasture across the paddock. These advances in technology offer the potential
when combined with some additional research refinement in the methods and workflow, to be
integrated into dairy systems to optimise feed allocation and drive increased productivity for
this important industry.
Conclusions:
Although pasture biomass is inherently difficult to estimate accurately it is an essential factor
that enables improvement in pasture management, pasture utilisation and farm profitability.
This study demonstrated that UAV can be used to estimate and spatially map pasture biomass
whilst avoiding issues associated with other remote sensing platforms. The UAV does come
with its own set of limitations, however, with significant interest and fast development in
UAV (and sensor) technologies there is no doubt these constraints will be improved. Further
studies are needed to evaluate other UAV and sensors that can specifically target the needs of
the dairy industry. With that in mind UAV can be considered a useful future tool for dairy
farmers.
40
References:
Asrar, G., M. Fuchs, E. Kanemasu, and J. Hatfield. 1984. Estimating absorbed photosynthetic
radiation and leaf area index from spectral reflectance in wheat. Agronomy journal 76(2):300-
306.
Bauer, S. and C. Becker. 2011. Automated preservation: the case of digital raw photographs.
Pages 39-49 in Digital Libraries: For Cultural Heritage, Knowledge Dissemination, and
Future Creation. Springer.
Berni, J., P. J. Zarco-Tejada, L. Suárez, and E. Fereres. 2009. Thermal and narrowband
multispectral remote sensing for vegetation monitoring from an unmanned aerial vehicle.
Geoscience and Remote Sensing, IEEE Transactions on 47(3):722-738.
Boschetti, M., S. Bocchi, and P. A. Brivio. 2007. Assessment of pasture production in the
Italian Alps using spectrometric and remote sensing information. Agriculture, ecosystems &
environment 118(1):267-272.
Bruegge, C. J., A. E. Stiegman, R. A. Rainen, and A. W. Springsteen. 1993. Use of Spectralon
as a diffuse reflectance standard for in-flight calibration of earth-orbiting sensors. Optical
Engineering 32(4):805-814.
Campbell, N. and G. Arnold. 1973. The visual assessment of pasture yield. Animal
Production Science 13(62):263-267.
Catchpole, W. and C. Wheeler. 1992. Estimating plant biomass: a review of techniques.
Australian Journal of Ecology 17(2):121-131.
Cayley, J. W. D. and P. R. Bird. 1996. Techniques for measuring pastures. Pastoral and
Veterinary Institute Hamilton, Victoria,, Australia.
Chapman, D. F., S. N. Kenny, D. Beca, and I. R. Johnson. 2008. Pasture and forage crop
systems for non-irrigated dairy farms in southern Australia. 1. Physical production and
economic performance. Agricultural Systems 97(3):108-125.
Chapman, D. F., J. Tharmaraj, M. Agnusdei, and J. Hill. 2012. Regrowth dynamics and
grazing decision rules: further analysis for dairy production systems based on perennial
ryegrass (Lolium perenne L.) pastures. Grass and Forage Science 67(1):77-95.
Chen, J. M. 1996. Evaluation of vegetation indices and a modified simple ratio for boreal
applications. Canadian Journal of Remote Sensing 22(3):229-242.
41
Cornell, J. and R. Berger. 1987. Factors that influence the value of the coefficient of
determination in simple linear and nonlinear regression models. Phytopathology 77(1):63-70.
DairyAustralia. 2013. Australian dairy Industry In Focus 2013 (Dairy Australia Ltd.:
Melbourne).
Davies, L., Alford, A., Hollis, G. 1999. The financial performance of the Dairy Industry in six
regions of NSW, 1991 to 1997. Economic Research Report No.2, Nsw Agriculture, NSW.
Dillon, P. 2007. Achieving high dry-matter intake from pasture with grazing dairy cows.
Frontis 18:1-26.
Dillon, P., J. Roche, L. Shalloo, and B. Horan. 2005. Optimising financial return from grazing
in temperate pastures. Utilisation of grazed grass in temporal animal systems:131-147.
Dobos, R. C., A. M. Ashwood, K. Moore, and M. Youman. 2004. A decision tool to help in
feed planning on dairy farms. Environmental Modelling & Software 19(10):967-974.
Doyle, P. and K. Kelly. 1998. The Victorian dairy industry–improving performance.
Agronomy–growing a greener future. Proceedings of 9th Agronomy Conference:119-127.
Earle, D. F. and A. A. McGowan. 1979. Evaluation and calibration of an automated rising
plate meter for estimating dry matter yield of pasture. Australian Journal of Experimental
Agriculture 19(98):337-343.
Eastwood, C. and S. Kenny. 2009. Art or Science?: Heuristic versus data driven grazing
management on dairy farms. Extension farming systems journal 5(95-102).
Eastwood, C., G. Mata, and R. N. Handcock. 2009. Evaluating satellite-based pasture
measurement for Australian dairy farmers. in Proc. of the Precision Livestock farming, Joint
International Agricultural Conference, Netherlands.
Edirisinghe, A., G. E. Donald, D. A. Henry, G. Mata, S. G. Gherardi, S. P. Oldham, S. P.
Gittins, and R. C. G. Smith. 2004. Pastures from space–validating remotely sensed estimates
of feed on offer. Page 234 in Proc. of 25th biennial conference of the Australian Society of
Animal Production. Animal Production in Australia.
Edirisinghe, A., M. Hill, G. Donald, and M. Hyder. 2011. Quantitative mapping of pasture
biomass using satellite imagery. International Journal of Remote Sensing 32(10):2699-2724.
Edirisinghe, A., M. J. Hill, G. E. Donald, M. Hyder, B. Warren, G. A. Wheaton, and R. C. G.
Smith. 2000. Estimating feed-on-offer and pasture growth rate using remote sensing. in Proc.
42
10th Australasian Remote Sensing and Photogrammetry Conference, Adelaide. Fremantle,
Oct.
Fletcher, J. E. and M. E. Robinson. 1956. A capacitance meter for estimating forage weight.
Journal of Range Management:96-97.
Flynn, E. S., C. T. Dougherty, and O. Wendroth. 2008. Assessment of pasture biomass with
the normalized difference vegetation index from active ground-based sensors. Agronomy
Journal 100(1):114-121.
Fornace, K. M., C. J. Drakeley, T. William, F. Espino, and J. Cox. 2014. Mapping infectious
disease landscapes: unmanned aerial vehicles and epidemiology. Trends in parasitology
30(11):514-519.
Fulkerson, W., K. McKean, K. Nandra, and I. Barchia. 2005. Benefits of accurately allocating
feed on a daily basis to dairy cows grazing pasture. Animal Production Science 45(4):331-
336.
Fulkerson, W. and K. Slack. 1993. Estimating mass of temperate and tropical pastures in the
subtropics. Australian Journal of Experimental Agriculture 33(7):865-869.
FutureDairy. 2011. Tech Note 3 Complementary Forage Systems: Pasture Utilization.
Avaible at: http://futuredairy.com.au/media/Tech%20note%203%20www.pdf (accessed 14
Ocotober 2015).
García, S. C. and W. J. Fulkerson. 2005. Opportunities for future Australian dairy systems: a
review. Australian Journal of Experimental Agriculture 45(9):1041-1055.
García, S. C., W. J. Fulkerson, R. Nettle, S. Kenny, and D. Armstrong. 2007. FutureDairy: a
national, multidisciplinary project to assist dairy farmers to manage future challenges–
methods and early findings. Animal Production Science 47(9):1025-1031.
Gherardi, S. and C. Oldham. 2003. The value proposition for remotely sensed estimates of
feed on offer and pasture growth rates. paper presented to Grassland Farming - Rocket
Science.
Gianelle, D. and L. Vescovo. 2007. Determination of green herbage ratio in grasslands using
spectral reflectance. Methods and ground measurements. International Journal of Remote
Sensing 28(5):931-942.
43
Goel, N. S. and W. Qin. 1994. Influences of canopy architecture on relationships between
various vegetation indices and LAI and FPAR: A computer simulation. Remote Sensing
Reviews 10(4):309-347.
Gourley, C. and A. McGowan. 1991. Assessing differences in pasture mass with an
automated rising plate meter and a direct harvesting technique. Animal Production Science
31(3):337-339.
Gourley, C. J. P., J. M. Powell, W. J. Dougherty, and D. M. Weaver. 2007. Nutrient
budgeting as an approach to improving nutrient management on Australian dairy farms.
Animal Production Science 47(9):1064-1074.
Gray, D. I., W. J. Parker, E. A. Kemp, P. D. Kemp, I. M. Brookes, D. Horne, P. R. Kenyon,
C. Matthew, S. T. Morris, and J. I. Reid. 2003. Feed planning–alternative approaches used by
farmers. Pages 211-217 in Proc. of the New Zealand Grassland Association.
Hardin, P. J. and T. J. Hardin. 2010. Small‐Scale Remotely Piloted Vehicles in Environmental
Research. Geography Compass 4(9):1297-1311.
Hedley, P., E. Kolver, C. Glassey, T. Thorrold, A. Van Bysterveldt, J. R. Roche, and K.
Macdonald. 2006. Achieving high performance from a range of farm systems. Pages 147-166
in Proc. of Dairy3 Farmers Conference, Hamilton, New Zealand.
Heo, J. and T. W. FitzHugh. 2000. A standardized radiometric normalization method for
change detection using remotely sensed imagery. Photogrammetric Engineering and Remote
Sensing 66(2):173-181.
Hill, M. J., G. E. Donald, M. W. Hyder, and R. C. G. Smith. 2004. Estimation of pasture
growth rate in the south west of Western Australia from AVHRR NDVI and climate data.
Remote Sensing of Environment 93(4):528-545.
Holmes, C. W., Brookes, I.M., Garrick, D.J., Mackenzie, D.D.S, Parkinson, T.J, Wilson, G.F.
2002. "Milk production from pasture". (Massey University: New Zealand).
Hunt, E. R., C. S. Daughtry, C. L. Walthall, J. E. McMurtrey, and W. P. Dulaney. 2003.
Agricultural remote sensing using radio-controlled model aircraft. Digital Imaging and
Spectral Techniques: Applications to Precision Agriculture and Crop Physiology:197-205.
Hunt, E. R., W. D. Hively, S. J. Fujikawa, D. S. Linden, C. S. Daughtry, and G. W. McCarty.
2010. Acquisition of NIR-green-blue digital photographs from unmanned aircraft for crop
monitoring. Remote Sensing 2(1):290-305.
44
Hunt, E. R., Jr., M. Cavigelli, C. T. Daughtry, J. McMurtrey, III, and C. Walthall. 2005.
Evaluation of digital photography from model aircraft for remote sensing of crop biomass and
nitrogen status. Precision Agriculture 6(4):359-378.
Kawamura, K., Y. Sakuno, Y. Tanaka, H.-J. Lee, J. Lim, Y. Kurokawa, and N. Watanabe.
2011. Mapping herbage biomass and nitrogen status in an Italian ryegrass (Lolium
multiflorum L.) field using a digital video camera with balloon system. Journal of Applied
Remote Sensing 5(1):053562.
Kelcey, J. and A. Lucieer. 2012. Sensor correction of a 6-band multispectral imaging sensor
for UAV remote sensing. Remote Sensing 4(5):1462-1493.
King, W. M., G. Rennie, D. Dalley, R. Dynes, and M. Upsdell. 2010. Pasture mass estimation
by the C-DAX pasture meter: regional calibrations for New Zealand. Page 233 in Proc. of the
4th Australasian Dairy Science Symposium.
Kisielewitz, B., Ashwood, A. 1998. Feedbase survey: improving dairy farm profitablity and
lifestyle through whole farm management. Project 20/21, NSW Department of Agriculture,
Orange, NSW.
Knipling, E. B. 1970. Physical and physiological basis for the reflectance of visible and near-
infrared radiation from vegetation. Remote Sensing of Environment 1(3):155-159.
La Grange, R. 2009. Monitoring pasture utilisation on a high input dairy farm system in
Tasmania. Tasmanian Institue of Agricultural Research, Dairy Centre. Available from:
http://www.dairytas.com.au/files/dairytas_monitoring_pasture_utilisation_nwtas.pdf
(Accessed on 17 September 2015).
Laliberte, A. S., M. A. Goforth, C. M. Steele, and A. Rango. 2011a. Multispectral remote
sensing from unmanned aircraft: Image processing workflows and applications for rangeland
environments. Remote Sensing 3(11):2529-2551.
Laliberte, A. S., J. E. Herrick, A. Rango, and C. Winters. 2010. Acquisition,
orthorectification, and object-based classification of unmanned aerial vehicle (UAV) imagery
for rangeland monitoring. Photogrammetric Engineering & Remote Sensing 76(6):661-672.
Laliberte, A. S., C. Winters, and A. Rango. 2011b. UAS remote sensing missions for
rangeland applications. Geocarto International 26(2):141-156.
Lawrence, H., I. Yule, and R. Murray. 2007. Pasture monitoring technologies. in Proc. of the
SIDE Conference 8:126-131.
45
Lebourgeois, V., A. Bégué, S. Labbé, B. Mallavan, L. Prévot, and B. Roux. 2008. Can
commercial digital cameras be used as multispectral sensors? A crop monitoring test. Sensors
8(11):7300-7322.
Lee, J. M., D. J. Donaghy, and J. R. Roche. 2008a. Effect of defoliation severity on regrowth
and nutritive value of perennial ryegrass dominant swards. Agronomy journal 100(2):308-
314.
Lee, J. M., D. J. Donaghy, and J. R. Roche. 2008b. Short Communication: Effect of
postgrazing residual pasture height on milk production. Journal of Dairy Science
91(11):4307-4311.
Lelong, C. C., P. Burger, G. Jubelin, B. Roux, S. Labbé, and F. Baret. 2008. Assessment of
unmanned aerial vehicles imagery for quantitative monitoring of wheat crop in small plots.
Sensors 8(5):3557-3585.
Lile, J., M. Blackwell, N. Thomson, J. Penno, K. Macdonald, P. Nicholas, J. Lancaster, and
M. Coulter. 2001. Practical use of the rising plate meter (RPM) on New Zealand dairy farms.
Pages 159-164 in Proc. of the New Zealand Grassland association conference.
Loris, V. and G. Damiano. 2006. Mapping the green herbage ratio of grasslands using both
aerial and satellite-derived spectral reflectance. Agriculture, Ecosystems & Environment
115(1–4):141-149.
Macdonald, K., J. Penno, J. Lancaster, and J. Roche. 2008a. Effect of stocking rate on pasture
production, milk production, and reproduction of dairy cows in pasture-based systems.
Journal of dairy science 91(5):2151-2163.
Macdonald, K. A., J. W. Penno, J. A. S. Lancaster, and J. R. Roche. 2008b. Effect of Stocking
Rate on Pasture Production, Milk Production, and Reproduction of Dairy Cows in Pasture-
Based Systems. Journal of Dairy Science 91(5):2151-2163.
Mata, G., N. Purdie, R. N. Handcock, D. Dalley, N. Ota, and L. Rossi. 2011. Validating
satellite monitoring of dairy pastures in Canterbury with Lincoln University Dairy Farm and
commercial farm data. Pages 109-114 in Proc. of the New Zealand Grassland Association.
Michell, P. 1982. Value of a rising-plate meter for estimating herbage mass of grazed
perennial ryegrass-white clover swards. Grass and Forage Science 37(1):81-87.
46
Monaghan, R. M., M. J. Hedley, H. J. Di, R. W. McDowell, K. C. Cameron, and S. F.
Ledgard. 2007. Nutrient management in New Zealand pastures—recent developments and
future issues. New Zealand Journal of Agricultural Research 50(2):181-201.
Moran, M. S., R. B. Bryant, T. R. Clarke, and J. Qi. 2001. Deployment and calibration of
reference reflectance tarps for use with airborne imaging sensors. Photogrammetric
engineering and remote sensing 67(3):273-286.
Moran, M. S., Y. Inoue, and E. M. Barnes. 1997. Opportunities and limitations for image-
based remote sensing in precision crop management. Remote Sensing of Environment
61(3):319-346.
Murphy, W. M., J. P. Silman, and A. D. M. Barreto. 1995. A comparison of quadrat,
capacitance meter, HFRO sward stick, and rising plate for estimating herbage mass in a
smooth-stalked, meadowgrass-dominant white clover sward. Grass and Forage Science
50(4):452-455.
Mutanga, O. and A. K. Skidmore. 2004. Narrow band vegetation indices overcome the
saturation problem in biomass estimation. International Journal of Remote Sensing
25(19):3999-4014.
Nansen, C., L. D. Geremias, Y. Xue, F. Huang, and J. R. Parra. 2013. Agricultural case
studies of classification accuracy, spectral resolution, and model over-fitting. Applied
spectroscopy 67(11):1332-1338.
Osborne, S. L., J. S. Schepers, and M. R. Schlemmer. 2004. Detecting nitrogen and
phosphorus stress in corn using multi-spectral imagery. Communications in soil science and
plant analysis 35(3-4):505-516.
Oudshoorn, F. W., S. L. Hansson, H. Hansen, E. Pötsch, B. Krautzer, and A. Hopkins. 2011.
Calibration of the C-Dax Pasture Meter in a Danish grazing system. In Grassland farming and
land management systems in mountainous regions. Pages 166-168 in Proc. of the 16th
Symposium of the European Grassland Federation, Gumpenstein, Austria. Agricultural
Research and Education Center (AREC) Raumberg-Gumpenstein.
Parker, W. 1999. Farm performance measurement - Linking monitoring to business strategy.
in Proc. Proceeding of the New Zealand Society of Animal Production conference, 59, 6-13.
Parker, W., D. I. Gray, and J. C. Lockhart. 1993. A survey of drying off managmenet and
related managment practices on seasonal supply dairy farms. in Proc. Ocassional Publication
47
No.4. Palmerston North: Agricultural and Horticultural Systems Management Department,
Massey University.
Pembleton, K. G., K. N. Tozer, G. R. Edwards, J. L. Jacobs, and L. R. Turner. 2015. Simple
versus diverse pastures: opportunities and challenges in dairy systems. Animal Production
Science (55):893.
Peñuelas, J. and I. Filella. 1998. Visible and near-infrared reflectance techniques for
diagnosing plant physiological status. Trends in plant science 3(4):151-156.
Piggot, G. 1986. Methods for estimating pasture dry matter on dairy farms in Northland.
Pages 243-247 in Proc. of the New Zealand Grassland Association.
Primicerio, J., S. F. Di Gennaro, E. Fiorillo, L. Genesio, E. Lugato, A. Matese, and F. P.
Vaccari. 2012. A flexible unmanned aerial vehicle for precision agriculture. Precision
Agriculture 13(4):517-523.
Rahman, M. M., D. W. Lamb, J. N. Stanley, and M. G. Trotter. 2014. Use of proximal sensors
to evaluate at the sub-paddock scale a pasture growth-rate model based on light-use
efficiency. Crop and Pasture Science 65(4):400-409.
Rango, A., A. Laliberte, C. Steele, J. E. Herrick, B. Bestelmeyer, T. Schmugge, A.
Roanhorse, and V. Jenkins. 2006. Using unmanned aerial vehicles for rangelands: current
applications and future potentials. Environmental Practice 8(03):159-168.
Romera, A. J., P. Beukes, C. Clark, D. Clark, H. Levy, and A. Tait. 2010. Use of a pasture
growth model to estimate herbage mass at a paddock scale and assist management on dairy
farms. Computers and Electronics in Agriculture 74(1):66-72.
Rouse Jr, J. W., R. H. Haas, J. A. Schell, and D. W. Deering. 1974. Monitoring vegetation
systems in the Great Plains with ERTS. NASA special publication 351:309.
Sanderson, M. A., C. A. Rotz, S. W. Fultz, and E. B. Rayburn. 2001. Estimating forage mass
with a commercial capacitance meter, rising plate meter, and pasture ruler. Agronomy Journal
93(6):1281-1286.
Scrivner, J. H., D. M. Center, and M. B. Jones. 1986. A rising plate meter for estimating
production and utilization. J. Range Manage 39:475-477.
Shannon, P. and F. Tyndall. 2006. Feeding pastures for profit - a practical approach to
achieving profitable feeding. in Proc. of the 2006 Victorian Dairy Conference, Shepparton,
48
Victoria. Available at:
http://www.dairyaustralia.com.au~/media/Documents/Animal20management/Feed%20and%2
0nutrition/thirtythirty/3030%20-%20PRG%20II%20-
%20Prac%20application%20of%20grazing%20principles%201.pdf (accessed 4 September
2015).
Shepherd, A., P. Harris, R. Orr, B. Griffith, and M. Jarman. 2013. Applications and issues of
remote sensing by UAV to pasture agri-research on the North Wyke farm platform.
Sims, D. A. and J. A. Gamon. 2003. Estimation of vegetation water content and
photosynthetic tissue area from spectral reflectance: a comparison of indices based on liquid
water and chlorophyll absorption features. Remote Sensing of Environment 84(4):526-537.
Stockdale, C. 1984a. Evaluation of techniques for estimating the yield of irrigated pastures
intensively grazed by dairy cows. 2. The rising plate meter. Australian Journal of
Experimental Agriculture 24(126):305-311.
Stockdale, C. R. 1984b. Evaluation of techniques for estimating the yield of irrigated pastures
intensively grazed by dairy cows. 1. Visual assessment. Australian Journal of Experimental
Agriculture 24(126):300-304.
Stockdale, C. R. and K. B. Kelly. 1984. A comparison of a rising-plate meter and an
electronic capacitance meter for estimating the yield of pastures grazed by dairy cows. Grass
and Forage Science 39(4):391-394.
Swain, K. C., S. J. Thomson, and H. P. W. Jayasuriya. 2010. Adoption of an unmanned
helicopter for low-altitude remote sensing to estimate yield and total biomass of a rice crop.
Transactions of the ASAE (American Society of Agricultural Engineers) 53(1):21.
Taylor, B. F., P. W. Dini, and J. W. Kidson. 1985. Determination of seasonal and interannual
variation in New Zealand pasture growth from NOAA-7 data. Remote Sensing of
Environment 18(2):177-192.
Thomson, N. A., M. P. Upsdell, R. Hooper, H. V. Henderson, M. B. Blackwell, D. A.
McCallum, R. J. Hainsworth, K. A. Macdonald, D. D. Wildermoth, and G. J. Bishop-Hurley.
2001. Development and evaluation of a standardised means for estimating herbage mass of
dairy pastures using the rising plate meter. Pages 149-158 in Proc. of the New Zealand
Grassland Association conference.
49
Thorrold, B. and P. Doyle. 2007. Nature or nurture–forces shaping the current and future state
of dairy farming in New Zealand and Australia. In 'meeting the challaenges for pasture-based
dairying'. (Eds DF Chapman, DA Clark, KL Macmillan, DP Nation) pp 450-460 (National
Dairy Alliance: Melabourne).
Tucker, C. J. 1979. Red and photographic infrared linear combinations for monitoring
vegetation. Remote sensing of Environment 8(2):127-150.
Tucker, C. J. 1980. A critical review of remote sensing and other methods for non-destructive
estimation of standing crop biomass. Grass and Forage Science 35(3):177-182.
Turner, D., A. Lucieer, and C. Watson. 2011. Development of an Unmanned Aerial Vehicle
(UAV) for hyper resolution vineyard mapping based on visible, multispectral, and thermal
imagery. Page 4 in Proc. of 34th International Symposium on Remote Sensing of
Environment.
Vescovo, L., G. Wohlfahrt, M. Balzarolo, S. Pilloni, M. Sottocornola, M. Rodeghiero, and D.
Gianelle. 2012. New spectral vegetation indices based on the near-infrared shoulder
wavelengths for remote detection of grassland phytomass. International journal of remote
sensing 33(7):2178-2195.
Vickery, P., I. Bennett, and G. Nicol. 1980. An improved electronic capacitance meter for
estimating herbage mass. Grass and forage science 35(3):247-252.
von Bueren, S., A. Burkart, A. Hueni, U. Rascher, M. Tuohy, and I. Yule. 2015. Deploying
four optical UAV-based sensors over grassland: challenges and limitations. Biogeosciences
12(1):163-175.
Von Bueren, S. and I. Yule. 2013. Multispectral aerial imaging of pasture quality and biomass
using unmanned aerial vehicles (UAV). Accurate and Efficient Use of Nutrients on Farms,
Occasional Report (26).
Weiser, R., G. Asrar, G. Miller, and E. Kanemasu. 1986. Assessing grassland biophysical
characteristics from spectral measurements. Remote Sensing of Environment 20(2):141-152.
White, S. L., G. A. Benson, S. P. Washburn, and J. T. Green Jr. 2002. Milk production and
economic measures in confinement or pasture systems using seasonally calved Holstein and
Jersey cows. Journal of Dairy Science 85(1):95-104.