Embed Size (px)
Citation preview

Geomorphology 246 (2015) 35–47
Contents lists available at ScienceDirect
Geomorphology
j ourna l homepage: www.e lsev ie r .com/ locate /geomorph
Potential of two submontane broadleaved species (Acer opalus, Quercuspubescens) to reveal spatiotemporal patterns of rockfall activity
Adrien Favillier a, Jérôme Lopez-Saez b, Christophe Corona c,⁎, Daniel Trappmann d, David Toe b,Markus Stoffel d,e,f, Georges Rovéra a, Frédéric Berger b
a Institut de Géographie Alpine, Laboratoire Politique publiques, Action Politique, Territoire (PACTE) UMR 5194 du CNRS, Université Joseph Fourier, 14 bis avenue Marie Reynoard,38100 Grenoble, Franceb Institut national de Recherche en Sciences et Technologies pour l'Environnement et l'Agriculture (IRSTEA), UR EMGR, 38402 St-Martin-d'Hères cedex, Francec UMR6042 Geolab, Université Blaise Pascal, 4 rue Ledru, F-63057 Clermont-Ferrand, Franced Dendrolab.ch, Institute of Geological Sciences, University of Berne, Baltzerstrasse 1 + 3, CH-3012 Berne, Switzerlande Section of Earth and Environmental Sciences, University of Geneva, rue des Maraîchers 13, CH-1205 Geneva, Switzerlandf Institute for Environmental Sciences, University of Geneva, 7 route de Drize, CH-1227 Carouge, Geneva, Switzerland
⁎ Corresponding author.E-mail address: [email protected]
http://dx.doi.org/10.1016/j.geomorph.2015.06.0100169-555X/© 2015 Published by Elsevier B.V.
a b s t r a c t
a r t i c l e i n f oArticle history:Received 26 November 2014Received in revised form 4 June 2015Accepted 5 June 2015Available online 8 June 2015
Keywords:Forest–rockfall interactionsCoppice standsDendrogeomorphologyRecurrence intervalsSubmontane broadleaved speciesFrench Alps
Long-term records of rockfalls have proven to be scarce and typically incomplete, especially in increasingly ur-banized areas where inventories are largely absent and the risk associated with rockfall events rises proportion-ally with urbanization. On forested slopes, tree-ring analyses may help to fill this gap, as they have beendemonstrated to provide annually-resolved data on past rockfall activity over long periods. Yet, the reconstruc-tion of rockfall chronologies has been hampered in the past by the paucity of studies that include broadleavedtree species, which are, in fact, quite common in various rockfall-prone environments. In this study, we testthe sensitivity of two common, yet unstudied, broadleaved species — Quercus pubescens Willd. (Qp) and Aceropalus Mill. (Ao) — to record rockfall impacts. The approach is based on a systematic mapping of trees and thecounting of visible scars on the stem surface of both species. Data are presented from a site in the Vercors massif(French Alps) where rocks are frequently detached from Valanginian limestone and marl cliffs. We compare re-currence interval maps obtained fromboth species and from two different sets of tree structures (i.e., single treesvs. coppice stands) based on Cohen's k coefficient and the mean absolute error. A total of 1230 scars were ob-served on the stem surface of 847 A. opalus and Q. pubescens trees. Both methods yield comparable results onthe spatial distribution of relative rockfall activitywith similar downslope decreasing recurrence intervals. Yet re-currence intervals vary significantly according to tree species and tree structure. The recurrence interval observedon the stem surface of Q. pubescens exceeds that of A. opalus by N20 years in the lower part of the studied plot.Similarly, the recurrence interval map derived from A. opalus coppice stands, dominant at the stand scale, doesnot exhibit a clear spatial pattern. Differences between species may be explained by the bark thickness ofQ. pubescens, which has been demonstrated to grow at twice the rate of A. opalus, thus constituting a mechanicalbarrier that is able to buffer low energy rockfalls and thus can avoid damage to the underlying tissues. The rea-sons for differences between tree structures are related to the clustered coppice-specific spatial stemdistributionin clumps that could result on one hand in bigger gaps between clumps, which in turn decreases the probabilityof tree impacts for traveling blocks. On the other hand, data also indicate that several scars on the bark of coppicestands may stem from the same impact and thus may lead to an overestimation of rockfall activity.
© 2015 Published by Elsevier B.V.
1. Introduction
Rockfall is defined as the free-falling, bouncing, or rolling of rocksoriginating from cliff faces with a volume usually remaining below5 m3 (Berger et al., 2002; Dorren et al., 2005). It is a common and dan-gerous natural process in steep environments that can lead to important
r (C. Corona).
economic losses and casualties (e.g., Hantz et al., 2003). In principle,rockfall hazard can be defined as the probability that a specific locationon a slope is reached by a rockfall of a givenmagnitude (Volkwein et al.,2011). The frequency of events of a given magnitude (volume) can beevaluated using a statistical analysis of inventories of rockfall events(e.g., Hungr et al., 1999), taking into account the definition of suitablemagnitude–frequency relationships (e.g., Dussauge-Peisser et al.,2002). Although this approach is well established in the field of naturalhazards, and in particular for earthquakes, its application to rockfall

36 A. Favillier et al. / Geomorphology 246 (2015) 35–47
hazards is somewhat more limited because of the generalized lack ofhistorical archives and the spatial and temporal heterogeneity of avail-able inventories (e.g., Sass and Oberlechner, 2012).
If talus slopes or the runout fringe of boulders beyond the talus footare covered with forests, individual rockfall fragments may damage oreven destroy trees along their trajectory (Stoffel, 2006; Trappmannet al., 2014). Woody vegetation damaged by rockfalls or growing ontalus thus provides a valuable means for dating and interpreting pastrockfalls with high accuracy and over long periods of the past (Stoffelet al., 2010; Šilhán et al., 2011). Dendrogeomorphic methods (Alestalo,1971; Shroder, 1978; Stoffel and Corona, 2014) aim at inferring dataon past processes from information preserved in tree rings. Previoustree-ring studies primarily focused on rockfall damage in conifers forthe reconstruction of rockfall frequencies (Stoffel et al., 2005a,b; Perretet al., 2006b), the spatial distribution and magnitude of rockfalls(Stoffel et al., 2005b), the triggering of rockfalls by climatic variables(Schneuwly and Stoffel, 2008; Šilhán et al., 2011) aswell as on the com-parison of observed and/or reconstructed rockfall inventories with ac-tivity predicted by three-dimensional, process-based rockfall models(Stoffel et al., 2006; Corona et al., 2013). Occasionally but very rarely,rockfall research has included broadleaved trees growing on talusslopes to document recent activity (Moya et al., 2010a; Šilhán et al.,2011; Trappmann and Stoffel, 2013), mainly owing to a complexwood structure of broadleaved species that rendered tree-ring analysischallenging in the absence of specific anatomical responses (Arbellay
Fig. 1. (A) The study site is located in the French Alps, at the eastern face of the Vercors massifairborne LiDAR data with the study site delimited by a white polygon. View of studied slope (C
et al., 2012, 2014a,b). The preferred sampling of conifers overbroadleaved trees was, in addition, motivated by the greater age andthe predominance of conifers in mountain regions where rockfalls typ-ically occur.
This selective approach and related gap in knowledge is regrettablefor three characteristics typical for broadleaved species: (i) they are typ-ically predominant at altitudes belonging to the sub-montane beltwhere rockfalls threaten infrastructure and structures much more fre-quently than at higher altitudes (Sass and Oberlechner, 2012); (ii)broadleaved trees typically have a thin and smooth bark structure thatnot only facilitates wounding but also enhances the visibility of scarson the stem surface (Stoffel, 2005; Stoffel and Perret, 2006); and (iii)the particular bark structure renders broadleaved species highly suit-able for scar counts on the stem surface, but the approach has onlybeen tested on Fagus sylvatica L. (common beech) trees to date(Trappmann and Stoffel, 2013).
The primary objective of this study thereforewas to test the sensitiv-ity of two common, yet unstudied, broadleaved species, Quercuspubescens (Qp) and Acer opalus (Ao), to rockfall impacts. Furthermore,this study explores the influence of bark thickness and structure on re-corded rockfall frequency by comparing results obtained with a smooth(Ao) and a thick (Qp) barked species. Results were gathered through anexhaustive mapping of 847 Ao and Qp trees from a 0.6-ha plot and arebased on 1230 scars visible on the tree stem surface as well as on barkthickness measurements. We demonstrate that rockfall patterns
, 20 km southwest of Grenoble. (B) Hillshade map computed using the DEM derived from), the forest stand (D), injured Acer opalus (E), and Quercus pubescens stems (F).

37A. Favillier et al. / Geomorphology 246 (2015) 35–47
derived fromboth species vary considerably, especially in the lower partof the studied plot, primarily as a result of differences in bark thickness.
2. Study site
The study site (45°05′02″N, 5°39′16″E) is located on the easternslope of the Vercors massif (French Alps; Fig. 1A and B), in the vicinityof Saint-Paul-de-Varces (2500 people), and at a locality known underthe name of “Croupe du Plantin”. The elevation of the studied sloperanges from 470 to 630 m asl. Rockfall originates from an ~30-m-high,south east-facing cliff built of Valanginian limestones and marls wherea narrow joint system favors considerable fragmentation and the re-lease of small rock fragments with volumes ranging from a few dm3 to
(A) (B
(C
(D
(E
450m
500m
550m
600m
Fig. 2. (A) Hillshade map of the study site. (B) Longitudin
1m3 (Hantz et al., 2014). According to the high-resolution DEMderivedfrom airborne LiDAR data, Quaternary rockfalls have formed a ~240-m-long talus slope with a downslope gradient ranging from 39° to 25°(Fig. 2B) that is bordered by two interfluves (Fig. 2A). At the apex ofthe talus, slope morphology is characterized by a slight depression(depth ~2 m) that splits into two ~30-m-wide couloirs that channelizefalling rock fragments downslope (Fig. 2D and E).
The tree plot analyzed here has an area of 0.6 ha and is covered bya dense (~2000 trees ha−1) coppice forest stand (Fig. 1C andD) predominantly composed of Ao and Qp mixed with Sorbus aria (L.)Crantz (common whitebeam), Acer campestre L. (field maple), andFraxinus excelsior L. (common ash). Frequent scars on the stem surfaceclearly evidence the presence of regular rockfall activity (Fig. 1E and
0 50 100 15025Meters
240220200180160140120100806040200
620
600
580
560
540
520
500
480
Alti
tude
(m
)
Distance (m)
Alti
tude
(m
)
Distance (m)757065605550454035302520151050
560
562
558
Profile A - B
Profile C - D
95908580757065605550454035302520151050
523
521
519
517
515
513
Alti
tude
(m
)
Distance (m)
Profile E - F
1301201101009080706050403020100
Alti
tude
(m
)
Distance (m)
493
491
489
487
485
483
495
Profile G - H
)
)
)
)
Release zone Tree plot
al and (C, D, E) lateral profiles of the studied slope.
510m
550m
600m
Diameter at breast height (DBH) in cm
5 - 10
10 - 15
15 - 20
20 - 25
25 - 30
30 - 35
35 - 40
Q. pubescens
A. opalus
Single tree
Coppice stand
Single tree
Coppice stand
5Meters
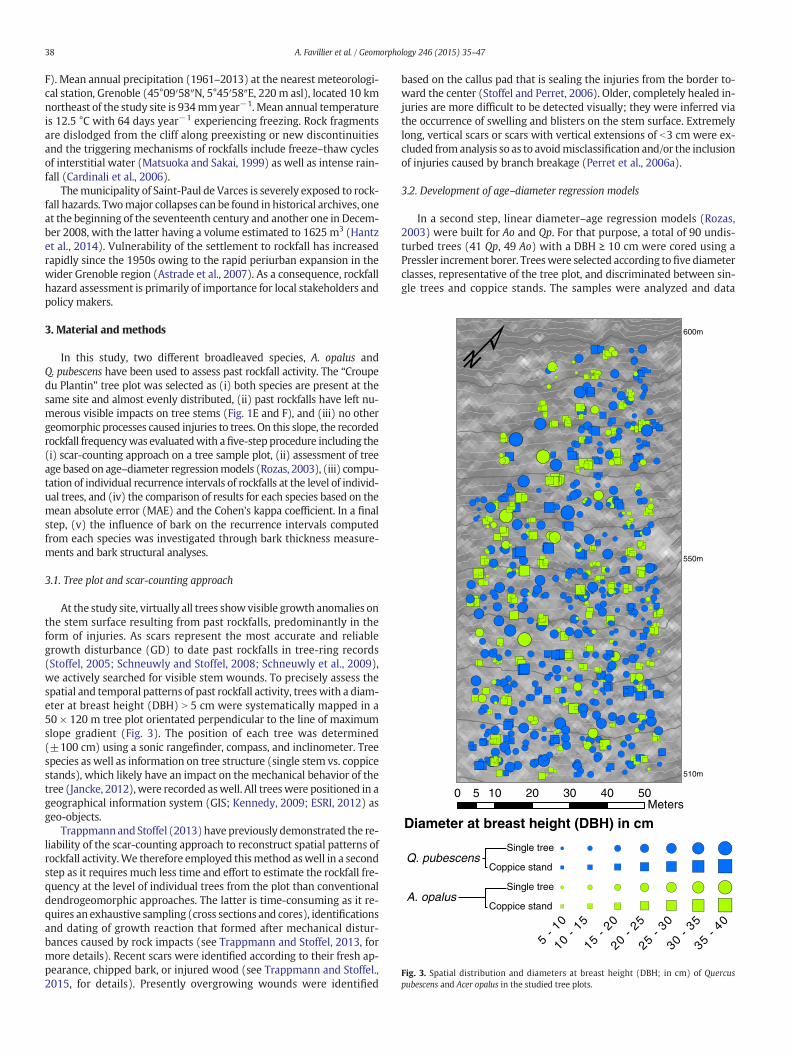
Fig. 3. Spatial distribution and diameters at breast height (DBH; in cm) of Quercuspubescens and Acer opalus in the studied tree plots.
38 A. Favillier et al. / Geomorphology 246 (2015) 35–47
F). Mean annual precipitation (1961–2013) at the nearest meteorologi-cal station, Grenoble (45°09′58″N, 5°45′58″E, 220m asl), located 10 kmnortheast of the study site is 934mmyear−1. Mean annual temperatureis 12.5 °C with 64 days year−1 experiencing freezing. Rock fragmentsare dislodged from the cliff along preexisting or new discontinuitiesand the triggering mechanisms of rockfalls include freeze–thaw cyclesof interstitial water (Matsuoka and Sakai, 1999) as well as intense rain-fall (Cardinali et al., 2006).
Themunicipality of Saint-Paul de Varces is severely exposed to rock-fall hazards. Twomajor collapses can be found in historical archives, oneat the beginning of the seventeenth century and another one in Decem-ber 2008, with the latter having a volume estimated to 1625 m3 (Hantzet al., 2014). Vulnerability of the settlement to rockfall has increasedrapidly since the 1950s owing to the rapid periurban expansion in thewider Grenoble region (Astrade et al., 2007). As a consequence, rockfallhazard assessment is primarily of importance for local stakeholders andpolicy makers.
3. Material and methods
In this study, two different broadleaved species, A. opalus andQ. pubescens have been used to assess past rockfall activity. The “Croupedu Plantin” tree plot was selected as (i) both species are present at thesame site and almost evenly distributed, (ii) past rockfalls have left nu-merous visible impacts on tree stems (Fig. 1E and F), and (iii) no othergeomorphic processes caused injuries to trees. On this slope, the recordedrockfall frequencywas evaluatedwith afive-step procedure including the(i) scar-counting approach on a tree sample plot, (ii) assessment of treeage based on age–diameter regressionmodels (Rozas, 2003), (iii) compu-tation of individual recurrence intervals of rockfalls at the level of individ-ual trees, and (iv) the comparison of results for each species based on themean absolute error (MAE) and the Cohen's kappa coefficient. In a finalstep, (v) the influence of bark on the recurrence intervals computedfrom each species was investigated through bark thickness measure-ments and bark structural analyses.
3.1. Tree plot and scar-counting approach
At the study site, virtually all trees showvisible growth anomalies onthe stem surface resulting from past rockfalls, predominantly in theform of injuries. As scars represent the most accurate and reliablegrowth disturbance (GD) to date past rockfalls in tree-ring records(Stoffel, 2005; Schneuwly and Stoffel, 2008; Schneuwly et al., 2009),we actively searched for visible stem wounds. To precisely assess thespatial and temporal patterns of past rockfall activity, treeswith a diam-eter at breast height (DBH) N 5 cm were systematically mapped in a50 × 120 m tree plot orientated perpendicular to the line of maximumslope gradient (Fig. 3). The position of each tree was determined(±100 cm) using a sonic rangefinder, compass, and inclinometer. Treespecies as well as information on tree structure (single stem vs. coppicestands), which likely have an impact on the mechanical behavior of thetree (Jancke, 2012),were recorded aswell. All treeswere positioned in ageographical information system (GIS; Kennedy, 2009; ESRI, 2012) asgeo-objects.
Trappmannand Stoffel (2013)have previously demonstrated the re-liability of the scar-counting approach to reconstruct spatial patterns ofrockfall activity.We therefore employed thismethod aswell in a secondstep as it requires much less time and effort to estimate the rockfall fre-quency at the level of individual trees from the plot than conventionaldendrogeomorphic approaches. The latter is time-consuming as it re-quires an exhaustive sampling (cross sections and cores), identificationsand dating of growth reaction that formed after mechanical distur-bances caused by rock impacts (see Trappmann and Stoffel, 2013, formore details). Recent scars were identified according to their fresh ap-pearance, chipped bark, or injured wood (see Trappmann and Stoffel.,2015, for details). Presently overgrowing wounds were identified
based on the callus pad that is sealing the injuries from the border to-ward the center (Stoffel and Perret, 2006). Older, completely healed in-juries are more difficult to be detected visually; they were inferred viathe occurrence of swelling and blisters on the stem surface. Extremelylong, vertical scars or scars with vertical extensions of b3 cm were ex-cluded fromanalysis so as to avoidmisclassification and/or the inclusionof injuries caused by branch breakage (Perret et al., 2006a).
3.2. Development of age–diameter regression models
In a second step, linear diameter–age regression models (Rozas,2003) were built for Ao and Qp. For that purpose, a total of 90 undis-turbed trees (41 Qp, 49 Ao) with a DBH ≥ 10 cm were cored using aPressler increment borer. Treeswere selected according tofive diameterclasses, representative of the tree plot, and discriminated between sin-gle trees and coppice stands. The samples were analyzed and data

0
20
40
60
80
100
120
140
0.0 5.0 10.0 15.0 20.0 25.0 30.0 35.0 40.0 45.0
Cor
rect
ed
tre
eag
e(y
ear
s)
Diameter at breast height (cm)
Age = 1.5865*DBH + 23.898R² = 0.66
Quercus pubescensLinear regression
Age = 1.801*DBH + 14.147R² = 0.70
Acer opalus, single treeLinear regression
Acer opalus, coppice stand
Age = 2.0909*DBH + 15.611R² = 0.63
Linear regression
Fig. 4. Age–diameter regression models for Quercus pubescens and Acer opalus.
39A. Favillier et al. / Geomorphology 246 (2015) 35–47
processed following standard dendrochronological procedures (Bräker,2002). In the laboratory, tree rings were counted using a digital LINTABpositioning table connected to a Leica stereomicroscope. Missing ringstoward the pith were estimated from ring curvature (Villalba andVeblen, 1997). In a final step, we used data from the linear regressionmodels to estimate tree age of individual trees of the plot where scarswere counted on the stem surface and the DBH has been measured.
3.3. Calculation of rockfall recurrence intervals
The term recurrence interval has been used traditionally in avalanchezoning (e.g., Schläppy et al., 2014) and only started to occur in rockfallstudies over the past few years (Šilhán et al., 2013; Trappmann et al.,2013);it is defined as the average time period between two successiveevents at a specific point (or tree). Individual recurrence intervals (Ri)were calculated for each tree T and following Šilhán et al. (2013) as:
RiT ¼ ATScT ð1Þ
where AT represents the age of tree T estimated from age–diametermodels (Fig. 4) and ScT the number of scars counted on the stem surfaceof tree T.
To visualize spatial patterns of recurrence intervals and to removepotential outliers, trees were clustered into 10 × 10 m cells (n = 54).For each cell C, the average recurrence interval Ric was computed asthe arithmetic mean of RiT of trees (NT: the number of trees) locatedin C as:
RiC ¼X
RiT� �
=NT : ð2ÞAt each cell, a total of five different Ric involving all trees, Ao, Qp, sin-
gle stems, and coppice stands were successively computed.
Table 1Overview of scars and calculated recurrence interval for Quercus pubescens and Acer opalus sin
Species No. of trees Mean DBH incm (STD)
Mean age inyear (SD)
Quercus pubescens 441 (52.1%) 17.6 (5.9) 52 (9.4)Single tree 309 (36.5%) 18.0 (6.1) 53 (9.7)Coppice stand 132 (15.6%) 16.6 (5.5) 50 (8.8)Acer opalus 406 (47.9%) 17.6 (6.1) 42 (12.3)Single tree 94 (11.1%) 14.5 (6.8) 40 (12.2)Coppice stand 312 (36.8%) 12.8 (5.9) 42 (12.3)Total 847 (100%) 15.5 (6) 41 (11.6)
3.4. Comparison of Ao and Qp recurrence intervals
At the tree plot scale, the Cohen's kappa coefficient (Smeeton, 1985)was computed to compare the similarity of maps derived from Ao andQp trees. Cohen's kappa (k) measures the agreement between tworaters (species in our case) that each classify N items (cells) into Cmutually exclusive categories (classes of recurrence intervals) as:
k ¼ Pr að Þ=Pr eð Þ1−Pr eð Þ ð3Þ
where Pr(a) is the relative observed agreement among species, andPr(e) is the hypothetical probability of chance agreement, using the ob-served data to calculate the probabilities of each species distributed ran-domly in each class of recurrence interval. According to Landis and Koch(1977), k values b 0 indicate no agreement, 0–0.20 slight, 0.21–0.40 fair,0.41–0.60 moderate, 0.61–0.80 substantial, and 0.81–1 almost perfectagreement.
At the cell scale, the mean absolute error (MAE) was computed foreach cell c containing both species (Corona et al., 2013; Trappmannand Stoffel, 2013) for three pairs of maps (including all morphologies,single stem, and coppice stand) as:
MAEc ¼ Ric Qpð Þ−Ric Aoð Þ ð4Þ
where Ric(Qp) and Ric(Ao) represent the mean recurrence interval ofrockfalls computed from Qp and Ao in cell c. Results from Eq. (3) wereaccepted if MAEc remained within the range of ±10 years (the sign ±is used here to indicate 1 standard deviation).
gle trees and coppice stands.
Sum of scars Mean number of scarsper tree (SD)
Mean recurrenceinterval in year
601 1.4 (1.8) 41.00420 1.4 (1.7) 41.00181 1.4 (1.9) 40.00629 1.5 (2.1) 32.00173 1.8 (2.6) 29.00456 1.5 (2.0) 33.00
1230 1.5 (2.0) 37

40 A. Favillier et al. / Geomorphology 246 (2015) 35–47
3.5. Bark thickness analysis
Trappmann and Stoffel (2013) suggested that bark structure and thegenetic capability of trees to overgrow injuries could explain the varia-tions in the mean number of impacts recorded by Picea abies L. and
Empty cells mean No Data
Mean recurrence intervalper cell in year
0 - 10
10 - 20
20 - 30
30 - 40
Scars per tree
01 -
22
Q. pubescens
A. opalus
Single tree
Coppice stand
Single tree
Coppice stand
0 10 20 305
Fig. 5. Reference recurrence interval map (Refmap) ca
F. sylvatica L. In a final step, in order to assess the influence of bark onreconstructed Ri, the bark thickness of 102Qp and Ao selected accordingto five diameter classes, representative of the tree plot, was recordedusing a Suunto bark gauge with a precision of 1 mm (West, 2009). Atthe same time, the DBH of each tree was recorded using a Zimmer
40 - 50
50 - 60
60 - 70
- 44 -
66 -
9
9 - 12
12 - 18
40 50Meters
510m
550m
600m
Mid-slope
Downslope
Upslope
lculated for 847 single trees and coppice stands.
41A. Favillier et al. / Geomorphology 246 (2015) 35–47
diameter tape. Additionally, wedges were extracted from 8 trees, 4 Qp(Qp1–Qp4) and 4 Ao (Ao1–Ao4) of different DBHs (7.5–39 cm).Wedgeswere scanned at a resolution of 1200 dpi to characterize the main ana-tomical differences between both species (Quilhó et al., 2013).
4. Results
4.1. Structure of the forest plot: amixed A. opalus–Q. pubescens forest stand
At the plot scale, a total of 847 trees were mapped (mean DBH:15.5 ± 6.0 cm) among which 441 Qp (52.1%, mean DBH: 17.6 ±5.9 cm) and 406 Ao (47.9%, mean DBH: 13.2 ± 6.1 cm) trees (seeTable 1 for a complete description) were heterogeneously distributedin the cells (Figs. 3 and 5). In terms of morphology, the plot is composedof 403 single stems (47.6%), mainly Qp trees (77%), and 444 coppicestands with a majority of Ao trees (70%).
The regressionmodels established for both species and tree structuresare statistically significant (r2 ranging between 0.63 and 0.7, p b 0.05)with comparable regression slopes (from 1.6 to 2.1 cm year−1), thus en-abling derivation of reliable tree ages from tree diameters (Fig. 4). Accord-ing to thesemodels, themean age of the forest stand, computed from847mapped trees, is 41 ± 11.6 years. The oldest tree reached breast height86 years ago while the youngest one was only 23 years old at the timeof field analyses.
4.2. Spatiotemporal patterns of rockfall activity
Based on the scar-counting approach, 1230 scars were recorded onthe stem surfaces (Table 1, Fig. 5). The mean number of scars per treeis 1.5 ± 2.0. A total of 309 trees (36%) present no visual evidence ofpast rockfall impacts. From a spatial perspective, the distribution of im-pacted trees exhibits a strong, decreasing downward gradient (Fig. 5).The mean number of scars revealed by the scar-counting approachgradually decreases from 3 ± 2.7 scars·tree−1 in the upper one-thirdof the slope (cells A–D) to 1.5±1.8 scars·tree−1 in the central compart-ment of the plot (cells D–H) to reach values of 0.7 ± 0.9 in the lowerone-third of the plot (cells I–L). Similarly, the largest absolute numberof impacts (N9 scars) was mainly recorded in the upper half of theplot (A–F, Fig. 5)whereas the number of stemswithout impacts steadilyincreases from 23 (13%) in the upper one-third of the plot to 178 (54%)in its lower one-third. According to the linear regression modelsestablished for Ao and Qp, trees were aged 46.4 ± 11.7, 47 ± 11.6, and
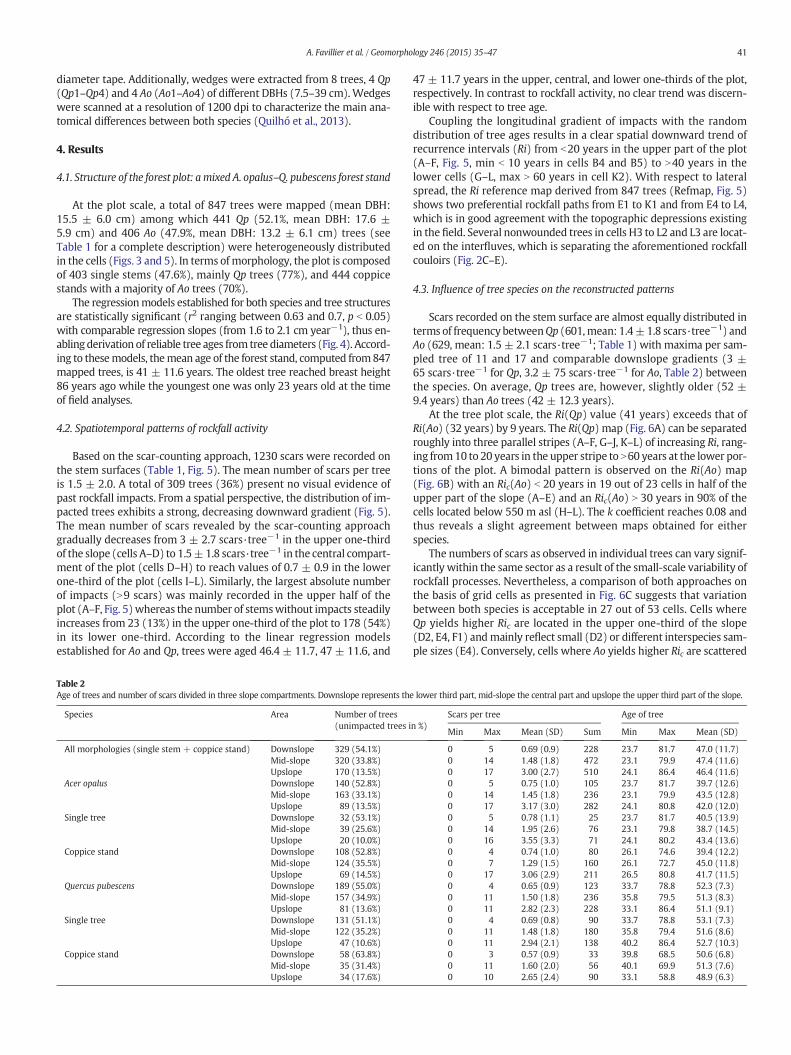
Table 2Age of trees and number of scars divided in three slope compartments. Downslope represents the
Species Area Number of trees(unimpacted trees i
All morphologies (single stem + coppice stand) Downslope 329 (54.1%)Mid-slope 320 (33.8%)Upslope 170 (13.5%)
Acer opalus Downslope 140 (52.8%)Mid-slope 163 (33.1%)Upslope 89 (13.5%)
Single tree Downslope 32 (53.1%)Mid-slope 39 (25.6%)Upslope 20 (10.0%)
Coppice stand Downslope 108 (52.8%)Mid-slope 124 (35.5%)Upslope 69 (14.5%)
Quercus pubescens Downslope 189 (55.0%)Mid-slope 157 (34.9%)Upslope 81 (13.6%)
Single tree Downslope 131 (51.1%)Mid-slope 122 (35.2%)Upslope 47 (10.6%)
Coppice stand Downslope 58 (63.8%)Mid-slope 35 (31.4%)Upslope 34 (17.6%)
47 ± 11.7 years in the upper, central, and lower one-thirds of the plot,respectively. In contrast to rockfall activity, no clear trend was discern-ible with respect to tree age.
Coupling the longitudinal gradient of impacts with the randomdistribution of tree ages results in a clear spatial downward trend ofrecurrence intervals (Ri) from b20 years in the upper part of the plot(A–F, Fig. 5, min b 10 years in cells B4 and B5) to N40 years in thelower cells (G–L, max N 60 years in cell K2). With respect to lateralspread, the Ri reference map derived from 847 trees (Refmap, Fig. 5)shows two preferential rockfall paths from E1 to K1 and from E4 to L4,which is in good agreement with the topographic depressions existingin the field. Several nonwounded trees in cells H3 to L2 and L3 are locat-ed on the interfluves, which is separating the aforementioned rockfallcouloirs (Fig. 2C–E).
4.3. Influence of tree species on the reconstructed patterns
Scars recorded on the stem surface are almost equally distributed interms of frequencybetweenQp (601,mean: 1.4±1.8 scars·tree−1) andAo (629, mean: 1.5 ± 2.1 scars·tree−1; Table 1) with maxima per sam-pled tree of 11 and 17 and comparable downslope gradients (3 ±65 scars·tree−1 for Qp, 3.2 ± 75 scars·tree−1 for Ao, Table 2) betweenthe species. On average, Qp trees are, however, slightly older (52 ±9.4 years) than Ao trees (42 ± 12.3 years).
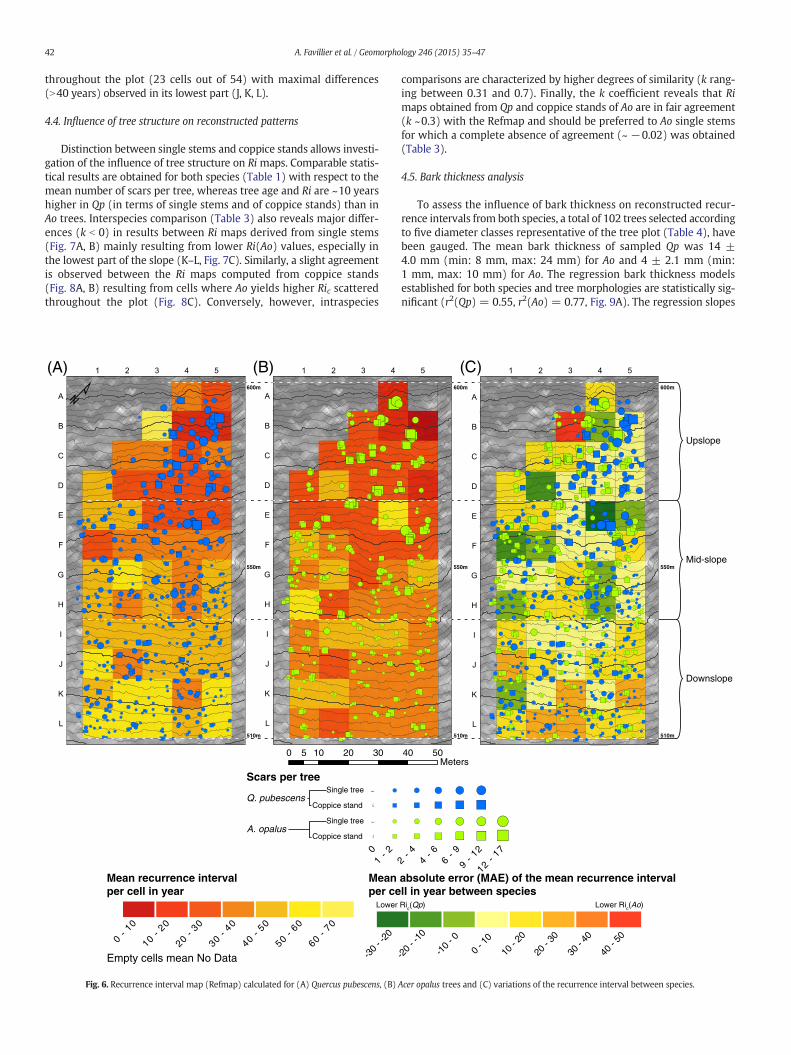
At the tree plot scale, the Ri(Qp) value (41 years) exceeds that ofRi(Ao) (32 years) by 9 years. The Ri(Qp) map (Fig. 6A) can be separatedroughly into three parallel stripes (A–F, G–J, K–L) of increasing Ri, rang-ing from10 to 20 years in the upper stripe to N60 years at the lower por-tions of the plot. A bimodal pattern is observed on the Ri(Ao) map(Fig. 6B) with an Ric(Ao) b 20 years in 19 out of 23 cells in half of theupper part of the slope (A–E) and an Ric(Ao) N 30 years in 90% of thecells located below 550 m asl (H–L). The k coefficient reaches 0.08 andthus reveals a slight agreement between maps obtained for eitherspecies.
The numbers of scars as observed in individual trees can vary signif-icantly within the same sector as a result of the small-scale variability ofrockfall processes. Nevertheless, a comparison of both approaches onthe basis of grid cells as presented in Fig. 6C suggests that variationbetween both species is acceptable in 27 out of 53 cells. Cells whereQp yields higher Ric are located in the upper one-third of the slope(D2, E4, F1) andmainly reflect small (D2) or different interspecies sam-ple sizes (E4). Conversely, cells where Ao yields higher Ric are scattered
lower third part, mid-slope the central part and upslope the upper third part of the slope.
n %)Scars per tree Age of tree
Min Max Mean (SD) Sum Min Max Mean (SD)
0 5 0.69 (0.9) 228 23.7 81.7 47.0 (11.7)0 14 1.48 (1.8) 472 23.1 79.9 47.4 (11.6)0 17 3.00 (2.7) 510 24.1 86.4 46.4 (11.6)0 5 0.75 (1.0) 105 23.7 81.7 39.7 (12.6)0 14 1.45 (1.8) 236 23.1 79.9 43.5 (12.8)0 17 3.17 (3.0) 282 24.1 80.8 42.0 (12.0)0 5 0.78 (1.1) 25 23.7 81.7 40.5 (13.9)0 14 1.95 (2.6) 76 23.1 79.8 38.7 (14.5)0 16 3.55 (3.3) 71 24.1 80.2 43.4 (13.6)0 4 0.74 (1.0) 80 26.1 74.6 39.4 (12.2)0 7 1.29 (1.5) 160 26.1 72.7 45.0 (11.8)0 17 3.06 (2.9) 211 26.5 80.8 41.7 (11.5)0 4 0.65 (0.9) 123 33.7 78.8 52.3 (7.3)0 11 1.50 (1.8) 236 35.8 79.5 51.3 (8.3)0 11 2.82 (2.3) 228 33.1 86.4 51.1 (9.1)0 4 0.69 (0.8) 90 33.7 78.8 53.1 (7.3)0 11 1.48 (1.8) 180 35.8 79.4 51.6 (8.6)0 11 2.94 (2.1) 138 40.2 86.4 52.7 (10.3)0 3 0.57 (0.9) 33 39.8 68.5 50.6 (6.8)0 11 1.60 (2.0) 56 40.1 69.9 51.3 (7.6)0 10 2.65 (2.4) 90 33.1 58.8 48.9 (6.3)
42 A. Favillier et al. / Geomorphology 246 (2015) 35–47
throughout the plot (23 cells out of 54) with maximal differences(N40 years) observed in its lowest part (J, K, L).
4.4. Influence of tree structure on reconstructed patterns
Distinction between single stems and coppice stands allows investi-gation of the influence of tree structure on Ri maps. Comparable statis-tical results are obtained for both species (Table 1) with respect to themean number of scars per tree, whereas tree age and Ri are ~10 yearshigher in Qp (in terms of single stems and of coppice stands) than inAo trees. Interspecies comparison (Table 3) also reveals major differ-ences (k b 0) in results between Ri maps derived from single stems(Fig. 7A, B) mainly resulting from lower Ri(Ao) values, especially inthe lowest part of the slope (K–L, Fig. 7C). Similarly, a slight agreementis observed between the Ri maps computed from coppice stands(Fig. 8A, B) resulting from cells where Ao yields higher Ric scatteredthroughout the plot (Fig. 8C). Conversely, however, intraspecies
Scars per tree
01 -
2
Q. pubescens
A. opalus
Single tree
Coppice stand
Single tree
Coppice stand
0 10 20 305
Empty cells mean No Data
Mean recurrence intervalper cell in year
0 - 10
10 - 20
20 - 30
30 - 40
40 - 50
50- 60
60- 70
Mean per ce
Lower
-30
- -20
(B)(A)
510m
550m
600m
Fig. 6. Recurrence interval map (Refmap) calculated for (A) Quercus pubescens, (B)
comparisons are characterized by higher degrees of similarity (k rang-ing between 0.31 and 0.7). Finally, the k coefficient reveals that Rimaps obtained from Qp and coppice stands of Ao are in fair agreement(k ~0.3) with the Refmap and should be preferred to Ao single stemsfor which a complete absence of agreement (~ −0.02) was obtained(Table 3).
4.5. Bark thickness analysis
To assess the influence of bark thickness on reconstructed recur-rence intervals from both species, a total of 102 trees selected accordingto five diameter classes representative of the tree plot (Table 4), havebeen gauged. The mean bark thickness of sampled Qp was 14 ±4.0 mm (min: 8 mm, max: 24 mm) for Ao and 4 ± 2.1 mm (min:1 mm, max: 10 mm) for Ao. The regression bark thickness modelsestablished for both species and tree morphologies are statistically sig-nificant (r2(Qp) = 0.55, r2(Ao) = 0.77, Fig. 9A). The regression slopes
2 - 4
4 - 6
6 - 9
9 - 12
12 - 17
40 50Meters
absolute error (MAE) of the mean recurrence intervalll in year between speciesRic(Qp)
-20
- -10
-10
- 0
0 - 1
0
10 -
20
20 -
30
30 -
40
40 -
50
Lower Ric(Ao)
Mid-slope
Downslope
Upslope
510m
550m
600m
(C)
510m
550m
600m
Acer opalus trees and (C) variations of the recurrence interval between species.
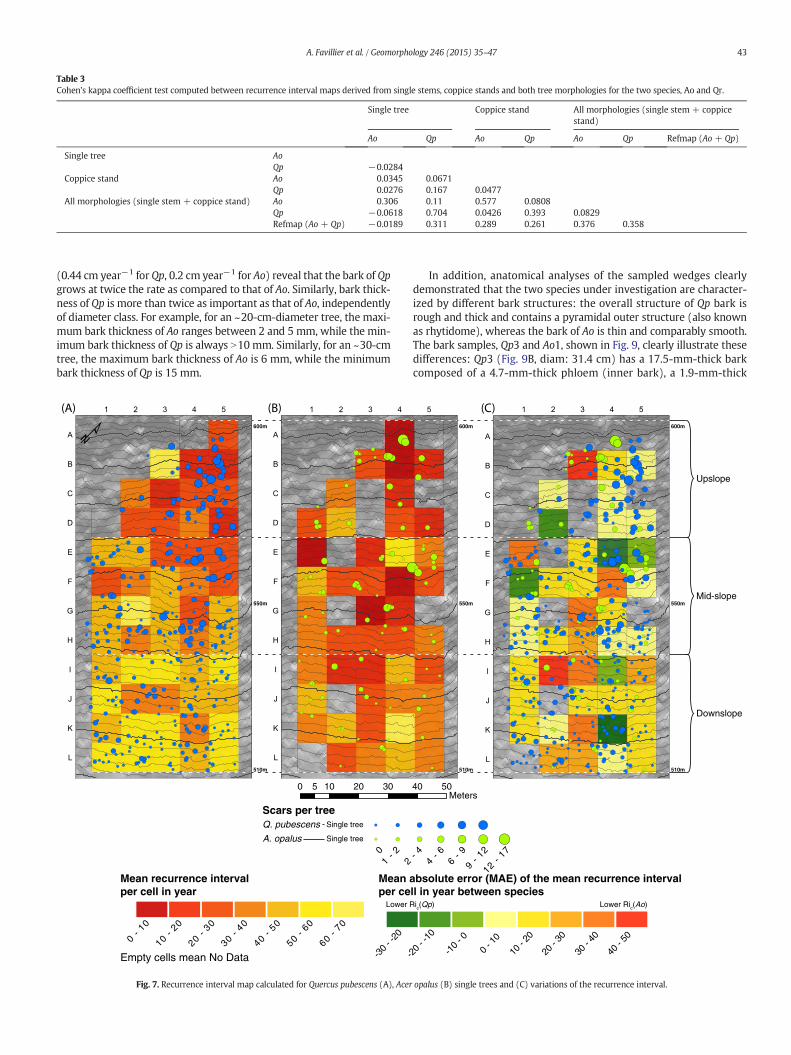
Table 3Cohen’s kappa coefficient test computed between recurrence interval maps derived from single stems, coppice stands and both tree morphologies for the two species, Ao and Qr.
Single tree Coppice stand All morphologies (single stem + coppicestand)
Ao Qp Ao Qp Ao Qp Refmap (Ao + Qp)
Single tree AoQp −0.0284
Coppice stand Ao 0.0345 0.0671Qp 0.0276 0.167 0.0477
All morphologies (single stem + coppice stand) Ao 0.306 0.11 0.577 0.0808Qp −0.0618 0.704 0.0426 0.393 0.0829Refmap (Ao + Qp) −0.0189 0.311 0.289 0.261 0.376 0.358
43A. Favillier et al. / Geomorphology 246 (2015) 35–47
(0.44 cm year−1 for Qp, 0.2 cm year−1 for Ao) reveal that the bark of Qpgrows at twice the rate as compared to that of Ao. Similarly, bark thick-ness of Qp is more than twice as important as that of Ao, independentlyof diameter class. For example, for an ~20-cm-diameter tree, the maxi-mum bark thickness of Ao ranges between 2 and 5 mm, while the min-imum bark thickness of Qp is always N10 mm. Similarly, for an ~30-cmtree, the maximum bark thickness of Ao is 6 mm, while the minimumbark thickness of Qp is 15 mm.
Scars per treeQ. pubescens Single tree
01 -
22
A. opalus Single tree
Empty cells mean No Data
Mean recurrence intervalper cell in year
0 - 10
10 - 20
20 - 30
30 - 40
40 - 50
50- 60
60- 70
Mean aper ce
-30
- -20
Lower R
0 10 20 305
510m
550m
600m
Fig. 7. Recurrence interval map calculated for Quercus pubescens (A), Acer
In addition, anatomical analyses of the sampled wedges clearlydemonstrated that the two species under investigation are character-ized by different bark structures: the overall structure of Qp bark isrough and thick and contains a pyramidal outer structure (also knownas rhytidome), whereas the bark of Ao is thin and comparably smooth.The bark samples, Qp3 and Ao1, shown in Fig. 9, clearly illustrate thesedifferences: Qp3 (Fig. 9B, diam: 31.4 cm) has a 17.5-mm-thick barkcomposed of a 4.7-mm-thick phloem (inner bark), a 1.9-mm-thick
- 4
4 - 6
6 - 9
9 - 12
12 - 17
bsolute error (MAE) of the mean recurrence intervalll in year between species
-20
- -10
-10
- 0
0 - 1
0
10 -
20
20 -
30
30 -
40
40 -
50
ic(Qp) Lower Ric(Ao)
40 50Meters
510m
550m
600m
Mid-slope
Downslope
Upslope
510m
550m
600m
opalus (B) single trees and (C) variations of the recurrence interval.
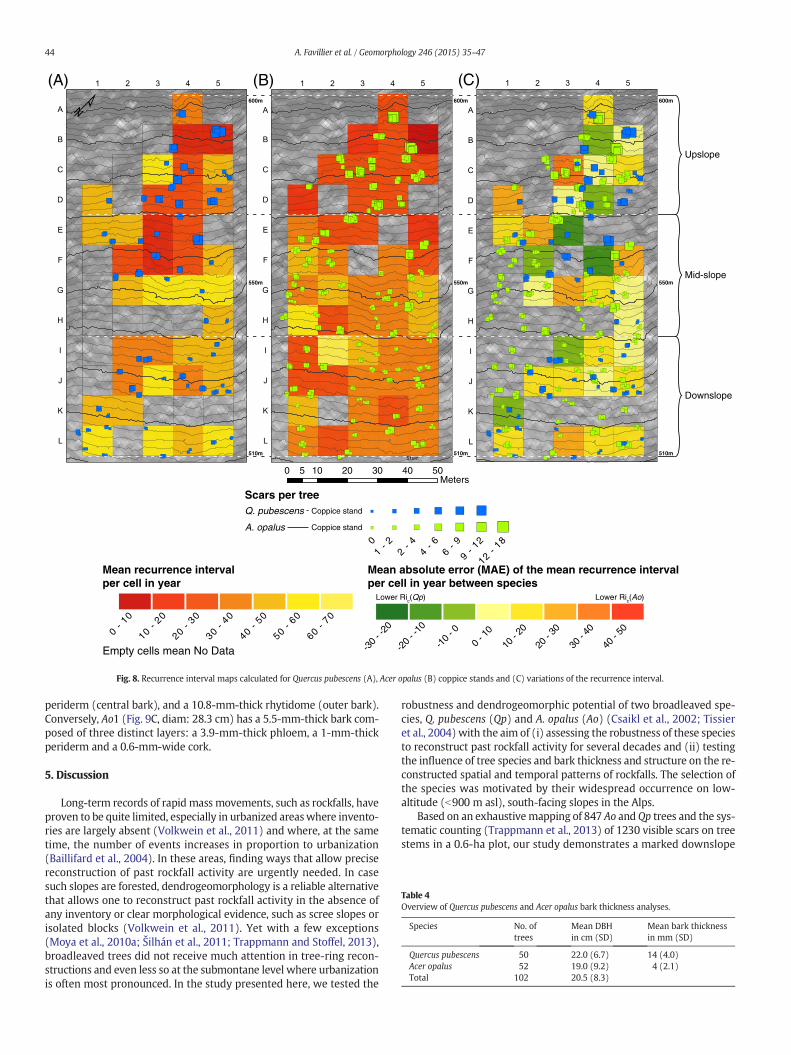
Table 4Overview of Quercus pubescens and Acer opalus bark thickness analyses.
Species No. oftrees
Mean DBHin cm (SD)
Mean bark thicknessin mm (SD)
Quercus pubescens 50 22.0 (6.7) 14 (4.0)Acer opalus 52 19.0 (9.2) 4 (2.1)Total 102 20.5 (8.3)
0 10 20 30 40 505Meters
Scars per tree
01 -
22 -
44 -
66 -
9
9 - 12
12 - 18
Q. pubescens Coppice stand
A. opalus Coppice stand
Empty cells mean No Data
Mean recurrence intervalper cell in year
0 - 10
10 - 20
20 - 30
30 - 40
40 - 50
50- 60
60- 70
Mean absolute error (MAE) of the mean recurrence intervalper cell in year between species
-30
- -20
-20
- -10
-10
- 0
0 - 1
0
10 -
20
20 -
30
30 -
40
40 -
50
Lower Ric(Qp) Lower Ric(Ao)
(C)
Mid-slope
Downslope
Upslope
510m
550m
600m
510m
(B)
510m
550m
600m
(A)
510m
550m
600m
Fig. 8. Recurrence interval maps calculated for Quercus pubescens (A), Acer opalus (B) coppice stands and (C) variations of the recurrence interval.
44 A. Favillier et al. / Geomorphology 246 (2015) 35–47
periderm (central bark), and a 10.8-mm-thick rhytidome (outer bark).Conversely, Ao1 (Fig. 9C, diam: 28.3 cm) has a 5.5-mm-thick bark com-posed of three distinct layers: a 3.9-mm-thick phloem, a 1-mm-thickperiderm and a 0.6-mm-wide cork.
5. Discussion
Long-term records of rapid mass movements, such as rockfalls, haveproven to be quite limited, especially in urbanized areaswhere invento-ries are largely absent (Volkwein et al., 2011) and where, at the sametime, the number of events increases in proportion to urbanization(Baillifard et al., 2004). In these areas, finding ways that allow precisereconstruction of past rockfall activity are urgently needed. In casesuch slopes are forested, dendrogeomorphology is a reliable alternativethat allows one to reconstruct past rockfall activity in the absence ofany inventory or clear morphological evidence, such as scree slopes orisolated blocks (Volkwein et al., 2011). Yet with a few exceptions(Moya et al., 2010a; Šilhán et al., 2011; Trappmann and Stoffel, 2013),broadleaved trees did not receive much attention in tree-ring recon-structions and even less so at the submontane level where urbanizationis often most pronounced. In the study presented here, we tested the
robustness and dendrogeomorphic potential of two broadleaved spe-cies, Q. pubescens (Qp) and A. opalus (Ao) (Csaikl et al., 2002; Tissieret al., 2004) with the aim of (i) assessing the robustness of these speciesto reconstruct past rockfall activity for several decades and (ii) testingthe influence of tree species and bark thickness and structure on the re-constructed spatial and temporal patterns of rockfalls. The selection ofthe species was motivated by their widespread occurrence on low-altitude (b900 m asl), south-facing slopes in the Alps.
Based on an exhaustivemapping of 847 Ao and Qp trees and the sys-tematic counting (Trappmann et al., 2013) of 1230 visible scars on treestems in a 0.6-ha plot, our study demonstrates a marked downslope

45A. Favillier et al. / Geomorphology 246 (2015) 35–47
decrease in the number of observed scars per stem in both species. Therelated upslope-decreasing recurrence intervals (Ri) also clearly dem-onstrate the protective effect of the forest at the study site. Recurrence
(C)10 mm
1 mm
(B)
PhmXm Cm Pr
2 mm
10 mm
Bark thickness = 0.4377*DBH + 4.0034
R² = 0.55
Quercus pubescens
Linear regression
0
5
10
15
20
25
30
0 10 20
Bar
k th
ickn
ess
(mm
)
Diameter at b
(A)
Fig. 9. Bark analysis forQuercus pubescens and Acer opalus. (A) Bark thickness–diameter linear re(wedge section Ao1). B: bark; W: wood; Xm: xylem; Cm: cambium; Phm: phloem; Pr: peride24 mm. Ao1 has a DBH of 28.3 cm and a gauged bark thickness of 6 mm.
intervals are consistentwith the concave profile of the slope and furtherhighlight the energy absorption of rockfalls (i) at each impact point, es-pecially for the first ones (Evans and Hungr, 1993) and (ii) through
CkPhm Pr
Rhy
Bark thickness = 0.2038*DBH - 0.0329
R² = 0.77
Acer opalus
Linear regression
30 40 50reast height (cm)
gressionmodels. (B) Details ofQuercus pubescens (wedge sectionQp3) and (C) Acer opalusrm; Rhy: rhytidome; Ck: cork. Qp3 has a DBH of 31.4 cm and a gauged bark thickness of

46 A. Favillier et al. / Geomorphology 246 (2015) 35–47
direct impact between a boulder and a trunk (e.g., Gsteiger, 1989;Dorren et al., 2005, 2006). In addition, lower recurrence intervals arealso observed in topographic depressions, where rockfall tends to bechannelized. Besides the pure recording of impacts stemming frompast rockfall activity, we also confirm the ability of Ao and Qp to inte-grate and thus represent morphologic constraints of the rockfall path(Nicoletti and Sorriso-Valvo, 1991; Corominas, 1996).
While both species yield comparable downslope patterns of de-creasing rockfall activity along the slope, they also exhibit a series of dif-ferences in the absolute numbers of events recorded on the stemsurfaces and hence in the return intervals obtained from Ao and Qp atthe cell scale. As a result, while yielding the same mean number ofscars (1.5 scars stem−1), Ao produces recurrence intervals that are, in40% of the cells, more than 10 years smaller than those observed inQp, therefore resulting in only slight agreement if maps are obtainedseparately for each species. We attribute (part of) these differences be-tween Ao and Qp to species-specific differences in bark structure andthickness. Indeed, rockfall wounding only occurs if a falling block isable to abrade the bark and to (partly) destroy the underlying cambium(Stoffel and Bollschweiler, 2008). In that case, tree growth will bedisrupted locally, therefore leading to the formation of externally visiblewound callus pads (Larson, 1994; Fink, 1999). As a consequence, onlythose rockfalls with sufficient energy tomechanically damage cambium(Schneuwly, 2009) will leave evidence on the stem,whereas the impactof small rock fragments may not necessarily be recorded by a tree. Inthis study, we demonstrate that the bark of Qp thickens at twice therate of that of Ao and that bark thickness of Qp was more than twiceas important as compared to Ao for a same-diameter class. These differ-ences are interpreted as different adaptation strategies — e.g., heat-protecting function in the case of the thick and fissured Qp bark or, bycontrast, energy saving and limited allocation of resources to bark for-mation in pioneering plants such as Ao so as to remain competitive dur-ing the colonization process (Nicolai, 1986) — and may have led todifferent sensitivities of trees to be injured by mechanical impacts.Taking into account the rather limited volume of rocks at “Croupe duPlantin” (0.06m3 for the biggest fragments), we believe that the thickerouter bark found inQp could indeed act as amechanical barrier to dam-age (Fritts, 1976), thereby buffering low energy rockfalls and avoidinginjury of the underlying tissues. Moreover, the flexible pyramidalouter bark of Qpmay, in addition, be very well able to comply with me-chanical stress (Romero, 2006). On the other hand, impacts of similarenergy may be sufficient to cause injury to the softer and coatedxylem of Ao, which is only poorly protected from damage by a verythin bark. This hypothesis is consistent with the increasing downslopedifferences and quasi-systematic overestimation of recurrence intervalsin Qp, especially in the lower one-third of the slope where the residualenergy of rocks will be limited as a result of multiple rebounds and in-teractions with stems higher up on the slope.
A second reason for the interspecies differences is certainly relatedto the effect of hidden scars (Stoffel and Perret, 2006). Indeed, surfaceexposed to decay as a result of wounding will slowly be covered bythe centripetal growth of the cambium, which will consequently resultin the production of newwood and bark tissues that can eventually sealthe wound (Fisher, 1981; Sachs, 1991). The extent and velocity ofwound healingwill depend on various factors, such as the annual incre-ment rate, tree age, health state of the tree, scar size (Bollschweiler et al.,2008; Schneuwly et al., 2009), and/or bark thickness (Stoffel and Perret,2006). Stoffel (2005), for instance, could identify 75% of all scars by visu-al interpretation through the simple inspection of the bark structure ofF. sylvatica, whereas only 51% of the injuries remained visible on thestem surface of P. abies. Similarly, on a mixed forest stand in theAustrian Alps, Trappmann and Stoffel (2013) observed that the meannumber of scars on the stem surface of F. sylvatica exceeded that ofP. abies by a factor of 2.7 and for the same site. In analogy with these re-sults, one can assume that virtually all scars would remain visible on thestem surface of Ao, whereas wound blurring could indeed remove
evidence of past events on the stem surface of Qp owing to its thickerand rougher bark.
Additionally, reasons for differences at the cell scale can be related tothe clustered coppice-specific spatial stem distribution in clumps. At thescale of individual trees, the effect of an impact upon a group of stumpshoots of a coppiced tree is not necessarily the same as that of a similarimpact on a noncoppiced plant of equivalent diameter (Jancke et al.,2009). As clumps consist of a dense bundle of stems with relativelysmall diameters, one single boulder passing through a cluster wouldlikely hit several stems and might thus leave multiple scars (Ciaboccoet al., 2009). Yet this phenomenon depends on the volume of theblock. If the boulder is small, the likelihood for it to pass through thecoppice shoots of the same stump will be larger than in the case of alarger stump (Trappmann et al., 2013;Morel et al., 2015). This phenom-enon is further amplified when boulders bounce higher; so that theycross the coppice shoots at greater height, where the distance betweentrunks naturally increases. Using the scar count approach, each injuryon a clump is considered as an individual rockfall that might result inan overestimation of real frequencies (Trappmann and Stoffel, 2013).This hypothesis is further supported by the Rimap computed from cop-pice stands, especially from Ao stumps dominant in the study plot,which yield lower recurrence intervals throughout the slope. Wetherefore feel that scars located very close to each other should not beconsidered as individual events in future studies or to include impactprobability concepts (Moya et al., 2010b; Trappmann et al., 2014) toreduce the bias introduced by multiple impacts.
6. Conclusion
Thefindings of this study indicate quite clearly that an assessment ofrockfall activity based on visible damage on A. opalus and Q. pubescenstrees will result at the slope scale in similar data on the spatial distribu-tion of relative rockfall activity with similar downslope-decreasing re-currence intervals. Yet the recurrence intervals observed on the stemsurface of Q. pubescens exceed that of A. opalus by N20 years in thelower part of the plot owing to the thicker bark of Qp that constitutesan efficient mechanical barrier buffering low energy rockfalls. Resultsalso (i) suggest that the dendrogeomorphic reconstruction of past rock-falls is more accurate if analyses are performed using a sampling designmixing species and structures and (ii) confirm the reliability of thecounting scar approach as an efficient and effective method for the spa-tial assessment of rockfall activity on larger surfaces, as it can be realizedwith limited temporal and financial efforts. Despite the differences inrockfall recurrence intervals computed for each of the tree species,A. opalus and Q. pubescens proved to be valuable sources of informationfor the reconstruction of former events at Saint-Paul-de-Varces. Theyshould be used more widely in future tree-ring studies, especially be-cause they typically colonize low-altitude slopes, close to urbanizedareas, where conifers are generally absent.
Acknowledgments
This work has been supported by a grant LabEx Osug@2020(Investissements d'avenir — ANR10LABX56). The authors are gratefulto Eric Mermin, Pascal Tardif, Franck Bourrier, Rémi Rosamont, JordanFèvre and all of the IRSTEA teamMountain Ecosystems for their scientif-ic and technical supports and helpful comments. The authors acknowl-edge the three anonymous reviewers for their helpful comments on themanuscript and to Richard A. Marston for the thorough editing.
References
Alestalo, J., 1971. Dendrochronological interpretation of geomorphic processes. Fennia105, 1–139.
Arbellay, E., Fonti, P., Stoffel, M., 2012. Duration and extension of anatomical changes inwood structure after cambial injury. J. Exp. Bot. 63, 3271–3277.

47A. Favillier et al. / Geomorphology 246 (2015) 35–47
Arbellay, E., Stoffel, M., Sutherland, E.K., Smith, K.T., Falk, D.A., 2014a. Resin duct size anddensity as ecophysiological traits in fire scars of Pseudotsuga menziesii and Larixoccidentalis. Ann. Bot. 114, 973–980. http://dx.doi.org/10.1093/aob/mcu168.
Arbellay, E., Stoffel, M., Sutherland, E.K., Smith, K.T., Falk, D.A., 2014b. Changes in tracheidand ray traits in fire scars of North American conifers and their ecophysiologicalimplications. Ann. Bot. 114, 223–232. http://dx.doi.org/10.1093/aob/mcu112.
Astrade, L., Lutoff, C., Nedjai, R., Philippe, C., Loison, D., Bottollier-Depois, S., 2007.Periurbanisation and natural hazards. J. Alp. Res. 95, 19–28. http://dx.doi.org/10.4000/rga.132.
Baillifard, F., Jaboyedoff, M., Rouiller, J.D., Robichaud, G.R., Locat, P., Locat, J., Couture, R.,Hamel, G., 2004. Towards a GIS-based hazard assessment along the Quebec CityPromontory, Quebec, Canada. In: Lacerda, W.A., Ehrlich, M., Fontoura, S.A.B., Sayao,A.S.F. (Eds.), Landslides: Evaluation and Stabilization. Taylor & Francis Group,London, pp. 207–214.
Berger, F., Quetel, C., Dorren, L.K.A., 2002. Forest: A Natural Protection Mean AgainstRockfalls, but With Which Efficiency. Int. Congr. Interpraevent.
Bollschweiler, M., Stoffel, M., Schneuwly, D.M., Bourqui, K., 2008. Traumatic resin ducts inLarix decidua stems impacted by debris flows. Tree Physiol. 28, 255–263. http://dx.doi.org/10.1093/treephys/28.2.255.
Bräker, O.U., 2002. Measuring and data processing in tree-ring research — a methodolog-ical introduction. Dendrochronologia 20, 203–216.
Cardinali, M., Galli, M., Guzzetti, F., Ardizzone, F., Reichenbach, P., Bartoccini, P., 2006. Rainfallinduced landslides in December 2004 in south-western Umbria, central Italy: types, ex-tent, damage and risk assessment. Nat. Hazards Earth Syst. Sci. 6, 237–260.
Ciabocco, G., Boccia, L., Ripa, M.N., 2009. Energy dissipation of rockfalls by coppice struc-tures. Nat. Hazards Earth Syst. Sci. 9, 993–1001.
Corominas, J., 1996. The angle of reach as a mobility index for small and large landslides.Can. Geotech. J. 33, 260–271.
Corona, C., Trappmann, D., Stoffel, M., 2013. Parameterization of rockfall source areas andmagnitudes with ecological recorders: when disturbances in trees serve the calibra-tion and validation of simulation runs. Geomorphology 202, 33–42. http://dx.doi.org/10.1016/j.geomorph.2013.02.001.
Csaikl, U.M., Burg, K., Fineschi, S., König, A.O., Mátyás, G., Petit, R.J., 2002. Chloroplast DNAvariation of white oaks in the Alpine region. For. Ecol. Manag. 156, 131–145.
Dorren, L.K.A., Berger, F., le Hir, C., Mermin, E., Tardif, P., 2005. Mechanisms, effects andmanagement implications of rockfall in forests. For. Ecol. Manag. 215, 183–195.
Dorren, L.K.A., Berger, F., Putters, U.S., 2006. Real-size experiments and 3-D simulation ofrockfall on forested and non-forested slopes. Nat. Hazards Earth Syst. Sci. 6, 145–153.
Dussauge-Peisser, C., Helmstetter, A., Grasso, J.-R., Hantz, D., Desvarreux, P., Jeannin, M.,Giraud, A., 2002. Probabilistic approach to rock fall hazard assessment: potential ofhistorical data analysis. Nat. Hazards Earth Syst. Sci. 2, 15–26.
ESRI 2012. ArcGIS 10.1 for desktop. Redlands, CA.Evans, S.G., Hungr, O., 1993. The assessment of rockfall hazard at the base of talus slopes.
Can. Geotech. J. 30, 620–636.Fink, S., 1999. Pathological and Regenerative Plant Anatomy, in: Encyclopedia of Plant
Anatomy. Gebrüder Bornträger, Berlin, Stuttgart.Fisher, J.B., 1981.Wound-healing by exposed secondary xylem in Adansonia (Bombacaceae).
IAWA Bull. 2, 193–199.Fritts, H.C., 1976. Tree-rings and Climate. Academic Press, London.Gsteiger, P., 1989. Steinschlag, Wald, Relief. Empirische Grundlagen zur
Steinschlagmodellierung. Université de Bern, Bern, Suisse (Thèse non publiée).Hantz, D., Vengeon, J.M., Dussauge-Peisser, C., 2003. An historical, geomechanical and
probabilistic approach to rock-fall hazard assessment. Nat. Hazards Earth Syst. Sci.3, 693–701.
Hantz, D., Rossetti, J., Servant, F., D'Amato, J., 2014. Etude de la distribution des blocs dansun éboulement pour l'évaluation de l'aléa. Presented at the Rock Slope Stability,Marrakech, Maroc, p. 10.
Hungr, O., Evans, S.G., Hazzard, J., 1999. Magnitude and frequency of rock falls and rockslides along the main transportation corridors of southwestern British Columbia.Can. Geotech. J. 36, 224–238.
Jancke, O., 2012. Quantifying the Mechanical Resistance of Coppice Trees Against Rockfall(Thesis). University of Hamburg, Hamburg.
Jancke, O., Dorren, L.K.A., Berger, F., Fuhr, M., Köhl, M., 2009. Implications of coppice standcharacteristics on the rockfall protection function. For. Ecol. Manag. 259, 124–131.http://dx.doi.org/10.1016/j.foreco.2009.10.003.
Kennedy, M., 2009. Introducing Geographic Information Systems With ArcGIS: A Work-book Approach to Learning GIS. John Wiley & Sons.
Landis, J.R., Koch, G.G., 1977. The measurement of observer agreement for categoricaldata. Biometrics 33, 159–174.
Larson, P.R., 1994. The Vascular Cambium— Development and Structure. Springer, Berlin.Matsuoka, N., Sakai, H., 1999. Rockfall activity from an alpine cliff during thawing periods.
Geomorphology 28, 309–328.Morel, P., Trappmann, D., Corona, C., Stoffel, M., 2015. Defining sample size and sampling
strategy for dendrogeomorphic rockfall reconstructions. Geomorphology 236, 79–89.Moya, J., Corominas, J., Arcas, J.P., 2010a. Assessment of the rockfall frequency for hazard
analysis at Solà d'Andorra (Eastern Pyrenees). In: Stoffel, M., Bollschweiler, M., Butler,D.R., et al. (Eds.), Tree Rings and Natural Hazards. Springer, Dordrecht: Netherlands,pp. 161–175.
Moya, J., Corominas, J., Pérez Arcas, J., Baeza, C., 2010b. Tree-ring based assessment ofrockfall frequency on talus slopes at Solà d'Andorra, Eastern Pyrenees. Geomorphol-ogy 118, 393–408. http://dx.doi.org/10.1016/j.geomorph.2010.02.007.
Nicolai, V., 1986. The bark of trees: thermal properties, microclimate and fauna. Oecologia69, 148–160.
Nicoletti, P.G., Sorriso-Valvo, M., 1991. Geomorphic controls of the shape and mobility ofrock avalanches. Geol. Soc. Am. Bull. 103, 1365–1373.
Perret, S., Baumgartner, M., Kienholz, H., 2006a. Inventory and analysis of tree injuries in arockfall-damaged forest stand. Eur. J. For. Res. 125, 101–110.
Perret, S., Stoffel, M., Kienholz, H., 2006b. Spatial and temporal rockfall activity in a foreststand in the Swiss preAlps — a dendrogeomorphological case study. Geomorphology74, 219–231.
Quilhó, T., Sousa, V., Tavares, F., Pereira, H., 2013. Bark anatomy and cell size variation inQuercus faginea. Turk. J. Bot. 37, 561–570.
Romero, C., 2006. Tree Responses to Stem Damage (PhD). Florida.Rozas, V., 2003. Tree age estimates in Fagus sylvatica and Quercus robur: testing previous
and improved methods. Plant Ecol. 167, 193–212.Sachs, T., 1991. Pattern Formation in Plant Tissue. Cambridge University Press, Cambridge.Sass, O., Oberlechner, M., 2012. Is climate change causing increased rockfall frequency in
Austria? Nat. Hazards Earth Syst. Sci. 12, 3209–3216. http://dx.doi.org/10.5194/nhess-12-3209-2012.
Schläppy, R., Eckert, N., Jomelli, V., Stoffel, M., Grancher, D., Brunstein, D., Naaim, M.,Deschatres, M., 2014. Validation of extreme snow avalanches and related returnperiods derived from a statistical–dynamical model using tree-ring techniques.Cold Reg. Sci. Technol. 99, 12–26. http://dx.doi.org/10.1016/j.coldregions.2013.12.001.
Schneuwly, D.M., 2009. Tree Rings and Rockfall — Anatomic Tree Reactions and Spatio-temporal Rockfall Analysis (Geoscience). Fribourg, Fribourg, Suisse.
Schneuwly, D.M., Stoffel, M., 2008. Tree-ring based reconstruction of the seasonal timing,major events and origins of rockfall on a case study slope in the Swiss Alps. Nat. Haz-ards Earth Syst. Sci. 8, 203–211.
Schneuwly, D.M., Stoffel, M., Dorren, L., Berger, F., 2009. Three-dimensional analysis of theanatomical growth response of European conifers to mechanical disturbance. TreePhysiol. 29, 1247–1257. http://dx.doi.org/10.1093/treephys/tpp056.
Shroder, J.F., 1978. Dendrogeomorphological analysis of mass movement on Table CliffsPlateau, Utah. Quat. Res. 9, 168–185.
Šilhán, K., Brázdil, R., Pánek, T., Dobrovolný, P., Kašičková, L., Tolasz, R., Turský, O.,Václavek, M., 2011. Evaluation of meteorological controls of reconstructed rockfall ac-tivity in the Czech Flysch Carpathians. Earth Surf. Proc. Land. 36, 1898–1909. http://dx.doi.org/10.1002/esp.2211.
Šilhán, K., Pánek, T., Hradecký, J., 2013. Implications of spatial distribution of rockfall re-constructed by dendrogeomorphological methods. Nat. Hazards Earth Syst. Sci. 13,1817–1826. http://dx.doi.org/10.5194/nhess-13-1817-2013.
Smeeton, N.C., 1985. Early history of the kappa statistic. Biometrics 41, 795.Stoffel, M., 2005. Assessing the vertical distribution and visibility of rockfall scars in trees.
Schweiz. Z. Forstwes. 158, 195–199.Stoffel, M., 2006. A review of studies dealing with tree rings and rockfall activity: the role
of dendrogeomorphology in natural hazard research. Nat. Hazards 39, 51–70.Stoffel, M., Bollschweiler, M., 2008. Tree-ring analysis in natural hazards research — an
overview. Nat. Hazards Earth Syst. Sci. 8, 187–202.Stoffel, M., Corona, C., 2014. Dendroecological dating of geomorphic disturbance in trees.
Tree-Ring Res. 70, 3–20. http://dx.doi.org/10.3959/1536-1098-70.1.3.Stoffel, M., Perret, S., 2006. Reconstructing past rockfall activity with tree rings: some
methodological considerations. Dendrochronologia 24, 1–15.Stoffel, M., Lièvre, I., Monbaron,M., Perret, S., 2005a. Seasonal timing of rockfall activity on
a forested slope at Täschgufer (Valais, Swiss Alps)— a dendrochronological approach.Z. Geomorphol. 49, 89–106.
Stoffel, M., Schneuwly, D., Bollschweiler, M., Lièvre, I., Delaloye, R., Myint, M., Monbaron,M., 2005b. Analyzing rockfall activity (1600–2002) in a protection forest — a casestudy using dendrogeomorphology. Geomorphology 68, 224–241.
Stoffel, M., Wehrli, A., Kühne, R., Dorren, L.K.A., Perret, S., Kienholz, H., 2006. Assessing theprotective effect of mountain forests against rockfall using a 3D simulation model.For. Ecol. Manag. 225, 113–122.
Stoffel, M., Schneuwly, D.M., Bollschweiler, M., 2010. Assessing rockfall activity in amountain forest — implications for hazard assessment. In: Stoffel, M., Bollschweiler,M., Butler, D.R., Luckman, B.H. (Eds.), Tree Rings and Natural Hazards, Advances inGlobal Change Research. Springer, Netherlands, pp. 139–155.
Tissier, J., Lambs, L., Peltier, J.-P., Marigo, G., 2004. Relationships between hydraulic traitsand habitat preference for six Acer species occurring in the French Alps. Ann. For. Sci.61, 81–86.
Trappmann, D., Stoffel, M., 2013. Counting scars on tree stems to assess rockfall hazards: alow effort approach, but how reliable? Geomorphology 180, 180–186. http://dx.doi.org/10.1016/j.geomorph.2012.10.009.
Trappmann, D., Stoffel, M., 2015. Visual dating of rockfall scars in decidua trees. Geomor-phology http://dx.doi.org/10.1016/j.geomorph.2015.04.030.
Trappmann, D., Corona, C., Stoffel, M., 2013. Rolling stones and tree rings: a state of re-search on dendrogeomorphic reconstructions of rockfall. Prog. Phys. Geogr. 37,701–716. http://dx.doi.org/10.1177/0309133313506451.
Trappmann, D., Stoffel, M., Corona, C., 2014. Achieving a more realistic assessment ofrockfall hazards by coupling three-dimensional process models and field-basedtree-ring data. Earth Surf. Process. Landf. 39, 1866–1875. http://dx.doi.org/10.1002/esp.3580.
Villalba, R., Veblen, T.T., 1997. Improving estimates of total tree ages based on incrementcore samples. Ecoscience 4, 534–542.
Volkwein, A., Schellenberg, K., Labiouse, V., Agliardi, F., Berger, F., Bourrier, F., Dorren,L.K.A., Gerber, W., Jaboyedoff, M., 2011. Rockfall characterisation and structural pro-tection — a review. Nat. Hazards Earth Syst. Sci. 11, 2617–2651. http://dx.doi.org/10.5194/nhess-11-2617-2011.
West, P.W., 2009. Tree and Forest Measurement. Springer Science & Business Media,Heidelberg.