Embed Size (px)
Citation preview
Pure Appl. Chem., Vol. 75, No. 7, pp. 875–888, 2003.© 2003 IUPAC
875
Potential of group contribution methods for theprediction of phase equilibria and excessproperties of complex mixtures*
J. Gmehling
Universität Oldenburg, Technische Chemie, 26111 Oldenburg, Germany
Abstract: Reliable knowledge of the thermophysical properties of pure compounds and theirmixtures in the whole composition and a wide temperature and pressure range is a vital pre-requisite for computer-aided synthesis, design, and optimization of chemical processes.Knowledge of the various phase equilibria is most important for the development of thermalseparation processes (but also for other applications, such as the design of multiphase reac-tors, the prediction of the fate of a chemical in the environment, etc.).
Whereas 25 years ago, the main interest was directed to the development of predictivetools for vapor–liquid equilibria of subcritical compounds of similar size (ASOG, UNIFAC),15 years later a proper description of the temperature dependence (excess enthalpies), the ac-tivity coefficients at infinite dilution, and solid–liquid equilibria of eutectic mixtures (in-cluding strong asymmetric systems) was achieved. After the combination with cubic equa-tions of state [Soave–Redlich–Kwong (SRK), Peng–Robinson (PR)], the group contributionconcept was extended to supercritical compounds [predictive SRK (PSRK)]. With the devel-opment of an adequate electrolyte model (LIFAC), the equation-of-state approach can evenbe used for systems with strong electrolytes. With the revision of the group interaction pa-rameters, the extension of the parameter matrix (introduction of new structural groups, fill-ing of parameter gaps), and the help of a large database (Dortmund Data Bank), the predictedresults of group contribution methods were significantly improved and the range of applica-bility greatly extended. Furthermore, still-existing problems with the group contribution ap-proach (proximity effects, etc.) were reduced.
With the help of a volume-translated PR equation of state and application of tempera-ture-dependent and improved mixing rules, the remaining weaknesses of group contributionequations of state (such as poor results for liquid densities, excess enthalpies, and the prob-lems with asymmetric systems) were minimized.
INTRODUCTION
A classical chemical plant can be roughly divided in a preparation, reaction, and separation step.Although the reactor can be considered as the heart or core of the chemical plant, often 60–80 % of thetotal costs are caused by the separation step, where the various thermal separation processes (in partic-ular distillation processes) are applied to obtain the products with the desired purity, to recycle the un-converted reactants, and to remove the undesired side-products.
Different aspects have to be considered during the synthesis of separation processes. First, the en-gineer has to decide which separation processes should be used. Then, he or she has to find out if sep-
*Plenary lecture presented at the 17th IUPAC Conference on Chemical Thermodynamics (ICCT), Rostock, Germany, 28 July–2 August 2002. Other presentations are published in this issue, pp. 859–936.
aration problems occur. In the case of distillation, these are azeotropic points. To understand the sepa-ration process, knowledge of residual curves and boundary lines is quite helpful. In the case of a sepa-ration problem in the form of an azeotropic point, the engineer has to find an alternative way (vacuum,pressure, or pressure swing distillation) without the use of an entrainer, or has to select suitable solventsfor the separation of the considered system (e.g., by azeotropic or extractive distillation). Furthermore,the engineer has to determine the number of theoretical stages or the height of the packing of the sep-aration column, and, additionally, he or she has to choose the optimal separation sequence. To treat thedifferent aspects mentioned before, a reliable knowledge of the phase equilibrium behavior as f(T,P,xi)for multicomponent systems is required.
However, phase equilibria are not only important for the design of separation processes, but alsofor other applications, such as the design of biphasic reactors or the estimation of the fate of a persist-ent chemical in the environment.
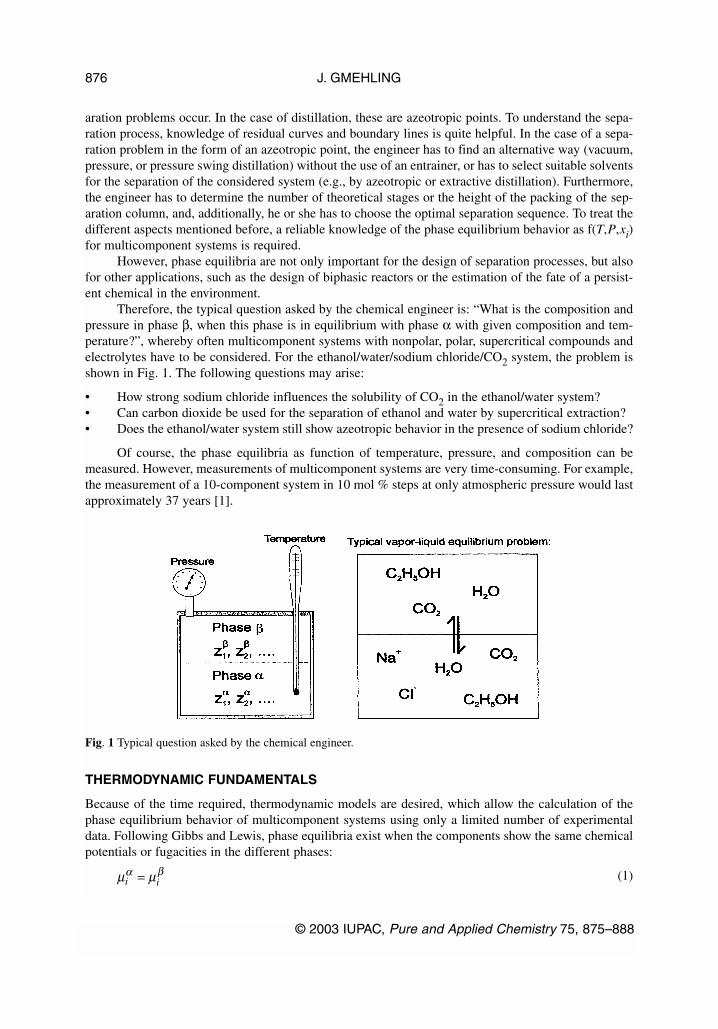
Therefore, the typical question asked by the chemical engineer is: “What is the composition andpressure in phase β, when this phase is in equilibrium with phase α with given composition and tem-perature?”, whereby often multicomponent systems with nonpolar, polar, supercritical compounds andelectrolytes have to be considered. For the ethanol/water/sodium chloride/CO2 system, the problem isshown in Fig. 1. The following questions may arise:
• How strong sodium chloride influences the solubility of CO2 in the ethanol/water system? • Can carbon dioxide be used for the separation of ethanol and water by supercritical extraction?• Does the ethanol/water system still show azeotropic behavior in the presence of sodium chloride?
Of course, the phase equilibria as function of temperature, pressure, and composition can bemeasured. However, measurements of multicomponent systems are very time-consuming. For example,the measurement of a 10-component system in 10 mol % steps at only atmospheric pressure would lastapproximately 37 years [1].
THERMODYNAMIC FUNDAMENTALS
Because of the time required, thermodynamic models are desired, which allow the calculation of thephase equilibrium behavior of multicomponent systems using only a limited number of experimentaldata. Following Gibbs and Lewis, phase equilibria exist when the components show the same chemicalpotentials or fugacities in the different phases:
(1)
J. GMEHLING
© 2003 IUPAC, Pure and Applied Chemistry 75, 875–888
876
Fig. 1 Typical question asked by the chemical engineer.
µ µα βi i=
(2)
But these relations are not very helpful. The connection to the measurable quantities T, P, andcomposition in the liquid and vapor phase is needed to be able to calculate the required K-factors orseparation factors for the different separation processes. Therefore, auxiliary quantities such as activityand fugacity coefficients have been introduced. With the help of these quantities, two different ap-proaches are obtained. The resulting equations for vapor–liquid equilibria (VLE) are the following [2]:
approach A: (3)
approach B: (4)
In approach A, the fugacity coefficients in the liquid and vapor phase are needed, which can becalculated using an equation of state and reliable mixing rules. In approach B, besides a GE model,vapor pressure data are required. When the advantages and disadvantages of the different approachesare compared, approach A shows various important advantages over approach B, for example:
• the same auxiliary quantities are used to describe the real behavior in the liquid and vapor phase,and
• no problems arise with supercritical compounds, since no standard fugacity is required.
At the same time, densities, enthalpies (including heats of vaporization), and heat capacities as afunction of temperature, pressure, and composition can be calculated for both phases, which are re-quired as additional information in the gamma-ϕ approach.
But both approaches allow the calculation of multicomponent systems using only binary infor-mation. Unfortunately, the required binary data are often missing. When one assumes that 1000 com-pounds are of technical interest, phase equilibrium information for about 500 000 binary systems arerequired (see Fig. 2). Although the Dortmund Data Bank (DDB) contains more than 42 000 VLE datasets up to now, VLE data are available for only 8600 systems. This means that only one VLE data setis available for 1.72 % of the required systems. When only consistent VLE data are accepted, or whenmore than one VLE data is desired, the percentage goes down to approximately 1 %. When, besides
© 2003 IUPAC, Pure and Applied Chemistry 75, 875–888
Potential of group contribution methods for the prediction of phase equilibria 877
f fi iα β=
x yi iL
i iVϕ ϕ=
x P y Pi i is
iγ ≈
Fig. 2 Overview about the available experimental thermodynamic data (VLE, γ∞, HE) for process development.
VLE, information about the dilute range and the temperature dependence in the form of γ∞ and HE
should also be used to fit the required model parameters, the percentage of the available systems goesdown to even less than 0.2 %, although in the DDB, approximately 42 000 γ∞ values and 16 500 HE datasets are stored [3]. Since the assumption of ideal behavior can be very erroneous and measurements arevery time-consuming, reliable predictive models are required.
GROUP CONTRIBUTION METHODS (UNIFAC, MODIFIED UNIFAC)
The first predictive model (regular solution theory) with a wide range of applicability was developed byScatchard and Hildebrand [4]. But the regular solution theory can only be applied for nonpolar systems.To be able to handle all kinds of systems, we started in 1973 at the University of Dortmund with the de-velopment of a group contribution method. In group contribution methods, it is assumed that the mix-ture does not consist of molecules, but of functional groups. By a thermodynamic cycle, it can be shownthat the required activity coefficients can be calculated when only the interaction parameters betweenthe functional groups are known. The advantage of group contribution methods is that the number offunctional groups is much smaller than the number of possible molecules.
First of all, our idea was to work on the further development of the ASOG method [5], which wasdeveloped at Shell. Later on, we decided to work on the further development of the UNIFAC method,which was published in 1975 [6]. In the UNIFAC method, the activity coefficients are calculated froma combinatorial and a residual part. Whereas the combinatorial part takes into account the size and formof the molecule, the residual part considers the enthalpic interactions.
At this time, because of the importance of distillation processes, it was the goal to develop a groupmethod for the prediction of VLE. Therefore, only VLE data stored in the DDB were used to fit the re-quired UNIFAC group interaction parameters. This was done in collaboration with the group of Prof.Aa. Fredenslund (Lyngby/Denmark). Because of the reliable results obtained for VLE, and the largerange of applicability, the method was directly integrated in the different process simulators [7].However, in spite of the reliable results for VLE, UNIFAC also shows a few weaknesses, e.g., unsatis-fying results are obtained for:
• activity coefficients at infinite dilution,• heats of mixing (this means the temperature dependence of the activity coefficients following the
Gibbs–Helmholtz relation), and• asymmetric systems.
These weaknesses are not surprising since, with the VLE data used to fit the required group in-teraction parameters, no information from the very dilute range, the temperature dependence (heats ofmixing) and very asymmetric systems is used, since VLE data are usually only measured between 5 and95 mol % for symmetric or slightly asymmetric systems.
To improve the situation, a modified UNIFAC method was developed [8]. The main differencescompared to original UNIFAC are:
• an empirically modified combinatorial part is introduced;• temperature-dependent group interaction parameters are used; and• additional main groups (e.g., for cyclic alkanes, formic acid, etc.) were added.
The required temperature-dependent group interaction parameters are fitted simultaneously to allreliable phase equilibrium [VLE, γ∞, azeotropic data, solid–liquid equilibria (SLE) of eutectic systems,liquid–liquid equilibria (LLE)] and excess property data (HE, Cp
E). To be able to do this job, the DDBwas largely extended. The contribution of the different thermodynamic properties can be summarizedas follows. VLE and azeotropic data deliver the required information about the composition depend-ence of the activity coefficients. Activity coefficients at infinite dilution measured with the help of
J. GMEHLING
© 2003 IUPAC, Pure and Applied Chemistry 75, 875–888
878
gas–liquid chromatography, different ebulliometer techniques or gas stripping methods provide the re-quired information about the real behavior in the dilute range. At the same time, the data measured bygas–liquid chromatography deliver the information about the real behavior of asymmetric systems.With the help of heats of mixing data, the most important information about the temperature depend-ence is available. Unfortunately, most HE data have been measured around room temperature. To im-prove the situation, two isothermal flow calorimeters are used in our laboratory to obtain heats of mix-ing data at 90 and 140 °C. Up to now, more than 600 data sets have been measured for the systematicfurther development of modified UNIFAC. The HE data measured at high temperature (140 °C), to-gether with the SLE data of eutectic systems, are of special importance as supporting data at high andlow temperature, for fitting reliable temperature-dependent group interaction parameters. For fitting theparameters, weighting factors are used for the different contributions to the objective function.
For this job, besides a comprehensive data bank with mixture data and pure component proper-ties (vapor pressures, heats of fusion, melting temperature, critical data, etc.), a sophisticated softwarepackage is required for the selection of the suitable data, examination of the quality of the data (e.g.,with the help of consistency tests), the simultaneous fit of temperature-dependent parameters and a thor-ough examination of the results. For fitting the group interaction parameters for one group combination,often more than 3000 data points are used.
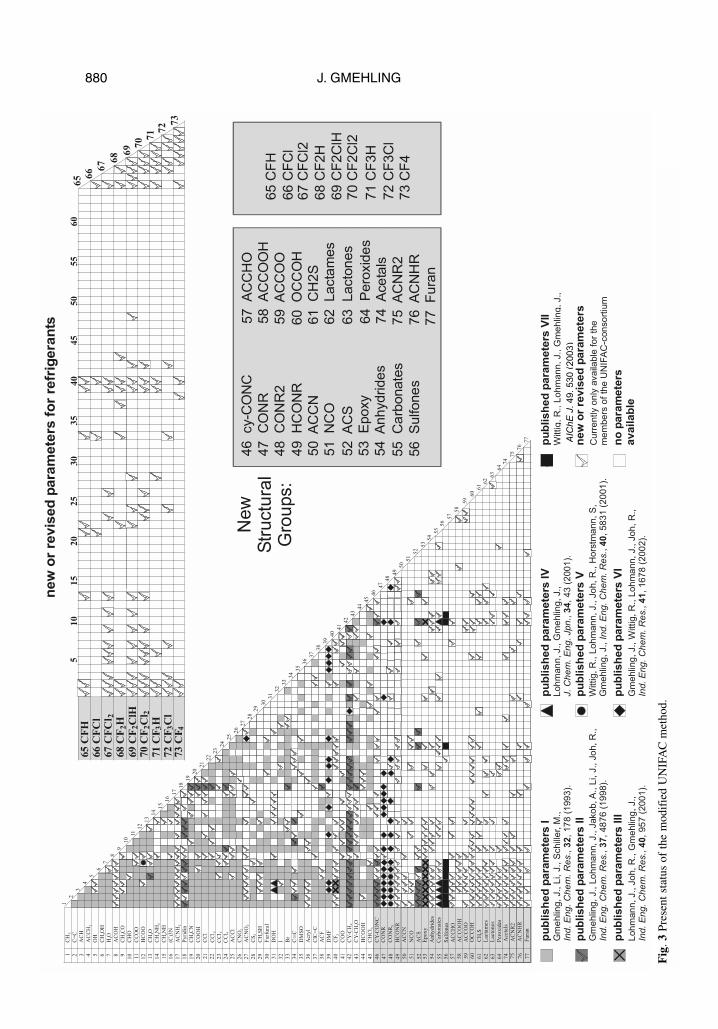
Most important for the application of group contribution methods for the synthesis and design ofseparation processes is a comprehensive parameter matrix with reliable parameters. The present statusof modified UNIFAC is shown in Fig. 3. Today, parameters are available for 77 main groups. In the lastyears, new main groups were introduced for the different types of amides, isocyanates, epoxides, an-hydrides, peroxides, carbonates, various sulfur compounds, and also chlorofluorohydrocarbons (refrig-erants). A great part of the group interaction parameters have been published [9]. The further extension(i.e., the filling of gaps in the parameter matrix or the introduction of new main groups) is carried outwithin the UNIFAC consortium. The current status of the parameter matrix is always available via theInternet [10].
The progress obtained when going from UNIFAC to modified UNIFAC can be recognized froma comparison of the results for 2200 consistent VLE data sets. Using the UNIQUAC equation for thecorrelation, a mean deviation of 0.0058 for the vapor-phase mole fraction was obtained. Whereas withthe original UNIFAC method, a mean deviation of 0.0141 is obtained, with the modified UNIFAC amean deviation of 0.0088 of the vapor-phase mole fraction is achieved. This means that the deviationcompared to the deviation obtained by a correlation of the VLE data with the UNIQUAC model wasimproved by nearly a factor of 3 from 0.0083 to 0.003. Similar improvements are also obtained for thepredicted temperatures and pressures for VLE, excess enthalpies, and activity coefficients at infinite di-lution.
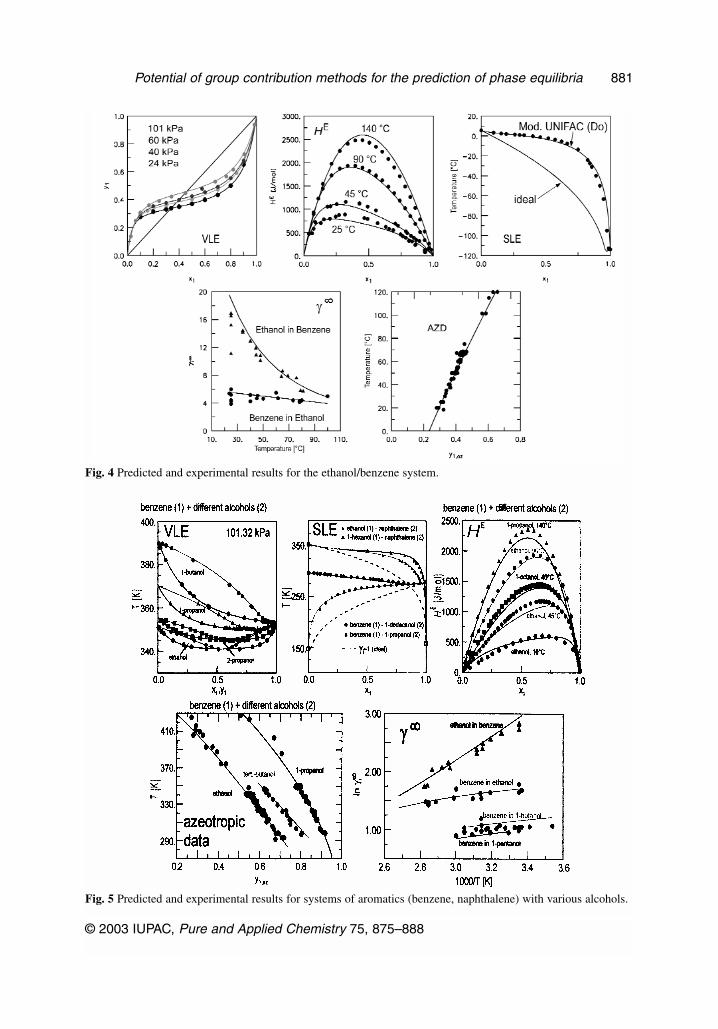
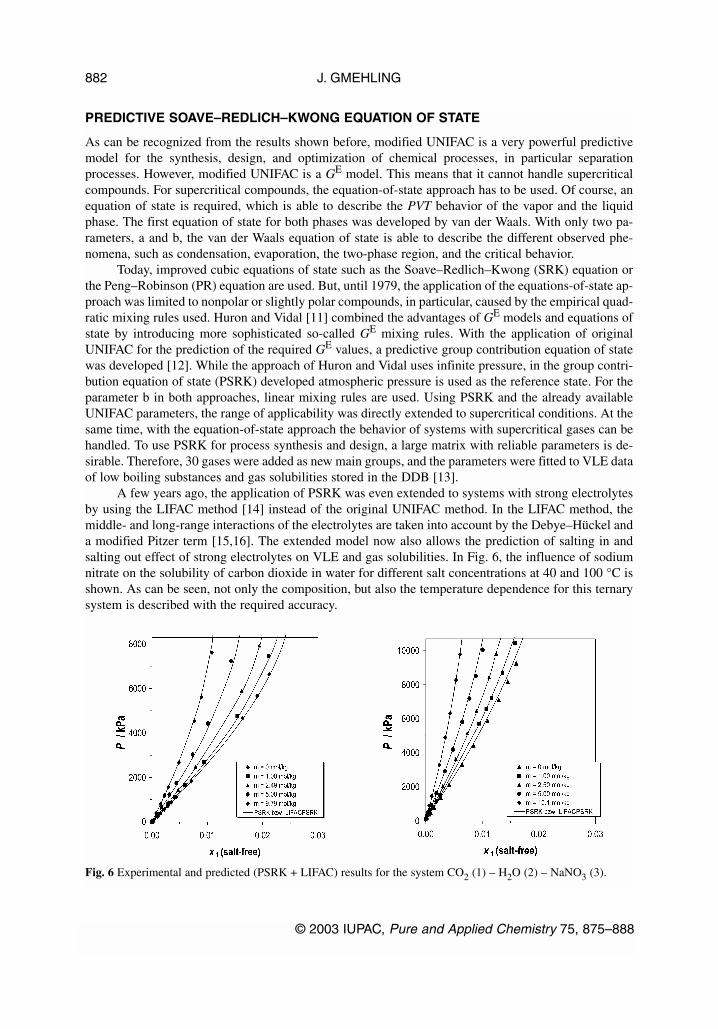
Typical results for VLE, excess enthalpies, SLE, activity coefficients at infinite dilution, andazeotropic data for systems of aromatics with alcohols are shown in Figs. 4 and 5.
Whereas Fig. 4 presents results for the ethanol/benzene system, Fig. 5 compares the predicted andexperimental results for benzene and naphthalene with various alcohols. In the case of SLE, addition-ally, the results (assuming ideal behavior) are shown by the dashed lines. The improvement when tak-ing into account the real behavior is obvious. Of course, the same group interaction parameters are ap-plied for all the predictions. As can be seen, in all cases good agreement is obtained for the differentphase equilibria and excess properties although a wide temperature range (–100 to 160 °C) is covered.This means that the correct description of the temperature dependence (excess enthalpies) ensures a safeextrapolation to low or high temperatures.
© 2003 IUPAC, Pure and Applied Chemistry 75, 875–888
Potential of group contribution methods for the prediction of phase equilibria 879
J. GMEHLING880
46 cy-C
ON
C
47 C
ON
R
48 C
ON
R2
49 H
CO
NR
50 A
CC
N
51 N
CO
52 A
CS
53 E
poxy
54 A
nhydrides
55 C
arb
onate
s
56 S
ulfone
s
57 A
CC
HO
58 A
CC
OO
H
59 A
CC
OO
60 O
CC
OH
61 C
H2S
62 Lacta
mes
63 Lacto
nes
64 P
ero
xid
es
74 A
ce
tals
75 A
CN
R2
76 A
CN
HR
New
Str
uctu
ral
Gro
ups:
510
15
20
25
30
35
40
45
50
55
65
CF
H
66
CF
Cl
67
CF
Cl 2
68
CF
H2
69
CF
ClH
2
70
CF
Cl
22
71
CF
H3
72
CF
Cl
3
73
CF
4
65 6
6 67 6
8 69 7
0 71 7
2 73
60
new
or
revis
ed
para
mete
rs f
or
refr
igera
nts 7
7 F
ura
n
1
2
3
4
5
6
7
8
9
10
11
12
13
14
15
16
17
18
19
20
21
22
23
24
25
26
27
28
29
30
31
32
33
34
35
36
37
38
39
40
41
42
43
44
45
46
47
48
49
50
51
52
53
54
55
56
57
58
59
60
61
62
63
64
74
75
76
77
1 2 3 4 5 6 7 8 9
10 11
12
13
14
15
16
17
18
19
20 21
22
23
24
25
26
27
28
29
30 31
32
33
34
35
36
37
38
39
40 41
42
43
44
45
46
CH
C=
C
AC
H
AC
CH
OH
CH
OH
H O
AC
OH
CH
CO
CH
O
CC
OO
HC
OO
CH
O
CH
NH
CH
NH
(C)3
N
AC
NH
Pyri
din
CH
CN
CO
OH
CC
l
AC
Cl
CN
O
AC
NO
CS
CH
SH
Furf
ura
l
DO
H
I Br
DM
SO
Acry
l
ClC
=C
AC
F
DM
F
CF
CO
O
CY
-CH
CY
-CH
O
HC
OO
H
CH
Cl
CY
-CO
NC
C
C
47
48
49
CO
NR
AC
SE
po
xy
50
51
52
53
54
55
56
57
58
59
C
ON
R
HC
ON
R
AC
CN
NC
O
An
hy
dri
des
Car
bon
ates
Sulf
on
es
AC
CH
O
AC
CO
OH
AC
CO
O6
0O
CC
OH
61
CH
S
62
63
Lac
tam
es
Lac
tones
64
Pero
xid
es
2
2
3
2
2 2 22
2
2
2
CC
l2 3 4
2
CC
l
CC
l
2
2 3 2
2 2
3
2
2
74
75
76
Ace
tals
AC
NR
2
AC
NH
R
77
Fura
n
65 C
FH
66 C
FC
l67 C
FC
l2
68 C
F2H
69 C
F2C
lH70 C
F2C
l2
71 C
F3H
72 C
F3C
l
73 C
F4
Fig
. 3Pr
esen
t sta
tus
of th
e m
odif
ied
UN
IFA
C m
etho
d.
Gm
ehlin
g,
J.,
Li, J
., S
chill
er,
M.,
.
, 17
8 (
Ind.
En
g.
Ch
em
. R
es
32
, 1
99
3).
pu
blish
ed
para
mete
rs I
Gm
ehlin
g,
J.,
Lo
hm
an
n,
J., J
ako
b, A
., L
i, J
., J
oh,
R.,
, 48
76
(1
Ind.
En
g.
Ch
em
. R
es.
37
, 9
98).
pu
blish
ed
para
mete
rs II
mete
rs
no
para
mete
rs
availab
lep
ub
lish
ed
para
mete
rs III
Cu
rre
ntly o
nly
ava
ilable
fo
r th
em
em
be
rs o
f th
e U
NIF
AC
-con
so
rtiu
m
Loh
man
n, J.,
Jo
h,
R.,
, 20
01
).G
me
hlin
g,
J.,
, 95
7 (
Ind.
En
g.
Ch
em
. R
es.
40
pu
blish
ed
para
mete
rs IV
Loh
man
n, J.,
,
200
1).
Ch
em
.G
me
hlin
g,
J.,
, 43
(J.
En
g.
Jpn
.3
4
pu
blish
ed
para
mete
rs V
Wittig
, R
., L
oh
man
n, J.,
Jo
h,
R.,
Ho
rstm
an
n, S
,G
me
hlin
g,
J.,
,
, 58
31 (
20
01
).In
d.
En
g.
Ch
em
. R
es.
40
pu
blish
ed
para
mete
rs V
IIW
ittig
, R
., L
oh
man
n, J.,
Gm
eh
ling,
J.,
AIC
hE
J,
su
bm
itte
d.
.
pu
blish
ed
para
mete
rs V
I
Gm
ehlin
g,
J.,
Wittig,
R.,
Lo
hm
an
n,
J., J
oh
, R
.,,
, 16
78
(2
00
2).
Ind.
En
g.
Ch
em
. R
es.
41
new
or
revis
ed
para
AIC
hE
J. 4
9, 5
30
(2
00
3)
© 2003 IUPAC, Pure and Applied Chemistry 75, 875–888
Potential of group contribution methods for the prediction of phase equilibria 881
Fig. 4 Predicted and experimental results for the ethanol/benzene system.
Fig. 5 Predicted and experimental results for systems of aromatics (benzene, naphthalene) with various alcohols.
PREDICTIVE SOAVE–REDLICH–KWONG EQUATION OF STATE
As can be recognized from the results shown before, modified UNIFAC is a very powerful predictivemodel for the synthesis, design, and optimization of chemical processes, in particular separationprocesses. However, modified UNIFAC is a GE model. This means that it cannot handle supercriticalcompounds. For supercritical compounds, the equation-of-state approach has to be used. Of course, anequation of state is required, which is able to describe the PVT behavior of the vapor and the liquidphase. The first equation of state for both phases was developed by van der Waals. With only two pa-rameters, a and b, the van der Waals equation of state is able to describe the different observed phe-nomena, such as condensation, evaporation, the two-phase region, and the critical behavior.
Today, improved cubic equations of state such as the Soave–Redlich–Kwong (SRK) equation orthe Peng–Robinson (PR) equation are used. But, until 1979, the application of the equations-of-state ap-proach was limited to nonpolar or slightly polar compounds, in particular, caused by the empirical quad-ratic mixing rules used. Huron and Vidal [11] combined the advantages of GE models and equations ofstate by introducing more sophisticated so-called GE mixing rules. With the application of originalUNIFAC for the prediction of the required GE values, a predictive group contribution equation of statewas developed [12]. While the approach of Huron and Vidal uses infinite pressure, in the group contri-bution equation of state (PSRK) developed atmospheric pressure is used as the reference state. For theparameter b in both approaches, linear mixing rules are used. Using PSRK and the already availableUNIFAC parameters, the range of applicability was directly extended to supercritical conditions. At thesame time, with the equation-of-state approach the behavior of systems with supercritical gases can behandled. To use PSRK for process synthesis and design, a large matrix with reliable parameters is de-sirable. Therefore, 30 gases were added as new main groups, and the parameters were fitted to VLE dataof low boiling substances and gas solubilities stored in the DDB [13].
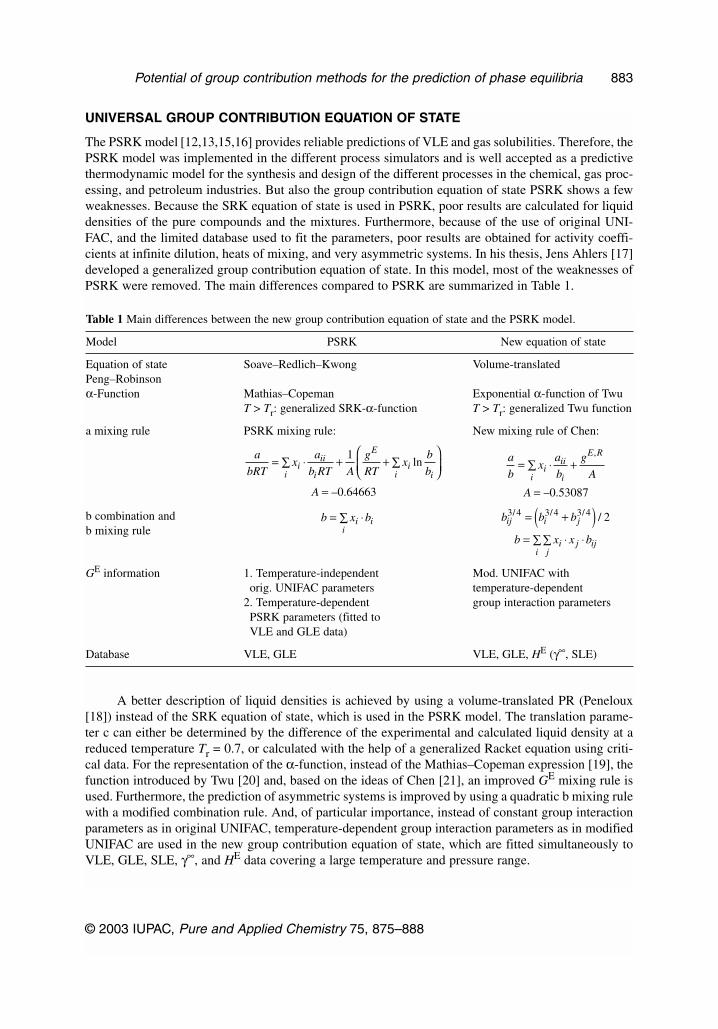
A few years ago, the application of PSRK was even extended to systems with strong electrolytesby using the LIFAC method [14] instead of the original UNIFAC method. In the LIFAC method, themiddle- and long-range interactions of the electrolytes are taken into account by the Debye–Hückel anda modified Pitzer term [15,16]. The extended model now also allows the prediction of salting in andsalting out effect of strong electrolytes on VLE and gas solubilities. In Fig. 6, the influence of sodiumnitrate on the solubility of carbon dioxide in water for different salt concentrations at 40 and 100 °C isshown. As can be seen, not only the composition, but also the temperature dependence for this ternarysystem is described with the required accuracy.
J. GMEHLING
© 2003 IUPAC, Pure and Applied Chemistry 75, 875–888
882
Fig. 6 Experimental and predicted (PSRK + LIFAC) results for the system CO2 (1) – H2O (2) – NaNO3 (3).
UNIVERSAL GROUP CONTRIBUTION EQUATION OF STATE
The PSRK model [12,13,15,16] provides reliable predictions of VLE and gas solubilities. Therefore, thePSRK model was implemented in the different process simulators and is well accepted as a predictivethermodynamic model for the synthesis and design of the different processes in the chemical, gas proc-essing, and petroleum industries. But also the group contribution equation of state PSRK shows a fewweaknesses. Because the SRK equation of state is used in PSRK, poor results are calculated for liquiddensities of the pure compounds and the mixtures. Furthermore, because of the use of original UNI-FAC, and the limited database used to fit the parameters, poor results are obtained for activity coeffi-cients at infinite dilution, heats of mixing, and very asymmetric systems. In his thesis, Jens Ahlers [17]developed a generalized group contribution equation of state. In this model, most of the weaknesses ofPSRK were removed. The main differences compared to PSRK are summarized in Table 1.
A better description of liquid densities is achieved by using a volume-translated PR (Peneloux[18]) instead of the SRK equation of state, which is used in the PSRK model. The translation parame-ter c can either be determined by the difference of the experimental and calculated liquid density at areduced temperature Tr = 0.7, or calculated with the help of a generalized Racket equation using criti-cal data. For the representation of the α-function, instead of the Mathias–Copeman expression [19], thefunction introduced by Twu [20] and, based on the ideas of Chen [21], an improved GE mixing rule isused. Furthermore, the prediction of asymmetric systems is improved by using a quadratic b mixing rulewith a modified combination rule. And, of particular importance, instead of constant group interactionparameters as in original UNIFAC, temperature-dependent group interaction parameters as in modifiedUNIFAC are used in the new group contribution equation of state, which are fitted simultaneously toVLE, GLE, SLE, γ∞, and HE data covering a large temperature and pressure range.
© 2003 IUPAC, Pure and Applied Chemistry 75, 875–888
Potential of group contribution methods for the prediction of phase equilibria 883
Table 1 Main differences between the new group contribution equation of state and the PSRK model.
Model PSRK New equation of state
Equation of state Soave–Redlich–Kwong Volume-translatedPeng–Robinsonα-Function Mathias–Copeman Exponential α-function of Twu
T > Tr: generalized SRK-α-function T > Tr: generalized Twu function
a mixing rule PSRK mixing rule: New mixing rule of Chen:
b combination andb mixing rule
GE information 1. Temperature-independent Mod. UNIFAC withorig. UNIFAC parameters temperature-dependent
2. Temperature-dependent group interaction parametersPSRK parameters (fitted toVLE and GLE data)
Database VLE, GLE VLE, GLE, HE (γ∞, SLE)
a
bRTx
a
b RT A
g
RTx
b
b
A
ii
ii
i
E
ii i
= ∑ ⋅ + + ∑
=
1
0 64663
ln
– .
a
bx
a
b
g
A
A
ii
ii
i
E R= ∑ ⋅ +
=
,
– .0 53087
b x bii
i= ∑ ⋅ b b b
b x x b
ij i j
iji
j ij
3 4 3 4 3 4 2/ / / /= +( )= ∑∑ ⋅ ⋅
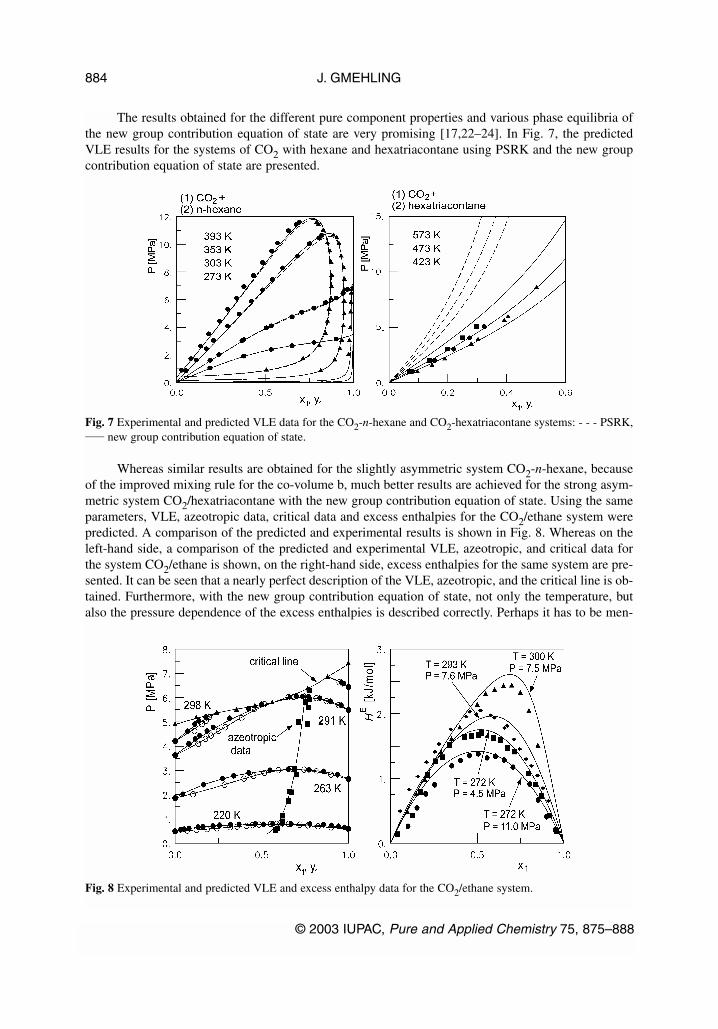
The results obtained for the different pure component properties and various phase equilibria ofthe new group contribution equation of state are very promising [17,22–24]. In Fig. 7, the predictedVLE results for the systems of CO2 with hexane and hexatriacontane using PSRK and the new groupcontribution equation of state are presented.
Whereas similar results are obtained for the slightly asymmetric system CO2-n-hexane, becauseof the improved mixing rule for the co-volume b, much better results are achieved for the strong asym-metric system CO2/hexatriacontane with the new group contribution equation of state. Using the sameparameters, VLE, azeotropic data, critical data and excess enthalpies for the CO2/ethane system werepredicted. A comparison of the predicted and experimental results is shown in Fig. 8. Whereas on theleft-hand side, a comparison of the predicted and experimental VLE, azeotropic, and critical data forthe system CO2/ethane is shown, on the right-hand side, excess enthalpies for the same system are pre-sented. It can be seen that a nearly perfect description of the VLE, azeotropic, and the critical line is ob-tained. Furthermore, with the new group contribution equation of state, not only the temperature, butalso the pressure dependence of the excess enthalpies is described correctly. Perhaps it has to be men-
J. GMEHLING
© 2003 IUPAC, Pure and Applied Chemistry 75, 875–888
884
Fig. 8 Experimental and predicted VLE and excess enthalpy data for the CO2/ethane system.
Fig. 7 Experimental and predicted VLE data for the CO2-n-hexane and CO2-hexatriacontane systems: - - - PSRK,____ new group contribution equation of state.
tioned again that, for all the predictions (VLE, azeotropic data, critical line, HE) shown in Figs. 7–8, thesame parameters were used to describe the interactions between CO2 and alkanes.
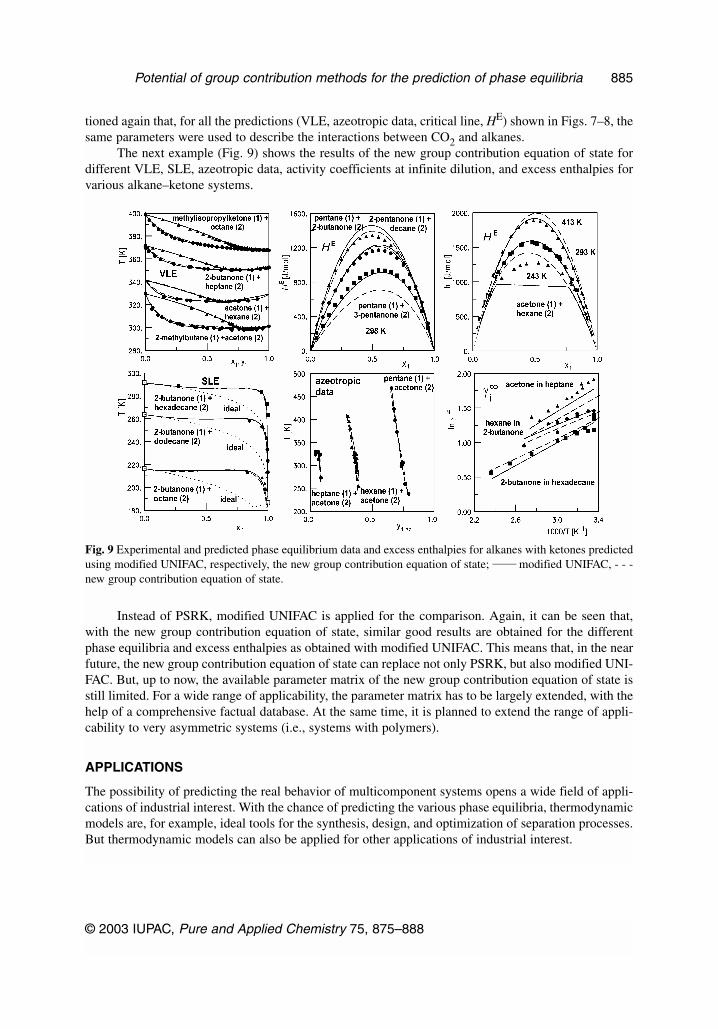
The next example (Fig. 9) shows the results of the new group contribution equation of state fordifferent VLE, SLE, azeotropic data, activity coefficients at infinite dilution, and excess enthalpies forvarious alkane–ketone systems.
Instead of PSRK, modified UNIFAC is applied for the comparison. Again, it can be seen that,with the new group contribution equation of state, similar good results are obtained for the differentphase equilibria and excess enthalpies as obtained with modified UNIFAC. This means that, in the nearfuture, the new group contribution equation of state can replace not only PSRK, but also modified UNI-FAC. But, up to now, the available parameter matrix of the new group contribution equation of state isstill limited. For a wide range of applicability, the parameter matrix has to be largely extended, with thehelp of a comprehensive factual database. At the same time, it is planned to extend the range of appli-cability to very asymmetric systems (i.e., systems with polymers).
APPLICATIONS
The possibility of predicting the real behavior of multicomponent systems opens a wide field of appli-cations of industrial interest. With the chance of predicting the various phase equilibria, thermodynamicmodels are, for example, ideal tools for the synthesis, design, and optimization of separation processes.But thermodynamic models can also be applied for other applications of industrial interest.
© 2003 IUPAC, Pure and Applied Chemistry 75, 875–888
Potential of group contribution methods for the prediction of phase equilibria 885
Fig. 9 Experimental and predicted phase equilibrium data and excess enthalpies for alkanes with ketones predictedusing modified UNIFAC, respectively, the new group contribution equation of state; _____ modified UNIFAC, - - -new group contribution equation of state.
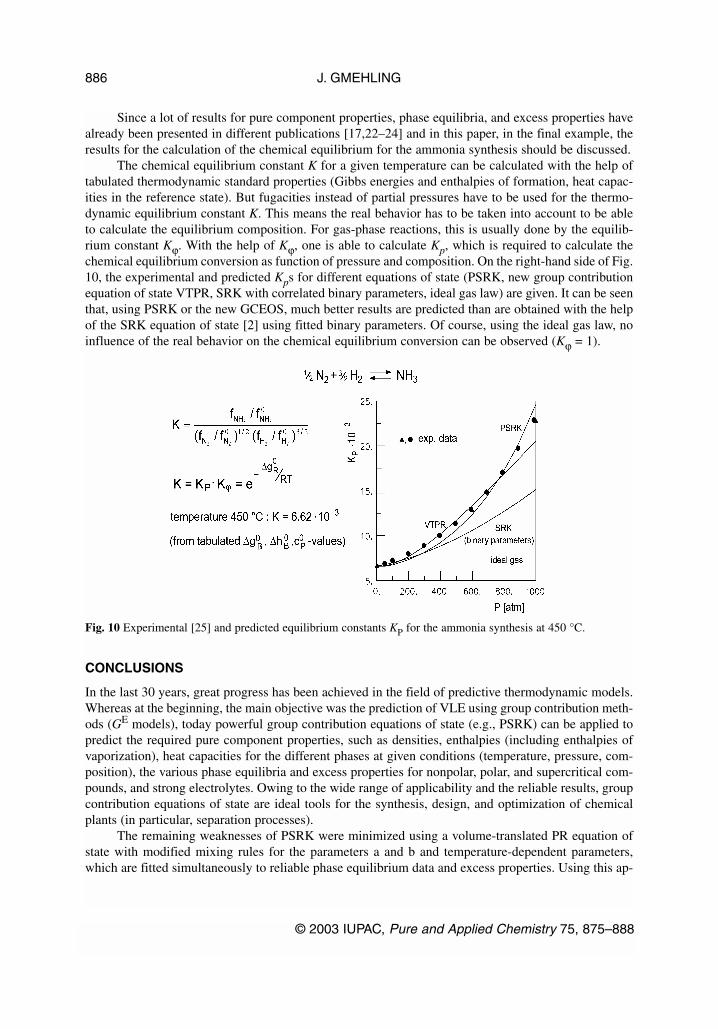
Since a lot of results for pure component properties, phase equilibria, and excess properties havealready been presented in different publications [17,22–24] and in this paper, in the final example, theresults for the calculation of the chemical equilibrium for the ammonia synthesis should be discussed.
The chemical equilibrium constant K for a given temperature can be calculated with the help oftabulated thermodynamic standard properties (Gibbs energies and enthalpies of formation, heat capac-ities in the reference state). But fugacities instead of partial pressures have to be used for the thermo-dynamic equilibrium constant K. This means the real behavior has to be taken into account to be ableto calculate the equilibrium composition. For gas-phase reactions, this is usually done by the equilib-rium constant Kϕ. With the help of Kϕ, one is able to calculate Kp, which is required to calculate thechemical equilibrium conversion as function of pressure and composition. On the right-hand side of Fig.10, the experimental and predicted Kps for different equations of state (PSRK, new group contributionequation of state VTPR, SRK with correlated binary parameters, ideal gas law) are given. It can be seenthat, using PSRK or the new GCEOS, much better results are predicted than are obtained with the helpof the SRK equation of state [2] using fitted binary parameters. Of course, using the ideal gas law, noinfluence of the real behavior on the chemical equilibrium conversion can be observed (Kϕ = 1).
CONCLUSIONS
In the last 30 years, great progress has been achieved in the field of predictive thermodynamic models.Whereas at the beginning, the main objective was the prediction of VLE using group contribution meth-ods (GE models), today powerful group contribution equations of state (e.g., PSRK) can be applied topredict the required pure component properties, such as densities, enthalpies (including enthalpies ofvaporization), heat capacities for the different phases at given conditions (temperature, pressure, com-position), the various phase equilibria and excess properties for nonpolar, polar, and supercritical com-pounds, and strong electrolytes. Owing to the wide range of applicability and the reliable results, groupcontribution equations of state are ideal tools for the synthesis, design, and optimization of chemicalplants (in particular, separation processes).
The remaining weaknesses of PSRK were minimized using a volume-translated PR equation ofstate with modified mixing rules for the parameters a and b and temperature-dependent parameters,which are fitted simultaneously to reliable phase equilibrium data and excess properties. Using this ap-
J. GMEHLING
© 2003 IUPAC, Pure and Applied Chemistry 75, 875–888
886
Fig. 10 Experimental [25] and predicted equilibrium constants KP for the ammonia synthesis at 450 °C.
proach, reliable liquid densities for the pure compounds and mixtures are obtained, and the model canbe applied reliably to very asymmetric systems.
From all the promising results obtained up to now, it can be concluded that the new group con-tribution equation of state is an important step in the right direction. Therefore, it can be expected thatmodels like modified UNIFAC or PSRK can be replaced completely by the new group contributionequation of state. But up to now, the range of applicability is limited, since the matrix of the new groupcontribution equation of state is quite small. Therefore, in a planned research project, the further devel-opment of the new group contribution equation of state and the extension of the existing parameter tablewith the help of the DDB is planned. Furthermore, the effects of strong electrolytes (similar as in PSRK)should be taken into account, and the results for polymer systems should be carefully examined.
LIST OF SYMBOLS AND ABBREVIATIONS
a, b parameters in equations of stateCp heat capacity at given pressurefi fugacity of component iG Gibbs energyGLE gas–liquid equilibriumH enthalpyLLE liquid–liquid equilibriumP total pressurePi
s vapor pressureSLE solid–liquid equilibriumVLE vapor–liquid equilibriumxi mole fraction of component i in the liquid phaseyi mole fraction of component i in the vapor phase
Greek symbols
α,β different phasesµi chemical potential of component iγi activity coefficient of component iϕi fugacity coefficient of component i
Superscripts
L liquid phaseV vapor phaseE excess property∞ at infinite dilution
REFERENCES
1. J. P. Novak, J. Matous, J. Pick. Liquid–Liquid Equilibria, Elsevier, Amsterdam (1987).2. J. Gmehling and B. Kolbe. Thermodynamik, VCH-Verlag, Weinheim (1992).3. <www.ddbst.de>4. G. Scatchard. Chem. Rev. 8, 321 (1931); J. Hildebrand and S. E. Wood. J. Chem. Phys. 1, 817
(1933).5. E. L. Derr and C. H. Deal. Proceedings Int. Dist. Symp. Brighton (1969).6. Aa. Fredenslund, R. L. Jones, J. M. Prausnitz. AIChE J. 21, 116 (1975).
© 2003 IUPAC, Pure and Applied Chemistry 75, 875–888
Potential of group contribution methods for the prediction of phase equilibria 887
7. Aa. Fredenslund, J. Gmehling, P. Rasmussen. Vapor–Liquid Equilibria Using UNIFAC—A GroupContribution Method, Elsevier, Amsterdam (1977).
8. U. Weidlich and J. Gmehling. Ind. Eng. Chem. Res. 26, 1372 (1987).9. J. Gmehling, R. Wittig, J. Lohmann, R. Joh. Ind. Eng. Chem. Res. 41, 1678–1688 (2002).
10. <www.uni-oldenburg.de/tchemie/consortium>11. M. J. Huron and J. Vidal. Fluid Phase Equilib. 3, 255–271 (1979).12. Th. Holderbaum and J. Gmehling. Fluid Phase Equilib. 70, 251 (1991).13. S. Horstmann, K. Fischer, J. Gmehling. Fluid Phase Equilib. 167, 173–186 (2000).14. W. Yan, M. Topphoff, C. Rose, J. Gmehling. Fluid Phase Equilib. 162, 97–113 (1999).15. Jiding Li, M. Topphoff, K. Fischer, J. Gmehling. Ind. Eng. Chem. Res. 40, 3703–3710 (2001).16. J. Kiepe, S. Horstmann, K. Fischer, J. Gmehling. Ind. Eng. Chem. Res. 41, 4393–4398 (2002).17. J. Ahlers. Ph.D. thesis, Universität Oldenburg (2003).18. A. Peneloux, E. Rauzy, R. Freze. Fluid Phase Equilib. 8, 7–23 (1982).19. P. M. Mathias and T. W. Copeman. Fluid Phase Equilib. 13, 91–108 (1983). 20. C. H. Twu, J. E. Coon, J. R. Cunningham. Fluid Phase Equilib. 105, 49 (1995).21. J. Chen, K. Fischer, J. Gmehling. Fluid Phase Equilib. 200, 411–429 (2002).22. J. Ahlers and J. Gmehling. Fluid Phase Equilib. 191, 177–188 (2001).23. J. Ahlers and J. Gmehling. Ind. Eng. Chem. Res. 41, 3489–3498 (2002).24. J. Ahlers and J. Gmehling. Ind. Eng. Chem. Res. 41, 5890–5899 (2002).25. B. F. Dodge. Chemical Engineering Thermodynamics, McGraw-Hill, New York (1944).
J. GMEHLING
© 2003 IUPAC, Pure and Applied Chemistry 75, 875–888
888