Embed Size (px)
Citation preview
Counted and Visible:Global Conference on the Measurement of Gender
and Intersecting InequalitiesFebruary 26-27, 2020
New York, USA
Potential of Combining Multiple Data Sources for Enhanced Compilation of
Gender Statistics
Kaushal Joshi / Arturo Martinez Jr.
Principal Statistician / Statistician
Statistics and Data Innovation Unit
Economic Research and Regional Cooperation Department
Asian Development Bank
Outline of Presentation
▪ Why Should We Combine Multiple Data Sources?
▪ Different Statistical Methods of Multiple Data Sources
▪ Combining Multiple Data Sources to Address Gender Data Gaps
▪ In the age of information technology, users (including policymakers) need access to continuous flow of information to make decisions
▪ Conventional and innovative data sources are complementary
Conventional data sources follow statistically consistent concepts, definitions, and standards, but are typically costly to collect, analyze, and disseminate. On the other hand, innovative data sources produce (almost) real time information, and have typically wide coverage, but may not have clear target populations and may not necessarily follow ‘established statistical standards’
Why Should We Combine Multiple Data Sources?
Why Should We Combine Multiple Data Sources?
Benefits of Combining Survey Data with
Other Data Sources
▪ Assist in the evaluation of survey data quality by using comparisons with aggregate estimates, appropriately adjusted for differences in population universes and concepts, and by exact matches of survey and administrative records
▪ Provide control totals for adjusting survey weights for coverage
errors
▪ Provide supplemental sampling frames for use in a multiple frame
design
▪ Provide additional information to append to match survey records
to enhance the relevance and usefulness of the data
▪ Provide covariates for model-based estimates for smaller
geographic areas than what the survey can support directly
▪ Improve models for imputations for missing data in survey records
Source: Federal Statistics, Multiple Data Sources, and Privacy Protection
Different Statistical Methods for Combining Multiple Data Sources
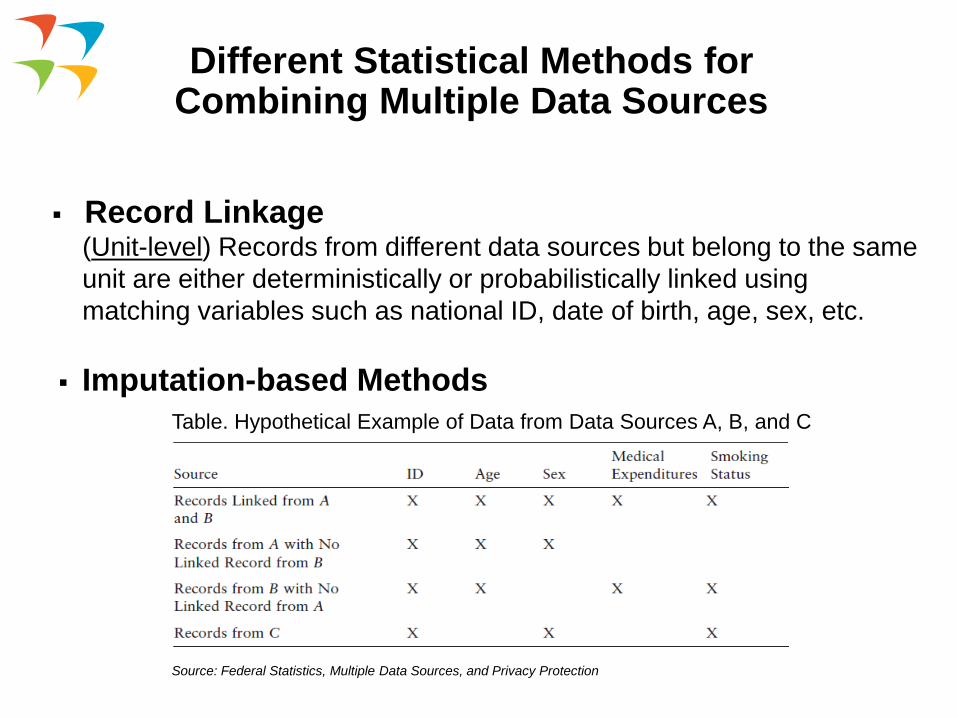
▪ Record Linkage(Unit-level) Records from different data sources but belong to the same
unit are either deterministically or probabilistically linked using
matching variables such as national ID, date of birth, age, sex, etc.
▪ Imputation-based Methods
Table. Hypothetical Example of Data from Data Sources A, B, and C
Source: Federal Statistics, Multiple Data Sources, and Privacy Protection
Different Statistical Methods for Combining Multiple Data Sources
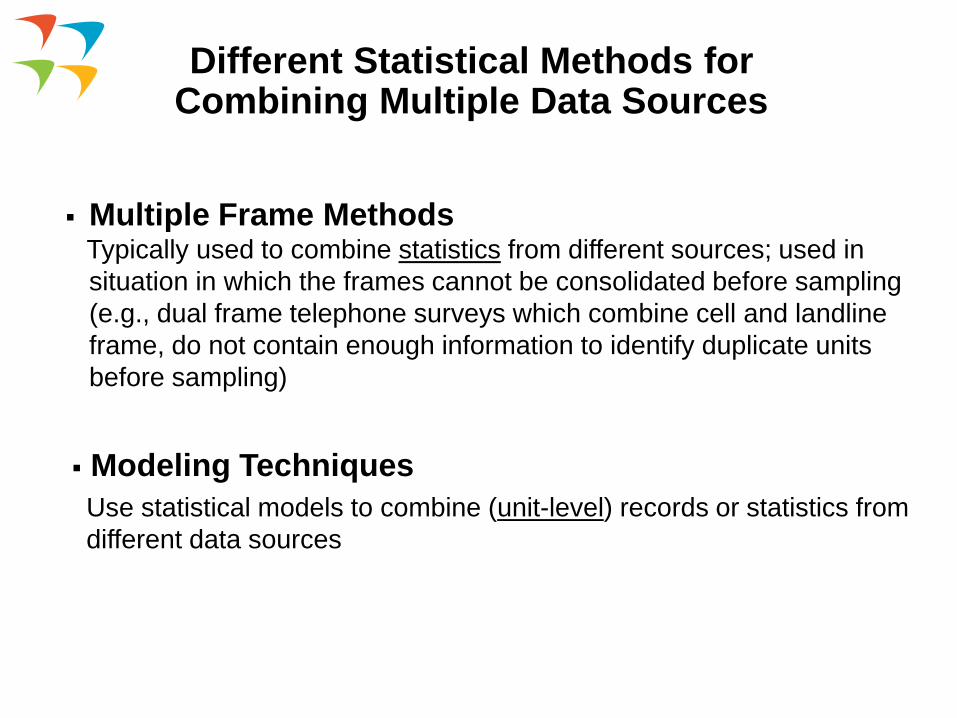
▪ Modeling Techniques
Use statistical models to combine (unit-level) records or statistics from
different data sources
▪ Multiple Frame MethodsTypically used to combine statistics from different sources; used in
situation in which the frames cannot be consolidated before sampling
(e.g., dual frame telephone surveys which combine cell and landline
frame, do not contain enough information to identify duplicate units
before sampling)
Examples of Combining Traditional and Innovative Data Sources for Enhanced Compilation of
Development Statistics
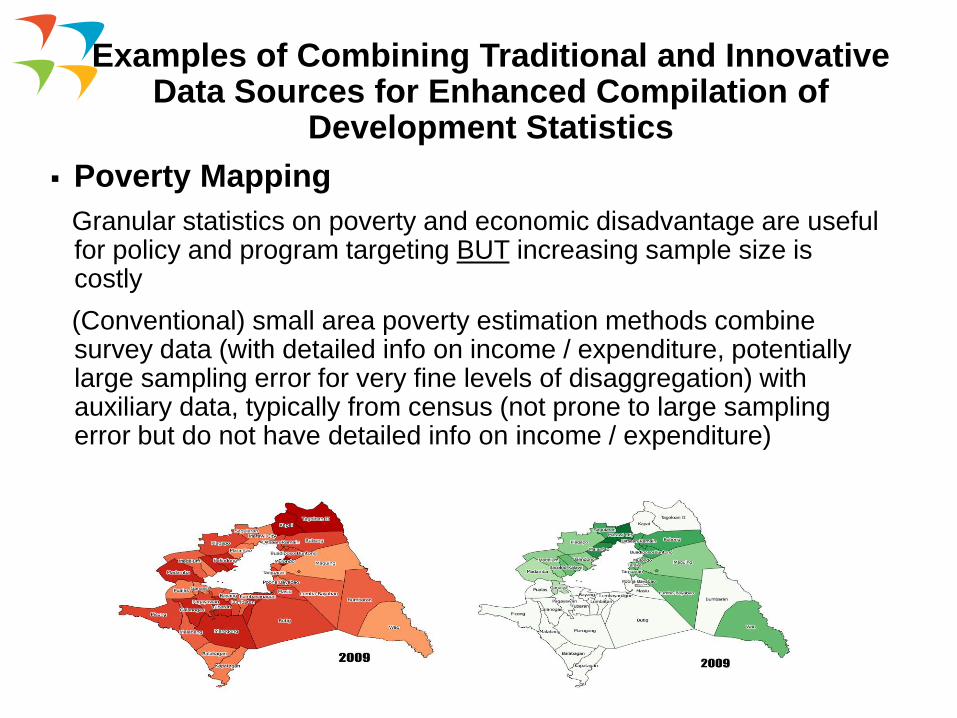
▪ Poverty Mapping
Granular statistics on poverty and economic disadvantage are useful for policy and program targeting BUT increasing sample size is costly
(Conventional) small area poverty estimation methods combine survey data (with detailed info on income / expenditure, potentially large sampling error for very fine levels of disaggregation) with auxiliary data, typically from census (not prone to large sampling error but do not have detailed info on income / expenditure)
Combining Survey and Census Data for Poverty Mapping
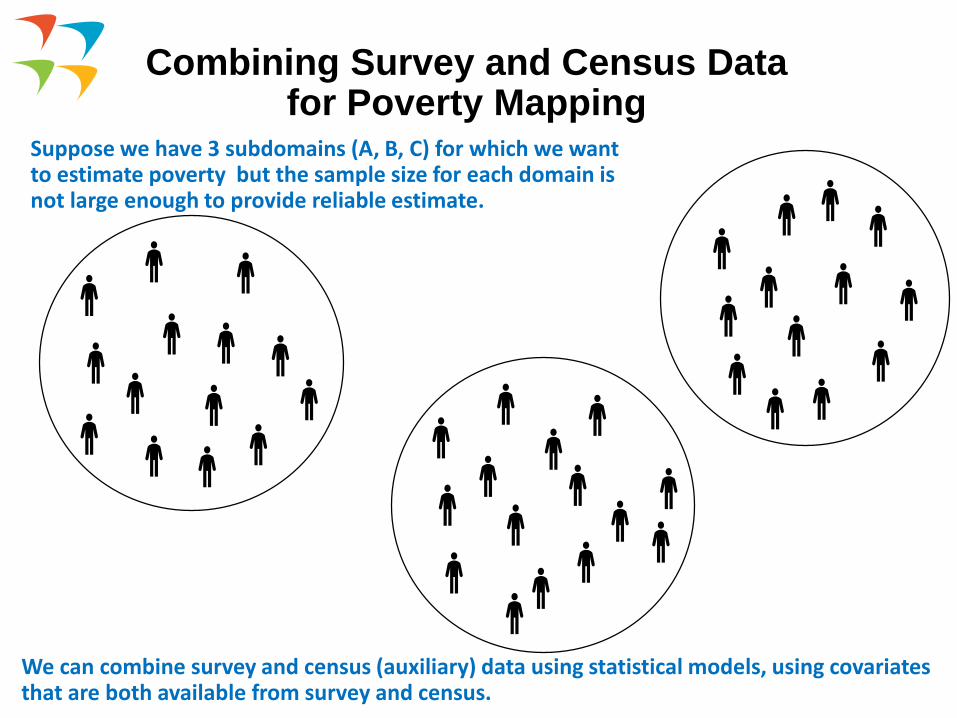
Suppose we have 3 subdomains (A, B, C) for which we want to estimate poverty but the sample size for each domain is not large enough to provide reliable estimate.
We can combine survey and census (auxiliary) data using statistical models, using covariates that are both available from survey and census.
Combining Survey and Census Data for Poverty Mapping
^
^^^
^ ^
^ ^ ^ ^ ^ ^ ^^^
^
^
^
^
^
^
^
^
^
^^^^ ^
^
^
^
^
^^
^
^
^
^^
^ ^
^
^^
^^
^^
^ ^
^
^
^
^^^
^
^^^
^ ^
^ ^ ^ ^ ^ ^ ^^^
^
^
^
^
^
^
^
^
^
^^^^ ^
^
^
^
^
^^
^
^
^
^^
^ ^
^
^^
^^
^^
^ ^
^
^
^
^^^
^
^^^
^ ^
^ ^ ^ ^ ^ ^ ^^^
^
^
^
^
^
^
^
^
^
^^^^ ^
^
^
^
^
^^
^
^
^
^^
^ ^
^
^^
^^
^^
^ ^
^
^
^
^^^
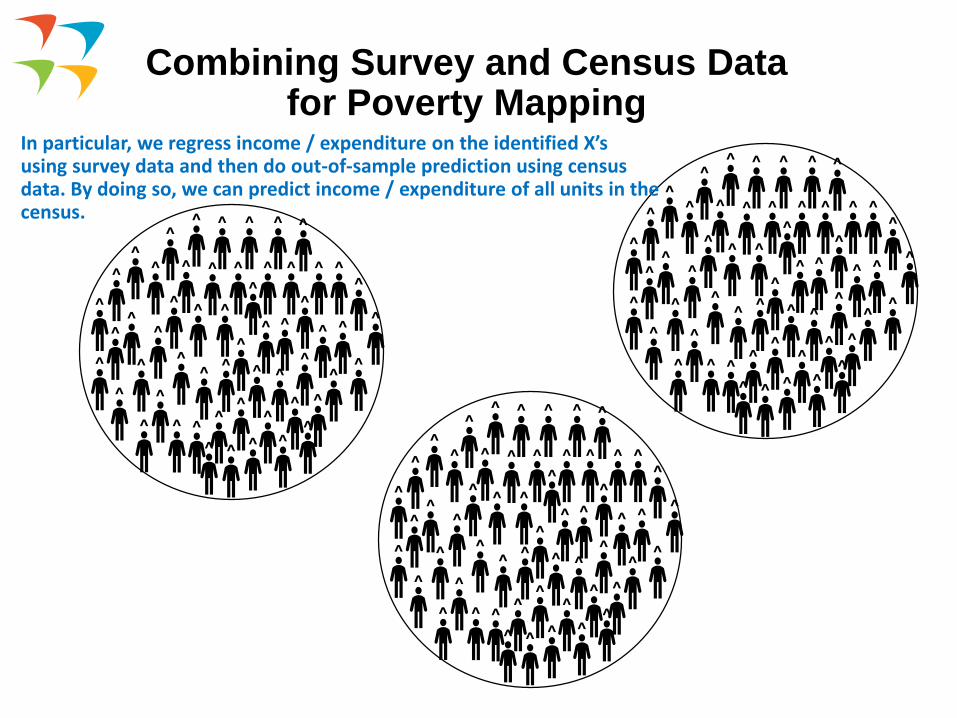
In particular, we regress income / expenditure on the identified X’s using survey data and then do out-of-sample prediction using census data. By doing so, we can predict income / expenditure of all units in the census.
Combining Survey and Census Data for Poverty Mapping
▪ Issues with conventional poverty mapping method
Requires survey and census data which are not regularly collected -> improved granularity but not necessarily timeliness
Impaired adequacy of the econometric model used to ‘link’ the survey and census data when the survey and census were conducted far apart
▪ Can we address these issues by combining information from satellite imagery?
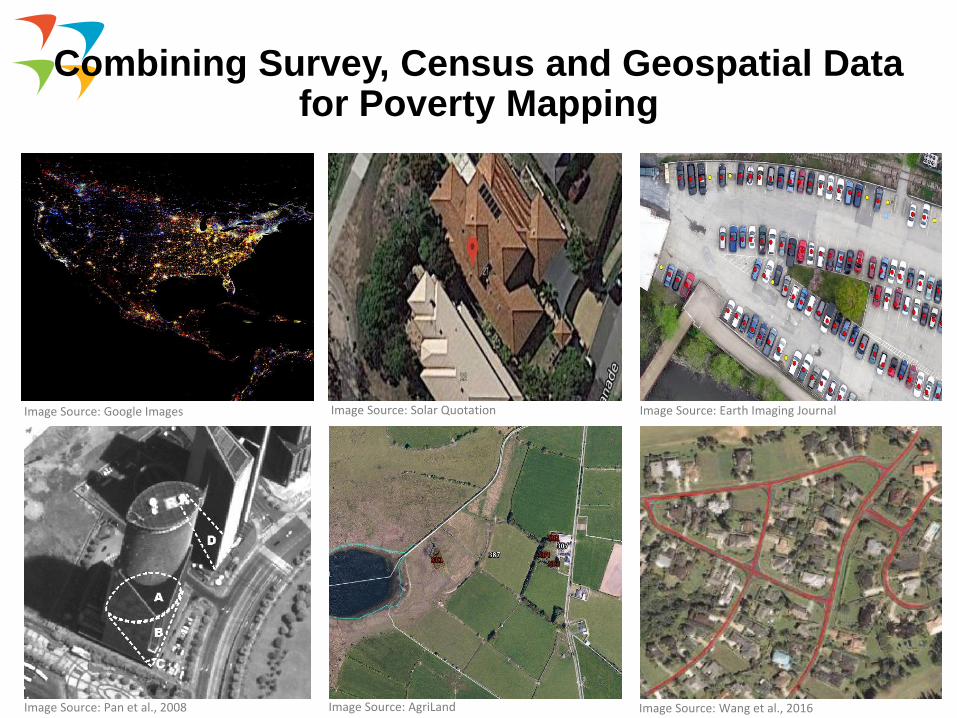
Combining Survey, Census and Geospatial Data for Poverty Mapping
Image Source: Earth Imaging JournalImage Source: Solar Quotation
Image Source: Pan et al., 2008 Image Source: Wang et al., 2016Image Source: AgriLand
Image Source: Google Images
Other Applications of Small Area Estimation
▪ The application of SAE is not limited to providing
geographically disaggregated estimates of poverty only.Numerous studies have used SAE to facilitate spatial and non-spatial
disaggregation of employment / labor, health, education outcomes, many
of which are relevant for examination of gender (in)equality
▪ For example, satellite imagery and machine learning techniques can be used to extract geospatial variables like access to roads, etc.
Integrating these info into the SAE framework, the geospatial data can be correlated with well-being indicators like literacy / health outcomes that are useful for inferring patterns of social health phenomena that are particularly relevant for women
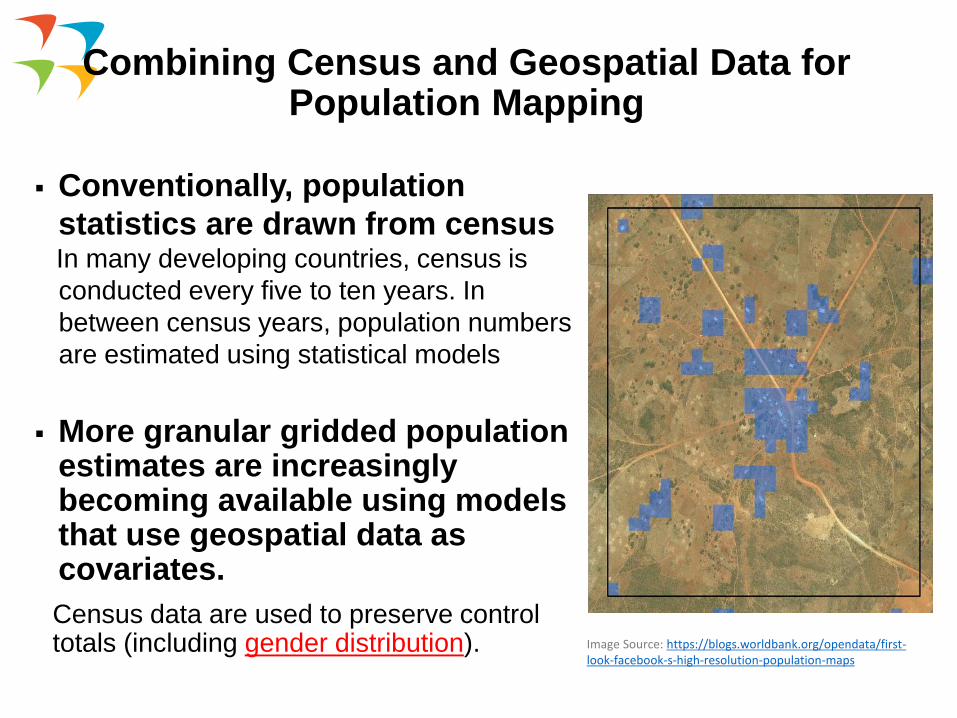
Combining Census and Geospatial Data for Population Mapping
▪ Conventionally, population
statistics are drawn from census In many developing countries, census is
conducted every five to ten years. In
between census years, population numbers
are estimated using statistical models
▪ More granular gridded population estimates are increasingly becoming available using models that use geospatial data as covariates.
Census data are used to preserve control totals (including gender distribution). Image Source: https://blogs.worldbank.org/opendata/first-
look-facebook-s-high-resolution-population-maps
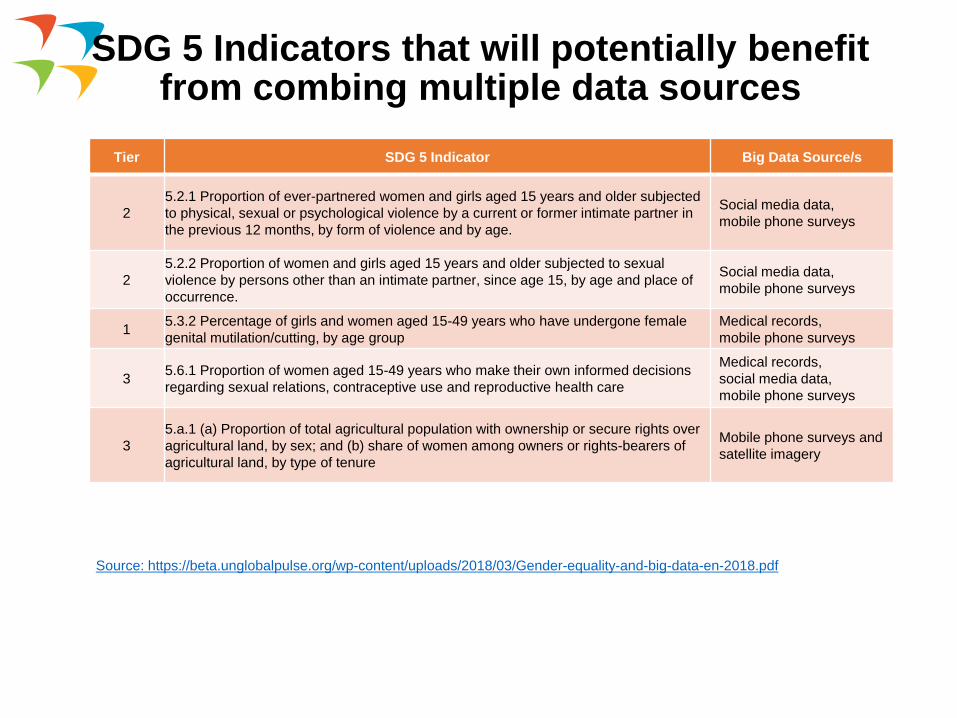
SDG 5 Indicators that will potentially benefit from combing multiple data sources
Tier SDG 5 Indicator Big Data Source/s
2
5.2.1 Proportion of ever-partnered women and girls aged 15 years and older subjected
to physical, sexual or psychological violence by a current or former intimate partner in
the previous 12 months, by form of violence and by age.
Social media data,
mobile phone surveys
2
5.2.2 Proportion of women and girls aged 15 years and older subjected to sexual
violence by persons other than an intimate partner, since age 15, by age and place of
occurrence.
Social media data,
mobile phone surveys
15.3.2 Percentage of girls and women aged 15-49 years who have undergone female
genital mutilation/cutting, by age group
Medical records,
mobile phone surveys
35.6.1 Proportion of women aged 15-49 years who make their own informed decisions
regarding sexual relations, contraceptive use and reproductive health care
Medical records,
social media data,
mobile phone surveys
3
5.a.1 (a) Proportion of total agricultural population with ownership or secure rights over
agricultural land, by sex; and (b) share of women among owners or rights-bearers of
agricultural land, by type of tenure
Mobile phone surveys and
satellite imagery
Source: https://beta.unglobalpulse.org/wp-content/uploads/2018/03/Gender-equality-and-big-data-en-2018.pdf
Combining Multiple Cross-Sectional Surveys
▪ Using modeling techniques, we can combine multiple
cross-sectional surveys to estimate indicators that
typically require longitudinal or panel dataTopics like poverty dynamics and economic mobility typically require
panel data which are very costly to collect
▪ By combining multiple cross-sectional surveys, we can answer gender-related inquiries like why female-headed households have higher / lower risk of being trapped below poverty line, does labor mobility improve women’s employment outcomes, etc.
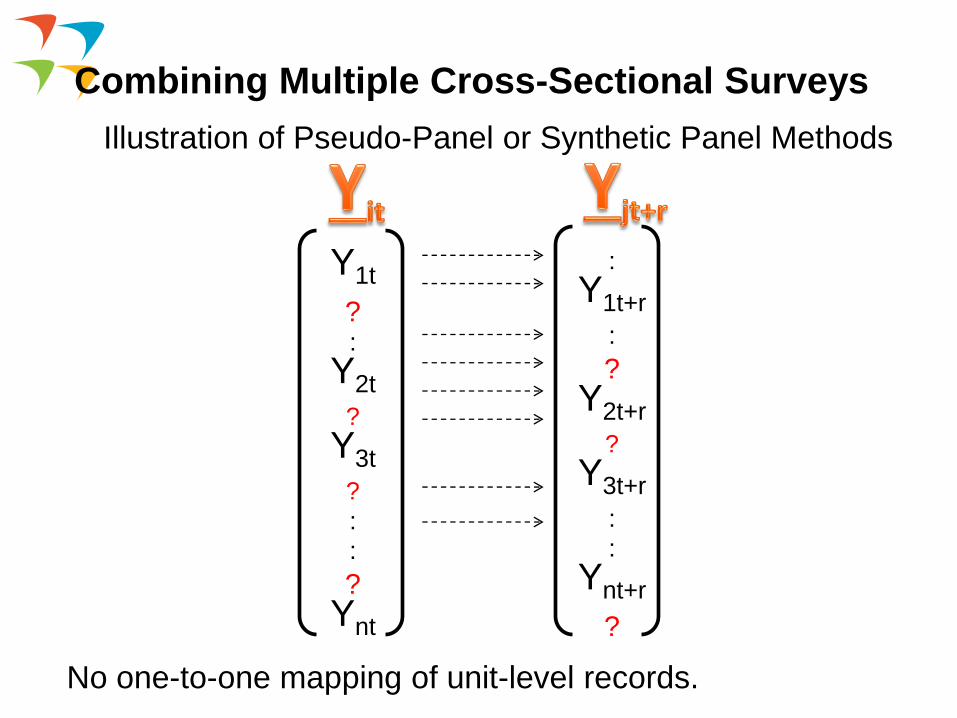
Combining Multiple Cross-Sectional Surveys
Illustration of Pseudo-Panel or Synthetic Panel Methods
Y1t
?:
Y2t
?
Y3t
?
:
:
?Ynt
:
Y1t+r
:
?Y2t+r
?
Y3t+r
:
:
Ynt+r
?
No one-to-one mapping of unit-level records.
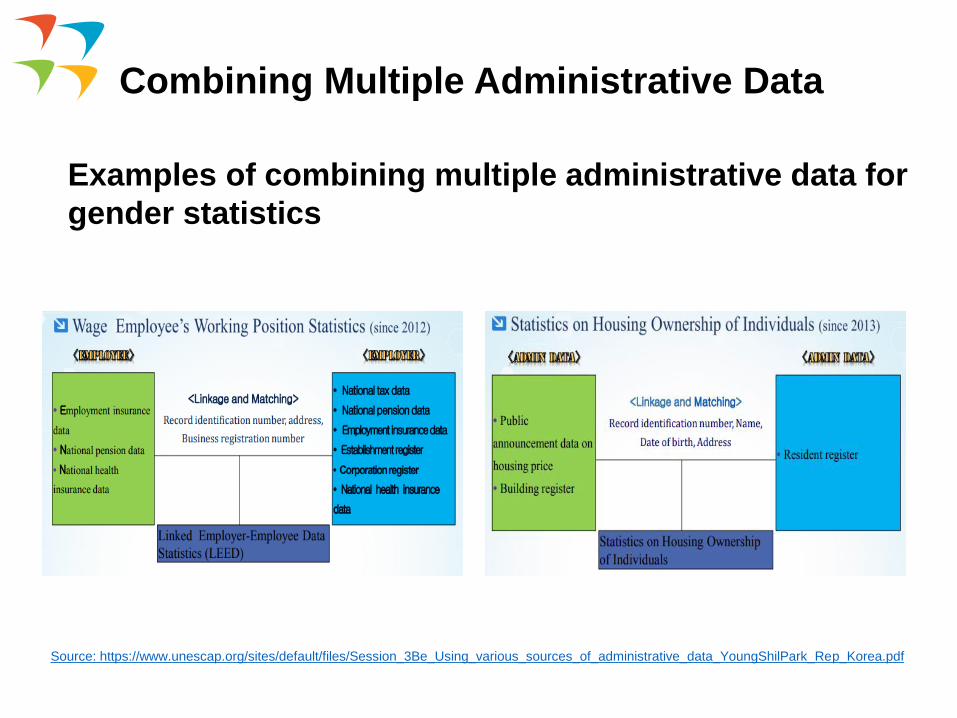
Combining Multiple Administrative Data
Examples of combining multiple administrative data for
gender statistics
Source: https://www.unescap.org/sites/default/files/Session_3Be_Using_various_sources_of_administrative_data_YoungShilPark_Rep_Korea.pdf
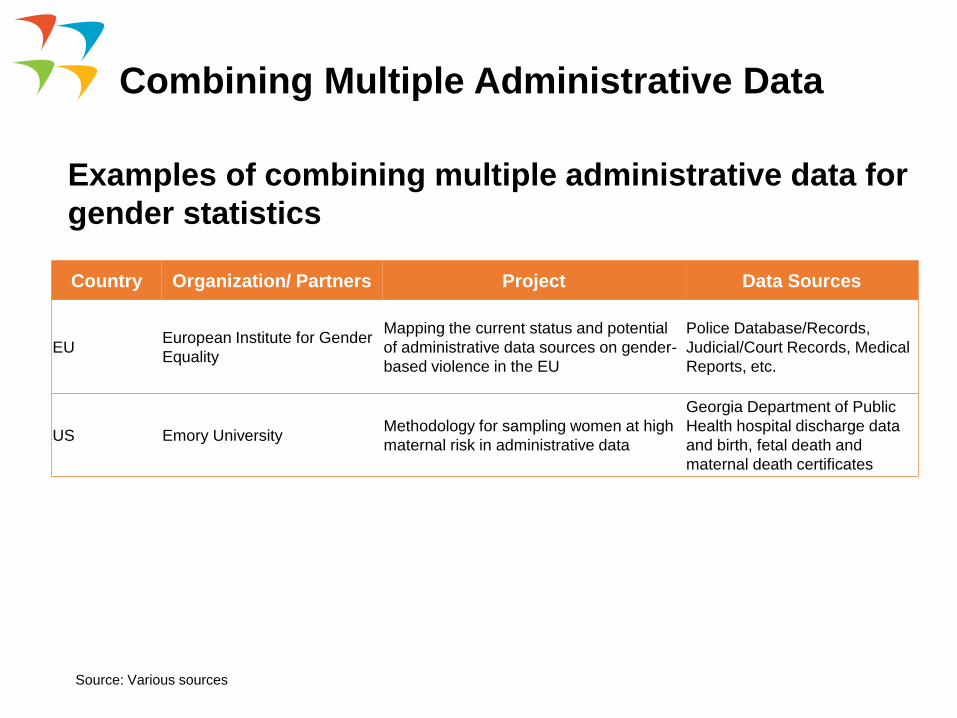
Combining Multiple Administrative Data
Examples of combining multiple administrative data for
gender statistics
Country Organization/ Partners Project Data Sources
EUEuropean Institute for Gender
Equality
Mapping the current status and potential
of administrative data sources on gender-
based violence in the EU
Police Database/Records,
Judicial/Court Records, Medical
Reports, etc.
US Emory UniversityMethodology for sampling women at high
maternal risk in administrative data
Georgia Department of Public
Health hospital discharge data
and birth, fetal death and
maternal death certificates
Source: Various sources
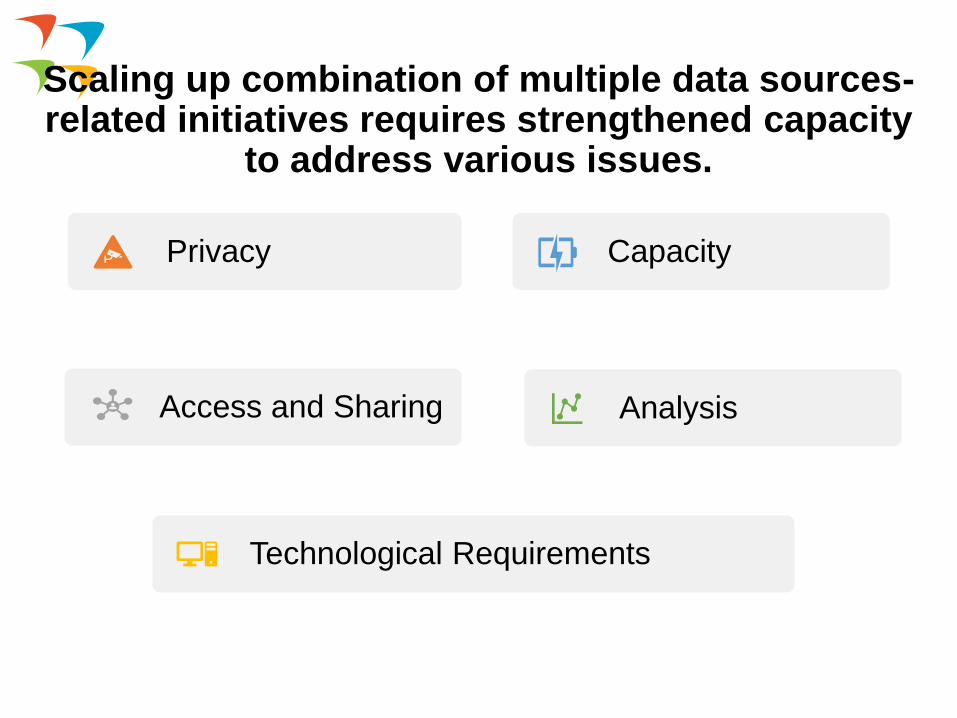
Scaling up combination of multiple data sources-related initiatives requires strengthened capacity
to address various issues.
Privacy
Technological Requirements
Capacity
Access and Sharing Analysis
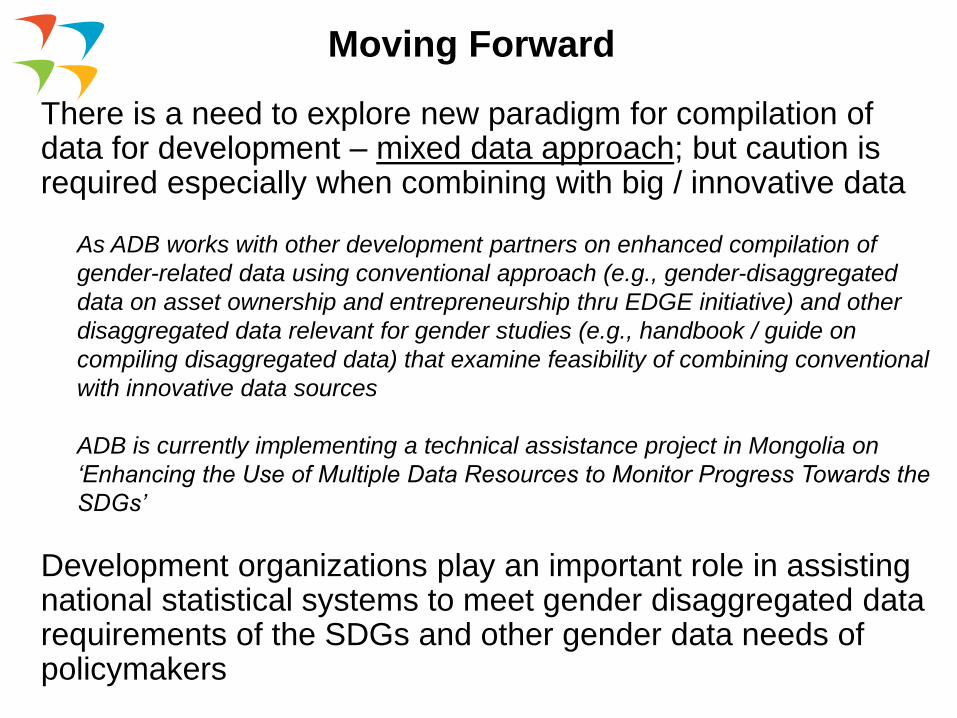
Moving Forward
There is a need to explore new paradigm for compilation of data for development – mixed data approach; but caution is required especially when combining with big / innovative data
As ADB works with other development partners on enhanced compilation of
gender-related data using conventional approach (e.g., gender-disaggregated
data on asset ownership and entrepreneurship thru EDGE initiative) and other
disaggregated data relevant for gender studies (e.g., handbook / guide on
compiling disaggregated data) that examine feasibility of combining conventional
with innovative data sources
ADB is currently implementing a technical assistance project in Mongolia on
‘Enhancing the Use of Multiple Data Resources to Monitor Progress Towards the
SDGs’
Development organizations play an important role in assisting national statistical systems to meet gender disaggregated data requirements of the SDGs and other gender data needs of policymakers
Knowledge Products of ADB’s Statistics and Data
Innovation Unit

ERCD Knowledge Products
Key Indicators for Asia and the Pacific 2019In developing Asia, the number of people living in extreme
poverty declined from 1.1 billion in 2002 to 264 million in
2015. The vital data within Key Indicators are now accessible
in a digitized format, with the new Key Indicators Database.
ERCD Knowledge Products
The CAPI Effect: Boosting Survey Data through Mobile Technology
This report discusses the role computer-assisted personal
interviewing (CAPI) can play in transforming survey data
collection to allow better monitoring of the Sustainable
Development Goals.
ERCD Knowledge Products
Basic Statistics 2019Basic Statistics 2019 presents development indicators for 46 economies in
Asia and the Pacific, including Niue as the newest member of the Asian
Development Bank.
ERCD Knowledge Products
Youth Education Investment and Labor Market Outcomes in the Philippines: Survey Report
This report presents findings from a survey in the Philippines
on what shapes young people’s decisions about their
education.
ERCD Knowledge Products
Use of Remote Sensing to Estimate Paddy Area and Production: A Handbook
This handbook explains how to use remote sensing
technology to estimate rice crop area and production to
support food security policymaking in Asia and the Pacific.
ERCD Knowledge Products
Women’s Asset Ownership: Evidence from Georgia; Mongolia; and Cavite, Philippines
This publication provides insights to help develop
methodological guidelines on collecting sex-disaggregated
data about asset ownership.
ERCD Knowledge Products
Economic Indicators for Eastern Asia: Input–Output Tables
This publication presents economic statistics relevant for
cross-border production arrangements analysis in Hong
Kong, China; Japan; Mongolia; the People’s Republic of
China; the Republic of Korea; and Taipei,China.
ERCD Knowledge Products