Embed Size (px)
Citation preview
Potential Implications of a Special SafeguardMechanism in the World Trade Organization:
the Case of Wheat
Thomas W. Hertel, Will Martin, and Amanda M. Leister
The special safeguard mechanism—both quantity- and price-based—was key in theJuly 2008 failure to reach agreement in the World Trade Organization negotiationsunder the Doha Development Agenda. A stochastic simulation model of the worldwheat market is used to investigate the effects of the special safeguard mechanism. Asexpected, the quantity-based safeguard is found to reduce imports, raise domesticprices, and boost mean domestic production in the countries that implement it.However, rather than insulating developing countries in those regions from price vola-tility, the quantity-based safeguard increases domestic price volatility, largely byrestricting imports when domestic output is low and prices are high. The quantity-based safeguard shrinks average wheat imports nearly 50 percent in some regions, andglobal wheat trade falls by 4.7 percent. The price-based safeguard discriminatesagainst lower price exporters and contributes to producer price instability. G33, DohaDevelopment Agenda, Gaussian quadrature, safeguard, special safeguard mechanism,SSM, wheat, World Trade Organization, WTO, trade and development. JEL codes:F1, F13, F51, O24, Q1, Q17.
The special safeguard mechanism was key in the July 2008 failure to reachagreement in the World Trade Organization (WTO) negotiations under theDoha Development Agenda. The draft agreement would allow members toimpose specified additional duties when the volume of imports of an agricul-tural product exceeds a specified level or when import prices from a particularsupplier fall below a specified price (WTO 2008a). Given the substantial gainsavailable under the Doha Development Agenda (Martin and Mattoo 2008),the fact that the negotiations were unable to proceed for lack of consensus onthis issue highlights its importance to many WTO members. Wolfe (2009)
Thomas W. Hertel (corresponding author; [email protected]) is Distinguished Professor and
Executive Director of the Center for Global Trade Analysis at Purdue University. Will Martin
([email protected]) is a Research Manager in the Development Research Group of the World
Bank. Amanda M. Leister ([email protected]) is a graduate research assistant at the Center for
Global Trade Analysis at Purdue University. The authors wish to acknowledge valuable comments
provided by the editor of the journal and three anonymous reviewers.
THE WORLD BANK ECONOMIC REVIEW, pp. 1–30 doi:10.1093/wber/lhq010# The Author 2010. Published by Oxford University Press on behalf of the International Bankfor Reconstruction and Development / THE WORLD BANK. All rights reserved. For permissions,please e-mail: [email protected]
Page 1 of 30
The World Bank Economic Review Advance Access published August 18, 2010 at P
urdue University Libraries on A
ugust 24, 2010 http://w
ber.oxfordjournals.orgD
ownloaded from
attributes the breakdown of negotiations primarily to inadequate analysis ofthe safeguard operation and implications. Analysis based specifically on theproposed measure was limited because the proposed safeguard mechanism isone of the most technically complex aspects of the entire modalities, because itattempts to deal with variations in prices rather than—as with tariffs—merelytheir level, and because it was presented to ministers only a few days before themeeting.
Agricultural producers in developing countries are vulnerable to both dom-estic shocks—particularly from weather-related shocks to output—and shocksto international markets. However, developing country consumers are also par-ticularly vulnerable to shocks to food prices, given that the poorest peoplespend as much as 75 percent of their incomes on food. Policies that raise foodprices by imposing an import duty may help farmers whose incomes havefallen due to a harvest shortfall but do so at the expense of net buyers offood—including many farmers. Farmers isolated from world markets by poorinfrastructure and communications receive little or no benefit from protectionthat raises the cost of food to poor consumers linked to world markets. Thishighlights the need for careful analysis of the impact of the special safeguardmechanism that takes into account the differences between imported and dom-estic goods.
It is important to consider the implications of the special safeguard mechan-ism for global markets because they would apply to all developing countries,which account for about two-thirds of the value of world agricultural pro-duction. Thus, this article assesses the global implications of the proposedprice- and quantity-based safeguards for a key agricultural staple, wheat,taking into account not just their direct impacts on import prices but also theresulting impacts on world prices when many developing countries use them atthe same time. The analysis also traces the resulting impacts on key variablessuch as the volume of imports, domestic producer prices, and the returns toland on which the incomes of many farm households depend. Both the averageimpact and the volatility of these variables are considered, since part of themotivation for the safeguard is to reduce volatility by offsetting shocks frominternational markets.
Countries can use either a quantity-based or price-based safeguard in agiven year. While it would be interesting to consider a situation wherecountries could choose between the two types at each point in time, it isunclear which option policymakers would choose when both are available.Therefore, the article focuses on the important prior objective of assessing eachtype separately.
The article is organized as follows. Section I examines some of the key priorcontributions to the literature on the use of special safeguards. Section II con-siders the nature of the specific proposals under consideration. Section III intro-duces a diagrammatic assessment of the qualitative effects of suchinterventions, including an analysis of the extent to which it might be used.
Page 2 of 30 T H E W O R L D B A N K E C O N O M I C R E V I E W
at Purdue U
niversity Libraries on August 24, 2010
http://wber.oxfordjournals.org
Dow
nloaded from
Section IV discusses how the special safeguard mechanism can be used. SectionV explains the empirical model used to estimate the potential implications ofthe safeguard for domestic and global markets. Section VI applies the model tothe quantity-based safeguard, and section VII applies it to the price-based safe-guard. Section VIII compares the two sets of results. Section IX offers sugges-tions for future research.
I . W H A T T H E L I T E R A T U R E S A Y S A B O U T T H E S P E C I A L S A F E G U A R D
M E C H A N I S M
While much technical work was available at the time of the Doha ministerial,many key questions either had not been asked or had not been satisfactorilyresolved. Montemayor (2007, 2008) and Valdes and Foster (2005) focus on thebroad impacts of different duty rates on imports into individual countrieswithout taking into account the impacts on world markets. Not surprising,much of this initial work examines the frequency with which the special safe-guard measure could be used rather than on whether it would achieve its under-lying economic goals, such as moderating the impact of commodity marketvolatility on the incomes of farmers and the living costs of poor consumers.
Valdes and Foster (2005) rule out the quantity-based safeguard a priori,arguing that increased import quantities are likely to be due to declines in har-vests, making it difficult to justify import restrictions. They also expressconcern about developing countries’ difficulties in maintaining data onimports, and the inevitable lags between increases in imports and theimplementation of safeguards.
Finger (2009) raises several other important questions about the proposedspecial safeguard mechanism. For instance, would the mechanical trigger rulesallow import duties to be imposed when import prices are constant or rising?What objectives of the safeguard would be consistent with such mechanicalrules? And would use of a quantity-based trigger reduce—or actuallyincrease—the variability of domestic prices by raising duties during periods ofshort domestic supply? He also raises questions about theshipment-by-shipment nature of the duty calculation of the price-based safe-guard. After calculating duties under the safeguard by comparing the price ofeach shipment with the average price of all shipments, he finds that countriesthat export lower price products—typically developing countries—would likelyface considerably above average safeguard tariffs.
De Gorter, Kliauga, and Nassar (2009) suggest that under both the quantity-and price- based triggers most invocations of the safeguard in China, India,Indonesia, and the Republic of Korea would be against exports from develop-ing countries.
Grant and Meilke (2009) made an important step forward in the analysis ofthe proposed special safeguard mechanism by taking into account the potentialimpact of the safeguard as proposed in the July 2008 modalities on international
Hertel, Martin, and Leister Page 3 of 30
at Purdue U
niversity Libraries on August 24, 2010
http://wber.oxfordjournals.org
Dow
nloaded from
and domestic prices. They find that the safeguard increases the volatility ofworld prices. Although they believe that the impacts on world markets overallwould be fairly modest, several developing countries—most notably in theMiddle East and North Africa—would experience large increases in the vola-tility of domestic prices. Because Grant and Meilke use a net trade model(where imports are not linked to particular exporters), they were unable to dealwith the issue raised by Finger (2009) regarding the discriminatory nature of aprice-based safeguard toward lower price developing country exports.
The framework outlined in section II enriches the analysis of Grant andMeilke (2009) by incorporating the important features of key agricultural pro-ducts such as wheat, which show evidence of strong differentiation by countryof origin (Uri and Beach 1997). This differentiation, due partly to differencesin physical qualities of wheat from different countries and partly to less tangi-ble factors such as differences in the terms and conditions of sale, results inprice differences that influence the extent to which the price-based safeguard isinvoked. Therefore, this article examines the price- and quantity-based safe-guards within a modeling framework, as proposed in the draft WTO modal-ities of December 2008, that allows for differences in relative prices of exportsfrom different suppliers, thereby permitting Finger’s (2009) hypothesis of dis-crimination against developing country exporters to be tested.
I I . F E A T U R E S O F T H E P R O P O S E D S P E C I A L S A F E G U A R D M E C H A N I S M
The impacts of the special safeguard mechanism likely depend substantially onits design. The one under discussion is based broadly on the current specialagricultural safeguard, which includes two triggers—one based on the price ofimports and one on the quantity of imports (GATT 1994). In contrast withstandard WTO safeguards under Article XIX of the General Agreement onTariffs and Trade, there is no requirement to demonstrate that imports havecaused injury to domestic producers.
The price-based safeguard uses a reference price based on a three-yearmoving average of import prices from all sources (WTO 2008a). When theprice of an individual shipment falls below 85 percent of the reference price, aduty can be used to remove 85 percent of the shortfall. One important featureof this shipment-by-shipment trigger is that it imposes higher duties on importsfrom lower price exporters. Finger (2009) and de Gorter, Kliauga, and Nassar(2009) argue that a price-based safeguard generally imposes higher duties onexports from developing countries.
The quantity-based safeguard can be used when imports in a year exceedbase imports—a three-year moving average of imports.1 The duty that can be
1. Since imports in any one year are compared with a three-year moving average of past imports,
steady annual import growth of 5 percent compounds to a “surge” in imports of more than 10 percent,
against which a safeguard can be imposed.
Page 4 of 30 T H E W O R L D B A N K E C O N O M I C R E V I E W
at Purdue U
niversity Libraries on August 24, 2010
http://wber.oxfordjournals.org
Dow
nloaded from
applied increases as imports exceed this base. Imports of 110–115 percent ofthe base allow an additional duty of 25 percent of the current binding or 25percentage points, imports of 115–135 percent of the base allow an additionalduty of 40 percent of the binding or 40 percentage points, and imports of morethan 135 percent of the base allow an additional duty of 50 percent of thebinding or 50 percentage points. A quantity-based safeguard can be imposedfor only two years, and if used four years in a row, cannot be used for anothertwo years. If a safeguard duty is imposed and imports fall below the level inthe period before imposition, the trigger level is not reduced—thus preventingthe duty itself from causing the trigger level to decline.
The draft modalities do not, in general, permit total applied duties to exceedthe pre-Doha limit. A major focus of debate has been on exceptions to thislimit for the quantity-based safeguard, and two specific proposals have beenadvanced. The “Lamy compromise” would permit duties to exceed the bind-ings by 15 percentage points on 2.5 percent of tariff lines when imports exceedthe base by 40 percent (ICTSD 2008). The compromise proposed by the G-33(2008) and its negotiating partners would permit tariffs up to 30 percent (orpercentage points) above the pre-Doha bindings on 7 percent of tariff lineswhen imports exceed 110 percent of base levels. The draft modalities considerincreases of 12 percent and 15 percent above the bound rate (WHO 2008a,para. 145).
The next section examines the qualitative implications of using the quantityand price-based safeguards as a guide to understanding the model-based resultsin subsequent sections.
I I I . Q U A L I T A T I V E I M P A C T S O F U S I N G T H E P R I C E - A N D
Q U A N T I T Y - B A S E D S A F E G U A R D S
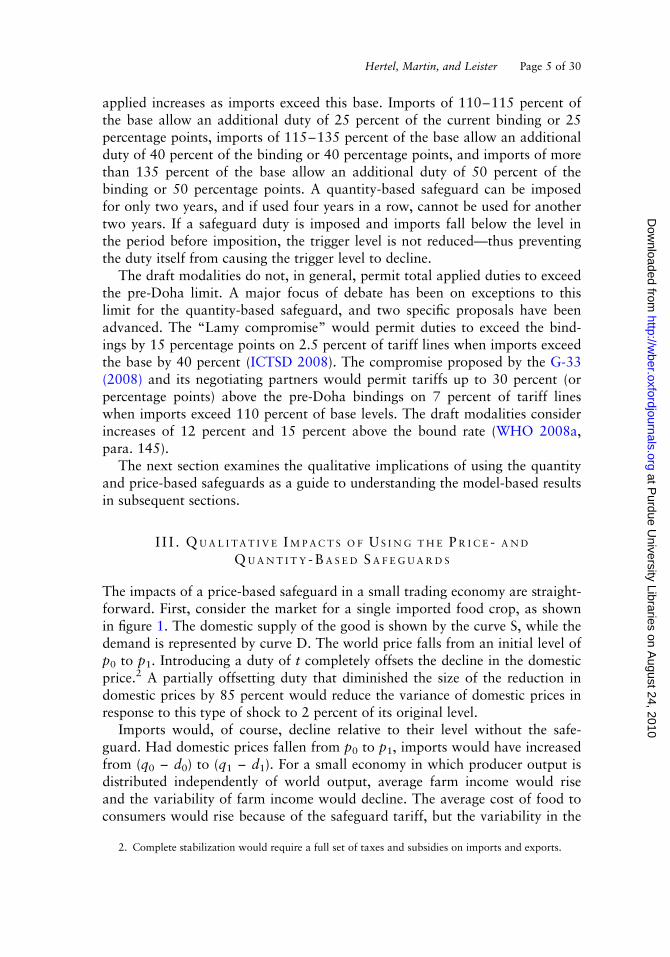
The impacts of a price-based safeguard in a small trading economy are straight-forward. First, consider the market for a single imported food crop, as shownin figure 1. The domestic supply of the good is shown by the curve S, while thedemand is represented by curve D. The world price falls from an initial level ofp0 to p1. Introducing a duty of t completely offsets the decline in the domesticprice.2 A partially offsetting duty that diminished the size of the reduction indomestic prices by 85 percent would reduce the variance of domestic prices inresponse to this type of shock to 2 percent of its original level.
Imports would, of course, decline relative to their level without the safe-guard. Had domestic prices fallen from p0 to p1, imports would have increasedfrom (q0 – d0) to (q1 – d1). For a small economy in which producer output isdistributed independently of world output, average farm income would riseand the variability of farm income would decline. The average cost of food toconsumers would rise because of the safeguard tariff, but the variability in the
2. Complete stabilization would require a full set of taxes and subsidies on imports and exports.
Hertel, Martin, and Leister Page 5 of 30
at Purdue U
niversity Libraries on August 24, 2010
http://wber.oxfordjournals.org
Dow
nloaded from
cost of food would decline. Consumers eat less food because of its higherprice, which generates an economic cost measured by area def in figure 1.Another cost—measured by area bcg—arises because lower cost imports arereplaced by higher cost domestic production.
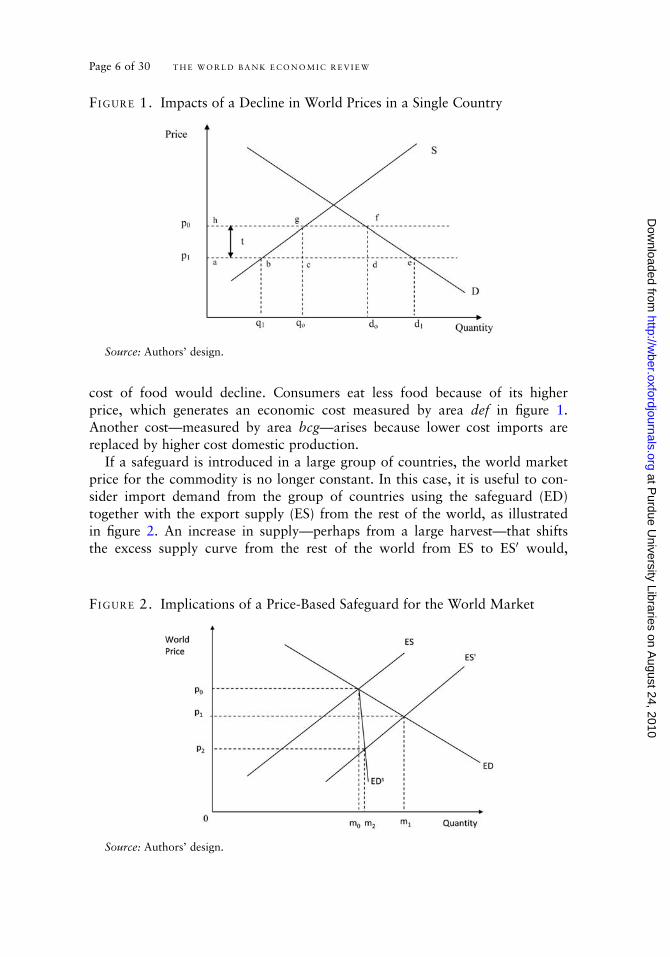
If a safeguard is introduced in a large group of countries, the world marketprice for the commodity is no longer constant. In this case, it is useful to con-sider import demand from the group of countries using the safeguard (ED)together with the export supply (ES) from the rest of the world, as illustratedin figure 2. An increase in supply—perhaps from a large harvest—that shiftsthe excess supply curve from the rest of the world from ES to ES0 would,
FIGURE 1. Impacts of a Decline in World Prices in a Single Country
Source: Authors’ design.
FIGURE 2. Implications of a Price-Based Safeguard for the World Market
Source: Authors’ design.
Page 6 of 30 T H E W O R L D B A N K E C O N O M I C R E V I E W
at Purdue U
niversity Libraries on August 24, 2010
http://wber.oxfordjournals.org
Dow
nloaded from
without a safeguard, cause the world price to decline from p0 to p1. Thedecline in prices in importing countries would cause their imports to increasefrom m0 to m1. If a safeguard reduces the decline in import prices in importingmarkets, the decline in world prices must be larger, because more of the priceadjustment is forced onto the exporting countries. If 85 percent of the declinein world prices is offset by a safeguard, the increase in imports for a givenreduction in world prices is reduced to 15 percent of its level in the absence ofa safeguard. Thus, world prices would decline further, as illustrated by p2 infigure 2.
For the importing countries, the reduction in the world price to p2 resultingfrom the safeguard requires a second-round increase in the safeguard duty ontop of that shown in figure 1. For each country, the decline in the world priceis not just the initial reduction from p0 to p1 but that from p0 to p2 shown infigure 2. Average world prices decline, since the safeguard sometimesincreases—and never reduces—duties. Another key impact of the widespreaduse of a safeguard in importing countries is an increase in the volatility ofworld prices (see Tyers and Anderson 1992).
An important implication of the analysis in figure 2 is that, when analyzingthe impacts of introducing a safeguard that covers all developing countries, itmay not be enough to simply consider experience in the absence of a safeguard.Once the safeguard is introduced in several important markets, the volatility ofworld prices is likely to be greater than would otherwise be the case. If thiseffect is large, it will increase the probability that the safeguard will be trig-gered in any period.
As noted in Fraser and Martin (2008) and Valdes and Foster (2005), theimplications of a quantity-based safeguard depend heavily on the cause of theshock. If the cause is a decline in world prices of the type shown in figure 1,for instance, imports rise from (q0 – d0) to (q1 – d1). If this decline is largeenough to trigger the quantity-based safeguard, a quantity-based safeguardcould be an alternative to a price-based safeguard. If the same additional dutywere generated by both safeguards, there is no effective difference. Because thelink between the size of the price decline and the tariff imposed under thequantity-based safeguard is weak, this safeguard may permit a larger responsethan the price-based safeguard and may even cause the domestic price to risewhen the import price falls.
If the world price does not decline but imports increase, the quantity-basedsafeguard can be triggered even though the price-based safeguard is not. In thissituation, it is important to examine the cause of the increase in imports. Inagriculture, such an increase is likely due either to a shift in the domesticsupply curve—such as a decline in the harvest associated with poor weatherconditions—or to an increase in demand, as considered by Sen (1981). TheSouth Centre (2009) concludes that more than 85 percent of import surges arenot accompanied by declines in import prices, suggesting that most importsurges are driven by domestic shocks, such as declines in domestic production.
Hertel, Martin, and Leister Page 7 of 30
at Purdue U
niversity Libraries on August 24, 2010
http://wber.oxfordjournals.org
Dow
nloaded from
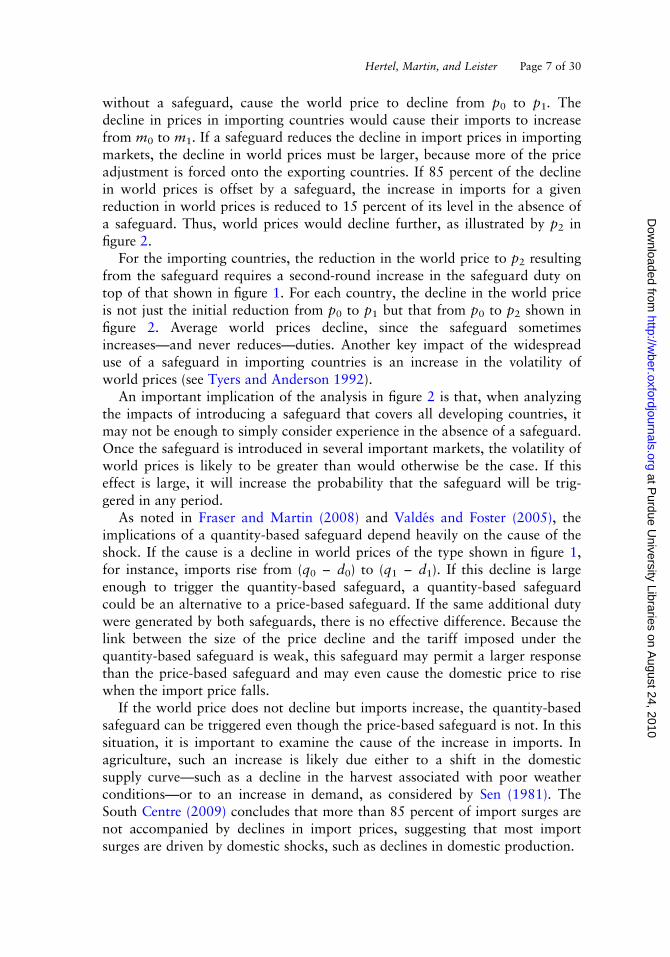
Figure 3 focuses on a reduction in domestic supply. Domestic supply isinitially shown by the supply curve S, which shows domestic production of q0
at price p0. Domestic demand is represented by curve D, and demand at pricep0 by d0. Imports are initially given by (q0 – d0). Without a quantity-basedsafeguard, a decline in domestic supply from S to S0 does not affect the dom-estic price. Imports increase to make up the larger gap between domesticdemand and supply, allowing the domestic price to remain stable. If a quantity-based safeguard is used, the effect is to apply an additional duty—and thus toraise the domestic price.
The effect of a quantity-based safeguard in this situation is to destabilize thedomestic price. For consumers, the adverse impact on prices can be avoided byimporting to make up the shortfall. For producers, prices are destabilized, butrevenues and net returns may be stabilized or destabilized.3 If the tariffimposed is slightly larger than the decline in the quantity of output, producergross revenues will be stabilized.4 However, the effect on producer net returnsmay differ, depending on the nature of the shift in the supply curve (Martinand Alston 1994, 1997).
Imposing a quantity-based safeguard would reduce imports below the levelthat would have prevailed in the absence of such a measure. In figure 3, theinitial level of imports is given by (d0 2 q0). Without a safeguard, importswould rise to (d0 2 q0
0). A safeguard would reduce imports below this level,
FIGURE 3. Potential Effects of a Quantity-Based Safeguard
Source: Authors’ design.
3. Consumers and producers are typically not distinct groups—particularly in poor countries. Many
farmers are net buyers of staple foods, and some households classified as urban for survey purposes are
net sellers of these products (Ivanic and Martin 2008).
4. For a small change in output, the proportional effect on producer revenues is given by @p/p þ @q/
q where @p is the change in price and @q the changes in quantity. For larger changes, the interaction
effect between the change in price and quantity becomes significant.
Page 8 of 30 T H E W O R L D B A N K E C O N O M I C R E V I E W
at Purdue U
niversity Libraries on August 24, 2010
http://wber.oxfordjournals.org
Dow
nloaded from
perhaps to a level similar to (d1 2 q10). Whether this is greater than or less than
the initial level of imports is unclear. With the quantity-based safeguard, thereis a link between the extent of import penetration before the safeguard and thesize of the duty that can be imposed during the following 12 months. A 35percent increase in imports would allow an additional duty of 50 percentagepoints to be imposed. A relatively high elasticity of demand for imports at thetariff-line level, as is usually assumed, may be enough to reduce imports sub-stantially. However, the short-term nature of the measure makes significantsupply response unlikely, lowering the probability that imports would bereduced below their initial level.
I V. H O W T H E S P E C I A L S A F E G U A R D M E C H A N I S M M I G H T B E U S E D
Because the special safeguard mechanism provides an option, but not an obli-gation, to protect, it is difficult to be sure how frequently it would be used.One view is that most developing countries have considerable binding over-hang, with their bound tariffs considerably above their applied rates, so it isunlikely that a safeguard would make a significant difference to the protectionallowed under WTO rules. Another is that decisions about the duties appliedunder a safeguard are likely to be taken in a different forum from those regard-ing ordinary tariffs, which may have real implications for choices about borderprotection. In many countries, applied tariff levels are decided by a tariff com-mittee, which includes representatives from different parts of government andwhich frequently takes a broad view about the desirability of low tariffs forexport competitiveness and the overall efficiency of the economy. A body witha narrower focus may be more willing to provide protection that benefits pro-ducers in a particular sector.
One promising approach to assessing the likely use of the special safeguardmechanism is to examine the frequency with which the special agriculturalsafeguard provided under the Uruguay Round has been used. Morrison andSharma (2005) conclude that the ratio of times that the special agriculturalsafeguard was invoked to times that it could have been invoked was about 1percent. They suggested three reasons for nonapplication: the complexity of theformulas; high tariff bindings in many developing countries, which make itfeasible to raise applied tariffs or apply additional duties without exceedingbound rates; and a judgment that the costs of introducing such measuresexceed the benefits.
Several other reasons for the limited use of the special agricultural safeguardhave been offered. Finger (2009) notes that many major users of the specialagricultural safeguard posted minimum prices when the Uruguay Round agree-ment came into effect. Under these circumstances, exporters knew that pricingat a lower level would result in a duty and thus had a strong incentive to priceat the minimum posted price so that the safeguard would not be invoked.Hallaert (2005) suggests that many members have ignored the requirement to
Hertel, Martin, and Leister Page 9 of 30
at Purdue U
niversity Libraries on August 24, 2010
http://wber.oxfordjournals.org
Dow
nloaded from
report use of the special agricultural safeguard to the WTO’s Committee onAgriculture within 10 days of implementation, though he concludes that theuse of the safeguard has increased as WTO members become more familiarwith its provisions.
Another possible reason is that the special agricultural safeguard was oftenpolitically unattractive because of the weak relationship between its mechanicalformulas and policymaker goals. While the quantity-based special agriculturalsafeguard might permit the use of safeguards following a crop failure, policy-makers may not have wanted to use the safeguard under those circumstancesbecause of pressure from consumers concerned about high food prices.
The next section turns to the empirical framework, which permits a morethorough assessment and comparison of the implications of the proposedquantity- and price-based safeguards.
V. E M P I R I C A L F R A M E W O R K A N D S C E N A R I O D E S I G N
The analysis builds on Valenzuela and others (2007), who use a stochasticsimulation approach to validating computable general equilibrium models,with a focus on the world wheat market. This study employs a more recentversion of the Global Trade Analysis Project model that has been specificallytailored to agricultural applications (Keeney and Hertel 2005). It incorporatessegmented factor markets to mimic short-run rigidities in supply response andmore detailed information about supply and demand elasticities pertinent toagricultural production and food consumption.5 The Armington importdemand specification with econometrically estimated elasticities of substitutionbetween varieties of wheat in the model is used to allow for differentiationbetween wheat produced in different countries (Hertel and others 2007). Asseen below, product differentiation by origin plays an important role in theprice-based safeguard.
Since demand for wheat is relatively stable and most shocks to the wheatmarket come from weather-induced shocks to production, supply-side shocksare introduced into the model. Specifically, total factor productivity in wheat ineach model region is shocked by sampling from historical distributions ofsupply deviations from trend in all world regions.6 The approach used in thisstochastic simulation ensures that each time the impacts of a new policy regime
5. This model is first validated based on historical variation in production and prices, following the
approach proposed by Valenzuela and others (2007). For more details, see the working paper version of
this article (Hertel, Martin, and Leister 2010).
6. Standard stochastic simulation techniques such as Monte Carlo procedures are cumbersome at
best, given the large number of variables in the model so Valenzuela and others (2007) are followed in
approximating the distribution of supply shocks using Gaussian quadrature. This has been shown to be
an efficient means of assessing the consequences of stochastic variation in parameters of the shocks to
computable general equilibrium models (DeVuyst and Preckel 1997) and its implementation has been
automated in the GEMPACK software used to solve the model (Arndt 1996; Pearson and Arndt 2000).
Page 10 of 30 T H E W O R L D B A N K E C O N O M I C R E V I E W
at Purdue U
niversity Libraries on August 24, 2010
http://wber.oxfordjournals.org
Dow
nloaded from
are simulated, an identical set of stochastic shocks is administered. This elimin-ates the possibility that differences in the sample of supply-side shocks contrib-ute to differences in outcomes across policy regimes.
Three sets of stochastic simulations are performed. The first set establishes thebaseline (no safeguard). This case assumes that tariffs remain fixed at the level ofscheduled applied tariff rates for 2001, except when countries made inter-national commitments to lower their WTO bound tariff rates—as in the case ofChina’s accession to the WTO—or to lower tariffs on a preferential basis.
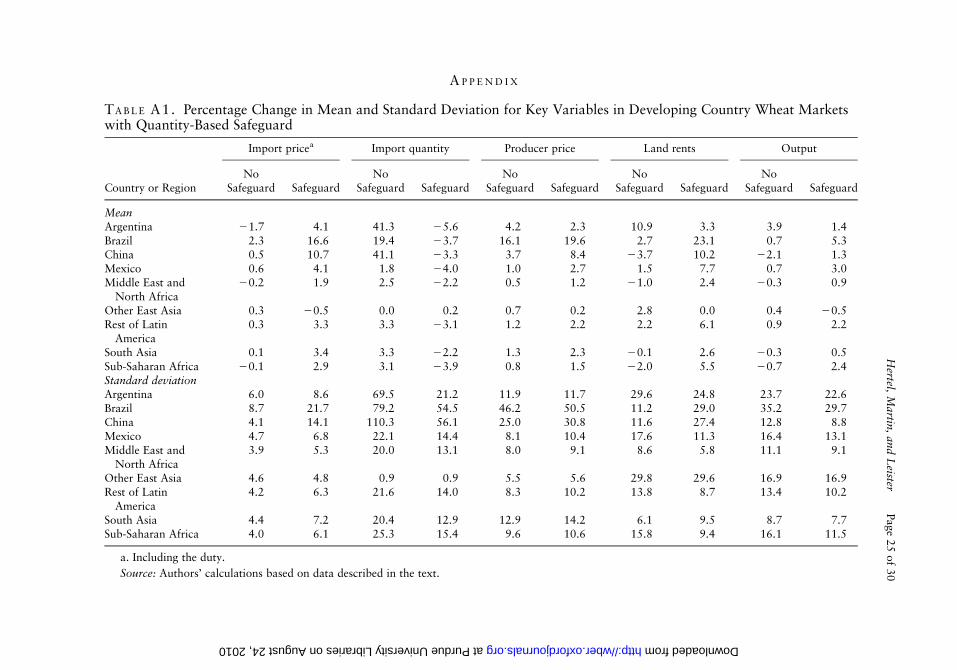
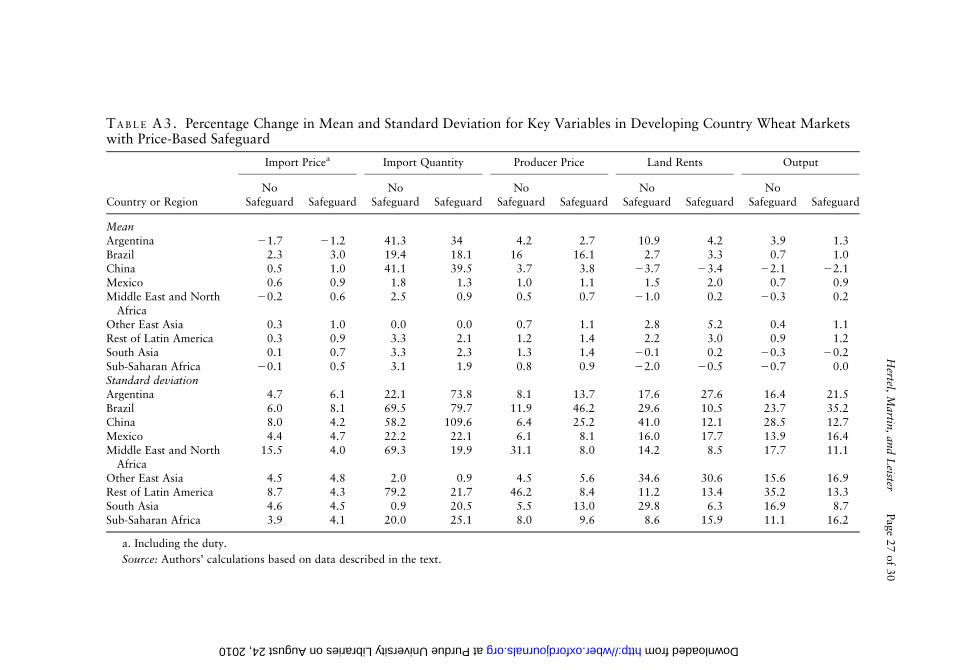
The second set of stochastic simulations permits developing countries toinvoke the quantity-based safeguard, as detailed in the next section. The analy-sis focuses on the differences between the expected mean and standard devi-ation of key variables, which are computed as the outcome under thequantity-based safeguard minus the outcome under the baseline. The third setof stochastic simulations allows developing countries to implement the price-based safeguard, as detailed below. Again, the focus is on differences in theexpected percentage change in the mean and standard deviation, computed asthe price-based safeguard value minus the baseline value. The percentagechange in the mean and standard deviation of model variables under any indi-vidual policy regime are in appendix tables A1–A5.
The special safeguard mechanism duties considered in the second and thirdsets are distinct from—and additional to—initial applied tariff rates, in thesame way that antidumping duties and Article XIX safeguard duties are inaddition to scheduled applied tariff rates. Many developing countries can raiseapplied rates relative to bound rates, with China a notable exception (seebelow). All other regions are modeled according to the draft modalities, andapplied tariffs plus the endogenously determined safeguard remain below thebound rates in all cases.
V I . I M P L E M E N T I N G T H E Q U A N T I T Y - B A S E D S P E C I A L S A F E G U A R D
M E C H A N I S M
The quantity-based trigger permits developing countries to apply a tariff onimports whenever trade volumes reach 110 percent of a three-year movingaverage. The resulting tariff can be as high as 25 percent of the bound tariff or25 percentage points, whichever is higher (tier 1). If imports exceed 115percent of the baseline, the additional duty can be as high as 40 percent of thebound tariff or 40 percentage points (tier 2). And if imports reach 135 percentof the baseline, the additional duty can be as high as 50 percent of the boundtariff or 50 percentage points (tier 3). For China, where binding overhang haslargely been eliminated, a duty of up to 30 percentage points is allowed for, asproposed by the G-33,when the combination of applied tariffs and the safe-guard duty exceeds the bound tariff.
This quantity-based safeguard is modeled as a nonlinear complementarityproblem. More specifically, letting Ti be the safeguard tariff and QRi be the
Hertel, Martin, and Leister Page 11 of 30
at Purdue U
niversity Libraries on August 24, 2010
http://wber.oxfordjournals.org
Dow
nloaded from
ratio of observed imports to the trigger level of imports for the safeguard tieri ¼ 1, 2, 3 yields the complementary slackness condition Ti � 0?(1 2 QRi) �0, which implies that either Ti � 0,(1 2 QRi) ¼ 0 (the safeguard is binding) orTi ¼ 0,(1 2 QRi) � 0 (the safeguard is nonbinding).
The benchmark year for the baseline level of imports is 2001. With thequantity-based safeguard, it is assumed that when imports reach but do notexceed a trigger level, the duty is adjusted to keep imports at that trigger level.7
The full duty permitted at a given trigger level is imposed only when importsexceed the specified trigger level. Attention then focuses on whether the nexthigher trigger is reached and the next higher duty imposed.
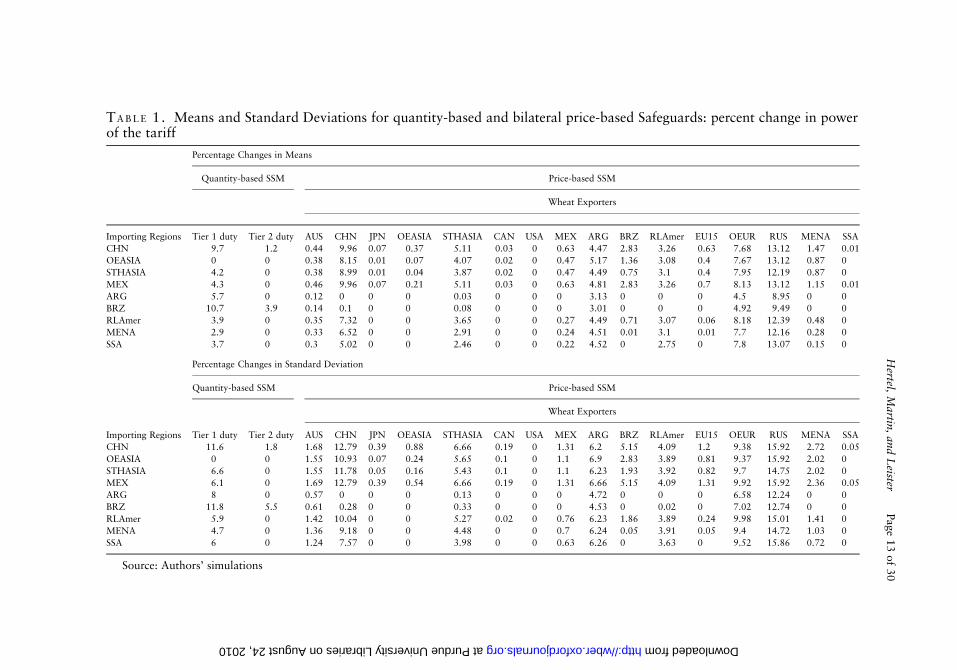
Table 1 reports on the power of the safeguard tariff (that is, 1 þ the advalorem tariff rate) for both the quantity- and price-based safeguards. Thequantity-based safeguard columns relate to the tier 1 and tier 2 tariffs appliedto imports from all sources, while the price-based safeguard columns report thebilateral changes in the power of the safeguard tariff. This section focuses onthe quantity-based safeguard. For example, the mean power of the tier 1 safe-guard tariff in China is 9.7 percent higher than its baseline value (1.0).
When cost, insurance, and freight (c.i.f.) prices are held constant, a 1 percen-tage point change in the power of the safeguard tariff translates directly into aone percentage point change in the domestic price of imported wheat. In theabsence of the safeguard, this tariff—and hence the power of the tariff—isunchanged. However, when the safeguard is present, all regions except OtherEast Asia (where the safeguard is always nonbinding) show a positive meanchange in the power of the tier 1 safeguard tariff, ranging from 2.9 percent inthe Middle East and North Africa to 10.7 percent in Brazil, where domesticproduction is extremely volatile. Only Brazil and China invoke the tier 2 safe-guard tariff; the tier 3 tariff is not used in the simulations.8
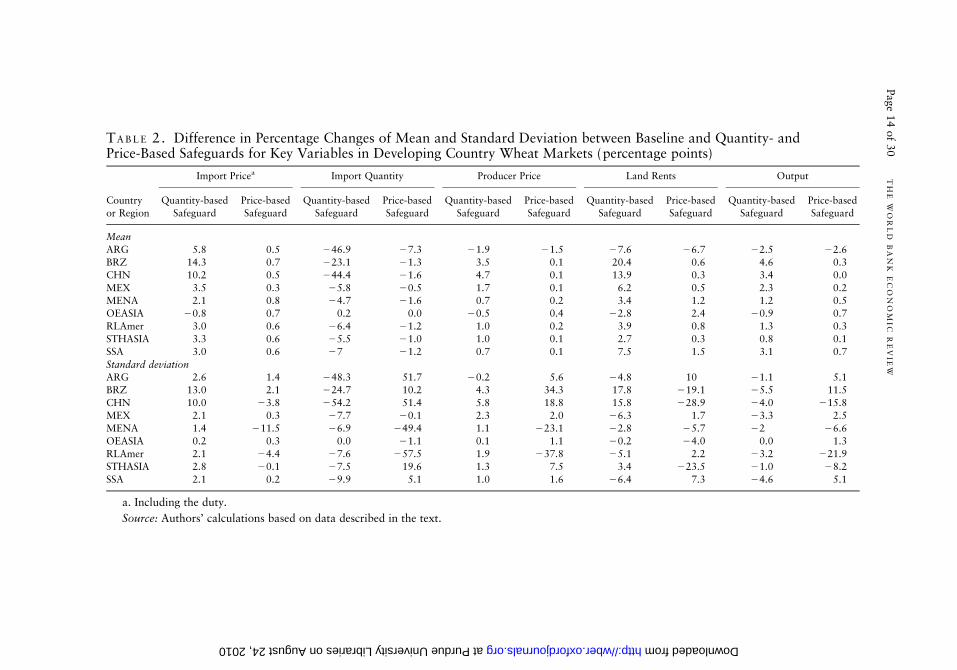
Table 2 reports the changes in the mean and standard deviations of key vari-ables in developing countries that are permitted to apply the safeguard. It isassumed that they do so when imports reach 110 percent of baseline levels andthat they apply an additional tariff when imports reach 115 percent of thebaseline.
By frequently invoking the safeguard tariff, developing countries raise the meantariff-inclusive price of imported wheat over the course of the stochastic simu-lations. When the quantity-based safeguard is imposed, the mean import price inChina rises by 10.2 percent (see table 2). By restricting imports when domestic
7. An alternative, and potentially much more trade-restrictive, scenario involves imposing the full
duty permitted whenever imports reached the trigger in the past 12 months, even if doing so results in
imports falling below the trigger.
8. It is also of interest how the safeguard tariff would change if only a single region used the
safeguard. Separate simulations that permitted only one region to impose the tariffs were undertaken
(but are not reported here). Not surprising, this results in lower mean tariffs in the country invoking the
safeguard—that is, the effect of all developing countries using the safeguard is to increase the frequency
and intensity of single-region safeguard tariffs.
Page 12 of 30 T H E W O R L D B A N K E C O N O M I C R E V I E W
at Purdue U
niversity Libraries on August 24, 2010
http://wber.oxfordjournals.org
Dow
nloaded from
TA B L E 1. Means and Standard Deviations for quantity-based and bilateral price-based Safeguards: percent change in powerof the tariff
Percentage Changes in Means
Quantity-based SSM Price-based SSM
Wheat Exporters
Importing Regions Tier 1 duty Tier 2 duty AUS CHN JPN OEASIA STHASIA CAN USA MEX ARG BRZ RLAmer EU15 OEUR RUS MENA SSA
CHN 9.7 1.2 0.44 9.96 0.07 0.37 5.11 0.03 0 0.63 4.47 2.83 3.26 0.63 7.68 13.12 1.47 0.01
OEASIA 0 0 0.38 8.15 0.01 0.07 4.07 0.02 0 0.47 5.17 1.36 3.08 0.4 7.67 13.12 0.87 0
STHASIA 4.2 0 0.38 8.99 0.01 0.04 3.87 0.02 0 0.47 4.49 0.75 3.1 0.4 7.95 12.19 0.87 0
MEX 4.3 0 0.46 9.96 0.07 0.21 5.11 0.03 0 0.63 4.81 2.83 3.26 0.7 8.13 13.12 1.15 0.01
ARG 5.7 0 0.12 0 0 0 0.03 0 0 0 3.13 0 0 0 4.5 8.95 0 0
BRZ 10.7 3.9 0.14 0.1 0 0 0.08 0 0 0 3.01 0 0 0 4.92 9.49 0 0
RLAmer 3.9 0 0.35 7.32 0 0 3.65 0 0 0.27 4.49 0.71 3.07 0.06 8.18 12.39 0.48 0
MENA 2.9 0 0.33 6.52 0 0 2.91 0 0 0.24 4.51 0.01 3.1 0.01 7.7 12.16 0.28 0
SSA 3.7 0 0.3 5.02 0 0 2.46 0 0 0.22 4.52 0 2.75 0 7.8 13.07 0.15 0
Percentage Changes in Standard Deviation
Quantity-based SSM Price-based SSM
Wheat Exporters
Importing Regions Tier 1 duty Tier 2 duty AUS CHN JPN OEASIA STHASIA CAN USA MEX ARG BRZ RLAmer EU15 OEUR RUS MENA SSA
CHN 11.6 1.8 1.68 12.79 0.39 0.88 6.66 0.19 0 1.31 6.2 5.15 4.09 1.2 9.38 15.92 2.72 0.05
OEASIA 0 0 1.55 10.93 0.07 0.24 5.65 0.1 0 1.1 6.9 2.83 3.89 0.81 9.37 15.92 2.02 0
STHASIA 6.6 0 1.55 11.78 0.05 0.16 5.43 0.1 0 1.1 6.23 1.93 3.92 0.82 9.7 14.75 2.02 0
MEX 6.1 0 1.69 12.79 0.39 0.54 6.66 0.19 0 1.31 6.66 5.15 4.09 1.31 9.92 15.92 2.36 0.05
ARG 8 0 0.57 0 0 0 0.13 0 0 0 4.72 0 0 0 6.58 12.24 0 0
BRZ 11.8 5.5 0.61 0.28 0 0 0.33 0 0 0 4.53 0 0.02 0 7.02 12.74 0 0
RLAmer 5.9 0 1.42 10.04 0 0 5.27 0.02 0 0.76 6.23 1.86 3.89 0.24 9.98 15.01 1.41 0
MENA 4.7 0 1.36 9.18 0 0 4.48 0 0 0.7 6.24 0.05 3.91 0.05 9.4 14.72 1.03 0
SSA 6 0 1.24 7.57 0 0 3.98 0 0 0.63 6.26 0 3.63 0 9.52 15.86 0.72 0
Source: Authors’ simulations
Hertel,
Martin
,an
dL
eisterPage
13
of
30
at Purdue University Libraries on August 24, 2010 http://wber.oxfordjournals.org Downloaded from
TA B L E 2. Difference in Percentage Changes of Mean and Standard Deviation between Baseline and Quantity- andPrice-Based Safeguards for Key Variables in Developing Country Wheat Markets (percentage points)
Country
or Region
Import Pricea Import Quantity Producer Price Land Rents Output
Quantity-based
Safeguard
Price-based
Safeguard
Quantity-based
Safeguard
Price-based
Safeguard
Quantity-based
Safeguard
Price-based
Safeguard
Quantity-based
Safeguard
Price-based
Safeguard
Quantity-based
Safeguard
Price-based
Safeguard
Mean
ARG 5.8 0.5 246.9 27.3 21.9 21.5 27.6 26.7 22.5 22.6
BRZ 14.3 0.7 223.1 21.3 3.5 0.1 20.4 0.6 4.6 0.3
CHN 10.2 0.5 244.4 21.6 4.7 0.1 13.9 0.3 3.4 0.0
MEX 3.5 0.3 25.8 20.5 1.7 0.1 6.2 0.5 2.3 0.2
MENA 2.1 0.8 24.7 21.6 0.7 0.2 3.4 1.2 1.2 0.5
OEASIA 20.8 0.7 0.2 0.0 20.5 0.4 22.8 2.4 20.9 0.7
RLAmer 3.0 0.6 26.4 21.2 1.0 0.2 3.9 0.8 1.3 0.3
STHASIA 3.3 0.6 25.5 21.0 1.0 0.1 2.7 0.3 0.8 0.1
SSA 3.0 0.6 27 21.2 0.7 0.1 7.5 1.5 3.1 0.7
Standard deviationARG 2.6 1.4 248.3 51.7 20.2 5.6 24.8 10 21.1 5.1
BRZ 13.0 2.1 224.7 10.2 4.3 34.3 17.8 219.1 25.5 11.5
CHN 10.0 23.8 254.2 51.4 5.8 18.8 15.8 228.9 24.0 215.8
MEX 2.1 0.3 27.7 20.1 2.3 2.0 26.3 1.7 23.3 2.5
MENA 1.4 211.5 26.9 249.4 1.1 223.1 22.8 25.7 22 26.6
OEASIA 0.2 0.3 0.0 21.1 0.1 1.1 20.2 24.0 0.0 1.3
RLAmer 2.1 24.4 27.6 257.5 1.9 237.8 25.1 2.2 23.2 221.9
STHASIA 2.8 20.1 27.5 19.6 1.3 7.5 3.4 223.5 21.0 28.2
SSA 2.1 0.2 29.9 5.1 1.0 1.6 26.4 7.3 24.6 5.1
a. Including the duty.
Source: Authors’ calculations based on data described in the text.
Page
14
of
30
TH
EW
OR
LD
BA
NK
EC
ON
OM
IC
RE
VIE
W
at Purdue University Libraries on August 24, 2010 http://wber.oxfordjournals.org Downloaded from
production is low and prices are high, the expected domestic price of imports risessignificantly across all regions except Other East Asia. This is expected toadversely affect the urban poor in particular because they tend to spend a largershare of their income on staple foods than do wealthier households.
The expected quantity of imports into China is reduced under the quantity-based safeguard. Without the safeguard, the expected value of imports inChina is 41.1 percent above the baseline (see appendix table A1). This largepositive mean value arises because, when domestic production is low, thedemand for imports is very strong; hence there is a large percentage increasefrom the base level. However, when domestic production is high, gross importscannot fall below zero. So, the expected value of imports in a stochasticenvironment is higher than in the baseline. When the quantity-triggered safe-guard regime is overlaid on this same stochastic production environment, themean change in imports is 3.3 percent below the baseline import value forChina (see appendix table A1). So the difference is 44.4 percentage points.Other regions with large reductions in mean imports due to the quantity-basedsafeguard are Argentina (46.9 percentage points) and Brazil (23.1 percentagepoints). All developing countries and regions except Other East Asia showlower mean import quantities under the quantity-based safeguard.
Higher prices for imports translate into higher mean prices for domestic pro-ducts (although the two are imperfectly linked due to the Armington productdifferentiation assumption) and higher mean returns to wheat producers underthe special safeguard mechanism. For example, in China, mean wheat pricesrise from 3.7 percent to 8.4 percent (see appendix table A1), a difference of4.7 percentage points (see table 2). This in turn boosts mean land rents underthe quantity-based safeguard in China’s wheat sector by 13.9 percent, whichthen boosts expected output 3.4 percent. Land rents rise in all developingcountries and regions except Argentina and Other East Asia (see above), wherethey fall 7.6 percent because Argentina is a net exporter of wheat and becauseproducers are hurt by the safeguard in other countries. The largest increase inland rents between the two policy regimes is for Brazilian wheat producers(20.4 percent rise in mean land rents), but other gains are also substantial. Thequantity-based safeguard also results in higher mean wheat output in theseregions, with the largest deviation from the nonsafeguard mean change inBrazil (4.6 percent higher under the safeguard; see table 2).
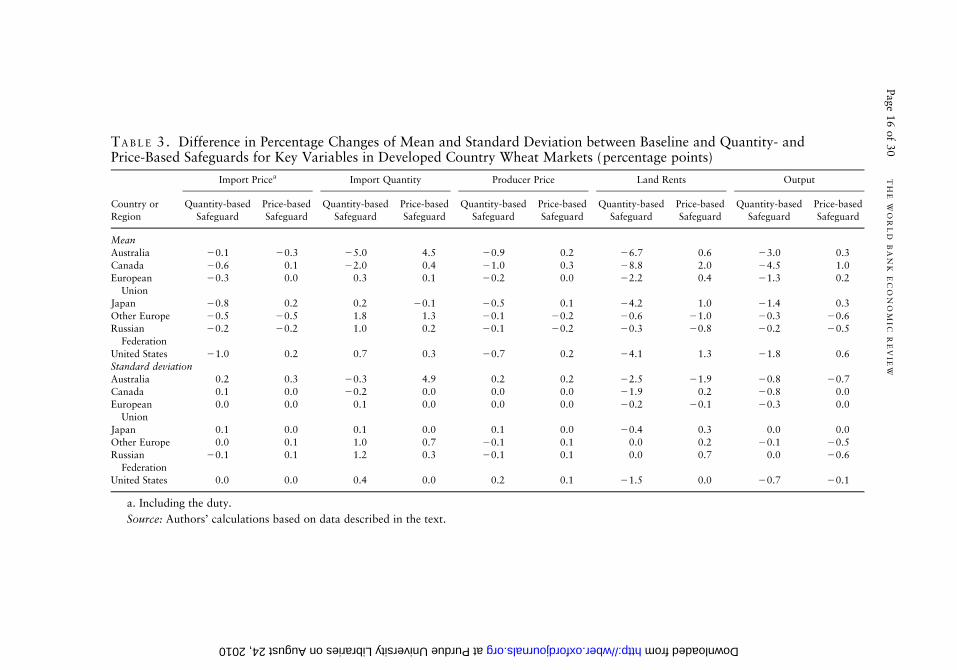
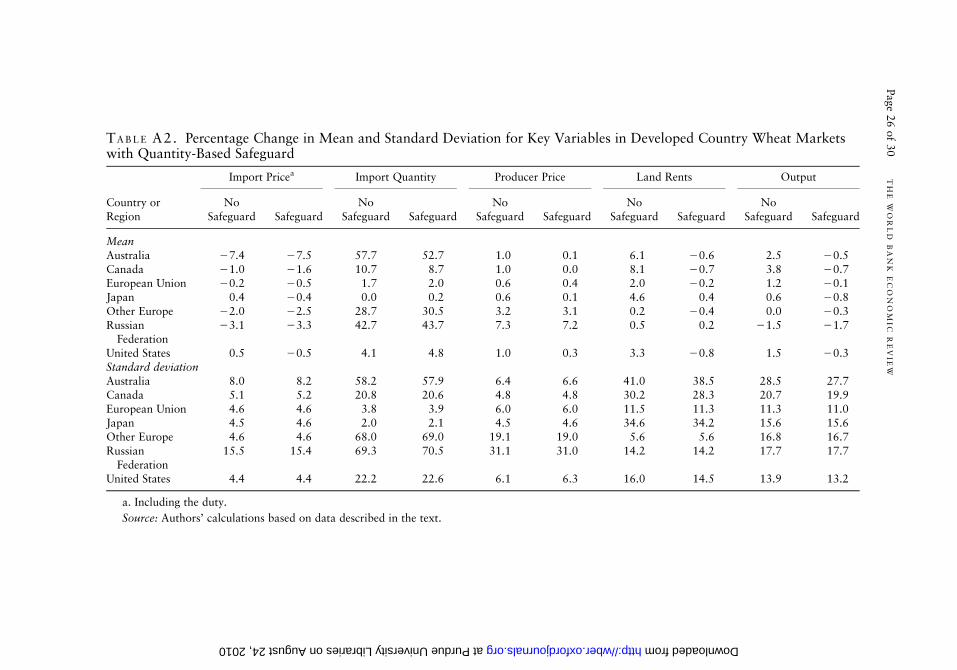
Table 3 reports changes in the mean and standard deviation for key vari-ables in developed country wheat markets. These changes are the opposite ofthe developing country results. Mean output prices and mean land rents andoutput are lower in all developed countries and regions, and mean importquantities are higher except in Australia and Canada. On average, producers inthese countries are adversely affected by the protection imposed in developingcountries. For Canadian wheat producers, for example, wheat land rents fall0.7 percent rather than rising an average of 8.1 percent (see appendix tableA1), a difference of 8.8 percentage points. Australian wheat producers show
Hertel, Martin, and Leister Page 15 of 30
at Purdue U
niversity Libraries on August 24, 2010
http://wber.oxfordjournals.org
Dow
nloaded from
TA B L E 3. Difference in Percentage Changes of Mean and Standard Deviation between Baseline and Quantity- andPrice-Based Safeguards for Key Variables in Developed Country Wheat Markets (percentage points)
Country or
Region
Import Pricea Import Quantity Producer Price Land Rents Output
Quantity-based
Safeguard
Price-based
Safeguard
Quantity-based
Safeguard
Price-based
Safeguard
Quantity-based
Safeguard
Price-based
Safeguard
Quantity-based
Safeguard
Price-based
Safeguard
Quantity-based
Safeguard
Price-based
Safeguard
Mean
Australia 20.1 20.3 25.0 4.5 20.9 0.2 26.7 0.6 23.0 0.3
Canada 20.6 0.1 22.0 0.4 21.0 0.3 28.8 2.0 24.5 1.0
European
Union
20.3 0.0 0.3 0.1 20.2 0.0 22.2 0.4 21.3 0.2
Japan 20.8 0.2 0.2 20.1 20.5 0.1 24.2 1.0 21.4 0.3
Other Europe 20.5 20.5 1.8 1.3 20.1 20.2 20.6 21.0 20.3 20.6
Russian
Federation
20.2 20.2 1.0 0.2 20.1 20.2 20.3 20.8 20.2 20.5
United States 21.0 0.2 0.7 0.3 20.7 0.2 24.1 1.3 21.8 0.6
Standard deviation
Australia 0.2 0.3 20.3 4.9 0.2 0.2 22.5 21.9 20.8 20.7
Canada 0.1 0.0 20.2 0.0 0.0 0.0 21.9 0.2 20.8 0.0
European
Union
0.0 0.0 0.1 0.0 0.0 0.0 20.2 20.1 20.3 0.0
Japan 0.1 0.0 0.1 0.0 0.1 0.0 20.4 0.3 0.0 0.0
Other Europe 0.0 0.1 1.0 0.7 20.1 0.1 0.0 0.2 20.1 20.5
Russian
Federation
20.1 0.1 1.2 0.3 20.1 0.1 0.0 0.7 0.0 20.6
United States 0.0 0.0 0.4 0.0 0.2 0.1 21.5 0.0 20.7 20.1
a. Including the duty.
Source: Authors’ calculations based on data described in the text.
Page
16
of
30
TH
EW
OR
LD
BA
NK
EC
ON
OM
IC
RE
VIE
W
at Purdue University Libraries on August 24, 2010 http://wber.oxfordjournals.org Downloaded from
nearly as large a change in mean land rents. Consequently, expected output indeveloped countries and regions is also lower.
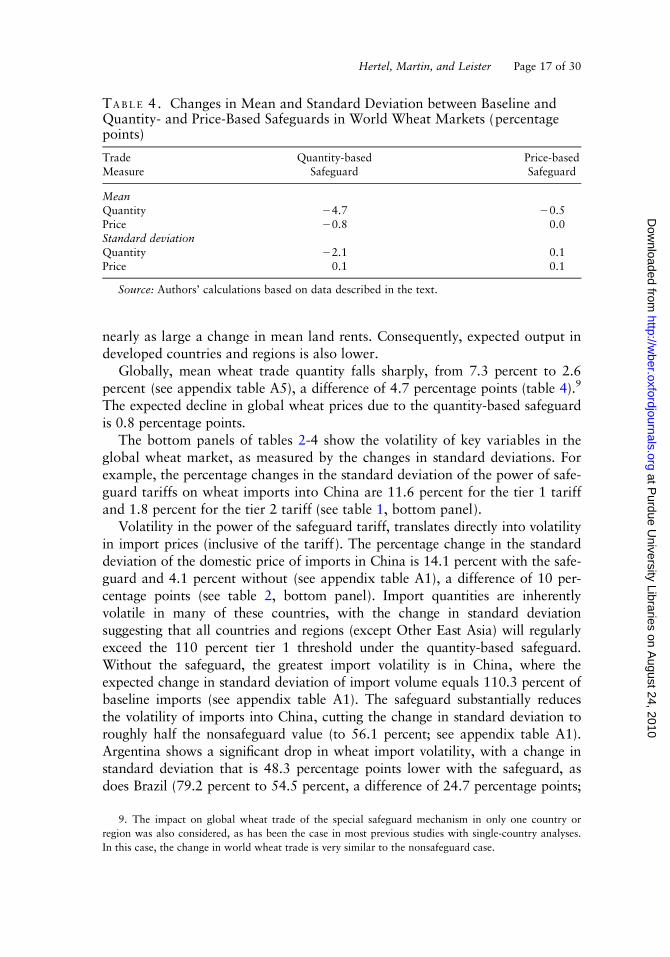
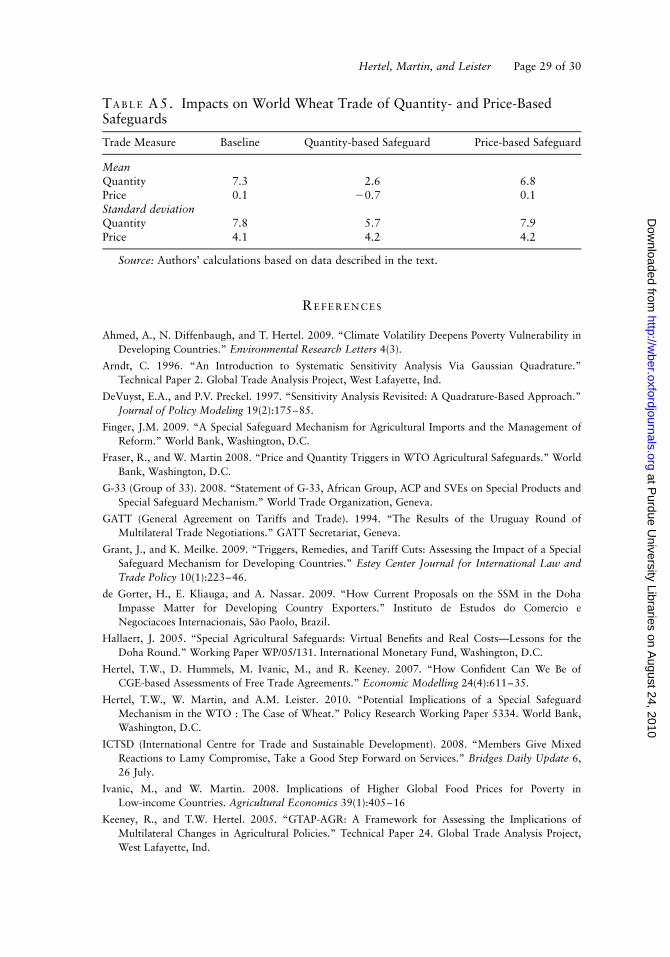
Globally, mean wheat trade quantity falls sharply, from 7.3 percent to 2.6percent (see appendix table A5), a difference of 4.7 percentage points (table 4).9
The expected decline in global wheat prices due to the quantity-based safeguardis 0.8 percentage points.
The bottom panels of tables 2-4 show the volatility of key variables in theglobal wheat market, as measured by the changes in standard deviations. Forexample, the percentage changes in the standard deviation of the power of safe-guard tariffs on wheat imports into China are 11.6 percent for the tier 1 tariffand 1.8 percent for the tier 2 tariff (see table 1, bottom panel).
Volatility in the power of the safeguard tariff, translates directly into volatilityin import prices (inclusive of the tariff). The percentage change in the standarddeviation of the domestic price of imports in China is 14.1 percent with the safe-guard and 4.1 percent without (see appendix table A1), a difference of 10 per-centage points (see table 2, bottom panel). Import quantities are inherentlyvolatile in many of these countries, with the change in standard deviationsuggesting that all countries and regions (except Other East Asia) will regularlyexceed the 110 percent tier 1 threshold under the quantity-based safeguard.Without the safeguard, the greatest import volatility is in China, where theexpected change in standard deviation of import volume equals 110.3 percent ofbaseline imports (see appendix table A1). The safeguard substantially reducesthe volatility of imports into China, cutting the change in standard deviation toroughly half the nonsafeguard value (to 56.1 percent; see appendix table A1).Argentina shows a significant drop in wheat import volatility, with a change instandard deviation that is 48.3 percentage points lower with the safeguard, asdoes Brazil (79.2 percent to 54.5 percent, a difference of 24.7 percentage points;
TA B L E 4. Changes in Mean and Standard Deviation between Baseline andQuantity- and Price-Based Safeguards in World Wheat Markets (percentagepoints)
TradeMeasure
Quantity-basedSafeguard
Price-basedSafeguard
MeanQuantity 24.7 20.5Price 20.8 0.0Standard deviationQuantity 22.1 0.1Price 0.1 0.1
Source: Authors’ calculations based on data described in the text.
9. The impact on global wheat trade of the special safeguard mechanism in only one country or
region was also considered, as has been the case in most previous studies with single-country analyses.
In this case, the change in world wheat trade is very similar to the nonsafeguard case.
Hertel, Martin, and Leister Page 17 of 30
at Purdue U
niversity Libraries on August 24, 2010
http://wber.oxfordjournals.org
Dow
nloaded from
see table 2, bottom panel). All the other countries and regions except Other EastAsia cut their import volume volatility by nearly half, translating into drops inexpected change in standard deviation ranging from 6.9 percentage points to 9.9percentage points.
When duties are imposed on import surges, producer prices become morevolatile (see figure 3). In China, the standard deviation of domestic prices risesfrom 25 percent to 30.8 percent (see appendix table A1), a difference of 5.8percentage points, and in Brazil it rises from 46.2 percent to 50.5 percent, adifference of 4.3 percentage points (see table 2). The impact on land rents ismore complex, with volatility increasing sharply in China and Brazil, butfalling in Argentina, Mexico, Middle East and North Africa, Other East Asia,Rest of Latin America, and Sub-Saharan Africa. Finally, domestic output maybe more stable under the safeguard because in a bad year, when production islow and there is a strong incentive for imports to surge, this competing sourceof supply is frustrated by rising tariffs, thereby lending extra incentive for pro-ducers to offset the weather-induced decline in output.
The bottom panel of table 3 reports changes in the standard deviation ofkey market variables in developed countries, which are little affected by thesafeguards in developing countries. Prices are slightly more volatile in thewheat-exporting regions of Australia, Canada, and the United States as well asin Japan, and output slightly more stable with the quantity-based safeguardthan with no safeguard, but the differences are small. This reflects the predomi-nance of developed countries in global wheat trade. Globally, the volatility ofwheat trade volume is slightly lower with the quantity-based safeguard, whileprice volatility is slightly higher (see table 4).
V I I . I M P L E M E N T I N G T H E P R I C E - B A S E D S P E C I A L S A F E G U A R D
M E C H A N I S M
Under the price-based safeguard, countries can implement a safeguard tariffwhen the import price on a shipment falls below 85 percent of the baselinelevel (three-year moving average). Retaining the previous notation of T for thesafeguard tariff and introducing PR as the ratio of observed price per shipmentto the price trigger yields the complementarity problem T � 0? (PR 2 1) � 0,which implies that either T � 0, (PR 2 1) ¼ 0 (the safeguard is binding) orT ¼ 0,(PR 2 1) � 0 (the safeguard is nonbinding).
Unlike the quantity-based system, there is only one tier in the price-basedsafeguard. In addition, the safeguard tariff imposed can amount to only 85percent of the difference between the shipment price and the baseline price.
There are two key differences between the quantity- and price-based safe-guards. The first has to do with bilateral price differences for wheat, and thesecond has to do with the price-based safeguard’s focus on shipments insteadof average annual imports. Both features are important to the findings and thusdeserve discussion at this point. Turning first to the bilateral price issue,
Page 18 of 30 T H E W O R L D B A N K E C O N O M I C R E V I E W
at Purdue U
niversity Libraries on August 24, 2010
http://wber.oxfordjournals.org
Dow
nloaded from
because the price of each shipment of wheat is compared to a most favorednation average price to evaluate whether the safeguard has been triggered, it isimportant to account for bilateral differences in commodity prices.
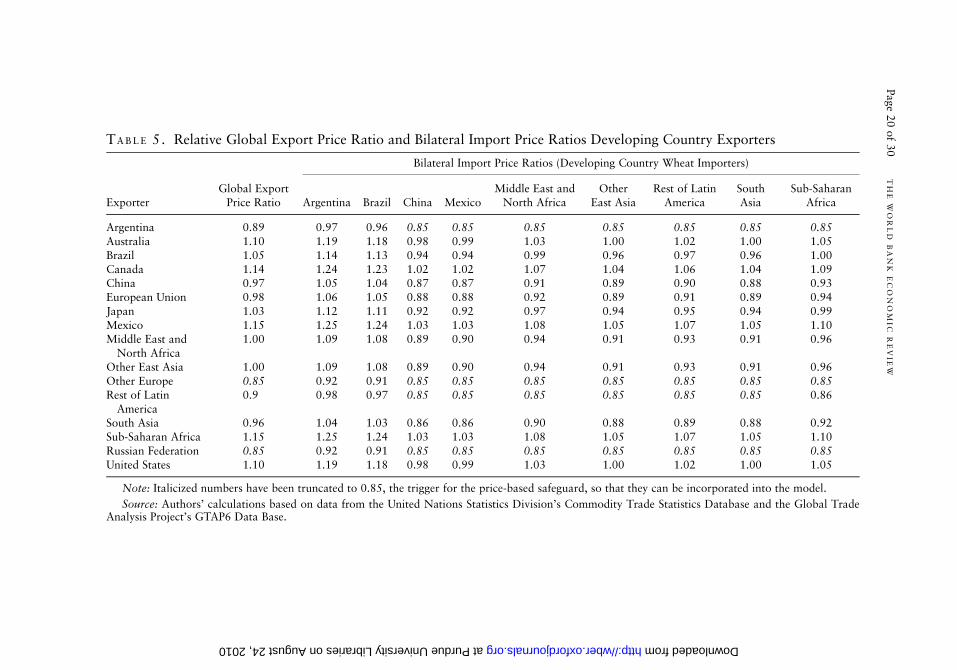
To better understand these bilateral price differences, average unit values forwheat exports from each region in the model over 2000–04 are computed asthe ratio of each region’s export unit value to the global average export unitvalue (table 5, first column). Developing countries show a general tendency forlower prices and developed countries for higher ones, as shown by Schott(2004) for exports in general. But this is not always the case, with some high-income regions specializing in lower price varieties of wheat and some poorercountries having higher unit values. The countries and regions with belowaverage wheat export prices are Argentina, China, Rest of Latin America,South Asia, the European Union, Rest of Europe, and the Russian Federation.Countries and regions with above average unit values are Brazil, Mexico,Sub-Saharan Africa (largely South Africa), Australia, Canada, Japan, and theUnited States.
The remainder of table 5 uses these unit values and the bilateral tradepattern from 2001 to compute the ratio of a given bilateral exporter price tothe average import price in each importing market. Some exporters show sig-nificant variation in the price of their product, relative to other suppliers,across destination markets. For example, Australian bilateral relative pricesrange from 0.98 in China to 1.19 in Argentina. Canadian export price ratiosrange from 1.02 to 1.24. In some cases the ratio falls below the 0.85 triggerpoint specified in the special safeguard mechanism. Therefore, these valueswere truncated at 85 percent of the average import price for use in the empiri-cal model, since values below 0.85 are not permitted. For such exporter-importer pairs, any further decline in price will immediately trigger the specialsafeguard mechanism. In the case of high unit value exporters (such asCanada), export prices will have to fall by more than 15 percent to trigger thespecial safeguard mechanism.
The second key difference between the two safeguards has to do with theapplication of the price trigger on a shipment-by-shipment basis. This contrastswith the year-to-year price volatility reproduced by the model. The price ofgrain varies considerably both within a given year and across suppliers, butmuch of this variability is averaged out in the annual statistics used in themodel. Thus, without any adjustments, the model would not invoke the bilat-eral, shipment-based safeguards with sufficient frequency.
To remedy this problem while retaining the same basic model structure andthe capability to compare results between the quantity- and price-based safe-guards, a multiplicative factor was introduced, kr ¼ abr, that operates on thebilateral c.i.f. prices in the model to compute the appropriate price trigger,ptriggerrs¼ kr pcifrs. Setting the parameter a ¼ 1.15 bridges the gap betweenannual price volatility and the monthly price variations used as a proxy for theshipment-by-shipment volatility data that were unavailable. This factor was
Hertel, Martin, and Leister Page 19 of 30
at Purdue U
niversity Libraries on August 24, 2010
http://wber.oxfordjournals.org
Dow
nloaded from
TA B L E 5. Relative Global Export Price Ratio and Bilateral Import Price Ratios Developing Country Exporters
ExporterGlobal Export
Price Ratio
Bilateral Import Price Ratios (Developing Country Wheat Importers)
Argentina Brazil China MexicoMiddle East and
North AfricaOther
East AsiaRest of Latin
AmericaSouthAsia
Sub-SaharanAfrica
Argentina 0.89 0.97 0.96 0.85 0.85 0.85 0.85 0.85 0.85 0.85Australia 1.10 1.19 1.18 0.98 0.99 1.03 1.00 1.02 1.00 1.05Brazil 1.05 1.14 1.13 0.94 0.94 0.99 0.96 0.97 0.96 1.00Canada 1.14 1.24 1.23 1.02 1.02 1.07 1.04 1.06 1.04 1.09China 0.97 1.05 1.04 0.87 0.87 0.91 0.89 0.90 0.88 0.93European Union 0.98 1.06 1.05 0.88 0.88 0.92 0.89 0.91 0.89 0.94Japan 1.03 1.12 1.11 0.92 0.92 0.97 0.94 0.95 0.94 0.99Mexico 1.15 1.25 1.24 1.03 1.03 1.08 1.05 1.07 1.05 1.10Middle East and
North Africa1.00 1.09 1.08 0.89 0.90 0.94 0.91 0.93 0.91 0.96
Other East Asia 1.00 1.09 1.08 0.89 0.90 0.94 0.91 0.93 0.91 0.96Other Europe 0.85 0.92 0.91 0.85 0.85 0.85 0.85 0.85 0.85 0.85Rest of Latin
America0.9 0.98 0.97 0.85 0.85 0.85 0.85 0.85 0.85 0.86
South Asia 0.96 1.04 1.03 0.86 0.86 0.90 0.88 0.89 0.88 0.92Sub-Saharan Africa 1.15 1.25 1.24 1.03 1.03 1.08 1.05 1.07 1.05 1.10Russian Federation 0.85 0.92 0.91 0.85 0.85 0.85 0.85 0.85 0.85 0.85United States 1.10 1.19 1.18 0.98 0.99 1.03 1.00 1.02 1.00 1.05
Note: Italicized numbers have been truncated to 0.85, the trigger for the price-based safeguard, so that they can be incorporated into the model.
Source: Authors’ calculations based on data from the United Nations Statistics Division’s Commodity Trade Statistics Database and the Global TradeAnalysis Project’s GTAP6 Data Base.
Page
20
of
30
TH
EW
OR
LD
BA
NK
EC
ON
OM
IC
RE
VIE
W
at Purdue University Libraries on August 24, 2010 http://wber.oxfordjournals.org Downloaded from
estimated using monthly price data for Canadian wheat for January 1983–June2008 as a proxy for the prices of individual shipments.10 The second adjustmentfactor, br, is indexed by exporting region and brings bilateral annual prices inline with those observed over the historical period. Together these ensure thatthe frequency with which the bilateral price trigger is activated more accuratelyrepresents the reality of this bilateral, shipment-based measure.
Table 1 also reports the changes in the mean and the standard deviation ofthe power of the bilateral safeguard tariff for eight developing countries andregions. The safeguard tariff now varies, not only by importer (rows) but alsoby the source country or region (columns). The highest mean tariffs areimposed on the low unit value exporters: Argentina, China, Other Europe,Russian Federation, and South Asia. The volatility ranking for the safeguardtariffs is similar, as shown in the bottom panel of table 1, which reports thestandard deviation in the percentage change in the power of the price-basedsafeguard tariff on each bilateral flow.
The price-based safeguard columns in tables 2-4 report the changes inmeans and standard deviations of key variables in developing and developedcountry markets. The price-based safeguard has a much more uniform impacton import prices than the quantity-based safeguard does—slightly raising meanprices in nearly all regions. This is because the bilateral safeguard duty leviedagainst an individual exporter is less likely to vary across importers. With freeon board (f.o.b.) prices to all destinations changing at the same rate, the onlydifferences in these price-based safeguard duties arise due to differential tradeand transport costs as well as differences in the weights determining theaverage import price for each region. Whereas the quantity-based safeguard isdriven largely by domestic supply shocks, the price-based safeguard is drivenprimarily by supply volatility in the exporting countries. Since the compositeimport price is a blend of products from different exporters, there is much lessvariation in the mean import price changes under the price-based safeguardregime. The rise in mean import prices is also smaller because the price-basedsafeguard is imposed on only a subset of the exporting regions, and mostimporters are diversified in their export sourcing of wheat. This stands in sharpcontrast to the quantity-based safeguard, which applies to all import sources.With marginally higher mean (tariff-inclusive) import prices, mean importvolumes are lower than in the non-safeguard case, and mean domestic pricesare higher in each developing country region except Argentina, which reliesheavily on exports that are now facing safeguard tariffs in other developingcountries. Higher domestic prices boost land rents, which translate into slightlyhigher mean output in all developing country regions except Argentina (see
10. The variability of prices across shipments is largely captured by the variability across suppliers
and the intertemporal variability across months included in the analysis. However, other elements, such
as variation across wheat varieties, can make the variance across prices of shipments even greater than
is captured in the analysis. Given this, the analysis is expected to provide a lower bound estimate of the
frequency with which the price-based safeguard is invoked.
Hertel, Martin, and Leister Page 21 of 30
at Purdue U
niversity Libraries on August 24, 2010
http://wber.oxfordjournals.org
Dow
nloaded from
table 2, top panel). The expected change in global wheat exports falls from 7.3percent to 6.8 percent (see appendix table A5), a difference of 0.5 percentagepoint (see table 4), and there is no difference in the mean global export price.
The bottom panels of tables 2–4 report the changes in standard deviationsassociated with the percentage changes in market variables in the developingand developed country markets, as well as for global trade, as a result of theprice-based safeguard. Import quantities are more volatile in five of the ninedeveloping country regions, while domestic prices are more volatile in sevendeveloping country regions. Global wheat export price volatility rises slightly—from 4.1 percent to 4.2 percent (see appendix table A5), for a difference of 0.1percentage point (see table 4). Once this is taken into account, this measureappears to actually increase the volatility of domestic prices in most developingcountries. This result highlights the pitfalls of approaches such as that used byValdes and Foster (2005) that ignore the impacts of such a measure on worldprices.
V I I I . C O M P A R I S O N O F P R I C E - A N D Q U A N T I T Y - B A S E D S A F E G U A R D S
Having analyzed the quantity- and price-based safeguards separately, the dis-cussion now turns to comparing the two types of safeguards using the resultsin tables 2–4.
The quantity-based safeguard tends to boost tariff-laden import prices bymuch more than the price-based safeguard in developing countries, and theimpacts vary more across importing countries. In China, the quantity-basedsafeguard boosts mean duty-laden import prices 10.2 percent while the price-based safeguard raises them less than 1 percent. Higher mean prices forimports in the domestic market translate into lower mean import quantities.The quantity-based safeguard also boosts domestic prices, land rents, andoutput by a larger amount in all but two developing country regions(Argentina and Other East Asia). These larger changes are mirrored by largeroutput reductions in developed countries because the price-based safeguardtends to discriminate against low unit value exporters, which tend to be devel-oping countries (as well as the European Union).
While the quantity-based safeguard boosts import price variability in alldeveloping country cases (see table 2, bottom panel), the price-based safeguardhas a mixed effect on the standard deviation of tariff-laden import prices. Thestandard deviation of import prices is lower in four of the nine developingcountry regions but in none of the developed country regions. Import volatilitydecreases sharply with the quantity-based safeguard for all developing countryregions but increases under the price-based safeguard in five of them. Domesticprice volatility rises in seven developing country regions because of theincreased volatility of export prices resulting from the price-based safeguard.The quantity-based safeguard increases domestic price volatility for all develop-ing country regions except Argentina.
Page 22 of 30 T H E W O R L D B A N K E C O N O M I C R E V I E W
at Purdue U
niversity Libraries on August 24, 2010
http://wber.oxfordjournals.org
Dow
nloaded from
Finally, with the quantity-based safeguard, the expected volume of worldtrade is substantially reduced, whereas the price-based safeguard appears to beless damaging to global trade levels. Both types of safeguards boost worldprice volatility (see table 4).
I X . C O N C L U S I O N S
The special safeguard mechanism has been a controversial feature of the recentWTO negotiations under the Doha Development Agenda. Some advocatesargue that it is needed to protect low-income domestic producers from the vag-aries of world markets. However, economic principles suggest that widespreaduse could destabilize world prices and deny domestic consumers access toaffordable imports in the case of domestic shortages. This article investigatesthe key components of the special safeguard mechanism proposed in the draftWTO modalities of December 2008. It includes provisions for both quantity-and price-based safeguard measures and shows that these safeguards operate invery different ways.
The empirical analysis is conducted by stochastically simulating a model ofthe world wheat market. The findings suggest that the quantity-based safeguardis an order of magnitude more damaging to world trade than the price-basedsafeguard is. The quantity-based safeguard reduces imports, raises domesticprices, and boosts mean domestic production in the countries and regions thatuse it. Rather than insulating countries that use it from price volatility, themeasure could increase price volatility in developing countries by restrictingimports when they would otherwise alleviate the adverse impacts of harvestshortfalls. Based on the specified triggers and duties, the quantity-based safe-guard would shrink the expected value of wheat imports by nearly 50 percentin some regions, with overall world wheat trade falling by 4.7 percent. A morerestrictive scenario under which the full permitted duty is used wheneverimports have reached the trigger in the past 12 months could result in evenlarger reductions in imports and greater volatility.
The price-based safeguard is less damaging to world trade because it isapplied on a bilateral basis and since countries import wheat from a variety ofsources, the impact of a safeguard tariff on some suppliers is diluted. The sameis true of the impacts of the price-based safeguard on prices and production.The results suggest that the price-based safeguard would actually increase thevolatility of producer prices in seven of the nine developing country regionsconsidered, with trading partners potentially applying the safeguard when thecountry has a good harvest and increases its exports.
Part of the rationale for the special safeguard mechanism is a concern thatshocks from world markets could have adverse impacts on vulnerable produ-cers and consumers in developing countries. However, by imposing the dutiespermitted under the safeguard, developing countries are likely to increase,rather than decrease, the volatility of prices in domestic markets. If the
Hertel, Martin, and Leister Page 23 of 30
at Purdue U
niversity Libraries on August 24, 2010
http://wber.oxfordjournals.org
Dow
nloaded from
flexibility it provides to raise protection on agricultural products is to be used,it is important to consider the actual impacts of such duties on domestic out-comes, rather than to mechanically implement the duties provided for underthe special safeguard mechanism proposal.
Unfortunately, developing countries that opt not to use the safeguard maystill see the volatility of their producer prices increase as a result of greaterworld price instability induced by countries that do employ the safeguard. Thisis particularly troublesome if increased greenhouse gas concentrations in theatmosphere give rise to greater climate volatility and hence greater volatility inthe production of staple food products (Ahmed, Diffenbaugh, and Hertel2009).
In closing, many of the main arguments in favor of the special safeguardmechanism focus on the well-being of vulnerable agricultural producers. Yetmany rural residents of poor countries are net purchasers of food, and in manycountries urban poverty is growing ever more significant. In this context, thepotential for policies based on the safeguard rules to lessen poverty vulner-ability seems very questionable. Future work should take into account thepoverty dimension of the special safeguard mechanism as well as the broaddynamics considered in this article.
Page 24 of 30 T H E W O R L D B A N K E C O N O M I C R E V I E W
at Purdue U
niversity Libraries on August 24, 2010
http://wber.oxfordjournals.org
Dow
nloaded from
TA B L E A1. Percentage Change in Mean and Standard Deviation for Key Variables in Developing Country Wheat Marketswith Quantity-Based Safeguard
Country or Region
Import pricea Import quantity Producer price Land rents Output
NoSafeguard Safeguard
NoSafeguard Safeguard
NoSafeguard Safeguard
NoSafeguard Safeguard
NoSafeguard Safeguard
MeanArgentina 21.7 4.1 41.3 25.6 4.2 2.3 10.9 3.3 3.9 1.4Brazil 2.3 16.6 19.4 23.7 16.1 19.6 2.7 23.1 0.7 5.3China 0.5 10.7 41.1 23.3 3.7 8.4 23.7 10.2 22.1 1.3Mexico 0.6 4.1 1.8 24.0 1.0 2.7 1.5 7.7 0.7 3.0Middle East and
North Africa20.2 1.9 2.5 22.2 0.5 1.2 21.0 2.4 20.3 0.9
Other East Asia 0.3 20.5 0.0 0.2 0.7 0.2 2.8 0.0 0.4 20.5Rest of Latin
America0.3 3.3 3.3 23.1 1.2 2.2 2.2 6.1 0.9 2.2
South Asia 0.1 3.4 3.3 22.2 1.3 2.3 20.1 2.6 20.3 0.5Sub-Saharan Africa 20.1 2.9 3.1 23.9 0.8 1.5 22.0 5.5 20.7 2.4Standard deviationArgentina 6.0 8.6 69.5 21.2 11.9 11.7 29.6 24.8 23.7 22.6Brazil 8.7 21.7 79.2 54.5 46.2 50.5 11.2 29.0 35.2 29.7China 4.1 14.1 110.3 56.1 25.0 30.8 11.6 27.4 12.8 8.8Mexico 4.7 6.8 22.1 14.4 8.1 10.4 17.6 11.3 16.4 13.1Middle East and
North Africa3.9 5.3 20.0 13.1 8.0 9.1 8.6 5.8 11.1 9.1
Other East Asia 4.6 4.8 0.9 0.9 5.5 5.6 29.8 29.6 16.9 16.9Rest of Latin
America4.2 6.3 21.6 14.0 8.3 10.2 13.8 8.7 13.4 10.2
South Asia 4.4 7.2 20.4 12.9 12.9 14.2 6.1 9.5 8.7 7.7Sub-Saharan Africa 4.0 6.1 25.3 15.4 9.6 10.6 15.8 9.4 16.1 11.5
a. Including the duty.
Source: Authors’ calculations based on data described in the text.
A P P E N D I X
Hertel,
Martin
,an
dL
eisterPage
25
of
30
at Purdue University Libraries on August 24, 2010 http://wber.oxfordjournals.org Downloaded from
TA B L E A2. Percentage Change in Mean and Standard Deviation for Key Variables in Developed Country Wheat Marketswith Quantity-Based Safeguard
Country orRegion
Import Pricea Import Quantity Producer Price Land Rents Output
NoSafeguard Safeguard
NoSafeguard Safeguard
NoSafeguard Safeguard
NoSafeguard Safeguard
NoSafeguard Safeguard
MeanAustralia 27.4 27.5 57.7 52.7 1.0 0.1 6.1 20.6 2.5 20.5Canada 21.0 21.6 10.7 8.7 1.0 0.0 8.1 20.7 3.8 20.7European Union 20.2 20.5 1.7 2.0 0.6 0.4 2.0 20.2 1.2 20.1Japan 0.4 20.4 0.0 0.2 0.6 0.1 4.6 0.4 0.6 20.8Other Europe 22.0 22.5 28.7 30.5 3.2 3.1 0.2 20.4 0.0 20.3Russian
Federation23.1 23.3 42.7 43.7 7.3 7.2 0.5 0.2 21.5 21.7
United States 0.5 20.5 4.1 4.8 1.0 0.3 3.3 20.8 1.5 20.3Standard deviationAustralia 8.0 8.2 58.2 57.9 6.4 6.6 41.0 38.5 28.5 27.7Canada 5.1 5.2 20.8 20.6 4.8 4.8 30.2 28.3 20.7 19.9European Union 4.6 4.6 3.8 3.9 6.0 6.0 11.5 11.3 11.3 11.0Japan 4.5 4.6 2.0 2.1 4.5 4.6 34.6 34.2 15.6 15.6Other Europe 4.6 4.6 68.0 69.0 19.1 19.0 5.6 5.6 16.8 16.7Russian
Federation15.5 15.4 69.3 70.5 31.1 31.0 14.2 14.2 17.7 17.7
United States 4.4 4.4 22.2 22.6 6.1 6.3 16.0 14.5 13.9 13.2
a. Including the duty.
Source: Authors’ calculations based on data described in the text.
Page
26
of
30
TH
EW
OR
LD
BA
NK
EC
ON
OM
IC
RE
VIE
W
at Purdue University Libraries on August 24, 2010 http://wber.oxfordjournals.org Downloaded from
TA B L E A3. Percentage Change in Mean and Standard Deviation for Key Variables in Developing Country Wheat Marketswith Price-Based Safeguard
Country or Region
Import Pricea Import Quantity Producer Price Land Rents Output
NoSafeguard Safeguard
NoSafeguard Safeguard
NoSafeguard Safeguard
NoSafeguard Safeguard
NoSafeguard Safeguard
MeanArgentina 21.7 21.2 41.3 34 4.2 2.7 10.9 4.2 3.9 1.3Brazil 2.3 3.0 19.4 18.1 16 16.1 2.7 3.3 0.7 1.0China 0.5 1.0 41.1 39.5 3.7 3.8 23.7 23.4 22.1 22.1Mexico 0.6 0.9 1.8 1.3 1.0 1.1 1.5 2.0 0.7 0.9Middle East and North
Africa20.2 0.6 2.5 0.9 0.5 0.7 21.0 0.2 20.3 0.2
Other East Asia 0.3 1.0 0.0 0.0 0.7 1.1 2.8 5.2 0.4 1.1Rest of Latin America 0.3 0.9 3.3 2.1 1.2 1.4 2.2 3.0 0.9 1.2South Asia 0.1 0.7 3.3 2.3 1.3 1.4 20.1 0.2 20.3 20.2Sub-Saharan Africa 20.1 0.5 3.1 1.9 0.8 0.9 22.0 20.5 20.7 0.0Standard deviationArgentina 4.7 6.1 22.1 73.8 8.1 13.7 17.6 27.6 16.4 21.5Brazil 6.0 8.1 69.5 79.7 11.9 46.2 29.6 10.5 23.7 35.2China 8.0 4.2 58.2 109.6 6.4 25.2 41.0 12.1 28.5 12.7Mexico 4.4 4.7 22.2 22.1 6.1 8.1 16.0 17.7 13.9 16.4Middle East and North
Africa15.5 4.0 69.3 19.9 31.1 8.0 14.2 8.5 17.7 11.1
Other East Asia 4.5 4.8 2.0 0.9 4.5 5.6 34.6 30.6 15.6 16.9Rest of Latin America 8.7 4.3 79.2 21.7 46.2 8.4 11.2 13.4 35.2 13.3South Asia 4.6 4.5 0.9 20.5 5.5 13.0 29.8 6.3 16.9 8.7Sub-Saharan Africa 3.9 4.1 20.0 25.1 8.0 9.6 8.6 15.9 11.1 16.2
a. Including the duty.
Source: Authors’ calculations based on data described in the text.
Hertel,
Martin
,an
dL
eisterPage
27
of
30
at Purdue University Libraries on August 24, 2010 http://wber.oxfordjournals.org Downloaded from

TA B L E A4. Percentage Change in Mean and Standard Deviation for Key Variables in Developed Country Wheat Marketswith Price-Based Safeguard
Country orRegion
Import Pricea Import Quantity Producer Price Land Rents Output
NoSafeguard Safeguard
NoSafeguard Safeguard
NoSafeguard Safeguard
NoSafeguard Safeguard
NoSafeguard Safeguard
MeanAustralia 27.4 27.7 57.7 62.2 1.0 1.2 6.1 6.7 2.5 2.8Canada 21.0 20.9 10.7 11.1 1.0 1.3 8.1 10.1 3.8 4.8European Union 20.2 20.2 1.7 1.8 0.6 0.6 2.0 2.4 1.2 1.4Japan 0.4 0.6 0.0 20.1 0.6 0.7 4.6 5.6 0.6 0.9Other Europe 22.0 22.5 28.7 30.0 3.2 3.0 0.2 20.8 0.0 20.6Russian
Federation23.1 23.3 42.7 42.9 7.3 7.1 0.5 20.3 21.5 22.0
United States 0.5 0.7 4.1 4.4 1.0 1.2 3.3 4.6 1.5 2.1Standard deviationAustralia 8.0 8.3 58.2 63.1 6.4 6.6 41.0 39.1 28.5 27.8Canada 5.1 5.1 20.8 20.8 4.8 4.8 30.2 30.4 20.7 20.7European Union 4.6 4.6 3.8 3.8 6.0 6.0 11.5 11.4 11.3 11.3Japan 4.5 4.5 2.0 2.0 4.5 4.5 34.6 34.9 15.6 15.6Other Europe 4.6 4.7 68.0 68.7 19.1 19.2 5.6 5.8 16.8 16.3Russian
Federation15.5 15.6 69.3 69.6 31.1 31.2 14.2 14.9 17.7 17.1
United States 4.4 4.4 22.2 22.2 6.1 6.2 16.0 16.0 13.9 13.8
a. Including the duty.
Source: Authors’ calculations based on data described in the text.
Page
28
of
30
TH
EW
OR
LD
BA
NK
EC
ON
OM
IC
RE
VIE
W
at Purdue University Libraries on August 24, 2010 http://wber.oxfordjournals.org Downloaded from
TA B L E A5. Impacts on World Wheat Trade of Quantity- and Price-BasedSafeguards
Trade Measure Baseline Quantity-based Safeguard Price-based Safeguard
MeanQuantity 7.3 2.6 6.8Price 0.1 20.7 0.1Standard deviationQuantity 7.8 5.7 7.9Price 4.1 4.2 4.2
Source: Authors’ calculations based on data described in the text.
RE F E R E N C E S
Ahmed, A., N. Diffenbaugh, and T. Hertel. 2009. “Climate Volatility Deepens Poverty Vulnerability in
Developing Countries.” Environmental Research Letters 4(3).
Arndt, C. 1996. “An Introduction to Systematic Sensitivity Analysis Via Gaussian Quadrature.”
Technical Paper 2. Global Trade Analysis Project, West Lafayette, Ind.
DeVuyst, E.A., and P.V. Preckel. 1997. “Sensitivity Analysis Revisited: A Quadrature-Based Approach.”
Journal of Policy Modeling 19(2):175–85.
Finger, J.M. 2009. “A Special Safeguard Mechanism for Agricultural Imports and the Management of
Reform.” World Bank, Washington, D.C.
Fraser, R., and W. Martin 2008. “Price and Quantity Triggers in WTO Agricultural Safeguards.” World
Bank, Washington, D.C.
G-33 (Group of 33). 2008. “Statement of G-33, African Group, ACP and SVEs on Special Products and
Special Safeguard Mechanism.” World Trade Organization, Geneva.
GATT (General Agreement on Tariffs and Trade). 1994. “The Results of the Uruguay Round of
Multilateral Trade Negotiations.” GATT Secretariat, Geneva.
Grant, J., and K. Meilke. 2009. “Triggers, Remedies, and Tariff Cuts: Assessing the Impact of a Special
Safeguard Mechanism for Developing Countries.” Estey Center Journal for International Law and
Trade Policy 10(1):223–46.
de Gorter, H., E. Kliauga, and A. Nassar. 2009. “How Current Proposals on the SSM in the Doha
Impasse Matter for Developing Country Exporters.” Instituto de Estudos do Comercio e
Negociacoes Internacionais, Sao Paolo, Brazil.
Hallaert, J. 2005. “Special Agricultural Safeguards: Virtual Benefits and Real Costs—Lessons for the
Doha Round.” Working Paper WP/05/131. International Monetary Fund, Washington, D.C.
Hertel, T.W., D. Hummels, M. Ivanic, M., and R. Keeney. 2007. “How Confident Can We Be of
CGE-based Assessments of Free Trade Agreements.” Economic Modelling 24(4):611–35.
Hertel, T.W., W. Martin, and A.M. Leister. 2010. “Potential Implications of a Special Safeguard
Mechanism in the WTO : The Case of Wheat.” Policy Research Working Paper 5334. World Bank,
Washington, D.C.
ICTSD (International Centre for Trade and Sustainable Development). 2008. “Members Give Mixed
Reactions to Lamy Compromise, Take a Good Step Forward on Services.” Bridges Daily Update 6,
26 July.
Ivanic, M., and W. Martin. 2008. Implications of Higher Global Food Prices for Poverty in
Low-income Countries. Agricultural Economics 39(1):405–16
Keeney, R., and T.W. Hertel. 2005. “GTAP-AGR: A Framework for Assessing the Implications of
Multilateral Changes in Agricultural Policies.” Technical Paper 24. Global Trade Analysis Project,
West Lafayette, Ind.
Hertel, Martin, and Leister Page 29 of 30
at Purdue U
niversity Libraries on August 24, 2010
http://wber.oxfordjournals.org
Dow
nloaded from
Martin, W., and J. Alston. 1994. “A Dual Approach to Evaluating Research Benefits in the Presence of
Trade Distortions.” American Journal of Agricultural Economics 76(1):26–35.
———. 1997. “Producer Surplus without Apology? Evaluating Investments in R&D.” Economic
Record 73(221):146–58.
Martin, W., and A. Mattoo. 2008. “The Doha Development Agenda: What’s on the Table?” Policy
Research Working Paper 4672. World Bank, Washington, D.C.
Montemayor, R. 2007. “Implications of Proposed Modalities for the Special Safeguard Mechanism A
Simulation Exercise.” Issue Paper 10. International Center for Trade and Sustainable Development,
Geneva.
———. 2008. “How Will the May 2008 ‘Modalities’ Text Affect Access to the Special Safeguard
Mechanism, and the Effectiveness of Additional Safeguard Duties?” Issue Paper 15. International
Center for Trade and Sustainable Development, Geneva.
Morrison, J., and R. Sharma. 2005. “Modalities for an SSM: Product Eligibility and Alternative
Triggers.” Presentation to the Informal ICTSD Dialog on Special Products and the SSM, November
25, Geneva.
Pearson, K., and C. Arndt. 2000. “Implementing Systematic Sensitivity Analysis Using GEMPACK.”
Technical Paper 3. Global Trade Analysis Project, West Lafayette, Ind.
Schott, P. 2004. “Across-Product versus Within-Product Specialization in International Trade.”
Quarterly Journal of Economics 119(2):647–78.
Sen, A. 1981. Poverty and Famines: An Essay on Entitlement and Deprivation. Oxford, U.K.: Oxford
University Press.
South Centre. 2009. “The Volume-Based Special Safeguard Mechanism: Analysis of the Conditionalities
in the December 2008 WTO Agriculture Chair’s Texts.” Analytical Note SC/TDP/AN/AG/9. South
Centre, Geneva.
Tyers, R., and K. Anderson. 1992. Disarray in World Food Markets: A Quantitative Assessment
Cambridge, U.K.: Cambridge University Press.
Uri, N., and E.D. Beach. 1997. “A Note on Quality Differences and United States/Canadian Wheat
Trade.” Food Policy 22(4):359–67.
Valdes, A., and W. Foster. 2005. “The New SSM: A Price Floor Mechanism for Developing Countries.”
International Centre for Trade and Sustainable Development, Geneva.
Valenzuela, E., T.W. Hertel, R. Keeney, and J.J. Reimer. 2007. “Assessing Global CGE Model Validity
Using Agricultural Price Volatility.” American Journal of Agricultural Economics 89(2):382–97.
Wolfe, R. 2009. “The Special Safeguard Fiasco in the WTO: The Perils of Inadequate Analysis and
Negotiation.” Working Paper. Groupe d’Economie Mondiale, Paris.
WTO (World Trade Organization). 2008a. “Revised Draft Modalities for Agriculture.” TN/AG/W/4/
Rev.4 and TN/AG/W/7. Committee on Agriculture, Special Session, World Trade Organization,
Geneva.
———. 2008b. “An Unofficial Guide to Agricultural Safeguards: GATT, Old Agricultural (SSG) and
New Mechanism (SSM).” [www.wto.org/english/tratop_e/agric_e/guide_agric_safeg_e.htm].
Page 30 of 30 T H E W O R L D B A N K E C O N O M I C R E V I E W
at Purdue U
niversity Libraries on August 24, 2010
http://wber.oxfordjournals.org
Dow
nloaded from