Embed Size (px)
Citation preview
THE POTENTIAL IMPACTS OF CLIMATE CHANGE ON DETROIT, MICHIGAN
Draft Document. Do not cite. Last updated: 6/3/2014
Key Challenges
Detroit is a city rich with cultural tradition.
Surrounded by the beauty of the Great Lakes, it serves
as a commercial, financial, and transportation center
for the region.
Detroit will face many of the same changes in
climate as the surrounding geographic area, but the
city’s specific vulnerabilities will be determined
primarily by other factors. Land use, pre-
existing infrastructure design, and
socioeconomic capacity are among many
characteristics that will either reveal strengths
or pose obstacles in adapting to climate change.
There are many potential impacts of climate
change that cut across many sectors and
jurisdictions. Detroit is expected to face the
following critical challenges in the coming
decades:
As average temperatures rise throughout
the region, the probability of heat waves
and hot days will grow, increasing the risk
of heat-related illnesses.
As severe rainstorms become more
frequent and more intense, flooding will
increase the risk of sewage overflows and
water contamination.
Infrastructure will face challenges, such as
direct damage due to weather and
increasing demands for services during
heat waves.
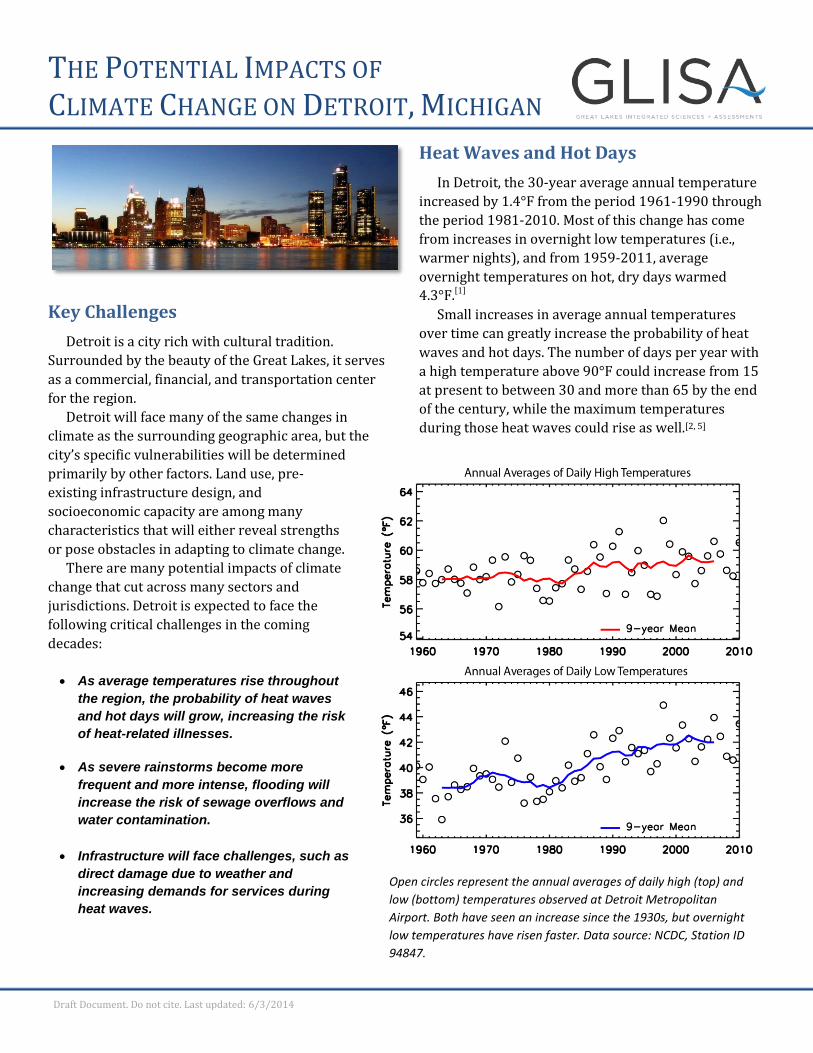
Heat Waves and Hot Days
In Detroit, the 30-year average annual temperature
increased by 1.4°F from the period 1961-1990 through
the period 1981-2010. Most of this change has come
from increases in overnight low temperatures (i.e.,
warmer nights), and from 1959-2011, average
overnight temperatures on hot, dry days warmed
4.3°F.[1]
Small increases in average annual temperatures
over time can greatly increase the probability of heat
waves and hot days. The number of days per year with
a high temperature above 90°F could increase from 15
at present to between 30 and more than 65 by the end
of the century, while the maximum temperatures
during those heat waves could rise as well.[2, 5]
Open circles represent the annual averages of daily high (top) and
low (bottom) temperatures observed at Detroit Metropolitan
Airport. Both have seen an increase since the 1930s, but overnight
low temperatures have risen faster. Data source: NCDC, Station ID
94847.
THE POTENTIAL IMPACTS OF CLIMATE CHANGE ON DETROIT, MI
2 Draft Document. Do not cite. Last updated: 6/3/2014
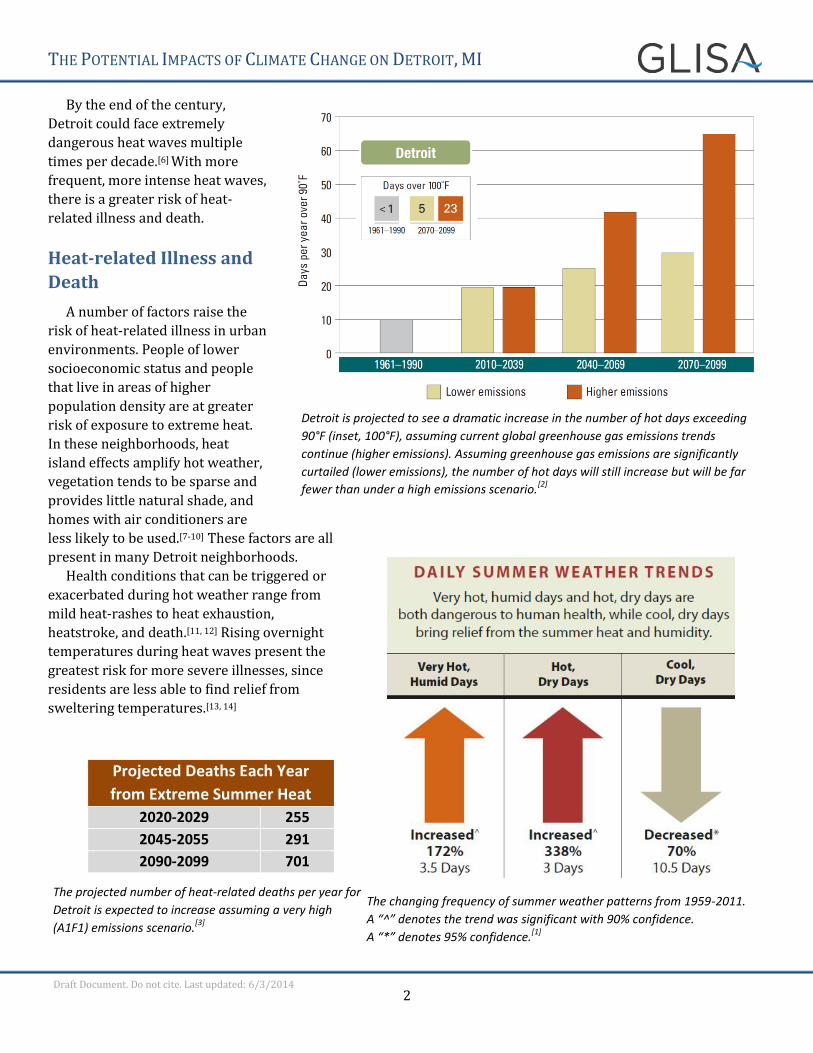
By the end of the century,
Detroit could face extremely
dangerous heat waves multiple
times per decade.[6] With more
frequent, more intense heat waves,
there is a greater risk of heat-
related illness and death.
Heat-related Illness and
Death
A number of factors raise the
risk of heat-related illness in urban
environments. People of lower
socioeconomic status and people
that live in areas of higher
population density are at greater
risk of exposure to extreme heat.
In these neighborhoods, heat
island effects amplify hot weather,
vegetation tends to be sparse and
provides little natural shade, and
homes with air conditioners are
less likely to be used.[7-10] These factors are all
present in many Detroit neighborhoods.
Health conditions that can be triggered or
exacerbated during hot weather range from
mild heat-rashes to heat exhaustion,
heatstroke, and death.[11, 12] Rising overnight
temperatures during heat waves present the
greatest risk for more severe illnesses, since
residents are less able to find relief from
sweltering temperatures.[13, 14]
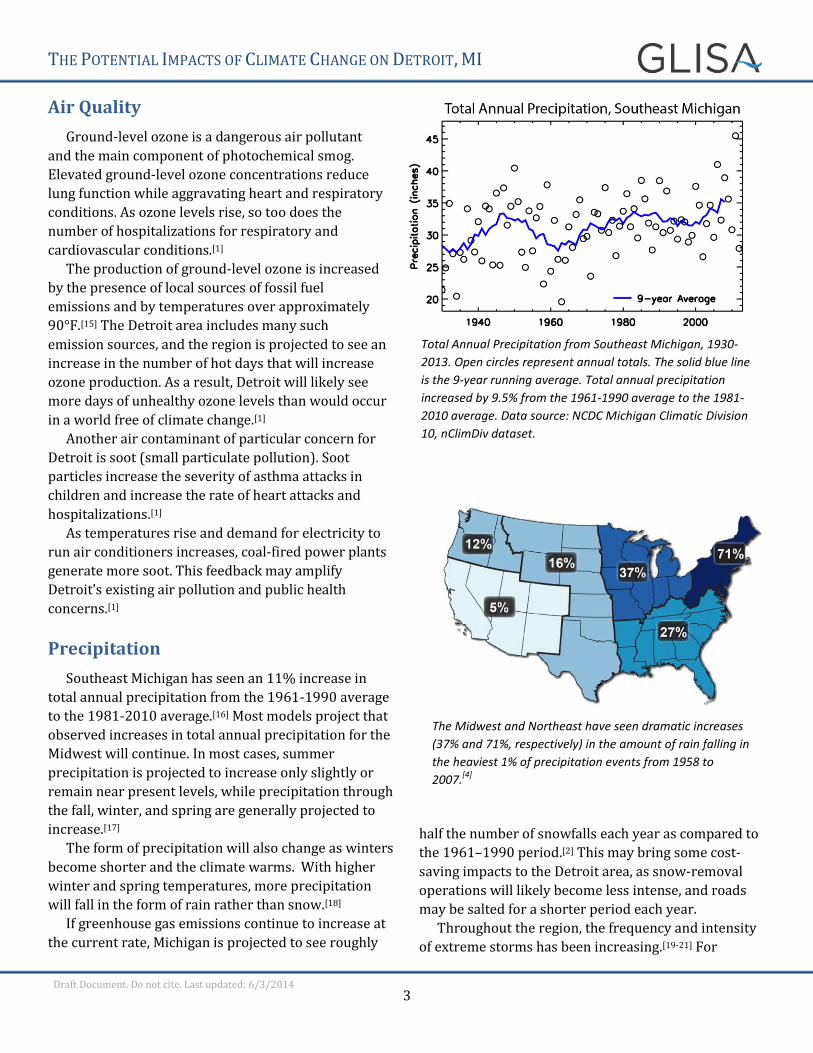
The changing frequency of summer weather patterns from 1959-2011.
A “^” denotes the trend was significant with 90% confidence.
A “*” denotes 95% confidence.[1]
Detroit is projected to see a dramatic increase in the number of hot days exceeding
90°F (inset, 100°F), assuming current global greenhouse gas emissions trends
continue (higher emissions). Assuming greenhouse gas emissions are significantly
curtailed (lower emissions), the number of hot days will still increase but will be far
fewer than under a high emissions scenario.[2]
Projected Deaths Each Year
from Extreme Summer Heat
2020-2029 255
2045-2055 291
2090-2099 701
The projected number of heat-related deaths per year for
Detroit is expected to increase assuming a very high
(A1F1) emissions scenario.[3]
THE POTENTIAL IMPACTS OF CLIMATE CHANGE ON DETROIT, MI
3 Draft Document. Do not cite. Last updated: 6/3/2014
Air Quality
Ground-level ozone is a dangerous air pollutant
and the main component of photochemical smog.
Elevated ground-level ozone concentrations reduce
lung function while aggravating heart and respiratory
conditions. As ozone levels rise, so too does the
number of hospitalizations for respiratory and
cardiovascular conditions.[1]
The production of ground-level ozone is increased
by the presence of local sources of fossil fuel
emissions and by temperatures over approximately
90°F.[15] The Detroit area includes many such
emission sources, and the region is projected to see an
increase in the number of hot days that will increase
ozone production. As a result, Detroit will likely see
more days of unhealthy ozone levels than would occur
in a world free of climate change.[1]
Another air contaminant of particular concern for
Detroit is soot (small particulate pollution). Soot
particles increase the severity of asthma attacks in
children and increase the rate of heart attacks and
hospitalizations.[1]
As temperatures rise and demand for electricity to
run air conditioners increases, coal-fired power plants
generate more soot. This feedback may amplify
Detroit’s existing air pollution and public health
concerns.[1]
Precipitation
Southeast Michigan has seen an 11% increase in
total annual precipitation from the 1961-1990 average
to the 1981-2010 average.[16] Most models project that
observed increases in total annual precipitation for the
Midwest will continue. In most cases, summer
precipitation is projected to increase only slightly or
remain near present levels, while precipitation through
the fall, winter, and spring are generally projected to
increase.[17]
The form of precipitation will also change as winters
become shorter and the climate warms. With higher
winter and spring temperatures, more precipitation
will fall in the form of rain rather than snow.[18]
If greenhouse gas emissions continue to increase at
the current rate, Michigan is projected to see roughly
half the number of snowfalls each year as compared to
the 1961–1990 period.[2] This may bring some cost-
saving impacts to the Detroit area, as snow-removal
operations will likely become less intense, and roads
may be salted for a shorter period each year.
Throughout the region, the frequency and intensity
of extreme storms has been increasing.[19-21] For
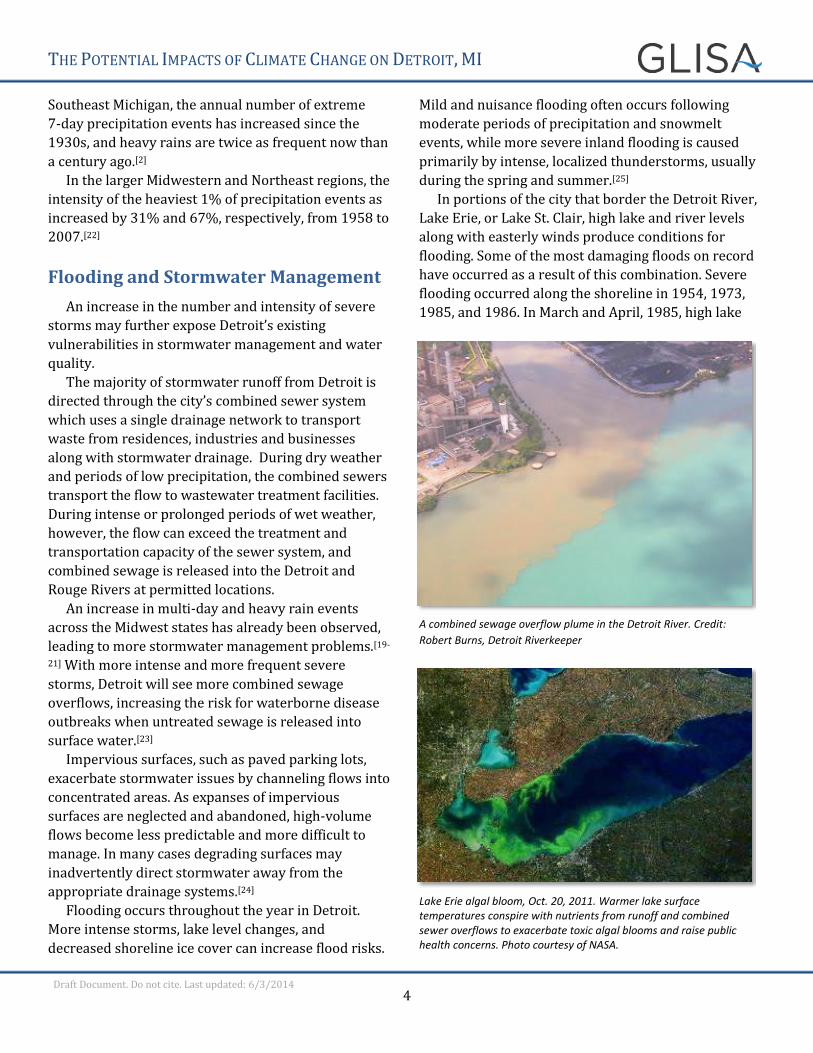
Total Annual Precipitation from Southeast Michigan, 1930-
2013. Open circles represent annual totals. The solid blue line
is the 9-year running average. Total annual precipitation
increased by 9.5% from the 1961-1990 average to the 1981-
2010 average. Data source: NCDC Michigan Climatic Division
10, nClimDiv dataset.
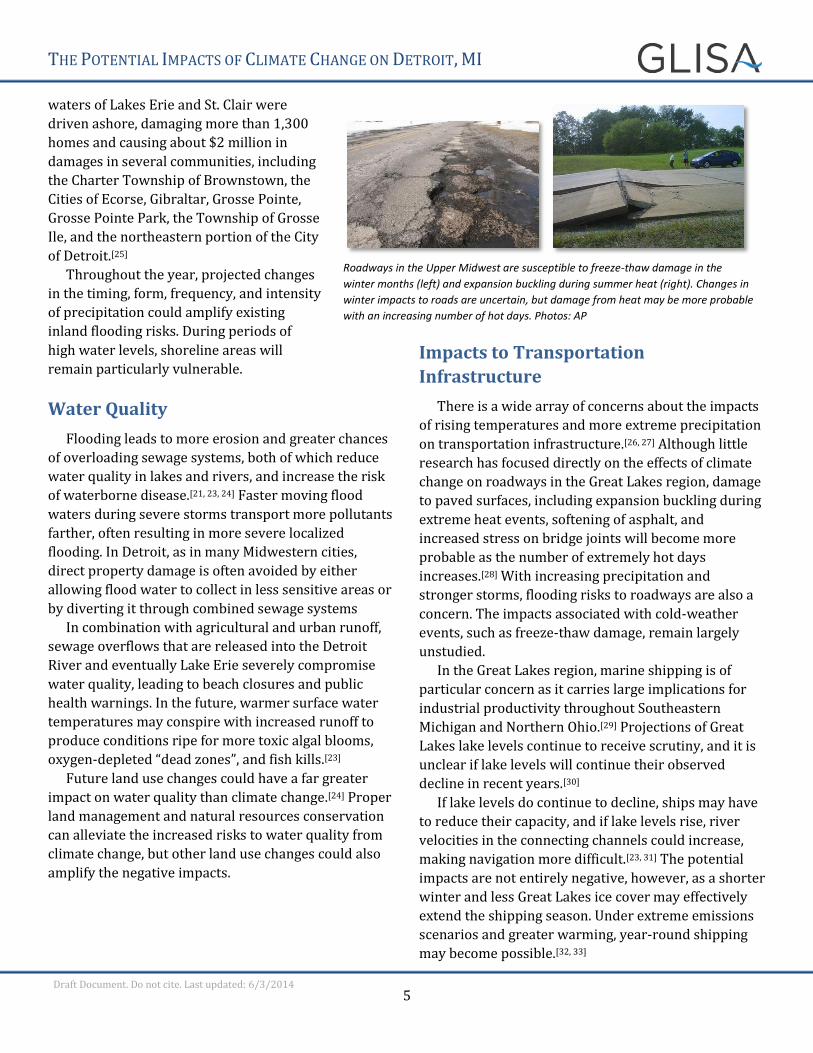
The Midwest and Northeast have seen dramatic increases
(37% and 71%, respectively) in the amount of rain falling in
the heaviest 1% of precipitation events from 1958 to
2007.[4]
THE POTENTIAL IMPACTS OF CLIMATE CHANGE ON DETROIT, MI
4 Draft Document. Do not cite. Last updated: 6/3/2014
Southeast Michigan, the annual number of extreme
7-day precipitation events has increased since the
1930s, and heavy rains are twice as frequent now than
a century ago.[2]
In the larger Midwestern and Northeast regions, the
intensity of the heaviest 1% of precipitation events as
increased by 31% and 67%, respectively, from 1958 to
2007.[22]
Flooding and Stormwater Management
An increase in the number and intensity of severe
storms may further expose Detroit’s existing
vulnerabilities in stormwater management and water
quality.
The majority of stormwater runoff from Detroit is
directed through the city’s combined sewer system
which uses a single drainage network to transport
waste from residences, industries and businesses
along with stormwater drainage. During dry weather
and periods of low precipitation, the combined sewers
transport the flow to wastewater treatment facilities.
During intense or prolonged periods of wet weather,
however, the flow can exceed the treatment and
transportation capacity of the sewer system, and
combined sewage is released into the Detroit and
Rouge Rivers at permitted locations.
An increase in multi-day and heavy rain events
across the Midwest states has already been observed,
leading to more stormwater management problems.[19-
21] With more intense and more frequent severe
storms, Detroit will see more combined sewage
overflows, increasing the risk for waterborne disease
outbreaks when untreated sewage is released into
surface water.[23]
Impervious surfaces, such as paved parking lots,
exacerbate stormwater issues by channeling flows into
concentrated areas. As expanses of impervious
surfaces are neglected and abandoned, high-volume
flows become less predictable and more difficult to
manage. In many cases degrading surfaces may
inadvertently direct stormwater away from the
appropriate drainage systems.[24]
Flooding occurs throughout the year in Detroit.
More intense storms, lake level changes, and
decreased shoreline ice cover can increase flood risks.
Mild and nuisance flooding often occurs following
moderate periods of precipitation and snowmelt
events, while more severe inland flooding is caused
primarily by intense, localized thunderstorms, usually
during the spring and summer.[25]
In portions of the city that border the Detroit River,
Lake Erie, or Lake St. Clair, high lake and river levels
along with easterly winds produce conditions for
flooding. Some of the most damaging floods on record
have occurred as a result of this combination. Severe
flooding occurred along the shoreline in 1954, 1973,
1985, and 1986. In March and April, 1985, high lake
A combined sewage overflow plume in the Detroit River. Credit:
Robert Burns, Detroit Riverkeeper
Lake Erie algal bloom, Oct. 20, 2011. Warmer lake surface temperatures conspire with nutrients from runoff and combined sewer overflows to exacerbate toxic algal blooms and raise public health concerns. Photo courtesy of NASA.
THE POTENTIAL IMPACTS OF CLIMATE CHANGE ON DETROIT, MI
5 Draft Document. Do not cite. Last updated: 6/3/2014
waters of Lakes Erie and St. Clair were
driven ashore, damaging more than 1,300
homes and causing about $2 million in
damages in several communities, including
the Charter Township of Brownstown, the
Cities of Ecorse, Gibraltar, Grosse Pointe,
Grosse Pointe Park, the Township of Grosse
Ile, and the northeastern portion of the City
of Detroit.[25]
Throughout the year, projected changes
in the timing, form, frequency, and intensity
of precipitation could amplify existing
inland flooding risks. During periods of
high water levels, shoreline areas will
remain particularly vulnerable.
Water Quality
Flooding leads to more erosion and greater chances
of overloading sewage systems, both of which reduce
water quality in lakes and rivers, and increase the risk
of waterborne disease.[21, 23, 24] Faster moving flood
waters during severe storms transport more pollutants
farther, often resulting in more severe localized
flooding. In Detroit, as in many Midwestern cities,
direct property damage is often avoided by either
allowing flood water to collect in less sensitive areas or
by diverting it through combined sewage systems
In combination with agricultural and urban runoff,
sewage overflows that are released into the Detroit
River and eventually Lake Erie severely compromise
water quality, leading to beach closures and public
health warnings. In the future, warmer surface water
temperatures may conspire with increased runoff to
produce conditions ripe for more toxic algal blooms,
oxygen-depleted “dead zones”, and fish kills.[23]
Future land use changes could have a far greater
impact on water quality than climate change.[24] Proper
land management and natural resources conservation
can alleviate the increased risks to water quality from
climate change, but other land use changes could also
amplify the negative impacts.
Impacts to Transportation
Infrastructure
There is a wide array of concerns about the impacts
of rising temperatures and more extreme precipitation
on transportation infrastructure.[26, 27] Although little
research has focused directly on the effects of climate
change on roadways in the Great Lakes region, damage
to paved surfaces, including expansion buckling during
extreme heat events, softening of asphalt, and
increased stress on bridge joints will become more
probable as the number of extremely hot days
increases.[28] With increasing precipitation and
stronger storms, flooding risks to roadways are also a
concern. The impacts associated with cold-weather
events, such as freeze-thaw damage, remain largely
unstudied.
In the Great Lakes region, marine shipping is of
particular concern as it carries large implications for
industrial productivity throughout Southeastern
Michigan and Northern Ohio.[29] Projections of Great
Lakes lake levels continue to receive scrutiny, and it is
unclear if lake levels will continue their observed
decline in recent years.[30]
If lake levels do continue to decline, ships may have
to reduce their capacity, and if lake levels rise, river
velocities in the connecting channels could increase,
making navigation more difficult.[23, 31] The potential
impacts are not entirely negative, however, as a shorter
winter and less Great Lakes ice cover may effectively
extend the shipping season. Under extreme emissions
scenarios and greater warming, year-round shipping
may become possible.[32, 33]
Roadways in the Upper Midwest are susceptible to freeze-thaw damage in the
winter months (left) and expansion buckling during summer heat (right). Changes in
winter impacts to roads are uncertain, but damage from heat may be more probable
with an increasing number of hot days. Photos: AP
THE POTENTIAL IMPACTS OF CLIMATE CHANGE ON DETROIT, MI
6 Draft Document. Do not cite. Last updated: 6/3/2014
References
1. Union of Concerned Scientists (UCS), 2012: Heat in the Heartland: 60 Years of Warming in the Midwest. http://www.ucsusa.org/assets/documents/global_warming/Heat-in-the-Heartland-Full-Report.pdf
2. Union of Concerned Scientists (UCS), 2009: Confronting climate change in the U.S. Midwest: Michigan. http://www.ucsusa.org/assets/documents/global_warming/climate-change-michigan.pdf
3. Greene, S., L.S. Kalkstein, D.M. Mills, and J. Samenow, 2011: An Examination of Climate Change on Extreme Heat Events and Climate-Mortality Relationships in Large US Cities. Weather, Climate, and Society, 3(4): p. 281-292.
4. Walsh, J., D. Wuebbles, K. Hayhoe, J. Kossin, K. Kunkel, G. Stephens, P. Thorne, R. Vose, M. Wehner, J. Willis, D. Anderson, S. Doney, R. Feely, P. Hennon, V. Kharin, T. Knutson, F. Landerer, T. Lenton, J. Kennedy, and R. Somerville, 2014: Climate Change Impacts in the United States: The Third National Climate Assessment. J.M. Melillo, T.C. Richmond, and G.W. Yohe, Eds., U.S. Global Change Research Program.
5. Vavrus, S. and J. Van Dorn, 2010: Projected future temperature and precipitation extremes in Chicago. Journal of Great Lakes Research, 36: p. 22-32.
6. Hayhoe, K., S. Sheridan, L. Kalkstein, and S. Greene, 2010: Climate change, heat waves, and mortality projections for Chicago. Journal of Great Lakes Research, 36: p. 65-73.
7. Basu, R. and J.M. Samet, 2002: Relation between Elevated Ambient Temperature and Mortality: A Review of the Epidemiologic Evidence. Epidemiologic Reviews, 24(2): p. 190-202.
8. Harlan, S.L., A.J. Brazel, L. Prashad, W.L. Stefanov, and L. Larsen, 2006: Neighborhood microclimates and vulnerability to heat stress. Social Science & Medicine, 63(11): p. 2847-2863.
9. Buechley, R.W., J.V. Bruggen, and L.E. Truppi, 1972: Heat Island or Death Island? Environ Research, 52.
10. Curriero, F.C., K.S. Heiner, J.M. Samet, S.L. Zeger, L. Strug, and J.A. Patz, 2002: Temperature and mortality in 11 cities of the eastern United States. American Journal of Epidemiology, 155(1): p. 80-87.
11. Mastrangelo, G., U. Fedeli, C. Visentin, G. Milan, E. Fadda, and P. Spolaore, 2007: Pattern and determinants of hospitalization during heat waves: an ecologic study. BMC Public Health, 7(1): p. 200.
12. Semenza, J.C., J.E. McCullough, W.D. Flanders, M.A. McGeehin, and J.R. Lumpkin, 1999: Excess hospital admissions during the July 1995 heat wave in Chicago. American journal of preventive medicine, 16(4): p. 269-277.
13. O'Neill, M.S. and K.L. Ebi, 2009: Temperature extremes and health: impacts of climate variability and change in the United States. Journal of Occupational and Environmental Medicine, 51(1): p. 13-25.
14. Poumadère, M., C. Mays, S. Le Mer, and R. Blong, 2005: The 2003 heat wave in France: dangerous climate change here and now. Risk Analysis, 25(6): p. 1483-1494.
15. Luber, G. and M. McGeehin, 2008: Climate change and extreme heat events. American journal of preventive medicine, 35(5): p. 429-435.
16. Great Lakes Integrated Sciences and Assessments (GLISA) Center, 2012: Historical Climatology: Michigan Climatic Division 10: Southeast Lower Michigan. Great Lakes Climatic Divisions. D. Brown, J. Andresen, and A. Pollyea Editors. http://glisa.msu.edu/docs/climaticdivs/Michigan_Climatic_Division_10.pdf
17. Winkler, J.A., R.W. Arritt, and S.C. Pryor, 2012: Climate Projections for the Midwest: Availability, Interpretation and Synthesis. In: U.S. National Climate Assessment Midwest Technical Input Report. J. Winkler, J. Andresen, J. Hatfield, D. Bidwell, and D. Brown, coordinators. Great Lakes Integrated Sciences and Assessments
(GLISA) Center. http://glisa.msu.edu/docs/NCA/MTIT_Future.pdf
18. Kunkel, K.E., N.E. Westcott, and D.A.R. Kristovich, 2002: Assessment of potential effects of climate change on heavy lake-effect snowstorms near Lake Erie. Journal of Great Lakes Research, 28(4): p. 521-536.
19. Changnon, S.A. and N.E. Westcott, 2002: HEAVY RAINSTORMS IN CHICAGO: INCREASING FREQUENCY, ALTERED IMPACTS, AND FUTURE IMPLICATIONS1. JAWRA Journal of the American Water Resources Association, 38(5): p. 1467-1475.
20. Changnon, S.A., K.E. Kunkel, and K. Andsager, 2001: Causes for Record High Flood Losses in the Central United States. Water International, 26(2): p. 223-230.
21. Wuebbles, D.J. and K. Hayhoe, Year: Climate change and Chicago: projections and potential impacts. in 20th Conference on Climate Variability and Change. 2008.
22. Groisman, P.Y., R.W. Knight, D.R. Easterling, T.R. Karl, G.C. Hegerl, and V.N. Razuvaev, 2005: Trends in Intense Precipitation in the Climate Record. Journal of Climate, 18(9): p. 1326-1350.
23. Karl, T.R., J.M. Melillo, T.C. Peterson, and S.J. Hassol, 2009: Global climate change impacts in the United States. Cambridge University Press.
24. International Joint Commission, 2009: The Impact of Urban Areas on Great Lakes Water Quality, 2009. http://www.ijc.org/en/reports/2009/impact-of-urban-areas
25. Federal Emergency Management Agency (FEMA), 2011: Flood Insurance Study, Wayne County, Michigan.
26. Transportation Research Board, 2011: Adapting transportation to the impacts of climate change. Special Task Force on Climate Change and Energy. Transportation Research Circular E-C152.
27. Transportation Research Board, 2008: Potential Impacts of Climate Change on U.S. Transportation, Special Report 290. National Research Council.
28. Posey, J., 2012: Climate Change Impacts on Transportation in the Midwest. In: U.S. National Climate Assessment Midwest Technical Input Report. J.A. Winkler, J. Andresen, J. Hatfield, D. Bidwell, and D. Brown, coordinators. Great Lakes Integrated Sciences and Assessments (GLISA) Center. http://glisa.msu.edu/docs/NCA/MTIT_Transportation.pdf
29. Angel, J.R. and K.E. Kunkel, 2010: The response of Great Lakes water levels to future climate scenarios with an emphasis on Lake Michigan-Huron. Journal of Great Lakes Research, 36: p. 51-58.
30. Lofgren, B.M., T.S. Hunter, and J. Wilbarger, 2011: Effects of using air temperature as a proxy for potential evapotranspiration in climate change scenarios of Great Lakes basin hydrology. Journal of Great Lakes Research, 37(4): p. 744–752.
31. Lofgren, B.M., F.H. Quinn, A.H. Clites, R.A. Assel, A.J. Eberhardt, and C.L. Luukkonen, 2002: Evaluation of potential impacts on Great Lakes water resources based on climate scenarios of two GCMs. Journal of Great Lakes Research, 28(4): p. 537-554.
32. Quinn, F.H., 2002: The potential impacts of climate change on Great Lakes transportation. The Potential Impacts of Climate Change on Transportation: p. 115.
33. Millerd, F., 2011: The potential impact of climate change on Great Lakes international shipping. Climatic Change, 104(3): p. 629-652.