Embed Size (px)
Citation preview

Potential Impacts of anAdvanced Energy Portfolio
Standard in Pennsylvania
Potential Impacts of anAdvanced Energy Portfolio
Standard in Pennsylvania
Ryan Pletka, P.E.
Black & Veatch
April 12, 2004
Supported by:Heinz Endowments
Community Foundation for the Alleghenies
2 0 0 5 E I A M i d t e r m E n e r g y O u t l o o k a n d M o d e l l i n g C o n f e r e n c e2 0 0 5 E I A M i d t e r m E n e r g y O u t l o o k a n d M o d e l l i n g C o n f e r e n c e

- 2
Study ObjectiveStudy Objective
1. Identify most cost effective mix of resources built in response to AEPS
2. Identify economic benefits or costs
Assess the Potential Economic Impacts of a 20 Percent Advanced
Energy Portfolio Standard (AEPS) in Pennsylvania
- 3
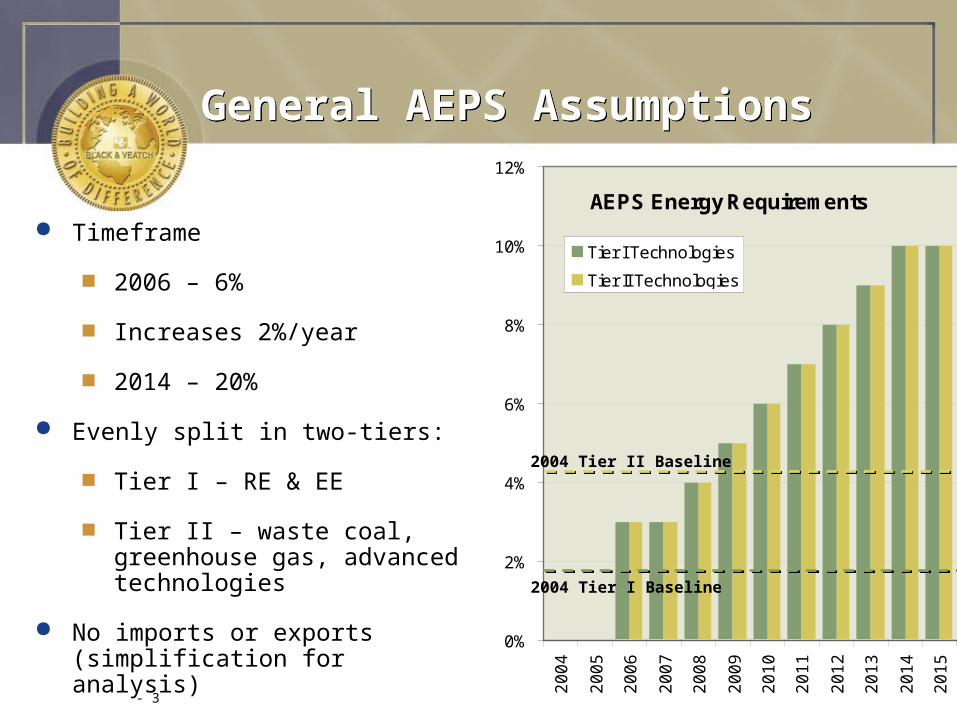
General AEPS AssumptionsGeneral AEPS Assumptions
Timeframe
2006 – 6%
Increases 2%/year
2014 – 20%
Evenly split in two-tiers:
Tier I – RE & EE
Tier II – waste coal, greenhouse gas, advanced technologies
No imports or exports (simplification for analysis)
Production Tax Credit through 2009
AEPS Energy Requirements
0%
2%
4%
6%
8%
10%
12%
20
04
20
05
20
06
20
07
20
08
20
09
20
10
20
11
20
12
20
13
20
14
20
15
20
16
20
17
20
18
20
19
20
20
20
21
20
22
20
23
20
24
20
25
Tier I Technologies
Tier II Technologies
2004 Tier I Baseline
2004 Tier II Baseline

- 4
AEPS Resource Assessment MethodologyAEPS Resource Assessment Methodology
Screen Technologies
Characterize Resources
Estimate Cost to Generate and Transmit Electricity
Apply Avoided Cost of Power Model
Develop Supply Curves
Develop Least-Cost Portfolio of Projects

- 5
AEPS Eligible ResourcesAEPS Eligible Resources
Tier I
Wind
Low-impact hydro
Biogas and coal mine methane
Biomass
Solar photovoltaics
“Energy conservation” – demand side, ie, consumers
“Energy efficiency” – supply side, ie, power plants
Solar thermal
Ocean and lake energy
Solid waste (non combustion)
Fuel cells fueled by Tier I resources
Tier II Resources
Waste Coal
New facilities
Air pollution controls at existing facilities
Integrated gasification combined cycle
Fuel cells fueled by non-Tier I resources
Greenhouse gas (GHG) reductions

- 6
Wind AssessmentWind Assessment
Pennsylvania wind resources relatively modest
GIS analysis based on latest NREL data
Capital Cost:
Base: $1,175-$1,275/kW
Transmission: +$20-$110/kW
“Expensive” resources: +$500/kW (50% of total)
Included 300 MW, class 5, offshore wind farm in Lake Erie

- 7
Biomass Cofiring AssessmentBiomass Cofiring Assessment
Pennsylvania has good biomass resources and lots of coal plants
Focused on cofiring at 38 existing coal units
Capital cost: $100-$700/kW
Biomass resources
Only sustainable and clean resources identified
Assessment based on ORNL database
Biomass collected from 75 mile radius around plants
- 8
Energy Conservation / Efficiency AssessmentEnergy Conservation / Efficiency Assessment
Good opportunity for energy conservation/efficiency in PA
Analysis Based on B&V, ACEEE assessments
Residential measures
Commercial & Industrial measures
Over 16,000 GWh of potential identified over 20 years
About 10% of PA consumption
Wide range of costs and payback potential
Consumers won’t necessarily implement measures even if economical

- 9
Waste Coal Combustion Waste Coal Combustion
Excellent waste coal resource in Pennsylvania
To be eligible for AEPS, waste coal projects must be low emissions
Analysis Based on PA DEP waste coal assessments
3 Planned New Site Developments
15 Environmental control upgrades at existing plants
Environmental control upgrade projects also receive substantial revenue from emissions credit markets
- 10
Properly Characterizing Resource CostProperly Characterizing Resource Cost
One of the largest modeling differences between renewables and fossil fuels is that costs vary tremendously based on renewable resource quality
There are a limited number of very good renewable / advanced project sites
Costs rise as “low-hanging” projects are developed
Supply curves capture these effects

- 11
- 15
- 10
- 5
0
5
10
15
20
1 161 321 481 641 801 962
Generation, GWhLeve
lized C
ost
Pre
miu
m,
$/M
Wh
Ad
Biogas Supply Curve 2006Premium over Avoided CostsBiogas Supply Curve 2006Premium over Avoided Costs
~60 MW~70 MW~30 MW

- 12
2010 Supply Curve
- 60
- 40
- 20
0
20
40
60
80
100
120
23 3,476 6,929 10,382 13,835 17,288 20,741
Generation, GWh
Leveli
zed C
ost,
$/M
Wh
Additional Renewable Generation Required: 3154 GWh
Aggregate Tier I Supply Curve 2010Aggregate Tier I Supply Curve 2010
Wind
Biomass Cofiring
Biogas
Solar
Hydro
Fuel Cells - Tier I
Energy Efficiency
Energy Conservation
Wind
Biomass Cofiring
Biogas
Solar
Hydro
Fuel Cells - Tier I
Energy Efficiency
Energy Conservation
Tier I
2010 requirement
Biomass Cofiring and Energy Efficiency / Conservation add Significant Flexibility
Pre
miu
m

- 13
Aggregate Tier II Supply Curve 2010Aggregate Tier II Supply Curve 2010
2010 Supply Curve
0
20
40
60
80
100
120
16 2,354 4,693 7,032 9,371 11,710 14,049Generation, GWh
Leveli
zed C
ost,
$/M
Wh
Additional Renewable Generation Required: 2955 GWh
Waste Coal New
Waste Coal Environmental Compliance
Integrated Gasification Combined Cycle
Fuel Cells - Tier II
GHG Offsets
Waste Coal New
Waste Coal Environmental Compliance
Integrated Gasification Combined Cycle
Fuel Cells - Tier II
GHG Offsets
Tier II
2010 requirement
Pre
miu
m

- 14
Tier I Cost Premium Supply CurvesTier I Cost Premium Supply Curves
(60.00)
(40.00)
(20.00)
-
20.00
40.00
60.00
80.00
100.00
120.00
0 5,000 10,000 15,000 20,000
Generation, GWh
Leveli
zed C
ost
Pre
miu
m,
$/M
Wh
Ad
Last Project Developed for 2006
2006
(60.00)
(40.00)
(20.00)
-
20.00
40.00
60.00
80.00
100.00
120.00
0 5,000 10,000 15,000 20,000
Generation, GWh
Leveli
zed C
ost
Pre
miu
m,
$/M
Wh
Ad
Last Project Developed for 2008
20082006
(60.00)
(40.00)
(20.00)
-
20.00
40.00
60.00
80.00
100.00
120.00
0 5,000 10,000 15,000 20,000
Generation, GWh
Leveli
zed C
ost
Pre
miu
m,
$/M
Wh
Ad
Last Project Developed for 2010
2010 20082006
(60.00)
(40.00)
(20.00)
-
20.00
40.00
60.00
80.00
100.00
120.00
0 5,000 10,000 15,000 20,000
Generation, GWh
Leveli
zed C
ost
Pre
miu
m,
$/M
Wh
Ad
Last Project Developed for 2012
2012 200820102006
(60.00)
(40.00)
(20.00)
-
20.00
40.00
60.00
80.00
100.00
120.00
0 5,000 10,000 15,000 20,000
Generation, GWh
Leveli
zed C
ost
Pre
miu
m,
$/M
Wh
Ad
Last Project Developed for 2014
2014
2008
2010
2012
2006
(60.00)
(40.00)
(20.00)
-
20.00
40.00
60.00
80.00
100.00
120.00
0 5,000 10,000 15,000 20,000
Generation, GWh
Leveli
zed C
ost
Pre
miu
m,
$/M
Wh
Ad
Last Project Developed in 2016
20122014
2016 2010 2008
2006

- 15
Tier II Cost Premium Supply CurvesTier II Cost Premium Supply Curves
(60.00)
(40.00)
(20.00)
-
20.00
40.00
60.00
80.00
100.00
120.00
0 5,000 10,000 15,000 20,000
Generation, GWh
Leveli
zed C
ost
Pre
miu
m,
$/M
Wh
Ad
Last Project Developed for 2008
2008
(60.00)
(40.00)
(20.00)
-
20.00
40.00
60.00
80.00
100.00
120.00
0 5,000 10,000 15,000 20,000
Generation, GWh
Leveli
zed C
ost
Pre
miu
m,
$/M
Wh
Ad
Last Project Developed for 2010
20102008
(60.00)
(40.00)
(20.00)
-
20.00
40.00
60.00
80.00
100.00
120.00
0 5,000 10,000 15,000 20,000
Generation, GWh
Leveli
zed C
ost
Pre
miu
m,
$/M
Wh
Ad
Last Project Developed for 2012
20122008 2010
(60.00)
(40.00)
(20.00)
-
20.00
40.00
60.00
80.00
100.00
120.00
0 5,000 10,000 15,000 20,000
Generation, GWh
Leveli
zed C
ost
Pre
miu
m,
$/M
Wh
Ad
Last Project Developed for 2014
20142008 2010 2012
(60.00)
(40.00)
(20.00)
-
20.00
40.00
60.00
80.00
100.00
120.00
0 5,000 10,000 15,000 20,000
Generation, GWh
Leveli
zed C
ost
Pre
miu
m,
$/M
Wh
Ad
No Projects Developed in 2016
20122014
2016
20102008
- 16
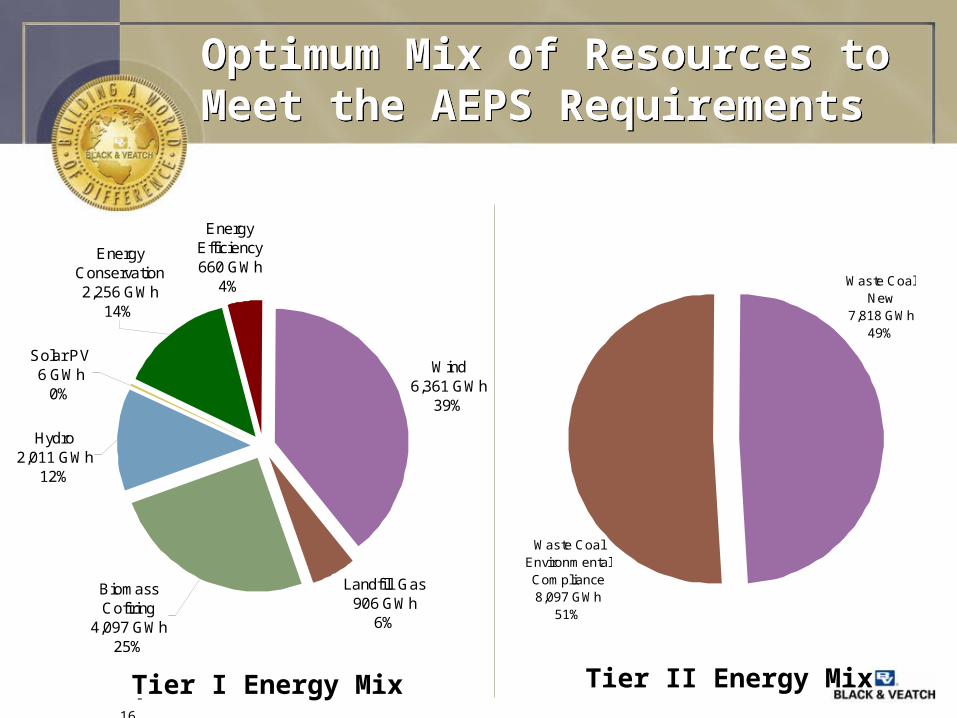
Optimum Mix of Resources to Meet the AEPS RequirementsOptimum Mix of Resources to Meet the AEPS Requirements
Wind 6,361 GWh
39%
Energy Efficiency660 GWh
4%
Hydro2,011 GWh
12%
Solar PV6 GWh
0%
Biomass Cofiring
4,097 GWh25%
Landfill Gas906 GWh
6%
Energy Conservation2,256 GWh
14%
Tier I Energy Mix
Waste Coal New
7,818 GWh49%
Waste Coal Environmental Compliance8,097 GWh
51%
Tier II Energy Mix
- 17
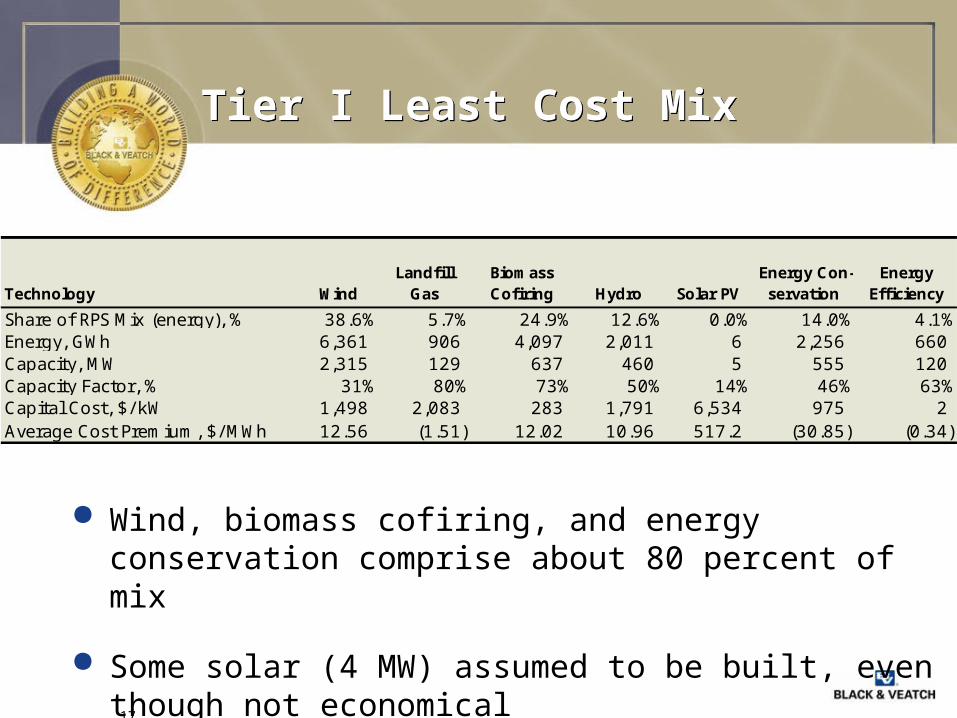
Tier I Least Cost Mix Tier I Least Cost Mix
Wind, biomass cofiring, and energy conservation comprise about 80 percent of mix
Some solar (4 MW) assumed to be built, even though not economical
Technology Wind Landfill
GasBiomass Cofiring Hydro Solar PV
Energy Con-servation
Energy Efficiency
Share of RPS Mix (energy), % 38.6% 5.7% 24.9% 12.6% 0.0% 14.0% 4.1%Energy, GWh 6,361 906 4,097 2,011 6 2,256 660 Capacity, MW 2,315 129 637 460 5 555 120 Capacity Factor, % 31% 80% 73% 50% 14% 46% 63%Capital Cost, $/ kW 1,498 2,083 283 1,791 6,534 975 2 Average Cost Premium, $/ MWh 12.56 (1.51) 12.02 10.96 517.2 (30.85) (0.34)

- 18
Economic Impacts AssessmentEconomic Impacts Assessment
Compared building a 20% AEPS portfolio to building the “Business As Usual” (BAU) portfolio
Cost of electricity
Economic impacts (Jobs, Output, Earnings)
Fossil fuel prices
BAU Portfolio: 50% coal, 40% combined cycle, 10% simple cycle
Portfolios equated on an equivalent energy production basis
RPS portfolio: 6,470 MW
BAU portfolio: 2,460 MW
Environmental externalities purposely not assessed

- 19
Cumulative Economic ImpactsCumulative Economic Impacts
Cost of Electricity
Employment Impact (job-years)
Earnings Impact Output Impact
AEPS Portfolio $ 3.9 Billion 165,689 $ 6.6 Billion $ 18.9 Billion
BAU Portfolio $ 6.6 Billion 94,753 $ 4.1 Billion $ 11.9 BillionDifference - $ 2.7 Billion 70,937 $ 2.5 Billion $ 6.9 Billion
Economic Benefits of the AEPS Portfolio compared to Business as Usual
Cost of electricity: reduced by $2.7 billion (cumulative present value), about 1% when spread over all consumption
Employment: Creates over 70,000 additional job-years over 20 years (average of new 3,500 jobs)
State output: Creates about $7 billion in increased state output
Personal Income: Creates about $2.5 billion in additional earnings

- 20
Pennsylvania Employment Impacts, “Job-years” per MWPennsylvania Employment Impacts, “Job-years” per MW
-
5
10
15
20
25
30
35
0.0
0.5
1.0
1.5
2.0
2.5
3.0
3.5
Construction
Operation
Constr
ucti
on
-
5
10
15
20
25
30
35
0.0
0.5
1.0
1.5
2.0
2.5
3.0
3.5
Construction
Operation
Const
ruct
ion O
pera
tion
RPS portfolio: 6,470 MW
BAU portfolio: 2,460 MW
Impacts proportional to the percent of project expenditures made in PA
in various industries

- 21
AEPS Enacted into Law in Late 2004AEPS Enacted into Law in Late 2004
Our model does not match what was finally signed into law
Solar PV Standard - 0.5% of electricity demand in 15 years (~680 MW)
Implementation Challenges
Ensuring new projects are deployed to meet the requirements of Tier I
Geographic Scope
Definition of Low-Impact Hydro
Long-Term Contracts
Encouraging demand-side management
Tier II over-subscription
Developing rules
- 22
Conclusions and AcknowledgementsConclusions and Acknowledgements
Acknowledgements
Community Foundation for the Alleghenies – Mike Kane
Heinz Endowments
PA DEP
REPP
Industry Contact
Ryan Pletka
Black & Veatch
913-458-8222