Embed Size (px)
Citation preview
The potential economic and environmental impact of using GM maize in Ukraine
Briefing document
by
Graham Brookes
PG Economics Ltd, UK
October 2015
Potential impact of using GM maize in Ukraine
2
Table of Contents
Executive summary ............................................................................................................................................. 3 1 Introduction ....................................................................................................................................................... 6
1.1 Background ................................................................................................................................................ 6 1.2 Objectives ................................................................................................................................................... 6 1.3 Structure ..................................................................................................................................................... 6
2 Production base of maize (2014/15) ................................................................................................................ 7 2.1 Area planted ............................................................................................................................................... 7 2.2 Profitability ................................................................................................................................................. 7 2.3 Usage ........................................................................................................................................................... 8 2.4 Conventional pest and weed control ...................................................................................................... 8
3 Context of biotech maize use and impacts .................................................................................................. 11 3.1 Total plantings ......................................................................................................................................... 11 3.2 Plantings by trait ..................................................................................................................................... 12 3.3 Plantings by country ............................................................................................................................... 12 3.4 Direct economic impacts ........................................................................................................................ 14
3.4.1 Biotech HT maize ............................................................................................................................. 14 3.4.2 Biotech IR maize ............................................................................................................................... 15
3.5 Wider (secondary) economic impacts .................................................................................................. 17 3.6 Environmental impacts (from changes in pesticide use) ................................................................... 18
3.6.1 General .............................................................................................................................................. 18 3.6.2 Biotech HT maize ............................................................................................................................. 20 3.6.3 Biotech IR maize ............................................................................................................................... 21
5 The potential economic impact of using biotech maize in Ukraine ......................................................... 22 4.1 GM HT maize ........................................................................................................................................... 22 4.2 GM IR maize ............................................................................................................................................ 26
5 Potential national level economic impacts .................................................................................................. 30 5.1 Aggregate farm income effects .............................................................................................................. 30 5.2 Production and supply availability ...................................................................................................... 32
6 Environmental impacts .................................................................................................................................. 33 6.1 Changes in herbicide use ........................................................................................................................ 33 6.2 Changes in insecticide use...................................................................................................................... 33 6.3 Possible sources of greenhouse gas emission savings and assumptions used ............................... 34
Appendix 1: Potential herbicide regimes for GM HT crops in Ukraine ..................................................... 36 References ........................................................................................................................................................... 37
Potential impact of using GM maize in Ukraine
3
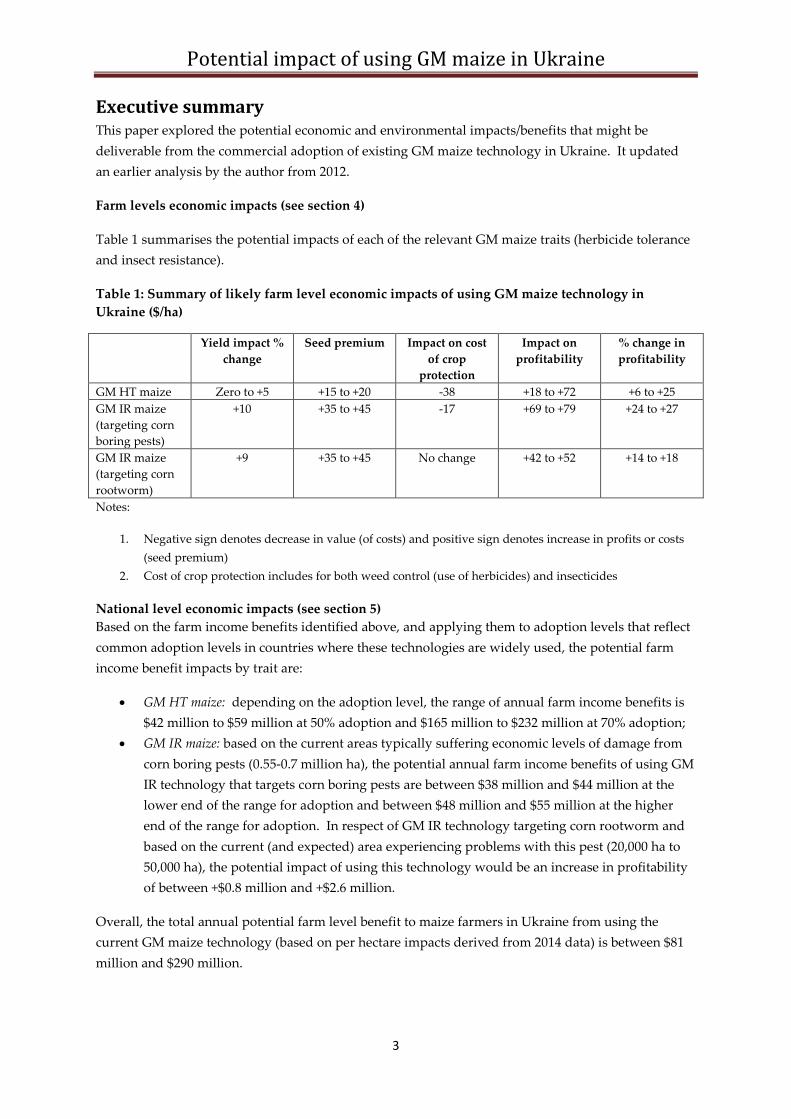
Executive summary This paper explored the potential economic and environmental impacts/benefits that might be deliverable from the commercial adoption of existing GM maize technology in Ukraine. It updated an earlier analysis by the author from 2012.
Farm levels economic impacts (see section 4)
Table 1 summarises the potential impacts of each of the relevant GM maize traits (herbicide tolerance and insect resistance).
Table 1: Summary of likely farm level economic impacts of using GM maize technology in Ukraine ($/ha)
Yield impact % change
Seed premium Impact on cost of crop
protection
Impact on profitability
% change in profitability
GM HT maize Zero to +5 +15 to +20 -38 +18 to +72 +6 to +25 GM IR maize (targeting corn boring pests)
+10 +35 to +45 -17 +69 to +79 +24 to +27
GM IR maize (targeting corn rootworm)
+9 +35 to +45 No change +42 to +52 +14 to +18
Notes:
1. Negative sign denotes decrease in value (of costs) and positive sign denotes increase in profits or costs (seed premium)
2. Cost of crop protection includes for both weed control (use of herbicides) and insecticides
National level economic impacts (see section 5) Based on the farm income benefits identified above, and applying them to adoption levels that reflect common adoption levels in countries where these technologies are widely used, the potential farm income benefit impacts by trait are:
• GM HT maize: depending on the adoption level, the range of annual farm income benefits is $42 million to $59 million at 50% adoption and $165 million to $232 million at 70% adoption;
• GM IR maize: based on the current areas typically suffering economic levels of damage from corn boring pests (0.55-0.7 million ha), the potential annual farm income benefits of using GM IR technology that targets corn boring pests are between $38 million and $44 million at the lower end of the range for adoption and between $48 million and $55 million at the higher end of the range for adoption. In respect of GM IR technology targeting corn rootworm and based on the current (and expected) area experiencing problems with this pest (20,000 ha to 50,000 ha), the potential impact of using this technology would be an increase in profitability of between +$0.8 million and +$2.6 million.
Overall, the total annual potential farm level benefit to maize farmers in Ukraine from using the current GM maize technology (based on per hectare impacts derived from 2014 data) is between $81 million and $290 million.
Potential impact of using GM maize in Ukraine
4
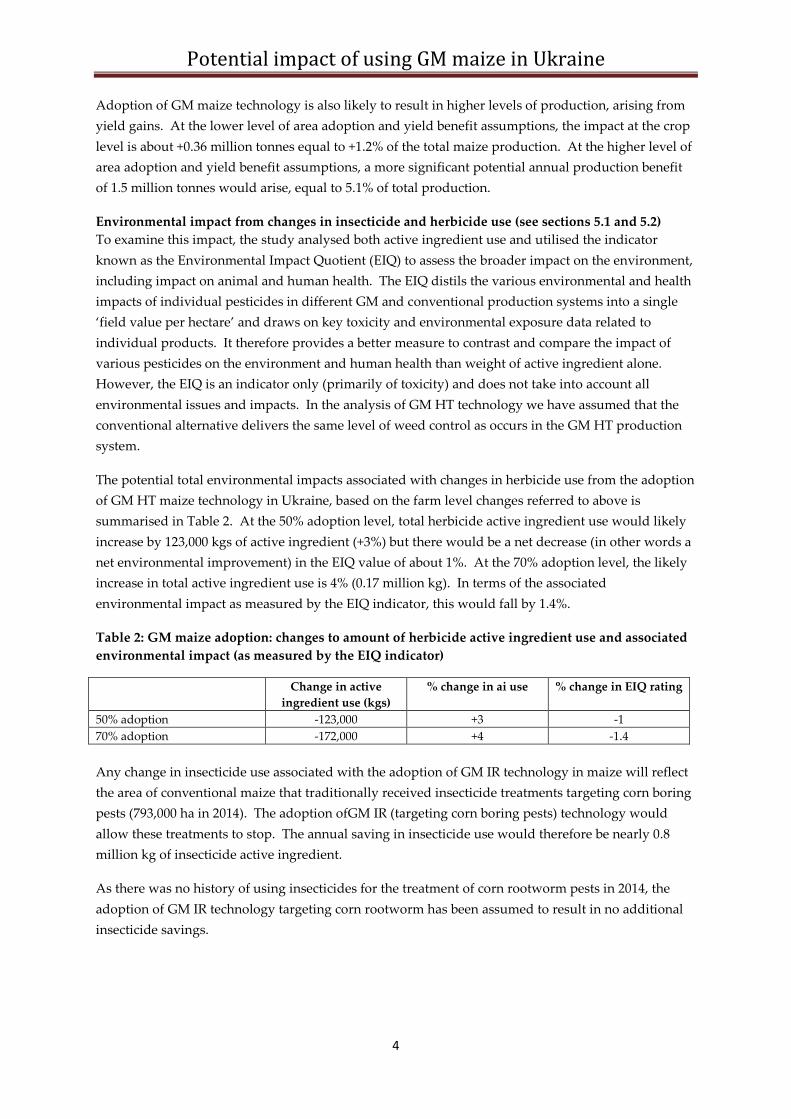
Adoption of GM maize technology is also likely to result in higher levels of production, arising from yield gains. At the lower level of area adoption and yield benefit assumptions, the impact at the crop level is about +0.36 million tonnes equal to +1.2% of the total maize production. At the higher level of area adoption and yield benefit assumptions, a more significant potential annual production benefit of 1.5 million tonnes would arise, equal to 5.1% of total production.
Environmental impact from changes in insecticide and herbicide use (see sections 5.1 and 5.2) To examine this impact, the study analysed both active ingredient use and utilised the indicator known as the Environmental Impact Quotient (EIQ) to assess the broader impact on the environment, including impact on animal and human health. The EIQ distils the various environmental and health impacts of individual pesticides in different GM and conventional production systems into a single ‘field value per hectare’ and draws on key toxicity and environmental exposure data related to individual products. It therefore provides a better measure to contrast and compare the impact of various pesticides on the environment and human health than weight of active ingredient alone. However, the EIQ is an indicator only (primarily of toxicity) and does not take into account all environmental issues and impacts. In the analysis of GM HT technology we have assumed that the conventional alternative delivers the same level of weed control as occurs in the GM HT production system.
The potential total environmental impacts associated with changes in herbicide use from the adoption of GM HT maize technology in Ukraine, based on the farm level changes referred to above is summarised in Table 2. At the 50% adoption level, total herbicide active ingredient use would likely increase by 123,000 kgs of active ingredient (+3%) but there would be a net decrease (in other words a net environmental improvement) in the EIQ value of about 1%. At the 70% adoption level, the likely increase in total active ingredient use is 4% (0.17 million kg). In terms of the associated environmental impact as measured by the EIQ indicator, this would fall by 1.4%.
Table 2: GM maize adoption: changes to amount of herbicide active ingredient use and associated environmental impact (as measured by the EIQ indicator)
Change in active ingredient use (kgs)
% change in ai use % change in EIQ rating
50% adoption -123,000 +3 -1 70% adoption -172,000 +4 -1.4 Any change in insecticide use associated with the adoption of GM IR technology in maize will reflect the area of conventional maize that traditionally received insecticide treatments targeting corn boring pests (793,000 ha in 2014). The adoption ofGM IR (targeting corn boring pests) technology would allow these treatments to stop. The annual saving in insecticide use would therefore be nearly 0.8 million kg of insecticide active ingredient.
As there was no history of using insecticides for the treatment of corn rootworm pests in 2014, the adoption of GM IR technology targeting corn rootworm has been assumed to result in no additional insecticide savings.
Potential impact of using GM maize in Ukraine
5
Environmental impact from changes in greenhouse gas emissions (see section 5.3) The scope for GM crops contributing to lower levels of GHG emissions comes from two principal sources. First, GM crops contribute to a reduction in fuel use due to less frequent herbicide or insecticide applications and a reduction in the energy use in soil cultivation.
In addition, there has been a shift from conventional tillage to no tillage production systems (NT) facilitated by GM HT technology. In the context of Ukraine, however, NT production systems are not widely practiced and therefore for the purposes of this paper, it is assumed that GM HT technology would not contribute to any change from a plough/tillage to a NT production system in Ukraine arable crop production systems or result in any associated fuel savings from changes in tillage systems used. Hence, the potential GHG emission savings are solely attributed to savings in fuel use associated with reduced incidence of herbicide and insecticide spraying.
The potential annual fuel savings from the adoption of GM technology in the Ukraine maize crop at the lower level of area adoption referred to above is about 0.86 million litres of fuel, equal to a saving of 2.28 million kg of carbon dioxide. At the higher level of adoption, the potential annual fuel and carbon dioxide savings would reach 1.12 million litres of fuel and 3 million kgs of carbon dioxide (equivalent of taking 1,340 cars off the road for a year).
Potential impact of using GM maize in Ukraine
6
1 Introduction
1.1 Background Maize crops genetically modified (GM/biotech) to be tolerant to herbicides and resistant to some of the main corn pests have been widely grown around the world since the mid 1990s. GM insect resistant (IR) maize was first grown commercially in 1996, in the US and Canada. This was followed by herbicide tolerant (HT) maize in 1997 (in the US). Since then, adoption of this technology has been rapid, with many farmers in 14 countries using seed containing either one of or both of these traits. By 2013, the global maize area using GM technology was 53.83 million hectares, equivalent to 29% of the global maize area.
No GM crops are currently legally permitted for planting in Ukraine, although it is known that a significant proportion of the soybean crop illegally uses GM herbicide tolerance technology, and there are small areas illegally planted using GM insect resistance (to corn boring pests) corn technology. The Ukraine is, however, a country in which the scope for using new technology in crop production systems is significant, given the large areas devoted to arable crops and the current lower levels of productivity achieved relative to production systems in western agricultural economies. The availability and adoption of GM technology therefore offers potential for the arable cropping sector in Ukraine to make rapid technical and productivity advances, if farmers were permitted access to the technology.
1.2 Objectives This paper explored the potential economic and environmental impacts/benefits that might be deliverable from the commercial adoption of existing GM maize technology in Ukraine by updating earlier analysis by the author from 2012. It examined both the farm level and the national (aggregated) level impacts. The environmental impacts examined were changes in pesticide use and impacts on greenhouse gas (carbon) emissions.
The following traits were examined; herbicide tolerance (HT: to glyphosate and glufosinate) and insect resistance (IR: targeting ECB and corn rootworm pests).
The research was based on desk research and analysis.
1.3 Structure The report is structured as follows:
• Section 1: introduction (this section) • Section 2: Production base of maize • Section 3: Context of GM/biotech maize adoption and impacts in the world; • Section 4: Potential farm level economic costs and benefits of using GM technology in the
Ukraine maize sector • Section 5: Potential aggregated (national) economic impacts • Section 6: Potential environmental impacts of using GM maize: from changes in herbicide and
insecticide use and any greenhouse gas emission changes
Potential impact of using GM maize in Ukraine
7
2 Production base of maize (2014/15)
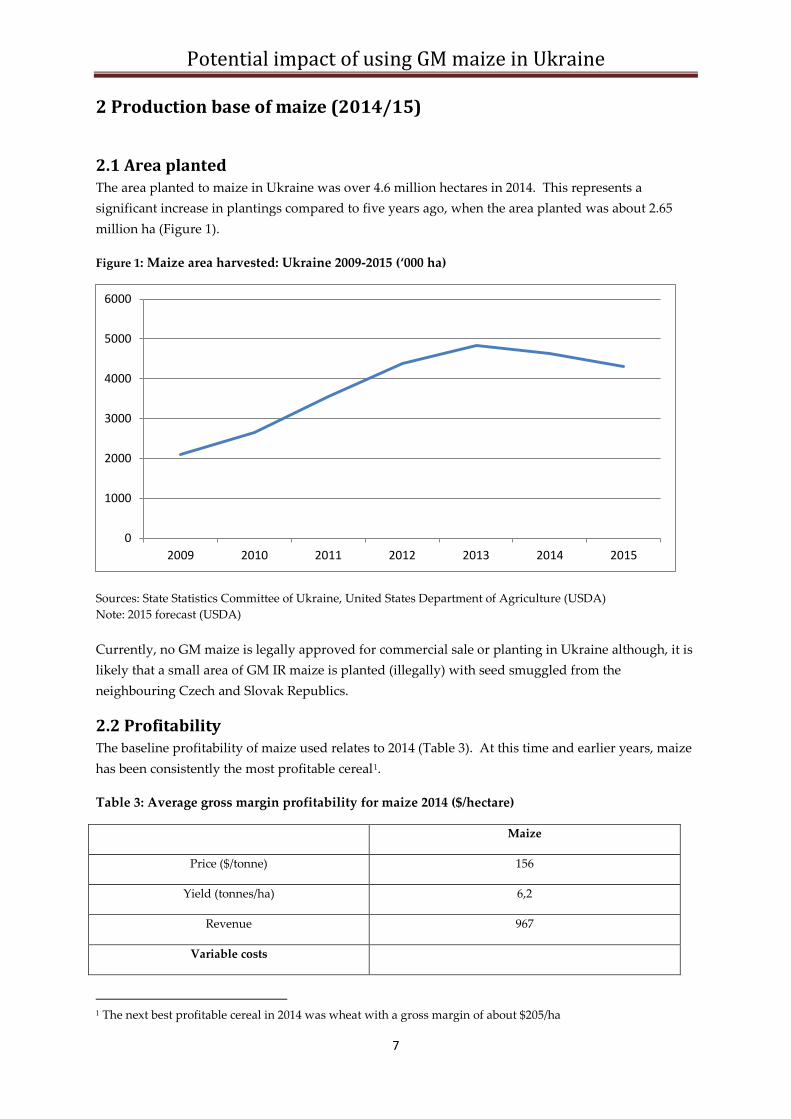
2.1 Area planted The area planted to maize in Ukraine was over 4.6 million hectares in 2014. This represents a significant increase in plantings compared to five years ago, when the area planted was about 2.65 million ha (Figure 1).
Figure 1: Maize area harvested: Ukraine 2009-2015 (‘000 ha)
Sources: State Statistics Committee of Ukraine, United States Department of Agriculture (USDA) Note: 2015 forecast (USDA) Currently, no GM maize is legally approved for commercial sale or planting in Ukraine although, it is likely that a small area of GM IR maize is planted (illegally) with seed smuggled from the neighbouring Czech and Slovak Republics.
2.2 Profitability The baseline profitability of maize used relates to 2014 (Table 3). At this time and earlier years, maize has been consistently the most profitable cereal1.
Table 3: Average gross margin profitability for maize 2014 ($/hectare)
Maize
Price ($/tonne) 156
Yield (tonnes/ha) 6,2
Revenue 967
Variable costs
1 The next best profitable cereal in 2014 was wheat with a gross margin of about $205/ha
0
1000
2000
3000
4000
5000
6000
2009 2010 2011 2012 2013 2014 2015
Potential impact of using GM maize in Ukraine
8
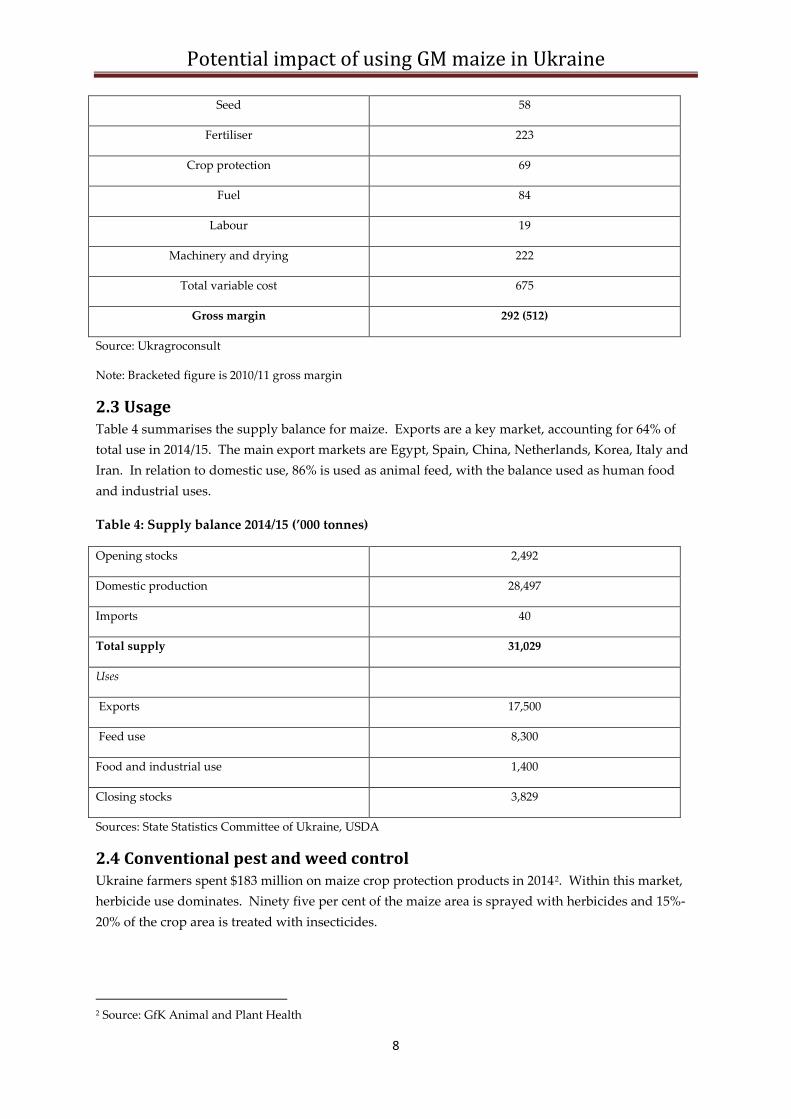
Seed 58
Fertiliser 223
Crop protection 69
Fuel 84
Labour 19
Machinery and drying 222
Total variable cost 675
Gross margin 292 (512)
Source: Ukragroconsult
Note: Bracketed figure is 2010/11 gross margin
2.3 Usage Table 4 summarises the supply balance for maize. Exports are a key market, accounting for 64% of total use in 2014/15. The main export markets are Egypt, Spain, China, Netherlands, Korea, Italy and Iran. In relation to domestic use, 86% is used as animal feed, with the balance used as human food and industrial uses.
Table 4: Supply balance 2014/15 (’000 tonnes)
Opening stocks 2,492
Domestic production 28,497
Imports 40
Total supply 31,029
Uses
Exports 17,500
Feed use 8,300
Food and industrial use 1,400
Closing stocks 3,829
Sources: State Statistics Committee of Ukraine, USDA
2.4 Conventional pest and weed control Ukraine farmers spent $183 million on maize crop protection products in 20142. Within this market, herbicide use dominates. Ninety five per cent of the maize area is sprayed with herbicides and 15%-20% of the crop area is treated with insecticides.
2 Source: GfK Animal and Plant Health
Potential impact of using GM maize in Ukraine
9
Corn boring pests The lepidopteran pest Ostrinia nubilalis (European corn borer (ECB)) is a major maize pest in Ukraine. Whilst the incidence and impact of ECB infestation varies significantly by region and year, is influenced by local climatic conditions, use of insecticides and planting times (eg, early planted crops are usually better able to withstand attacks relative to later plantings), typically between 0.5 million ha and 0.7 million ha (12% to 15% of the crop) is estimated to be annually affected by the pest to levels that cause ‘economic damage’. The areas worst affected are usually Donetsk, Zaporizhzhya, Ivano-Frankivsk, Kyiv, Poltava, Ternopil, and Chernivtsi regions. Maize farmers generally have one of three approaches to dealing with ECB pest problems. One is having no active policy of treatment (ie, they take no crop protective action). This approach tends to be a fairly common one (both in Europe and worldwide) because ECB pest pressure varies and hence in some years damage may be limited. Crop protection strategies (see below) have also tended to be limited because many farmers perceive that insecticides have limited effectiveness:
• They may control ECB larvae on the surface of maize plants at the time of spraying but are less effective against larvae that have bored into stalks;
• Egg-laying can occur over a three week period and most insecticides are only effective for 7 to 10 days;
• Some farmers probably do not appreciate the level of damage to yields inflicted by the ECB. This is highlighted in surveys of farmers using GM IR technology), where some have indicated that it was only after using this technology that they fully realised the adverse impacts of ECB (see for example, Brookes, 2003 relating to Spain).
The other two conventional approaches involve either the use of insecticides or biological control methods (consisting of the release of the parasitic wasp Trichogramma). In Ukraine, data from Golovderzhzakhyst showed that about 18%-19% of the total 2011 maize crop was subject to some form of crop protection strategy for pest control and within this, 85%-100% (average 90%) used Trichogramma3. The cost of these treatments varied according to which insecticides were used and the method of application (by sprayer or by air). In 2011/12, insecticide treatments were in a range of about $12/ha to $25/ha4 based on one treatment per crop and about $25/ha for Trichogramma (source: industry). Industry sources suggest that the cost of these treatments were about the same in 2014, although trichogramma use is significantly lower than in 2011. As indicated above, there is fairly widespread perception and acceptance that these forms of pest control have limited effectiveness (eg, analysis in Poland by Berés and Lisowicz (2005) estimated that insecticides delivered between 62% and 89% levels of efficacy and Trichogramma between 57% to 59% efficacy). 3 In 2011, about 100,000 ha of maize were treated with insecticide, mostly targeted at corn boring pests with about 400,000 ha treated with Trichogramma 4 Inclusive of the cost of spraying – the cost of insecticide being about $5/ha
Potential impact of using GM maize in Ukraine
10
Drawing on data from the National Academy of Agrarian Sciences of Ukraine, the loss of maize yield from the damage caused by the ECB is typically in a range of 6% to 25%, and during bad infestations, the yield losses can be as high as 50%. These levels of yield loss are consistent with losses experienced in other countries. For example, in Spain, the ECB related yield losses typically fall within a range of 5% to 15% for crops treated with conventional control measures (insecticides), 10% to 20% for crops for which no active crop protection strategy is used and in years of major infestations, the yield losses can be between 30% and 50% (Brookes (2003)). Corn rootworm Western corn rootworm (Diabrotica virgifera: CRW) is a fairly recent pest in Europe and was first identified in Ukraine in 2001, in the Zakarpattya region. Since then the area affected has spread each year to additional regions including Ivano-Frankivsk, Lviv and Ternopil. In 2009, the area affected by this pest was estimated to be about 18,000 ha. The 2014 estimated affected area was 33,490 ha5. Given the relative recent history of this pest, there is limited experience of using control measures, notably soil insecticides and/or seed treatments. Therefore all of the area affected by CRW in Ukraine was assumed, in 2014 to have received no form of chemical pest control. The impact of CRW on maize yield can be substantial and in extreme cases can result in yield losses of up to 80%. Ultimately the level of yield loss depends on the level of infestation and the degree of control measure efficacy. In the US, where a combination of rotation and widespread use of soil insecticides on 20%-30% of the total crop (prior to the availability of GM IR maize with resistance to this pest) has occurred, yield losses have tended to be in the range of 9% to 28% relative to rootworm affected crops subject to no crop protection measures and about 5% relative to affected crops treated conventionally with soil insecticides (Alsten et al (2003) and Mitchell (2002)). Weed control Weeds are a major problem facing all arable crop production, including maize in Ukraine. The most common form of weed control practiced is the use of herbicides that may be applied pre-emergence, post-emergence or a combination of both pre and post emergence. In relation to conventional weed control methods in the maize crop, about 95 % of the total crop in 2014 typically received at least one herbicide treatment per year. In other words 5% used mechanical/hand weeding or no form of weed control. Both pre- and post-emergent herbicides were used, with some farmers using only pre-emergence, some using only post-emergence and some using both pre- and post-emergence. Post-emergent herbicides dominated usage accounting for about 65% of usage by weight of product applied in 2014. The main active ingredients used were a mix of foramsulfuron, nicosulfuron, acetochlor, rimsulfuron, S-metolochlor, thiencarbazone-m, cyprosulfamide and terbuthylazine. The average number of treatments per crop was between 1.3 and 1.5 and average expenditure on herbicide per ha (2014) was between $48/ha and $52/ha. Lastly, the average amount of herbicide active ingredient used per ha was about 1kg/ha to 1.1 kg/ha.
5 Source: State Veterinary and Phyto-sanitary Service of Ukraine
Potential impact of using GM maize in Ukraine
11
3 Context of biotech maize use and impacts This section provides a broad overview of the development of biotech maize crops and their key impacts around the world so as to provide a base for assessing the potential impact of this technology in Ukraine.
The main biotech traits so far commercialised in maize convey:
• Tolerance to specific herbicides (notably to glyphosate and to glufosinate). This biotech weed management or herbicide tolerance (HT) technology allows for the ‘over the top’ spraying of biotech HT crops with these specific broad-spectrum herbicides, that target both grass and broad-leaved weeds but do not harm the crop itself;
• Resistance to specific insect pests of maize. This insect protection (IR), or ‘Bt’ technology offers farmers resistance in the plants to major pests such as such as stem and stalk borers, earworms and cutworms (eg, Ostrinia nubilalis, Ostrinia furnacalis, Spodoptera frugiperda, Diatraea spp and Helicoverpa zea).
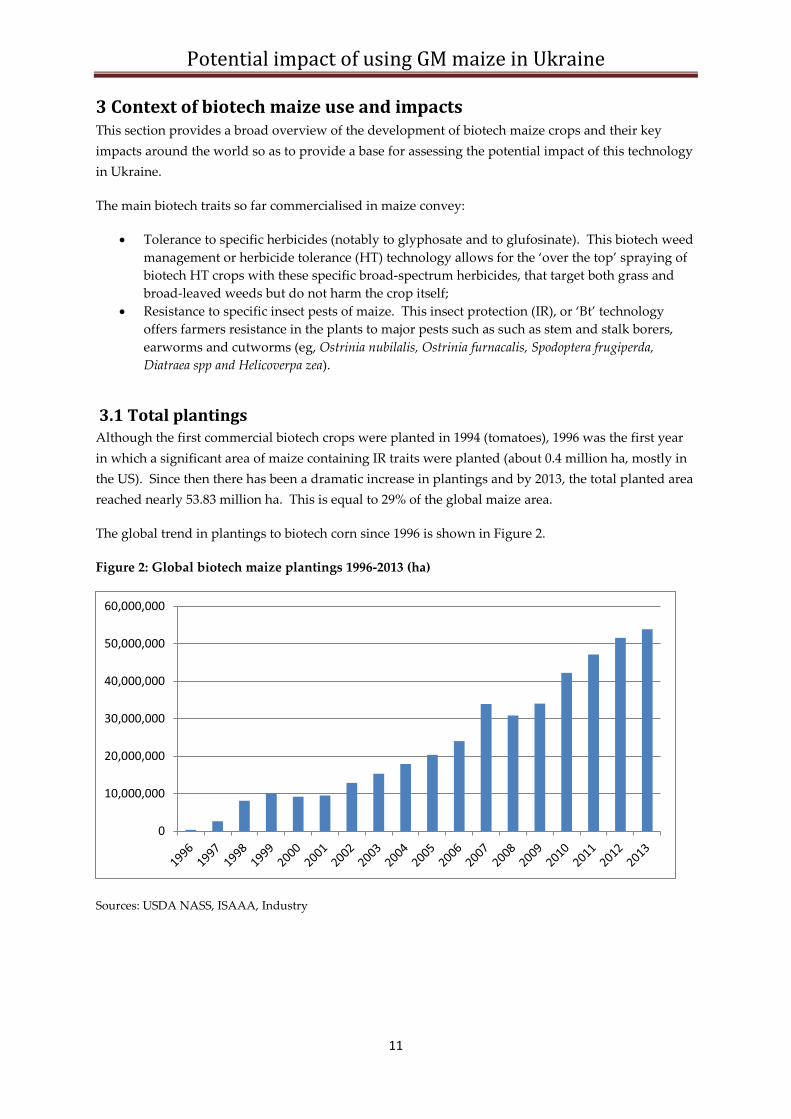
3.1 Total plantings Although the first commercial biotech crops were planted in 1994 (tomatoes), 1996 was the first year in which a significant area of maize containing IR traits were planted (about 0.4 million ha, mostly in the US). Since then there has been a dramatic increase in plantings and by 2013, the total planted area reached nearly 53.83 million ha. This is equal to 29% of the global maize area.
The global trend in plantings to biotech corn since 1996 is shown in Figure 2.
Figure 2: Global biotech maize plantings 1996-2013 (ha)
Sources: USDA NASS, ISAAA, Industry
0
10,000,000
20,000,000
30,000,000
40,000,000
50,000,000
60,000,000
Potential impact of using GM maize in Ukraine
12
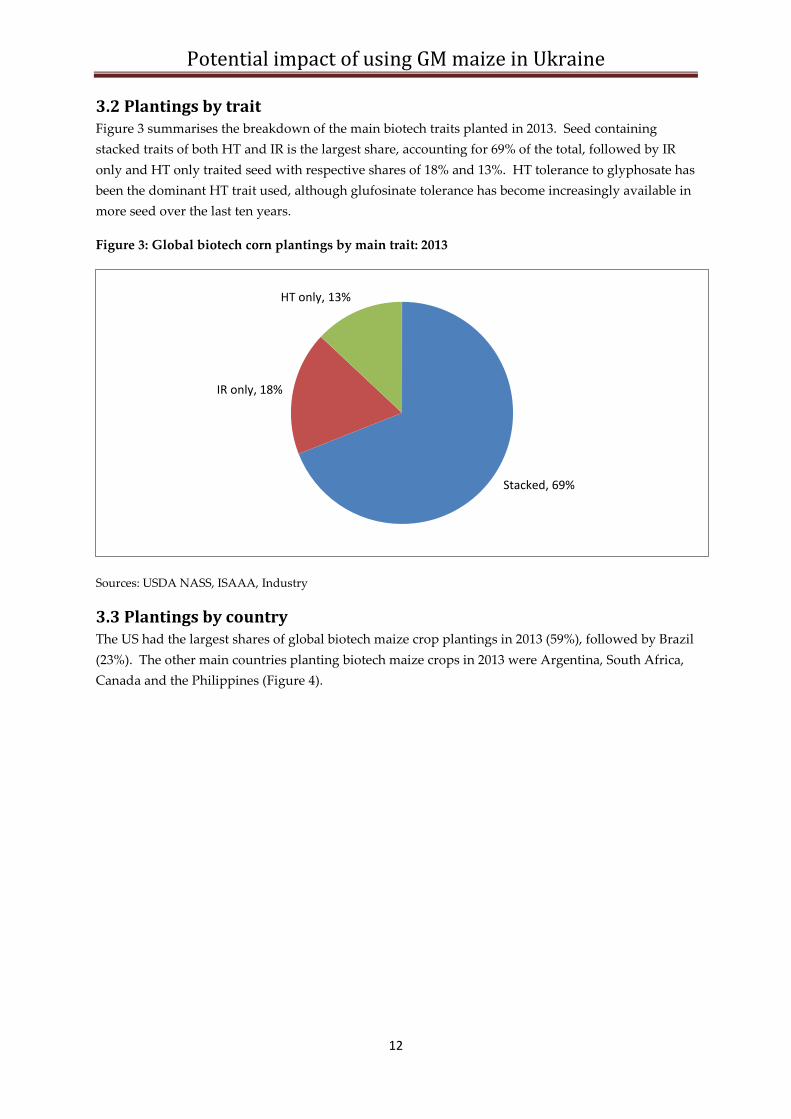
3.2 Plantings by trait Figure 3 summarises the breakdown of the main biotech traits planted in 2013. Seed containing stacked traits of both HT and IR is the largest share, accounting for 69% of the total, followed by IR only and HT only traited seed with respective shares of 18% and 13%. HT tolerance to glyphosate has been the dominant HT trait used, although glufosinate tolerance has become increasingly available in more seed over the last ten years.
Figure 3: Global biotech corn plantings by main trait: 2013
Sources: USDA NASS, ISAAA, Industry
3.3 Plantings by country The US had the largest shares of global biotech maize crop plantings in 2013 (59%), followed by Brazil (23%). The other main countries planting biotech maize crops in 2013 were Argentina, South Africa, Canada and the Philippines (Figure 4).
Stacked, 69%
IR only, 18%
HT only, 13%
Potential impact of using GM maize in Ukraine
13
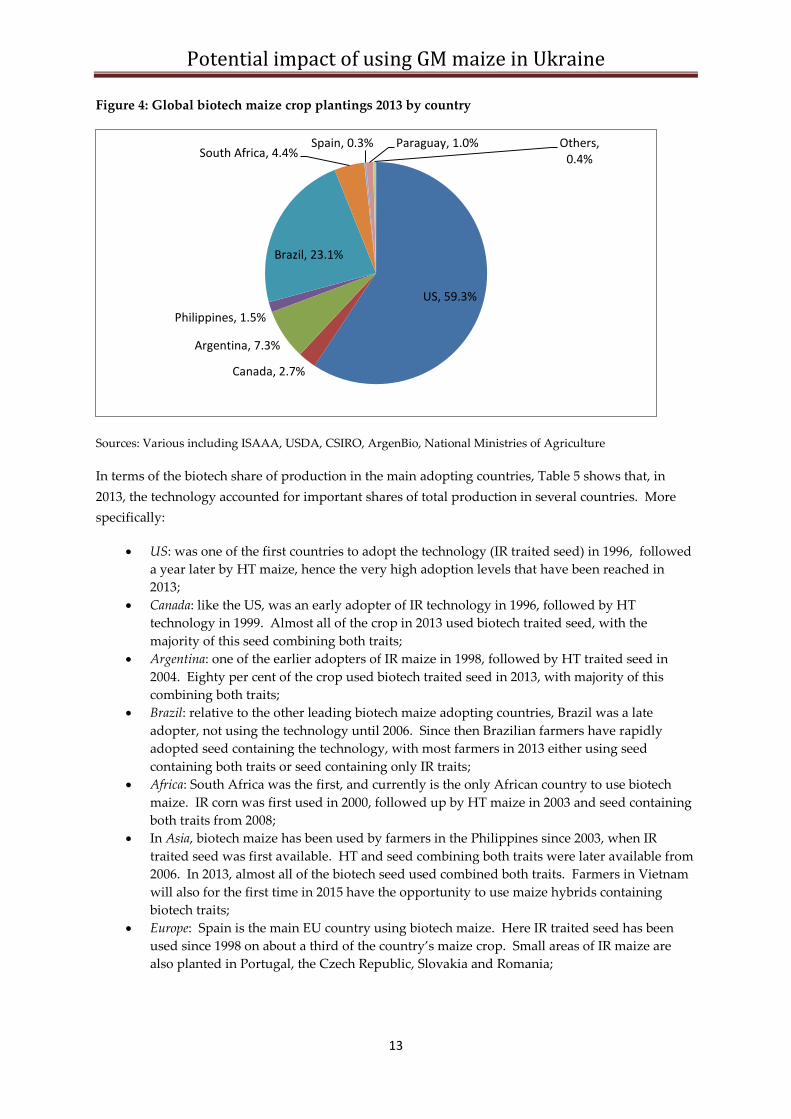
Figure 4: Global biotech maize crop plantings 2013 by country
Sources: Various including ISAAA, USDA, CSIRO, ArgenBio, National Ministries of Agriculture
In terms of the biotech share of production in the main adopting countries, Table 5 shows that, in 2013, the technology accounted for important shares of total production in several countries. More specifically:
• US: was one of the first countries to adopt the technology (IR traited seed) in 1996, followed a year later by HT maize, hence the very high adoption levels that have been reached in 2013;
• Canada: like the US, was an early adopter of IR technology in 1996, followed by HT technology in 1999. Almost all of the crop in 2013 used biotech traited seed, with the majority of this seed combining both traits;
• Argentina: one of the earlier adopters of IR maize in 1998, followed by HT traited seed in 2004. Eighty per cent of the crop used biotech traited seed in 2013, with majority of this combining both traits;
• Brazil: relative to the other leading biotech maize adopting countries, Brazil was a late adopter, not using the technology until 2006. Since then Brazilian farmers have rapidly adopted seed containing the technology, with most farmers in 2013 either using seed containing both traits or seed containing only IR traits;
• Africa: South Africa was the first, and currently is the only African country to use biotech maize. IR corn was first used in 2000, followed up by HT maize in 2003 and seed containing both traits from 2008;
• In Asia, biotech maize has been used by farmers in the Philippines since 2003, when IR traited seed was first available. HT and seed combining both traits were later available from 2006. In 2013, almost all of the biotech seed used combined both traits. Farmers in Vietnam will also for the first time in 2015 have the opportunity to use maize hybrids containing biotech traits;
• Europe: Spain is the main EU country using biotech maize. Here IR traited seed has been used since 1998 on about a third of the country’s maize crop. Small areas of IR maize are also planted in Portugal, the Czech Republic, Slovakia and Romania;
US, 59.3%
Canada, 2.7%
Argentina, 7.3%
Philippines, 1.5%
Brazil, 23.1%
South Africa, 4.4% Spain, 0.3% Paraguay, 1.0% Others,
0.4%
Potential impact of using GM maize in Ukraine
14
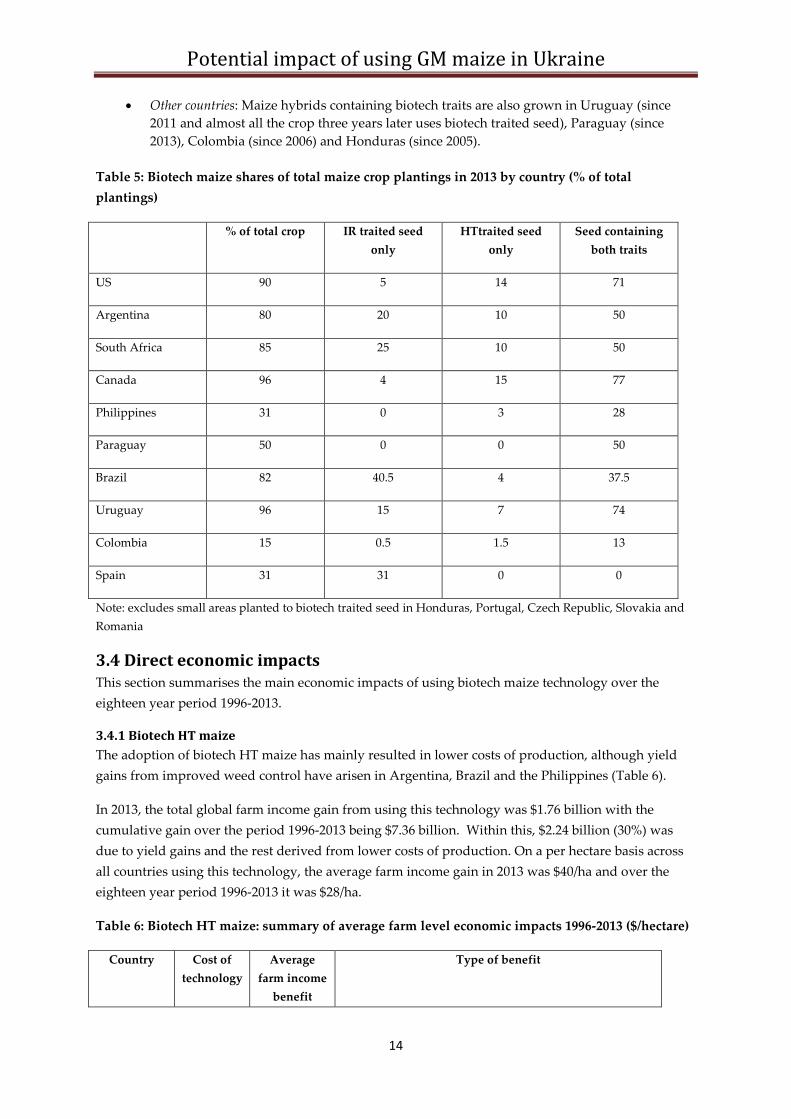
• Other countries: Maize hybrids containing biotech traits are also grown in Uruguay (since 2011 and almost all the crop three years later uses biotech traited seed), Paraguay (since 2013), Colombia (since 2006) and Honduras (since 2005).
Table 5: Biotech maize shares of total maize crop plantings in 2013 by country (% of total plantings)
% of total crop IR traited seed only
HTtraited seed only
Seed containing both traits
US 90 5 14 71
Argentina 80 20 10 50
South Africa 85 25 10 50
Canada 96 4 15 77
Philippines 31 0 3 28
Paraguay 50 0 0 50
Brazil 82 40.5 4 37.5
Uruguay 96 15 7 74
Colombia 15 0.5 1.5 13
Spain 31 31 0 0
Note: excludes small areas planted to biotech traited seed in Honduras, Portugal, Czech Republic, Slovakia and Romania
3.4 Direct economic impacts This section summarises the main economic impacts of using biotech maize technology over the eighteen year period 1996-2013.
3.4.1 Biotech HT maize The adoption of biotech HT maize has mainly resulted in lower costs of production, although yield gains from improved weed control have arisen in Argentina, Brazil and the Philippines (Table 6).
In 2013, the total global farm income gain from using this technology was $1.76 billion with the cumulative gain over the period 1996-2013 being $7.36 billion. Within this, $2.24 billion (30%) was due to yield gains and the rest derived from lower costs of production. On a per hectare basis across all countries using this technology, the average farm income gain in 2013 was $40/ha and over the eighteen year period 1996-2013 it was $28/ha.
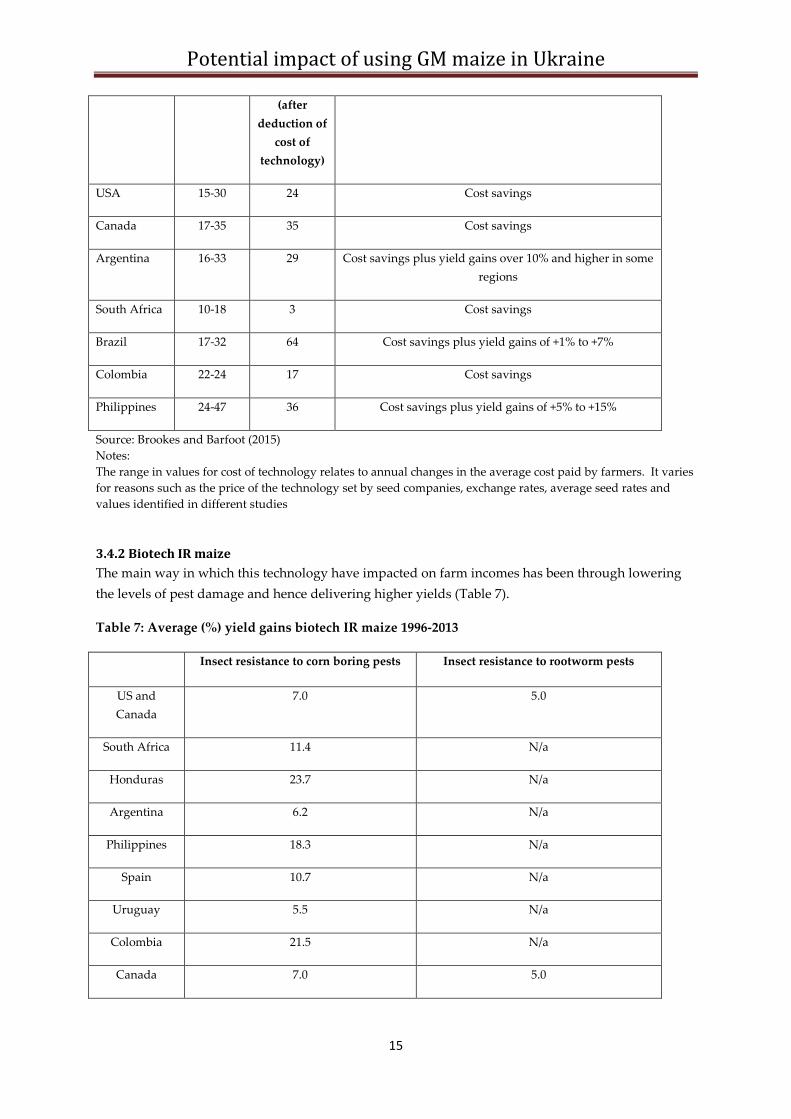
Table 6: Biotech HT maize: summary of average farm level economic impacts 1996-2013 ($/hectare)
Country Cost of technology
Average farm income
benefit
Type of benefit
Potential impact of using GM maize in Ukraine
15
(after deduction of
cost of technology)
USA 15-30 24 Cost savings
Canada 17-35 35 Cost savings
Argentina 16-33 29 Cost savings plus yield gains over 10% and higher in some regions
South Africa 10-18 3 Cost savings
Brazil 17-32 64 Cost savings plus yield gains of +1% to +7%
Colombia 22-24 17 Cost savings
Philippines 24-47 36 Cost savings plus yield gains of +5% to +15%
Source: Brookes and Barfoot (2015) Notes: The range in values for cost of technology relates to annual changes in the average cost paid by farmers. It varies for reasons such as the price of the technology set by seed companies, exchange rates, average seed rates and values identified in different studies
3.4.2 Biotech IR maize The main way in which this technology have impacted on farm incomes has been through lowering the levels of pest damage and hence delivering higher yields (Table 7).
Table 7: Average (%) yield gains biotech IR maize 1996-2013
Insect resistance to corn boring pests Insect resistance to rootworm pests
US and Canada
7.0 5.0
South Africa 11.4 N/a
Honduras 23.7 N/a
Argentina 6.2 N/a
Philippines 18.3 N/a
Spain 10.7 N/a
Uruguay 5.5 N/a
Colombia 21.5 N/a
Canada 7.0 5.0
Potential impact of using GM maize in Ukraine
16
Brazil 13.4 N/a
Paraguay 5.5 N/a
Portugal 12.5 N/a
Czech Republic
10.0 N/a
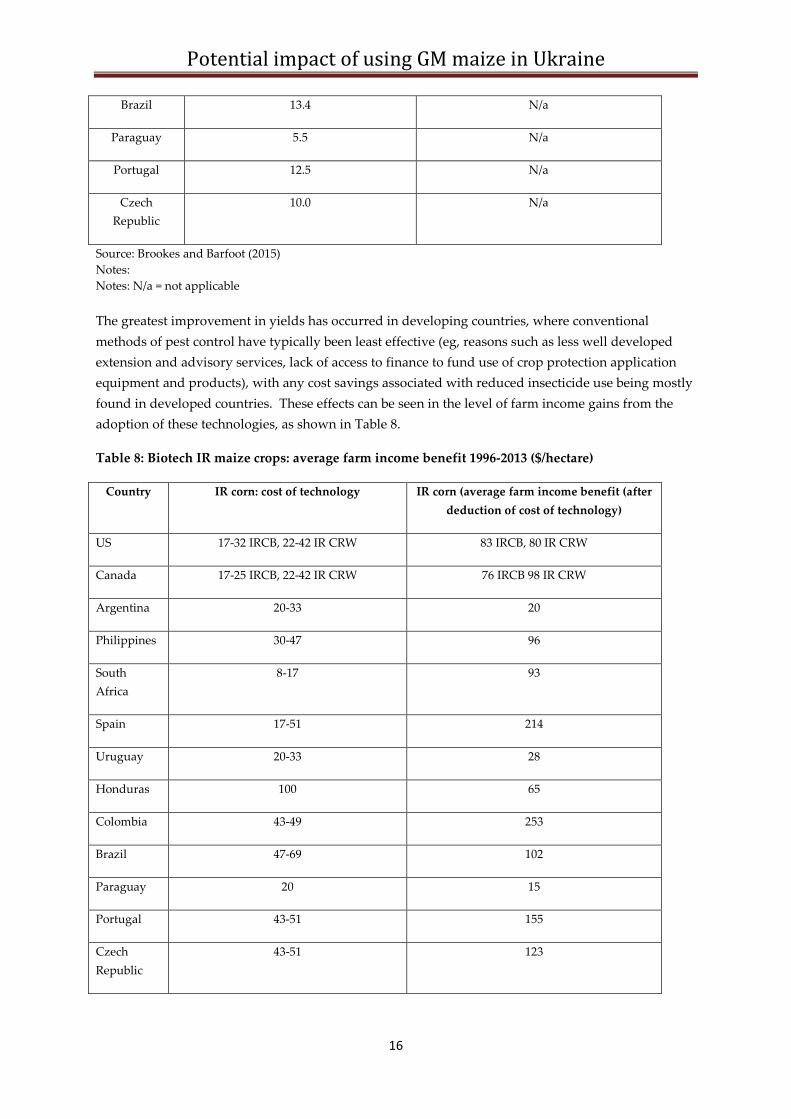
Source: Brookes and Barfoot (2015) Notes: Notes: N/a = not applicable The greatest improvement in yields has occurred in developing countries, where conventional methods of pest control have typically been least effective (eg, reasons such as less well developed extension and advisory services, lack of access to finance to fund use of crop protection application equipment and products), with any cost savings associated with reduced insecticide use being mostly found in developed countries. These effects can be seen in the level of farm income gains from the adoption of these technologies, as shown in Table 8.
Table 8: Biotech IR maize crops: average farm income benefit 1996-2013 ($/hectare)
Country IR corn: cost of technology IR corn (average farm income benefit (after deduction of cost of technology)
US 17-32 IRCB, 22-42 IR CRW 83 IRCB, 80 IR CRW
Canada 17-25 IRCB, 22-42 IR CRW 76 IRCB 98 IR CRW
Argentina 20-33 20
Philippines 30-47 96
South Africa
8-17 93
Spain 17-51 214
Uruguay 20-33 28
Honduras 100 65
Colombia 43-49 253
Brazil 47-69 102
Paraguay 20 15
Portugal 43-51 155
Czech Republic
43-51 123
Potential impact of using GM maize in Ukraine
17
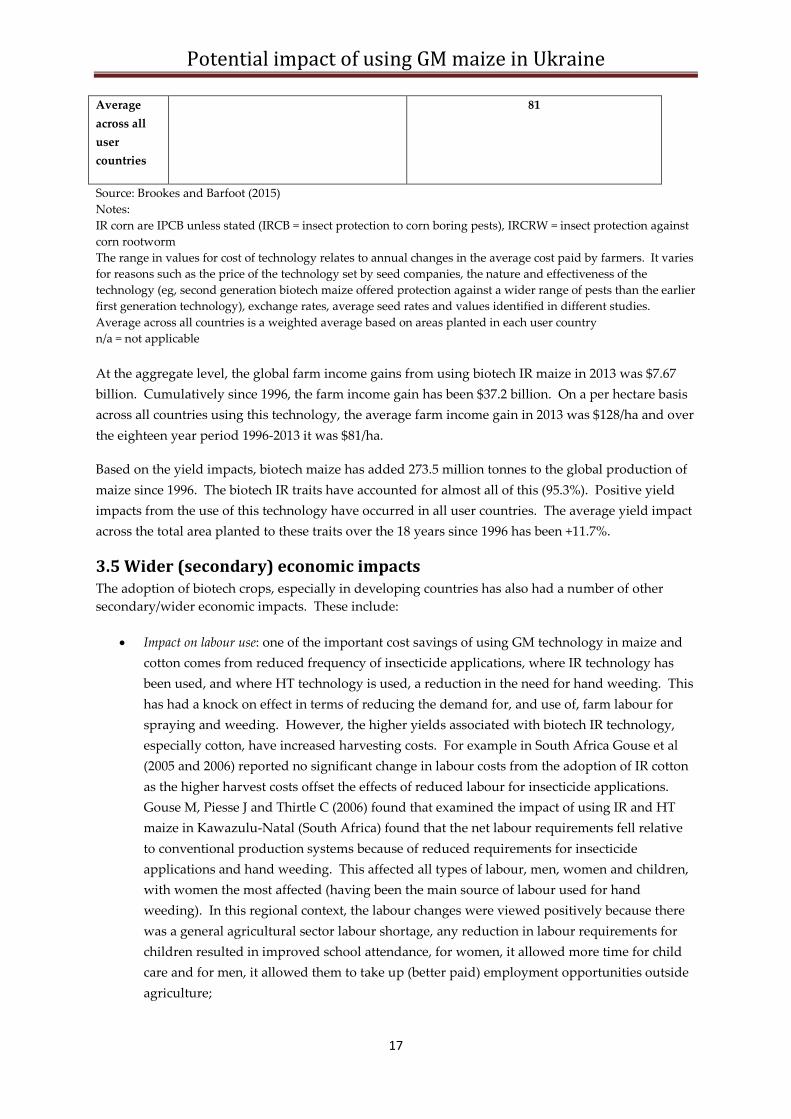
Average across all user countries
81
Source: Brookes and Barfoot (2015) Notes: IR corn are IPCB unless stated (IRCB = insect protection to corn boring pests), IRCRW = insect protection against corn rootworm The range in values for cost of technology relates to annual changes in the average cost paid by farmers. It varies for reasons such as the price of the technology set by seed companies, the nature and effectiveness of the technology (eg, second generation biotech maize offered protection against a wider range of pests than the earlier first generation technology), exchange rates, average seed rates and values identified in different studies. Average across all countries is a weighted average based on areas planted in each user country n/a = not applicable At the aggregate level, the global farm income gains from using biotech IR maize in 2013 was $7.67 billion. Cumulatively since 1996, the farm income gain has been $37.2 billion. On a per hectare basis across all countries using this technology, the average farm income gain in 2013 was $128/ha and over the eighteen year period 1996-2013 it was $81/ha.
Based on the yield impacts, biotech maize has added 273.5 million tonnes to the global production of maize since 1996. The biotech IR traits have accounted for almost all of this (95.3%). Positive yield impacts from the use of this technology have occurred in all user countries. The average yield impact across the total area planted to these traits over the 18 years since 1996 has been +11.7%.
3.5 Wider (secondary) economic impacts The adoption of biotech crops, especially in developing countries has also had a number of other secondary/wider economic impacts. These include:
• Impact on labour use: one of the important cost savings of using GM technology in maize and cotton comes from reduced frequency of insecticide applications, where IR technology has been used, and where HT technology is used, a reduction in the need for hand weeding. This has had a knock on effect in terms of reducing the demand for, and use of, farm labour for spraying and weeding. However, the higher yields associated with biotech IR technology, especially cotton, have increased harvesting costs. For example in South Africa Gouse et al (2005 and 2006) reported no significant change in labour costs from the adoption of IR cotton as the higher harvest costs offset the effects of reduced labour for insecticide applications. Gouse M, Piesse J and Thirtle C (2006) found that examined the impact of using IR and HT maize in Kawazulu-Natal (South Africa) found that the net labour requirements fell relative to conventional production systems because of reduced requirements for insecticide applications and hand weeding. This affected all types of labour, men, women and children, with women the most affected (having been the main source of labour used for hand weeding). In this regional context, the labour changes were viewed positively because there was a general agricultural sector labour shortage, any reduction in labour requirements for children resulted in improved school attendance, for women, it allowed more time for child care and for men, it allowed them to take up (better paid) employment opportunities outside agriculture;
Potential impact of using GM maize in Ukraine
18
• Impact on the wider rural economy: Subramanian A and Qaim M (2008) also examined this issue in India via the monitoring of household expenditure patterns and activities. Whilst this was only a small piece of research it provided a useful insight into wider economic impacts and was representative of semi arid tropical regions in central and southern India. Its key findings were that biotech IR cotton had delivered a net creation of rural employment, with the additional harvest labour requirements being greater than the reductions associated with pest scouting and spraying. This had gender implications given that it has been mostly females who gained, relative to males who lost out. This analysis did, however identify that on average, the saved male family labour was re-employed efficiently in alternative agricultural and non agricultural activities so that, the overall returns to male labour in the local economy increased. In some case, where the labour changes were intra-family, the reduced male labour requirement included re-deployment into household chores, thus improving the quality of life for females twofold via higher income and a reduction in domestic chores/housework In addition, higher levels of farm income associated with the use of biotech cotton (eg, wage income for female workers rose by an average of $40/ha) have increased rural household incomes resulting in a ‘knock-on’ benefit to the local economy in terms of increased expenditure on household goods and services (eg, household amenities, repairs and renovation) and social commitments such as the education of children (Kathage J and Qaim M (2012)). This category of benefit was also identified in relation to the adoption of stacked (IR and HT) corn in the Philippines. Here the additional income associated with higher yields enabled farming families to better feed and clothe their families, to undertake property repairs and improvements and to invest in better education for children (Torres C et al (2013));
• Reduction of risk: Biotech IR technology has been cited in several studies as delivering improved risk management. Essentially, the technology takes away much of the worry of significant pest damage occurring and is, therefore, highly valued by farmers. Examples of analysis identifying this include Brookes G (2008) in relation to biotech IR maize (Spain) and Crost B and Shankar B (2008) in relation to GM IR cotton (India). This benefit may be especially beneficial for smaller farmers who tend to have fewer options than larger farmers to reduce their vulnerability to risk (Zilberman et al (2007));
• Higher quality of crop. There is a growing body of research evidence relating to the superior quality of biotech IR maize relative to conventional and organic maize from the reduction in corn boring pest damage (eg, Bakan et al (2002), Poeydemenge (2006)). Reduced pest damage to the crop results in a reduction in the amount of fumonisins building up in the crop and as a result a significant fall in the amount of cancer-causing mycotoxins in the maize. This then results in less maize being rejected by users in both the food and feed using sectors.
3.6 Environmental impacts (from changes in pesticide use)
3.6.1 General Assessment of the impact of biotech crops on herbicide and insecticide use requires comparisons of the respective weed and pest control measures used on biotech versus the ‘conventional alternative’
Potential impact of using GM maize in Ukraine
19
form of production. This presents a number of challenges relating to availability and representativeness.
The most common way in which environmental impact associated with pesticide use changes with biotech crops (and with the adoption of other production systems) has typically been presented in the literature has been in terms of the volume (quantity) of pesticide applied. However, whilst the amount of pesticide applied to a crop is one way of trying to measure the environmental impact of pesticide use, this is not a good measure of environmental impact because the toxicity and risk of each pesticide is not directly related to the amount (weight) applied. For example, the environmental impact of applying one kg of dioxin to a crop or land is far more toxic than applying 1 kg of salt. There exist alternative (and better) measures that have been used by a number of authors of peer reviewed papers to assess the environmental impact of pesticide use change with biotech crops rather than simply looking at changes in the volume of active ingredient applied to crops. In particular, there are a number of peer reviewed papers that utilise the Environmental Impact Quotient (EIQ) developed at Cornell University by Kovach et al (1992) and updated annually. This integrates the various environmental impacts of individual pesticides (eg, on farm workers, consumers, ecology: see Appendix 2 for additional information) into a single ‘field value per hectare’. The EIQ value is multiplied by the amount of pesticide active ingredient (ai) used per hectare to produce a field EIQ value. For example, the EIQ rating for glyphosate is 15.33. By using this rating multiplied by the amount of glyphosate used per hectare (eg, a hypothetical example of 1.1 kg applied per ha), the field EIQ value for glyphosate would be equivalent to 16.86/ha. The EIQ indicator used is therefore a comparison of the field EIQ/ha for conventional versus GM crop production systems, with the total environmental impact or load of each system, a direct function of respective field EIQ/ha values and the area planted to each type of production (GM versus conventional). The use of environmental indicators is commonly used by researchers and the EIQ indicator has been, for example, cited by Brimner et al (2004), in a study comparing the environmental impacts of GM and conventional canola, and by Kleiter et al (2005). The author of this analysis has also used the EIQ indicator now for several years because it:
• Summarises significant amounts of information on pesticide impact into a single value that, with data on usage rates (amount of active used per hectare) can be readily used to make comparisons between different production systems across many regions and countries;
• Provides an improved assessment of the impact of biotech crops on the environment when compared to only examining changes in volume of active ingredient applied, because it draws on some of the key toxicity and environmental exposure data related to individual products, as applicable to impacts on farm workers, consumers and ecology.
The author does however acknowledge that the EIQ is only a hazard indicator and has important weaknesses (see for example, Peterson R and Schleier J (2014)). It is a hazard rating indicator that does not assess risk or probability of exposure to pesticides. It also relies on qualitative assumptions for the scaling and weighting of (quantitative) risk information that can result, for example, in a low risk rating for one factor (eg, impact on farm workers) may cancel out a high risk rating factor for another factor (eg, impact on ecology). Fundamentally, assessing the full environmental impact of pesticide use changes with different production systems is complex and requires an evaluation of risk exposure to pesticides at a site specific level. This requires substantial collection of (site-specific) data (eg, on ground water levels, soil structure) and/or the application of standard scenario models for
Potential impact of using GM maize in Ukraine
20
exposure in a number of locations. Undertaking such an exercise at a global level would require a substantial and ongoing input of labour and time, if comprehensive environmental impact of pesticide change analysis is to be completed. It is not surprising that no such exercise has, to date been undertaken, or likely to be in the near future.
Despite the acknowledged weaknesses of the EIQ as an indictor of pesticide environmental impact, the author of this paper continues to use the EIQ as an indicator of the environmental impact of pesticide use change with biotech crops because it is, in his view, a superior indicator to only using amount of pesticide active ingredient applied and can be relatively easily replicated across countries to facilitate comparisons. In this paper, the EIQ indicator is used in conjunction with examining changes in the volume of pesticide active ingredient applied.
3.6.2 Biotech HT maize A key impact of biotech HT (largely tolerant to glyphosate) technology use has been a change in the profile of herbicides typically used. A broad range of, mostly selective (grass weed and broad-leaved weed) herbicides, has been replaced by one or two broad-spectrum herbicides (mostly glyphosate).
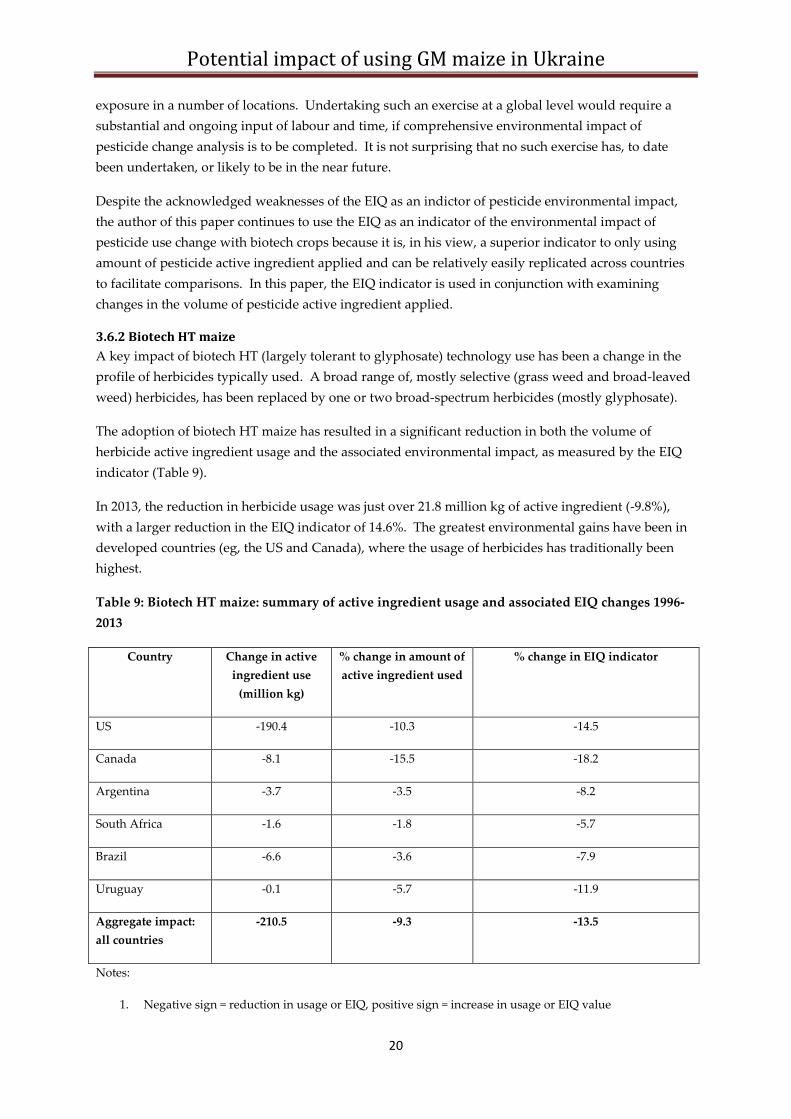
The adoption of biotech HT maize has resulted in a significant reduction in both the volume of herbicide active ingredient usage and the associated environmental impact, as measured by the EIQ indicator (Table 9).
In 2013, the reduction in herbicide usage was just over 21.8 million kg of active ingredient (-9.8%), with a larger reduction in the EIQ indicator of 14.6%. The greatest environmental gains have been in developed countries (eg, the US and Canada), where the usage of herbicides has traditionally been highest.
Table 9: Biotech HT maize: summary of active ingredient usage and associated EIQ changes 1996-2013
Country Change in active ingredient use
(million kg)
% change in amount of active ingredient used
% change in EIQ indicator
US -190.4 -10.3 -14.5
Canada -8.1 -15.5 -18.2
Argentina -3.7 -3.5 -8.2
South Africa -1.6 -1.8 -5.7
Brazil -6.6 -3.6 -7.9
Uruguay -0.1 -5.7 -11.9
Aggregate impact: all countries
-210.5 -9.3 -13.5
Notes:
1. Negative sign = reduction in usage or EIQ, positive sign = increase in usage or EIQ value
Potential impact of using GM maize in Ukraine
21
2. Other countries using biotech HT maize – Colombia and the Philippines, not included due to lack of data. Also, hand weeding is an important form of weed control suggesting any reduction in herbicide use with biotech HT maize has been more limited than in the countries shown in this table
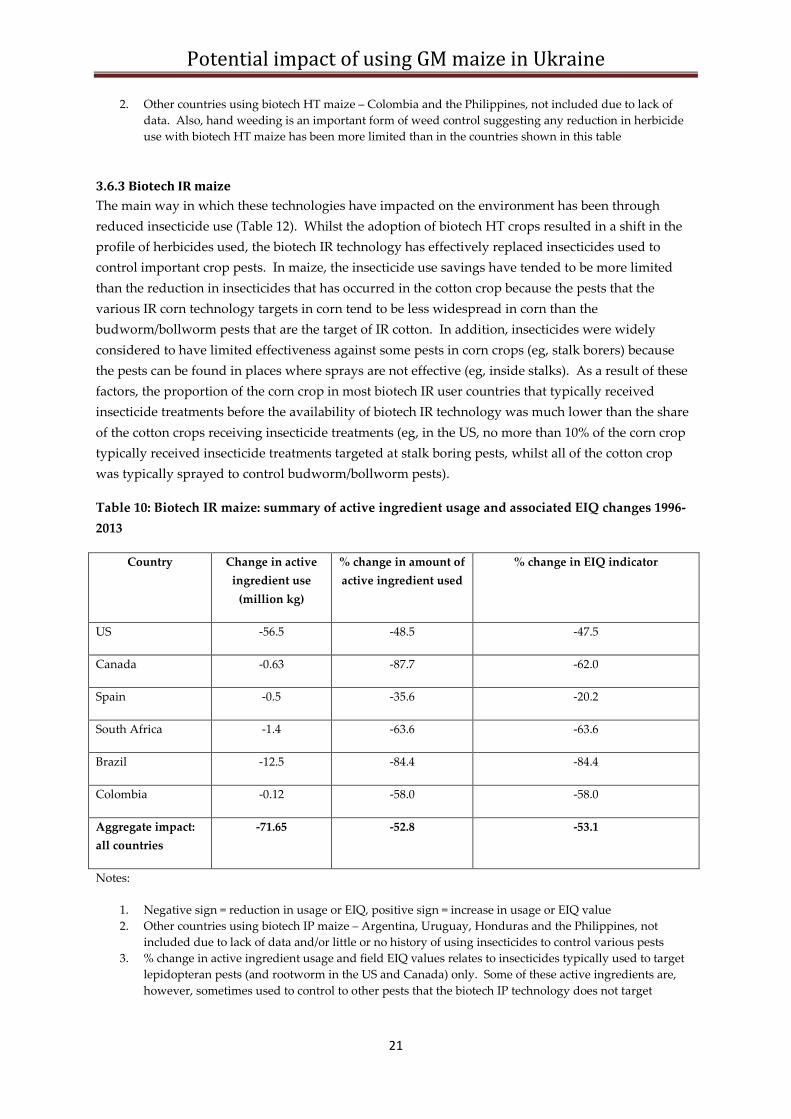
3.6.3 Biotech IR maize The main way in which these technologies have impacted on the environment has been through reduced insecticide use (Table 12). Whilst the adoption of biotech HT crops resulted in a shift in the profile of herbicides used, the biotech IR technology has effectively replaced insecticides used to control important crop pests. In maize, the insecticide use savings have tended to be more limited than the reduction in insecticides that has occurred in the cotton crop because the pests that the various IR corn technology targets in corn tend to be less widespread in corn than the budworm/bollworm pests that are the target of IR cotton. In addition, insecticides were widely considered to have limited effectiveness against some pests in corn crops (eg, stalk borers) because the pests can be found in places where sprays are not effective (eg, inside stalks). As a result of these factors, the proportion of the corn crop in most biotech IR user countries that typically received insecticide treatments before the availability of biotech IR technology was much lower than the share of the cotton crops receiving insecticide treatments (eg, in the US, no more than 10% of the corn crop typically received insecticide treatments targeted at stalk boring pests, whilst all of the cotton crop was typically sprayed to control budworm/bollworm pests).
Table 10: Biotech IR maize: summary of active ingredient usage and associated EIQ changes 1996-2013
Country Change in active ingredient use
(million kg)
% change in amount of active ingredient used
% change in EIQ indicator
US -56.5 -48.5 -47.5
Canada -0.63 -87.7 -62.0
Spain -0.5 -35.6 -20.2
South Africa -1.4 -63.6 -63.6
Brazil -12.5 -84.4 -84.4
Colombia -0.12 -58.0 -58.0
Aggregate impact: all countries
-71.65 -52.8 -53.1
Notes:
1. Negative sign = reduction in usage or EIQ, positive sign = increase in usage or EIQ value 2. Other countries using biotech IP maize – Argentina, Uruguay, Honduras and the Philippines, not
included due to lack of data and/or little or no history of using insecticides to control various pests 3. % change in active ingredient usage and field EIQ values relates to insecticides typically used to target
lepidopteran pests (and rootworm in the US and Canada) only. Some of these active ingredients are, however, sometimes used to control to other pests that the biotech IP technology does not target
Potential impact of using GM maize in Ukraine
22
The global insecticide saving from using biotech IR maize in 2013 was 8.2 million kg (-83.8% of insecticides typically targeted at corn stalk boring and rootworm pests) of active ingredient use. In EIQ indictor terms, the saving, in 2013, was 88.9% for insecticides targeted at corn stalk boring and rootworm pests. Cumulatively since 1996, the gain has been a 71.7 million kg reduction in corn insecticide active ingredient use.
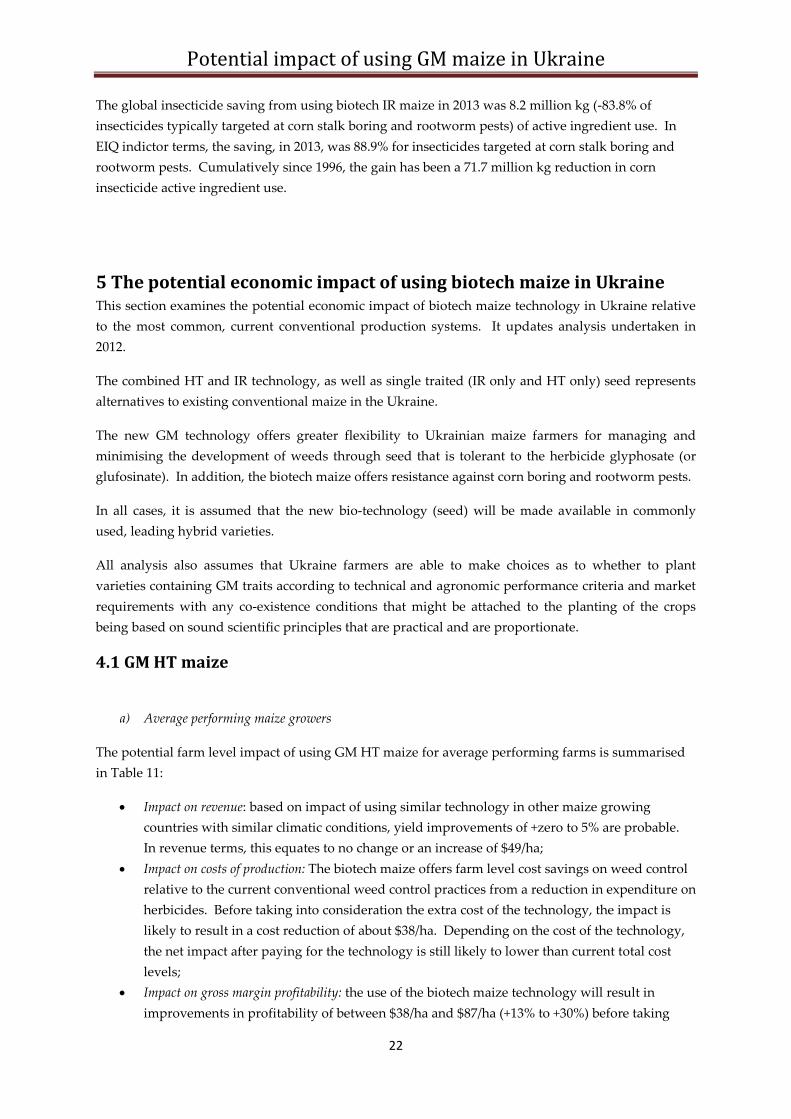
5 The potential economic impact of using biotech maize in Ukraine This section examines the potential economic impact of biotech maize technology in Ukraine relative to the most common, current conventional production systems. It updates analysis undertaken in 2012.
The combined HT and IR technology, as well as single traited (IR only and HT only) seed represents alternatives to existing conventional maize in the Ukraine.
The new GM technology offers greater flexibility to Ukrainian maize farmers for managing and minimising the development of weeds through seed that is tolerant to the herbicide glyphosate (or glufosinate). In addition, the biotech maize offers resistance against corn boring and rootworm pests.
In all cases, it is assumed that the new bio-technology (seed) will be made available in commonly used, leading hybrid varieties.
All analysis also assumes that Ukraine farmers are able to make choices as to whether to plant varieties containing GM traits according to technical and agronomic performance criteria and market requirements with any co-existence conditions that might be attached to the planting of the crops being based on sound scientific principles that are practical and are proportionate.
4.1 GM HT maize
a) Average performing maize growers
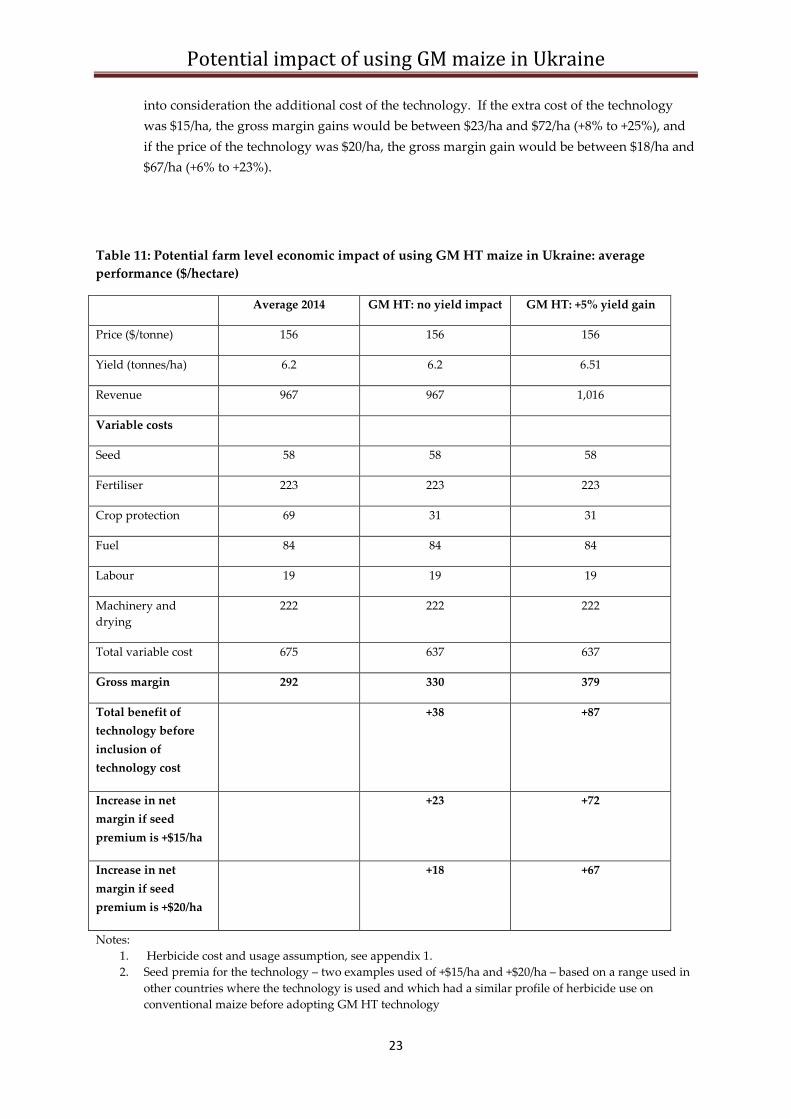
The potential farm level impact of using GM HT maize for average performing farms is summarised in Table 11:
• Impact on revenue: based on impact of using similar technology in other maize growing countries with similar climatic conditions, yield improvements of +zero to 5% are probable. In revenue terms, this equates to no change or an increase of $49/ha;
• Impact on costs of production: The biotech maize offers farm level cost savings on weed control relative to the current conventional weed control practices from a reduction in expenditure on herbicides. Before taking into consideration the extra cost of the technology, the impact is likely to result in a cost reduction of about $38/ha. Depending on the cost of the technology, the net impact after paying for the technology is still likely to lower than current total cost levels;
• Impact on gross margin profitability: the use of the biotech maize technology will result in improvements in profitability of between $38/ha and $87/ha (+13% to +30%) before taking
Potential impact of using GM maize in Ukraine
23
into consideration the additional cost of the technology. If the extra cost of the technology was $15/ha, the gross margin gains would be between $23/ha and $72/ha (+8% to +25%), and if the price of the technology was $20/ha, the gross margin gain would be between $18/ha and $67/ha (+6% to +23%).
Table 11: Potential farm level economic impact of using GM HT maize in Ukraine: average performance ($/hectare)
Average 2014 GM HT: no yield impact GM HT: +5% yield gain
Price ($/tonne) 156 156 156
Yield (tonnes/ha) 6.2 6.2 6.51
Revenue 967 967 1,016
Variable costs
Seed 58 58 58
Fertiliser 223 223 223
Crop protection 69 31 31
Fuel 84 84 84
Labour 19 19 19
Machinery and drying
222 222 222
Total variable cost 675 637 637
Gross margin 292 330 379
Total benefit of technology before inclusion of technology cost
+38 +87
Increase in net margin if seed premium is +$15/ha
+23 +72
Increase in net margin if seed premium is +$20/ha
+18 +67
Notes: 1. Herbicide cost and usage assumption, see appendix 1. 2. Seed premia for the technology – two examples used of +$15/ha and +$20/ha – based on a range used in
other countries where the technology is used and which had a similar profile of herbicide use on conventional maize before adopting GM HT technology
Potential impact of using GM maize in Ukraine
24
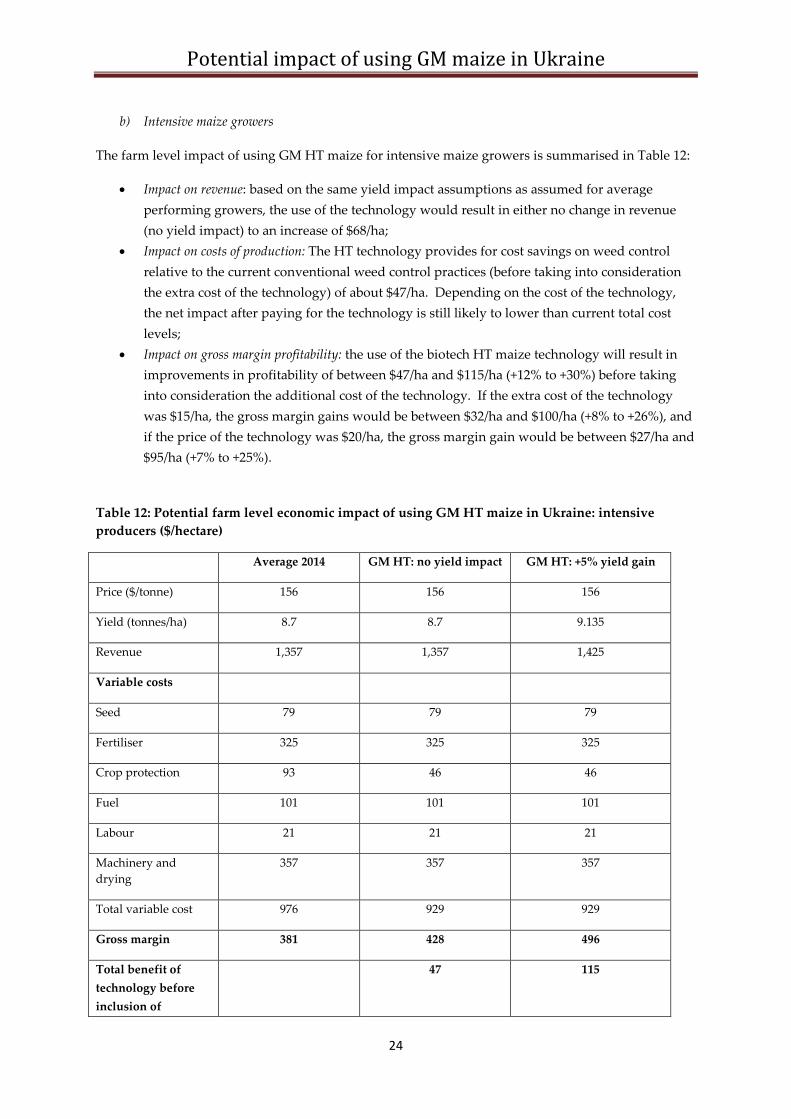
b) Intensive maize growers
The farm level impact of using GM HT maize for intensive maize growers is summarised in Table 12:
• Impact on revenue: based on the same yield impact assumptions as assumed for average performing growers, the use of the technology would result in either no change in revenue (no yield impact) to an increase of $68/ha;
• Impact on costs of production: The HT technology provides for cost savings on weed control relative to the current conventional weed control practices (before taking into consideration the extra cost of the technology) of about $47/ha. Depending on the cost of the technology, the net impact after paying for the technology is still likely to lower than current total cost levels;
• Impact on gross margin profitability: the use of the biotech HT maize technology will result in improvements in profitability of between $47/ha and $115/ha (+12% to +30%) before taking into consideration the additional cost of the technology. If the extra cost of the technology was $15/ha, the gross margin gains would be between $32/ha and $100/ha (+8% to +26%), and if the price of the technology was $20/ha, the gross margin gain would be between $27/ha and $95/ha (+7% to +25%).
Table 12: Potential farm level economic impact of using GM HT maize in Ukraine: intensive producers ($/hectare)
Average 2014 GM HT: no yield impact GM HT: +5% yield gain
Price ($/tonne) 156 156 156
Yield (tonnes/ha) 8.7 8.7 9.135
Revenue 1,357 1,357 1,425
Variable costs
Seed 79 79 79
Fertiliser 325 325 325
Crop protection 93 46 46
Fuel 101 101 101
Labour 21 21 21
Machinery and drying
357 357 357
Total variable cost 976 929 929
Gross margin 381 428 496
Total benefit of technology before inclusion of
47 115
Potential impact of using GM maize in Ukraine
25
technology cost
Increase in net margin if seed premium is +$15/ha
32 100
Increase in net margin if seed premium is +$20/ha
27 95
Notes: 1. Herbicide cost and usage assumption, see appendix 1. 2. Seed premia for the technology – two examples used of +$15/ha and +$20/ha – based on a range used in
other countries where the technology is used and which had a similar profile of herbicide use on conventional maize before adopting GM HT technology
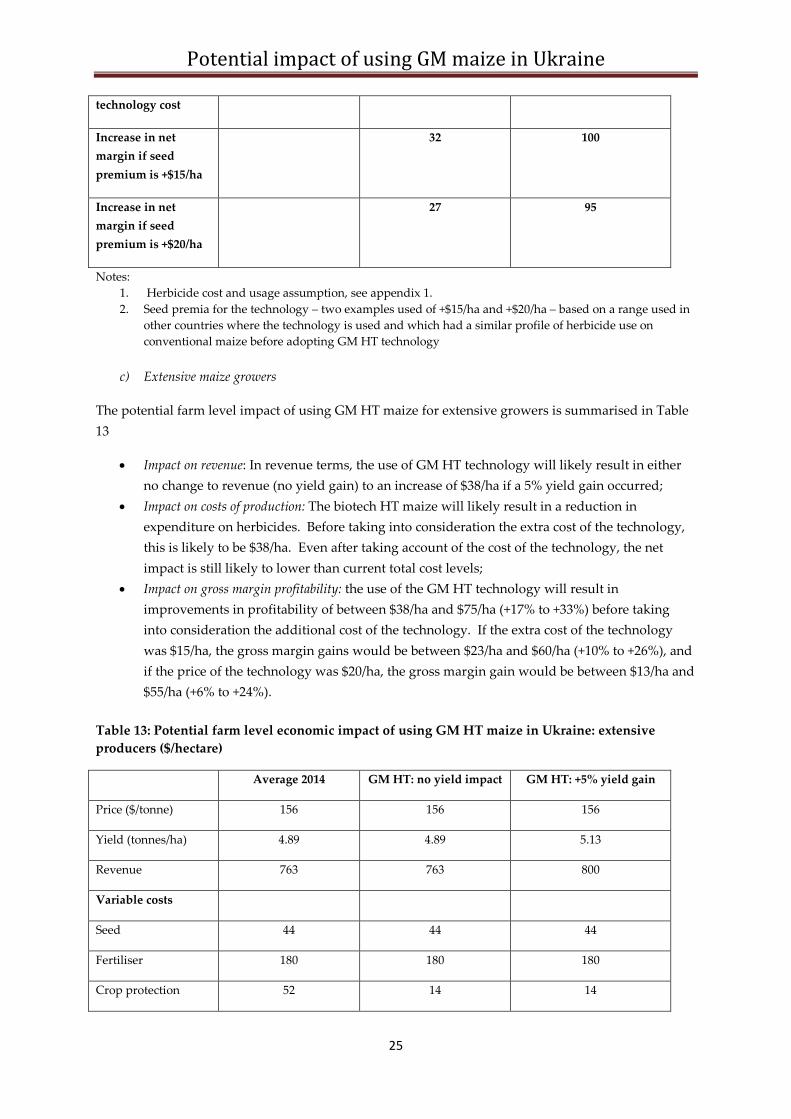
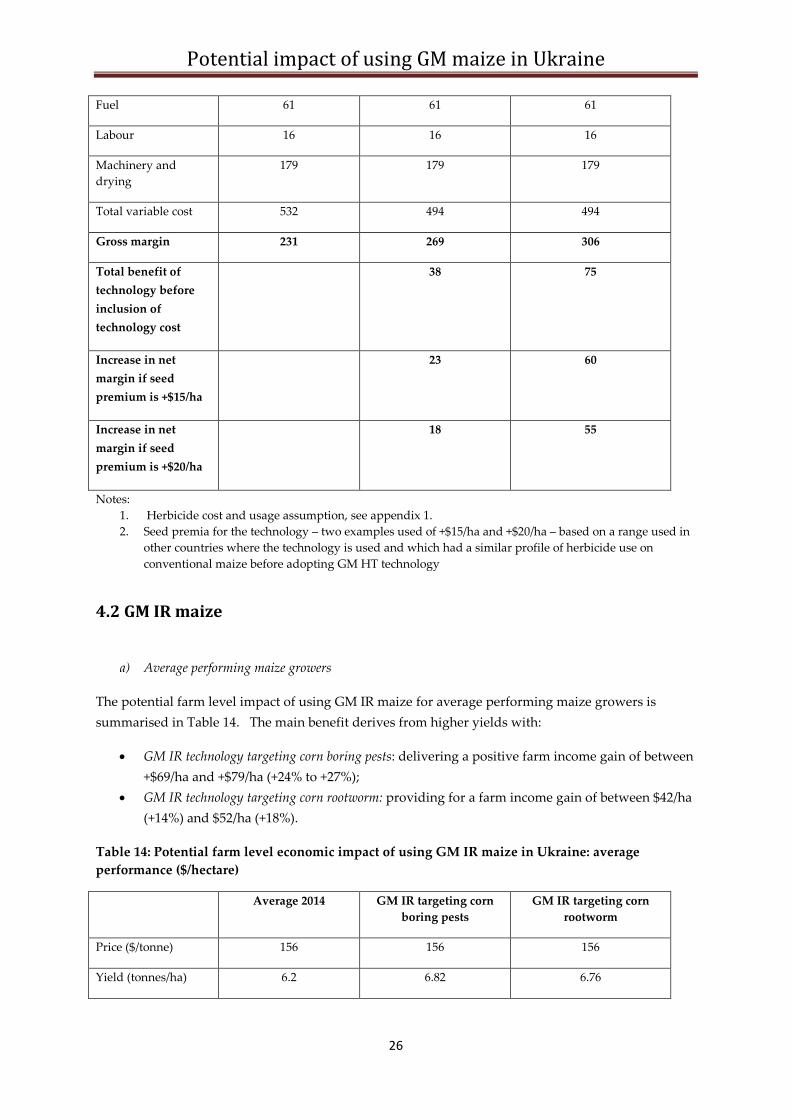
c) Extensive maize growers
The potential farm level impact of using GM HT maize for extensive growers is summarised in Table 13
• Impact on revenue: In revenue terms, the use of GM HT technology will likely result in either no change to revenue (no yield gain) to an increase of $38/ha if a 5% yield gain occurred;
• Impact on costs of production: The biotech HT maize will likely result in a reduction in expenditure on herbicides. Before taking into consideration the extra cost of the technology, this is likely to be $38/ha. Even after taking account of the cost of the technology, the net impact is still likely to lower than current total cost levels;
• Impact on gross margin profitability: the use of the GM HT technology will result in improvements in profitability of between $38/ha and $75/ha (+17% to +33%) before taking into consideration the additional cost of the technology. If the extra cost of the technology was $15/ha, the gross margin gains would be between $23/ha and $60/ha (+10% to +26%), and if the price of the technology was $20/ha, the gross margin gain would be between $13/ha and $55/ha (+6% to +24%).
Table 13: Potential farm level economic impact of using GM HT maize in Ukraine: extensive producers ($/hectare)
Average 2014 GM HT: no yield impact GM HT: +5% yield gain
Price ($/tonne) 156 156 156
Yield (tonnes/ha) 4.89 4.89 5.13
Revenue 763 763 800
Variable costs
Seed 44 44 44
Fertiliser 180 180 180
Crop protection 52 14 14
Potential impact of using GM maize in Ukraine
26
Fuel 61 61 61
Labour 16 16 16
Machinery and drying
179 179 179
Total variable cost 532 494 494
Gross margin 231 269 306
Total benefit of technology before inclusion of technology cost
38 75
Increase in net margin if seed premium is +$15/ha
23 60
Increase in net margin if seed premium is +$20/ha
18 55
Notes: 1. Herbicide cost and usage assumption, see appendix 1. 2. Seed premia for the technology – two examples used of +$15/ha and +$20/ha – based on a range used in
other countries where the technology is used and which had a similar profile of herbicide use on conventional maize before adopting GM HT technology
4.2 GM IR maize
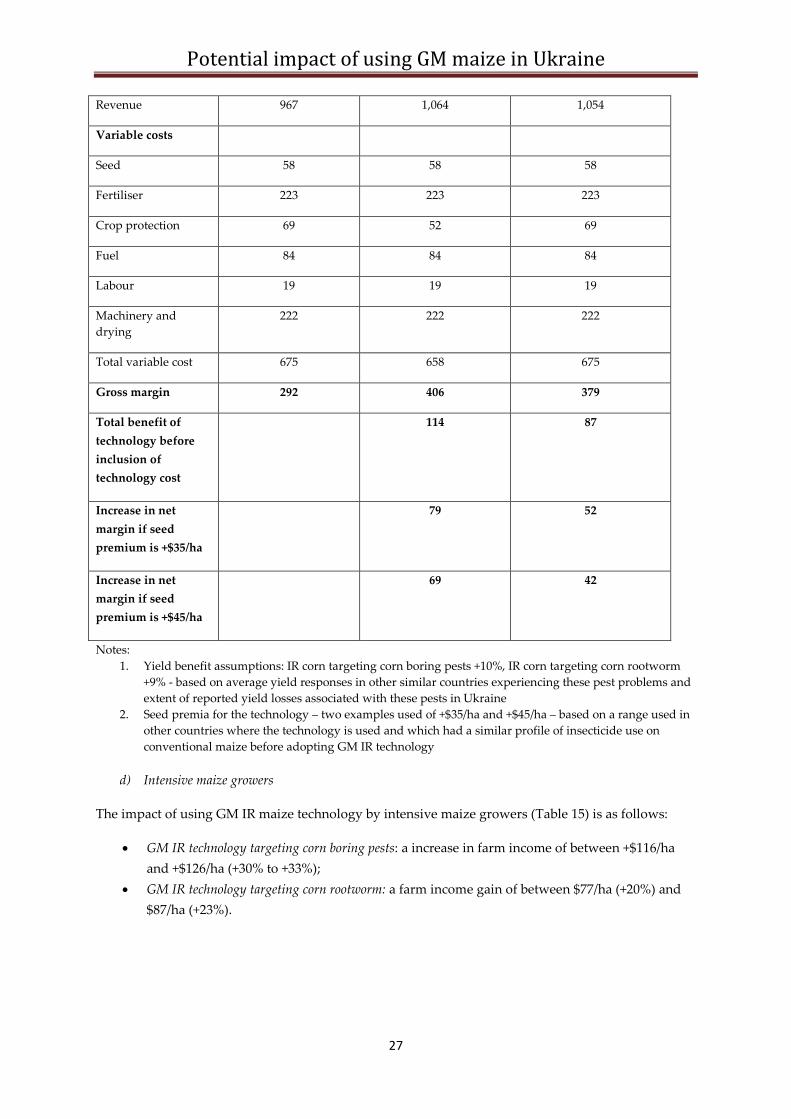
a) Average performing maize growers
The potential farm level impact of using GM IR maize for average performing maize growers is summarised in Table 14. The main benefit derives from higher yields with:
• GM IR technology targeting corn boring pests: delivering a positive farm income gain of between +$69/ha and +$79/ha (+24% to +27%);
• GM IR technology targeting corn rootworm: providing for a farm income gain of between $42/ha (+14%) and $52/ha (+18%).
Table 14: Potential farm level economic impact of using GM IR maize in Ukraine: average performance ($/hectare)
Average 2014 GM IR targeting corn boring pests
GM IR targeting corn rootworm
Price ($/tonne) 156 156 156
Yield (tonnes/ha) 6.2 6.82 6.76
Potential impact of using GM maize in Ukraine
27
Revenue 967 1,064 1,054
Variable costs
Seed 58 58 58
Fertiliser 223 223 223
Crop protection 69 52 69
Fuel 84 84 84
Labour 19 19 19
Machinery and drying
222 222 222
Total variable cost 675 658 675
Gross margin 292 406 379
Total benefit of technology before inclusion of technology cost
114 87
Increase in net margin if seed premium is +$35/ha
79 52
Increase in net margin if seed premium is +$45/ha
69 42
Notes: 1. Yield benefit assumptions: IR corn targeting corn boring pests +10%, IR corn targeting corn rootworm
+9% - based on average yield responses in other similar countries experiencing these pest problems and extent of reported yield losses associated with these pests in Ukraine
2. Seed premia for the technology – two examples used of +$35/ha and +$45/ha – based on a range used in other countries where the technology is used and which had a similar profile of insecticide use on conventional maize before adopting GM IR technology
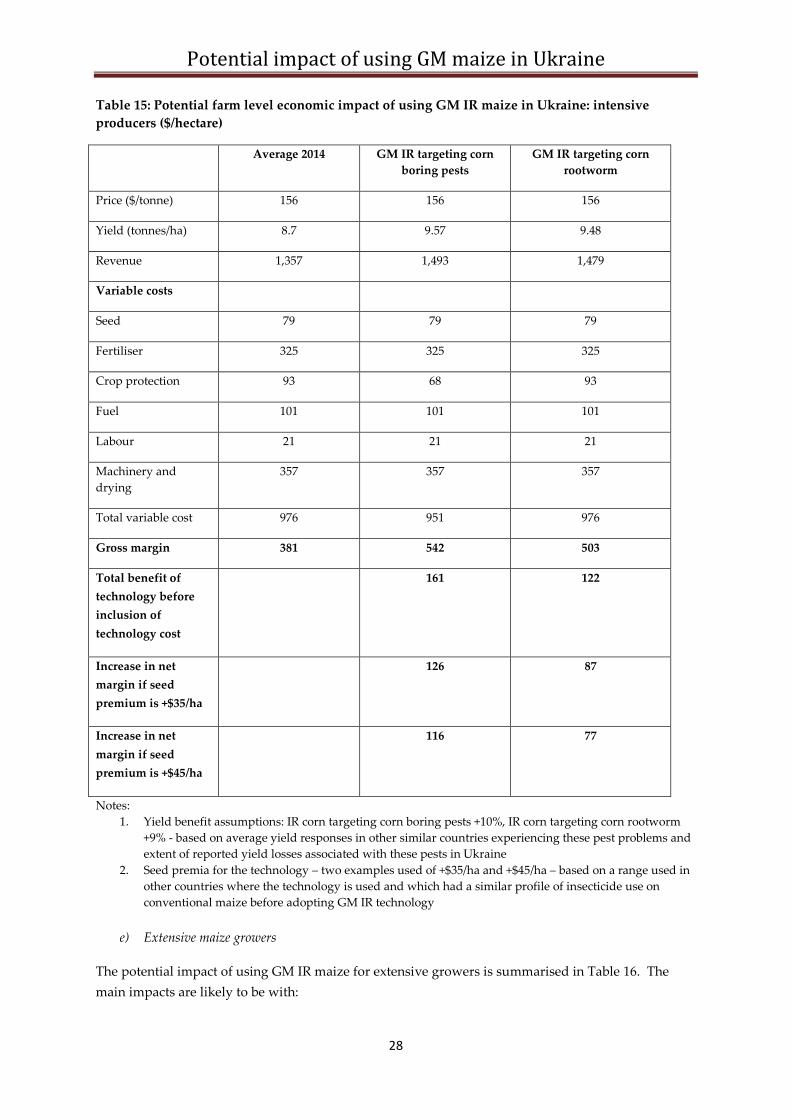
d) Intensive maize growers
The impact of using GM IR maize technology by intensive maize growers (Table 15) is as follows:
• GM IR technology targeting corn boring pests: a increase in farm income of between +$116/ha and +$126/ha (+30% to +33%);
• GM IR technology targeting corn rootworm: a farm income gain of between $77/ha (+20%) and $87/ha (+23%).
Potential impact of using GM maize in Ukraine
28
Table 15: Potential farm level economic impact of using GM IR maize in Ukraine: intensive producers ($/hectare)
Average 2014 GM IR targeting corn boring pests
GM IR targeting corn rootworm
Price ($/tonne) 156 156 156
Yield (tonnes/ha) 8.7 9.57 9.48
Revenue 1,357 1,493 1,479
Variable costs
Seed 79 79 79
Fertiliser 325 325 325
Crop protection 93 68 93
Fuel 101 101 101
Labour 21 21 21
Machinery and drying
357 357 357
Total variable cost 976 951 976
Gross margin 381 542 503
Total benefit of technology before inclusion of technology cost
161 122
Increase in net margin if seed premium is +$35/ha
126 87
Increase in net margin if seed premium is +$45/ha
116 77
Notes: 1. Yield benefit assumptions: IR corn targeting corn boring pests +10%, IR corn targeting corn rootworm
+9% - based on average yield responses in other similar countries experiencing these pest problems and extent of reported yield losses associated with these pests in Ukraine
2. Seed premia for the technology – two examples used of +$35/ha and +$45/ha – based on a range used in other countries where the technology is used and which had a similar profile of insecticide use on conventional maize before adopting GM IR technology
e) Extensive maize growers
The potential impact of using GM IR maize for extensive growers is summarised in Table 16. The main impacts are likely to be with:
Potential impact of using GM maize in Ukraine
29
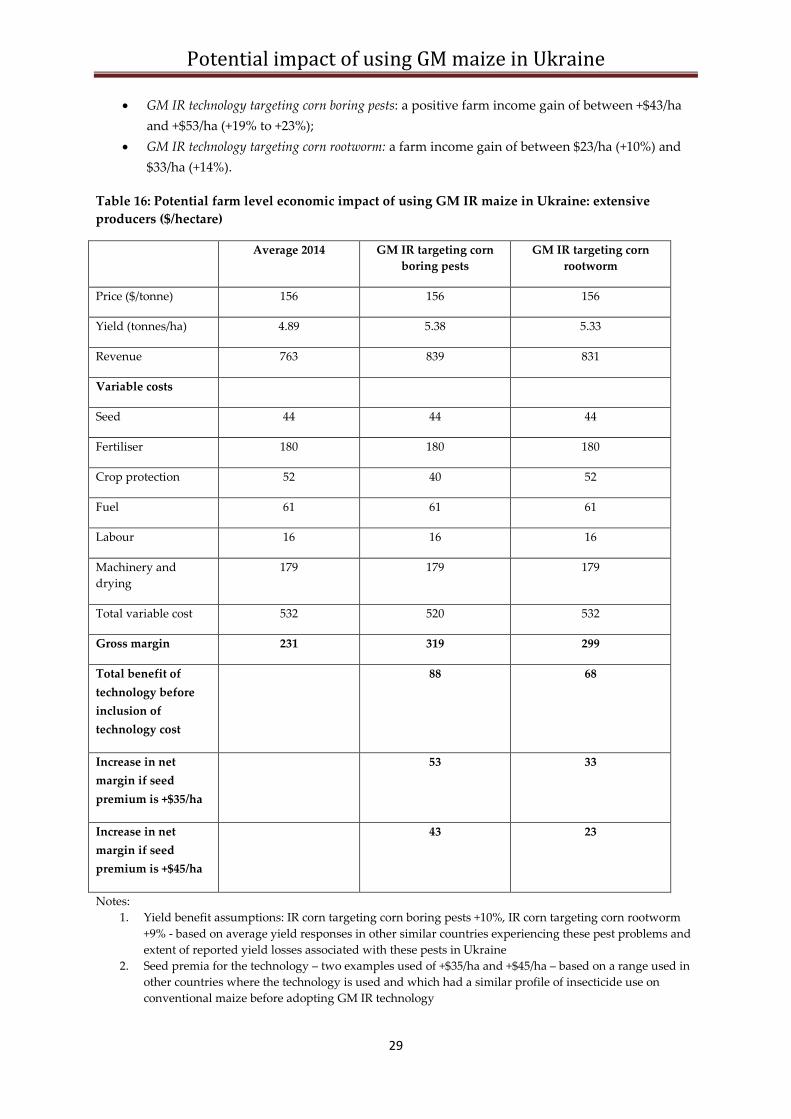
• GM IR technology targeting corn boring pests: a positive farm income gain of between +$43/ha and +$53/ha (+19% to +23%);
• GM IR technology targeting corn rootworm: a farm income gain of between $23/ha (+10%) and $33/ha (+14%).
Table 16: Potential farm level economic impact of using GM IR maize in Ukraine: extensive producers ($/hectare)
Average 2014 GM IR targeting corn boring pests
GM IR targeting corn rootworm
Price ($/tonne) 156 156 156
Yield (tonnes/ha) 4.89 5.38 5.33
Revenue 763 839 831
Variable costs
Seed 44 44 44
Fertiliser 180 180 180
Crop protection 52 40 52
Fuel 61 61 61
Labour 16 16 16
Machinery and drying
179 179 179
Total variable cost 532 520 532
Gross margin 231 319 299
Total benefit of technology before inclusion of technology cost
88 68
Increase in net margin if seed premium is +$35/ha
53 33
Increase in net margin if seed premium is +$45/ha
43 23
Notes: 1. Yield benefit assumptions: IR corn targeting corn boring pests +10%, IR corn targeting corn rootworm
+9% - based on average yield responses in other similar countries experiencing these pest problems and extent of reported yield losses associated with these pests in Ukraine
2. Seed premia for the technology – two examples used of +$35/ha and +$45/ha – based on a range used in other countries where the technology is used and which had a similar profile of insecticide use on conventional maize before adopting GM IR technology
Potential impact of using GM maize in Ukraine
30
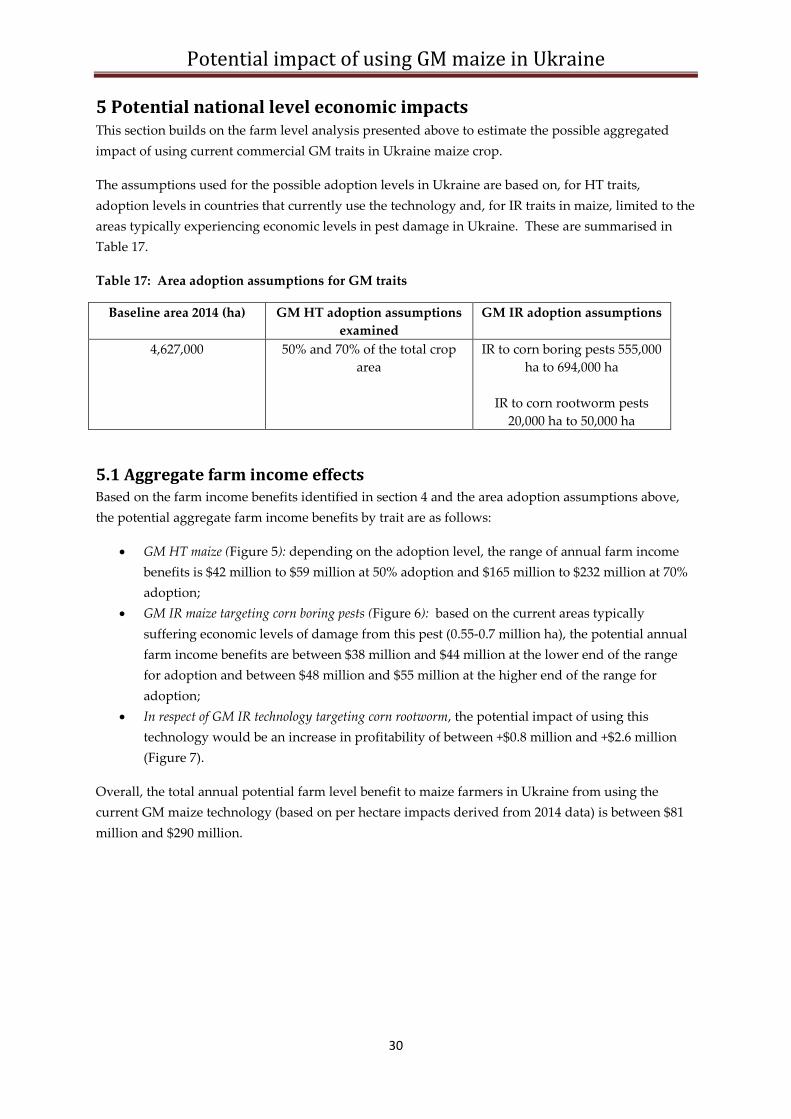
5 Potential national level economic impacts This section builds on the farm level analysis presented above to estimate the possible aggregated impact of using current commercial GM traits in Ukraine maize crop.
The assumptions used for the possible adoption levels in Ukraine are based on, for HT traits, adoption levels in countries that currently use the technology and, for IR traits in maize, limited to the areas typically experiencing economic levels in pest damage in Ukraine. These are summarised in Table 17.
Table 17: Area adoption assumptions for GM traits
Baseline area 2014 (ha) GM HT adoption assumptions examined
GM IR adoption assumptions
4,627,000 50% and 70% of the total crop area
IR to corn boring pests 555,000 ha to 694,000 ha
IR to corn rootworm pests
20,000 ha to 50,000 ha
5.1 Aggregate farm income effects Based on the farm income benefits identified in section 4 and the area adoption assumptions above, the potential aggregate farm income benefits by trait are as follows:
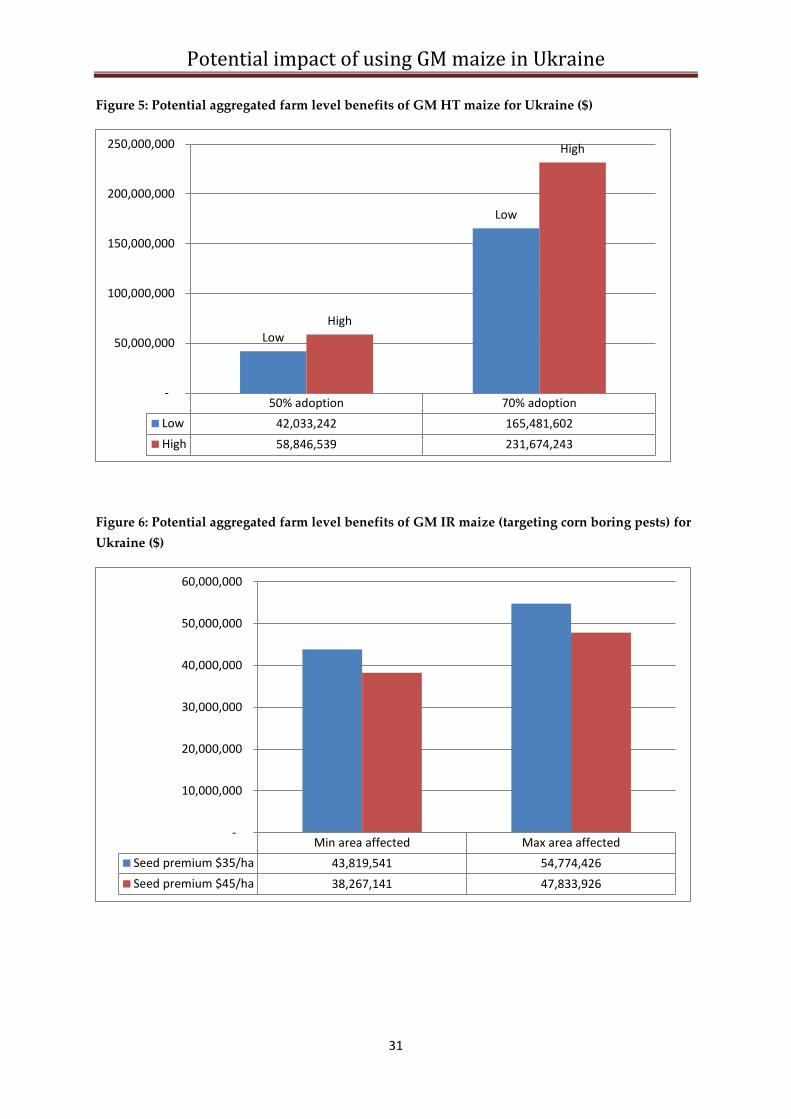
• GM HT maize (Figure 5): depending on the adoption level, the range of annual farm income benefits is $42 million to $59 million at 50% adoption and $165 million to $232 million at 70% adoption;
• GM IR maize targeting corn boring pests (Figure 6): based on the current areas typically suffering economic levels of damage from this pest (0.55-0.7 million ha), the potential annual farm income benefits are between $38 million and $44 million at the lower end of the range for adoption and between $48 million and $55 million at the higher end of the range for adoption;
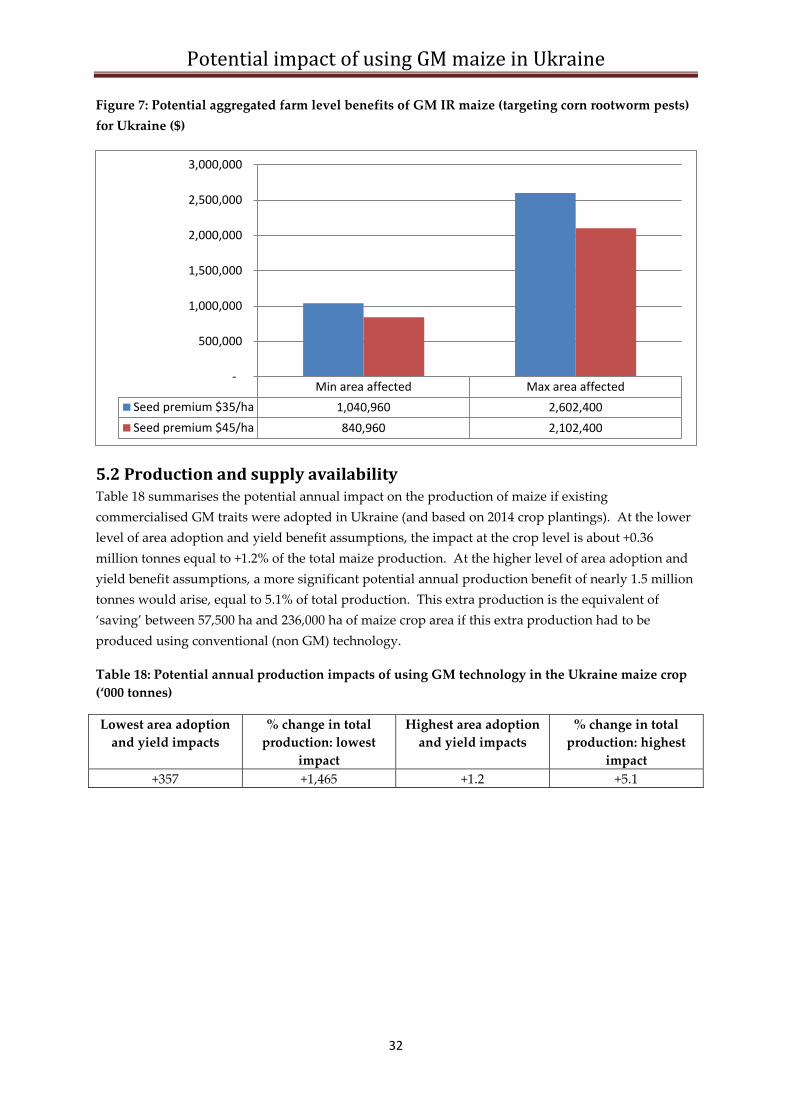
• In respect of GM IR technology targeting corn rootworm, the potential impact of using this technology would be an increase in profitability of between +$0.8 million and +$2.6 million (Figure 7).
Overall, the total annual potential farm level benefit to maize farmers in Ukraine from using the current GM maize technology (based on per hectare impacts derived from 2014 data) is between $81 million and $290 million.
Potential impact of using GM maize in Ukraine
31
Figure 5: Potential aggregated farm level benefits of GM HT maize for Ukraine ($)
Figure 6: Potential aggregated farm level benefits of GM IR maize (targeting corn boring pests) for Ukraine ($)
50% adoption 70% adoptionLow 42,033,242 165,481,602High 58,846,539 231,674,243
Low
Low
High
High
-
50,000,000
100,000,000
150,000,000
200,000,000
250,000,000
Min area affected Max area affectedSeed premium $35/ha 43,819,541 54,774,426Seed premium $45/ha 38,267,141 47,833,926
-
10,000,000
20,000,000
30,000,000
40,000,000
50,000,000
60,000,000
Potential impact of using GM maize in Ukraine
32
Figure 7: Potential aggregated farm level benefits of GM IR maize (targeting corn rootworm pests) for Ukraine ($)
5.2 Production and supply availability Table 18 summarises the potential annual impact on the production of maize if existing commercialised GM traits were adopted in Ukraine (and based on 2014 crop plantings). At the lower level of area adoption and yield benefit assumptions, the impact at the crop level is about +0.36 million tonnes equal to +1.2% of the total maize production. At the higher level of area adoption and yield benefit assumptions, a more significant potential annual production benefit of nearly 1.5 million tonnes would arise, equal to 5.1% of total production. This extra production is the equivalent of ‘saving’ between 57,500 ha and 236,000 ha of maize crop area if this extra production had to be produced using conventional (non GM) technology.
Table 18: Potential annual production impacts of using GM technology in the Ukraine maize crop (‘000 tonnes)
Lowest area adoption and yield impacts
% change in total production: lowest
impact
Highest area adoption and yield impacts
% change in total production: highest
impact +357 +1,465 +1.2 +5.1
Min area affected Max area affectedSeed premium $35/ha 1,040,960 2,602,400Seed premium $45/ha 840,960 2,102,400
-
500,000
1,000,000
1,500,000
2,000,000
2,500,000
3,000,000
Potential impact of using GM maize in Ukraine
33
6 Environmental impacts
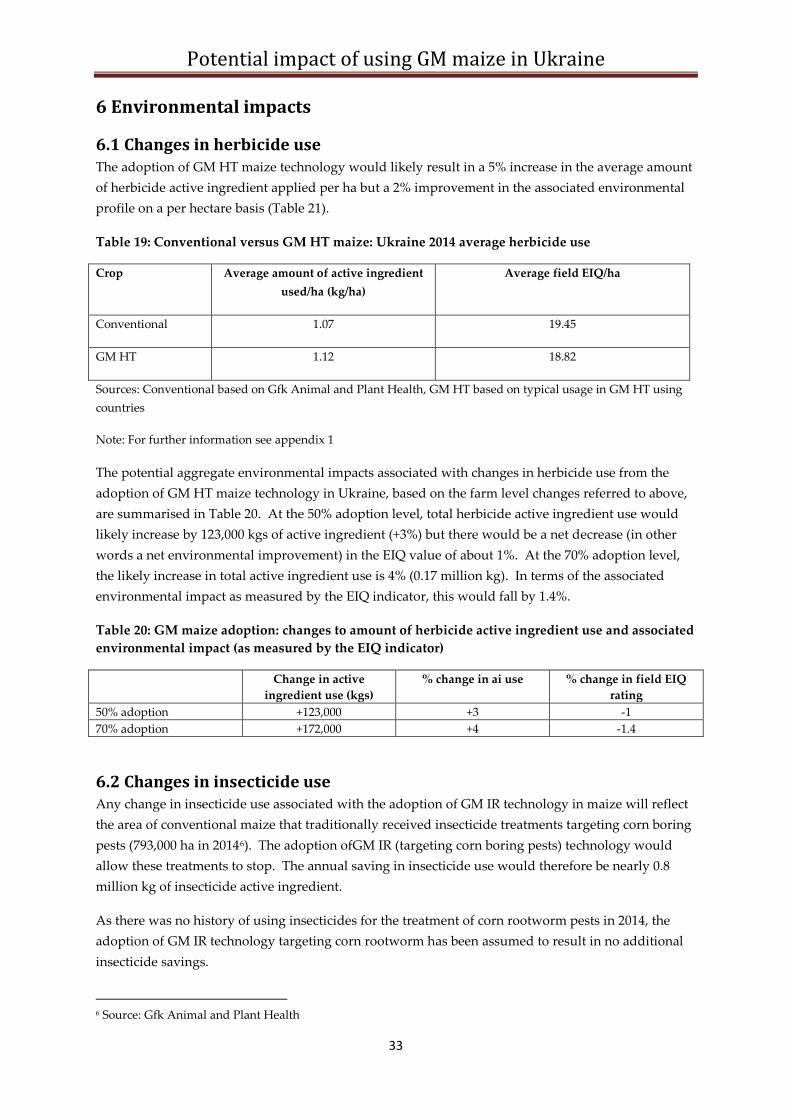
6.1 Changes in herbicide use The adoption of GM HT maize technology would likely result in a 5% increase in the average amount of herbicide active ingredient applied per ha but a 2% improvement in the associated environmental profile on a per hectare basis (Table 21).
Table 19: Conventional versus GM HT maize: Ukraine 2014 average herbicide use
Crop Average amount of active ingredient used/ha (kg/ha)
Average field EIQ/ha
Conventional 1.07 19.45
GM HT 1.12 18.82
Sources: Conventional based on Gfk Animal and Plant Health, GM HT based on typical usage in GM HT using countries
Note: For further information see appendix 1
The potential aggregate environmental impacts associated with changes in herbicide use from the adoption of GM HT maize technology in Ukraine, based on the farm level changes referred to above, are summarised in Table 20. At the 50% adoption level, total herbicide active ingredient use would likely increase by 123,000 kgs of active ingredient (+3%) but there would be a net decrease (in other words a net environmental improvement) in the EIQ value of about 1%. At the 70% adoption level, the likely increase in total active ingredient use is 4% (0.17 million kg). In terms of the associated environmental impact as measured by the EIQ indicator, this would fall by 1.4%.
Table 20: GM maize adoption: changes to amount of herbicide active ingredient use and associated environmental impact (as measured by the EIQ indicator)
Change in active ingredient use (kgs)
% change in ai use % change in field EIQ rating
50% adoption +123,000 +3 -1 70% adoption +172,000 +4 -1.4
6.2 Changes in insecticide use Any change in insecticide use associated with the adoption of GM IR technology in maize will reflect the area of conventional maize that traditionally received insecticide treatments targeting corn boring pests (793,000 ha in 20146). The adoption ofGM IR (targeting corn boring pests) technology would allow these treatments to stop. The annual saving in insecticide use would therefore be nearly 0.8 million kg of insecticide active ingredient.
As there was no history of using insecticides for the treatment of corn rootworm pests in 2014, the adoption of GM IR technology targeting corn rootworm has been assumed to result in no additional insecticide savings.
6 Source: Gfk Animal and Plant Health
Potential impact of using GM maize in Ukraine
34
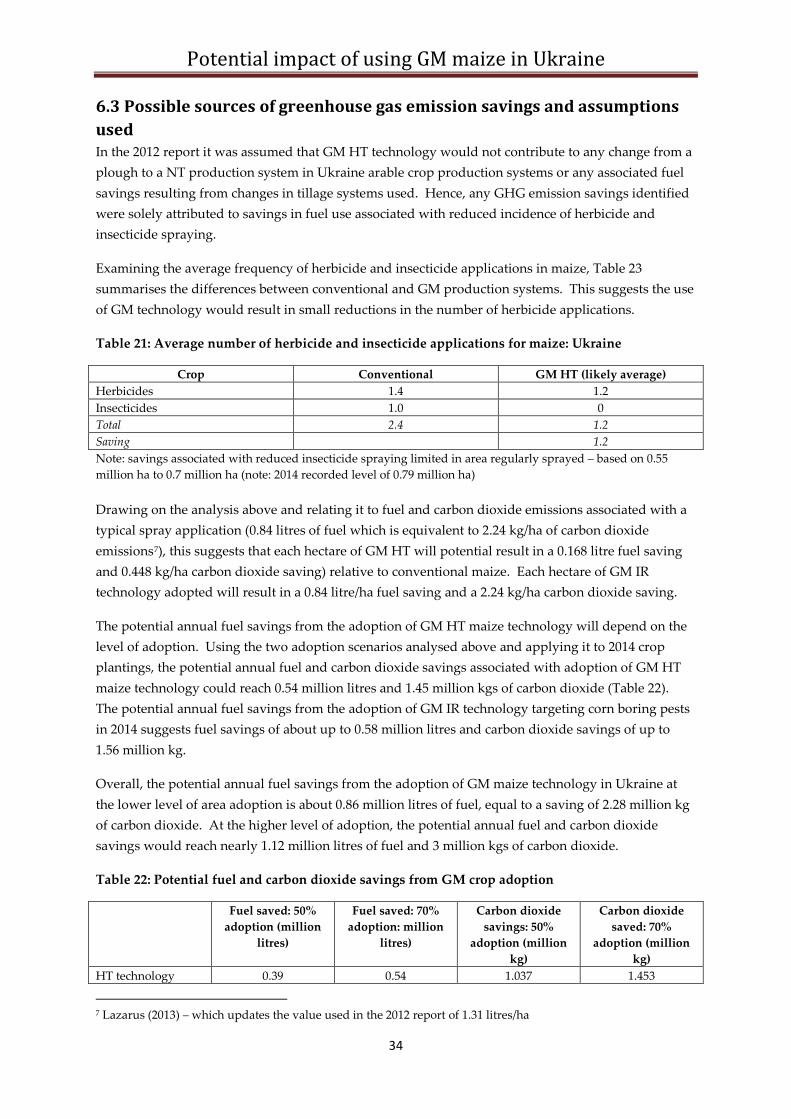
6.3 Possible sources of greenhouse gas emission savings and assumptions used In the 2012 report it was assumed that GM HT technology would not contribute to any change from a plough to a NT production system in Ukraine arable crop production systems or any associated fuel savings resulting from changes in tillage systems used. Hence, any GHG emission savings identified were solely attributed to savings in fuel use associated with reduced incidence of herbicide and insecticide spraying.
Examining the average frequency of herbicide and insecticide applications in maize, Table 23 summarises the differences between conventional and GM production systems. This suggests the use of GM technology would result in small reductions in the number of herbicide applications.
Table 21: Average number of herbicide and insecticide applications for maize: Ukraine
Crop Conventional GM HT (likely average) Herbicides 1.4 1.2 Insecticides 1.0 0 Total 2.4 1.2 Saving 1.2 Note: savings associated with reduced insecticide spraying limited in area regularly sprayed – based on 0.55 million ha to 0.7 million ha (note: 2014 recorded level of 0.79 million ha) Drawing on the analysis above and relating it to fuel and carbon dioxide emissions associated with a typical spray application (0.84 litres of fuel which is equivalent to 2.24 kg/ha of carbon dioxide emissions7), this suggests that each hectare of GM HT will potential result in a 0.168 litre fuel saving and 0.448 kg/ha carbon dioxide saving) relative to conventional maize. Each hectare of GM IR technology adopted will result in a 0.84 litre/ha fuel saving and a 2.24 kg/ha carbon dioxide saving.
The potential annual fuel savings from the adoption of GM HT maize technology will depend on the level of adoption. Using the two adoption scenarios analysed above and applying it to 2014 crop plantings, the potential annual fuel and carbon dioxide savings associated with adoption of GM HT maize technology could reach 0.54 million litres and 1.45 million kgs of carbon dioxide (Table 22). The potential annual fuel savings from the adoption of GM IR technology targeting corn boring pests in 2014 suggests fuel savings of about up to 0.58 million litres and carbon dioxide savings of up to 1.56 million kg.
Overall, the potential annual fuel savings from the adoption of GM maize technology in Ukraine at the lower level of area adoption is about 0.86 million litres of fuel, equal to a saving of 2.28 million kg of carbon dioxide. At the higher level of adoption, the potential annual fuel and carbon dioxide savings would reach nearly 1.12 million litres of fuel and 3 million kgs of carbon dioxide.
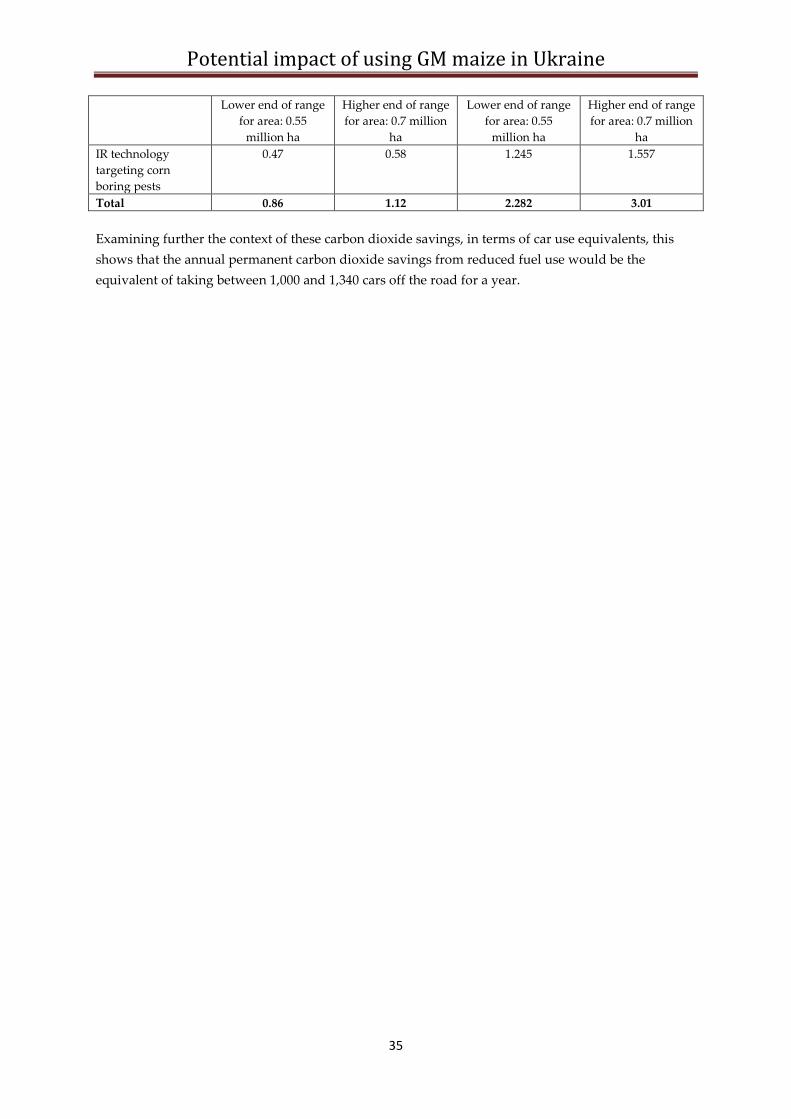
Table 22: Potential fuel and carbon dioxide savings from GM crop adoption
Fuel saved: 50% adoption (million
litres)
Fuel saved: 70% adoption: million
litres)
Carbon dioxide savings: 50%
adoption (million kg)
Carbon dioxide saved: 70%
adoption (million kg)
HT technology 0.39 0.54 1.037 1.453
7 Lazarus (2013) – which updates the value used in the 2012 report of 1.31 litres/ha
Potential impact of using GM maize in Ukraine
35
Lower end of range for area: 0.55
million ha
Higher end of range for area: 0.7 million
ha
Lower end of range for area: 0.55
million ha
Higher end of range for area: 0.7 million
ha IR technology targeting corn boring pests
0.47 0.58 1.245 1.557
Total 0.86 1.12 2.282 3.01 Examining further the context of these carbon dioxide savings, in terms of car use equivalents, this shows that the annual permanent carbon dioxide savings from reduced fuel use would be the equivalent of taking between 1,000 and 1,340 cars off the road for a year.
Potential impact of using GM maize in Ukraine
36
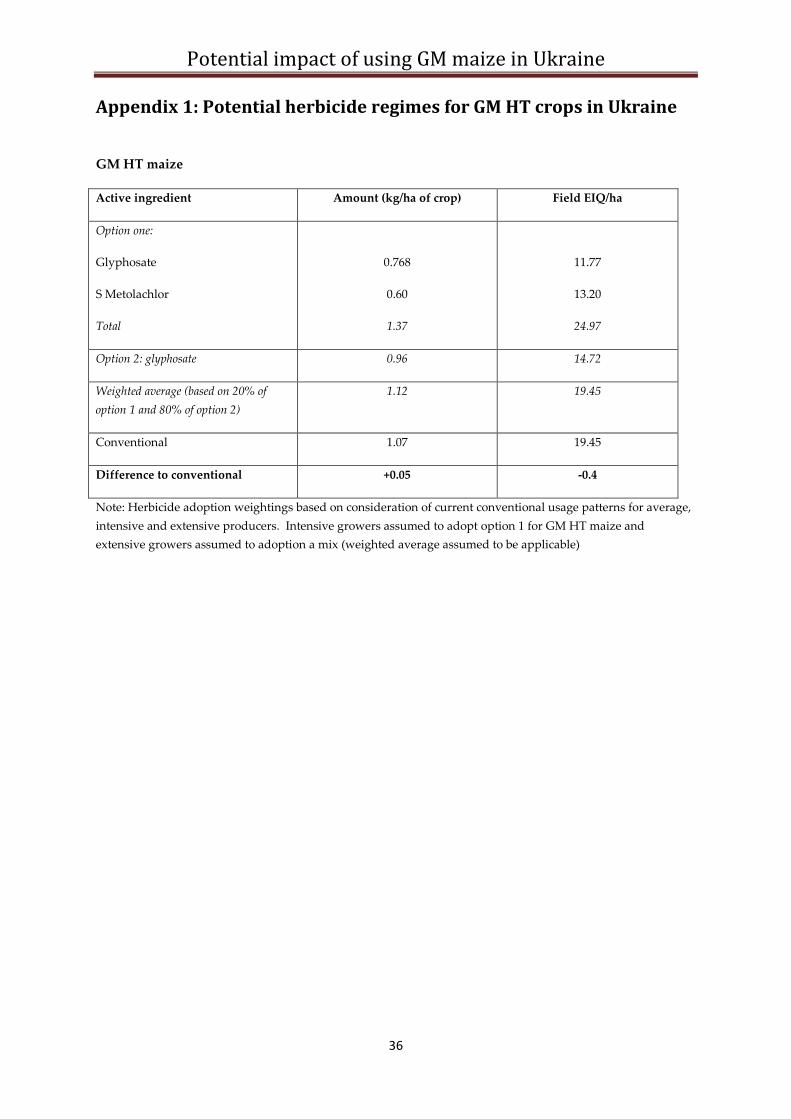
Appendix 1: Potential herbicide regimes for GM HT crops in Ukraine
GM HT maize
Active ingredient Amount (kg/ha of crop) Field EIQ/ha
Option one:
Glyphosate
S Metolachlor
Total
0.768
0.60
1.37
11.77
13.20
24.97
Option 2: glyphosate 0.96 14.72
Weighted average (based on 20% of option 1 and 80% of option 2)
1.12 19.45
Conventional 1.07 19.45
Difference to conventional +0.05 -0.4
Note: Herbicide adoption weightings based on consideration of current conventional usage patterns for average, intensive and extensive producers. Intensive growers assumed to adopt option 1 for GM HT maize and extensive growers assumed to adoption a mix (weighted average assumed to be applicable)
Potential impact of using GM maize in Ukraine
37
References Alston J et al (2003) An ex-ante analysis of the benefits from adoption of corn rootworm resistant, transgenic corn technology, AgBioforum vol 5, No 3, article 1 American Soybean Association Conservation Tillage Study (2001). http://www.soygrowers.com/ctstudy/ctstudy_files/frame.htm Bakan B, Melcion D, Richard-Molard D and Canagnier B. Fungal growth and fusarium mycotoxin content in isogenic traditional maize and GM maize grown in France and Sapin, 2002. J Agric Food Chem, 50, 728-731. Berés P and Lisowicz, F (2005) Effectiveness of Thricogramma spp. in maize protection against European corn borer (Ostrinia nubilalis Hbn.) in ecological farms. Progress in Plant Protection/Postepy W Ochronie Roslin 45, 47-51. Brookes G. The farm level impact of using Bt maize in Spain, ICABR conference paper 2003, Ravello, Italy. Also on www.pgeconomics.co.uk Brookes G. The benefits of adopting GM insect resistant (Bt) maize in the EU: first results from 1998-2006. 2008. International Journal of Biotechnology, vol 10, 2/3, pages 148-166 Brookes G and Barfoot P. Economic impact of GM crops: the global income and production effects 1996-2013, GM Crops, 2015, 6:1 Jan-Mar Brookes G and Barfoot P. Key environmental impacts of GM crops 1996-2013. GM Crops 2015, 6:2 April-June Conservation Tillage and Plant Biotechnology (CTIC: 2002) How new technologies can improve the environment by reducing the need to plough. http://www.ctic.purdue.edu/CTIC/Biotech.html Crost B and Shankar B. Bt cotton and production risk: panel data evidence. 2008. International Journal of Biotechnology, 10, 2/3, pp122-130 Fabrizzi et al (2003). Soil Carbon and Nitrogen Organic Fractions in Degraded VS Non-Degraded Mollisols in Argentina. Soil Sci. Soc. Am. J. 67:1831-1841 Gomez-Barbero and Rodriguez-Cereozo. The adoption of GM insect-resistant Bt maize in Spain: an empirical approach, 10th ICABR conference on agricultural biotechnology, Ravello, Italy, July 2006 Gonsales L. Harnessing the benefits of biotechnology: the case of Bt corn in the Philippines. 2005, ISBN 971-91904-6-9. Strive Foundation, Laguna, Philippines Gouse M, Pray C, Kirsten J and Schimmelpfennig D. A GM subsistence crop in Africa: the case of Bt white maize in S Africa, Int Journal Biotechnology, 2005, Vol 7, No1/2/3 Gouse M, Piesse J and Thirtle C. Output & labour effect of GM maize and minimum tillage in a communal area of Kwazulu-Natal, Journal of Development Perspectives, 2006, 2:2 Gouse M, Pray C, Kirsten J and Schimmelpfennig D. Three seasons of insect resistant maize in South Africa: have small farmers benefited, AgBioforum, 2006, 9 (1) 15-22 Hutchison W et al. Area-wide suppression of European Corn Borer with Bt maize reaps savings to non-bt maize growers, Science, 2010, Vol 330, 222-225. www.sciencemag.org Jasa P (2002) Conservation Tillage Systems, Extension Engineer, University of Nebraska Johnson et al (2005) Greenhouse gas contributions and mitigation potential of agriculture in the central USA. Soil Tillage Research 83 (2005) 73-94 Johnson S and Strom S. Quantification of the impacts on US agriculture of biotechnology-derived crops planted in 2006, NCFAP, Washington. www.ncfap.org Kathage J and Qaim M. Economic impacts and impact dynamics of bt cotton in India. 2012. PNAS vol 109, No 29, 11652-11656 Kovach, J. C. Petzoldt, J. Degni and J. Tette (1992). A method to measure the environmental impact of pesticides. New York's Food and Life Sciences Bulletin. NYS Agricul. Exp. Sta. Cornell University, Geneva, NY, 139. 8 pp. Annually updated http://www.nysipm.cornell.edu/publications/EIQ.html Lazarus W F (2013) Machinery Cost Estimates May 2013, University of Minnesota Extension Service http://www.minnesotafarmguide.com/news/regional/machinery-cost-estimates/pdf_a5a9623c-636a-11e3-8546-0019bb2963f4.html
Potential impact of using GM maize in Ukraine
38
Leibig et al (2005) Greenhouse gas contributions and mitigation potential of agriculture practices in north western USA and western Canada. Soil Tillage Research 83 (2005) 25-52 Marra M and Piggott N (2006) The value of non pecuniary characteristics of crop biotechnologies: a new look at the evidence, North Carolina State University Mitchell P (2002) Yield benefit of corn event Mon 863. Faculty Paper Series FP 02-04, Dept of Ag Econ, Texas AM university, Texas, USA Peterson R and Schleier J. A probabilistic analysis reveals fundamental limitations with the environmental impact quotient and similar systems for rating pesticides. 2014. PeerJ 2:e364; DOI 10.7717/peerj.364 Poeydemenge C. Les bénéfices du maïs Bt observés en France. Presentation to the SEPROMA General Assembly, 21 September 2006. Also, Poeydemenge C (2006) Bt maize benefits observed in France, presentation to 10th ICABR conference on agricultural biotechnology, Ravello, Italy, July 2006. Ramon G. Acceptability survey on the 80-20 bag in a bag insect resistance management strategy for Bt corn, 2005, Biotechnology Coalition of the Philippines (BCP) Reicosky D C (1995) Conservation tillage and carbon cycling:soil as a source or sink for carbon. University of Davis Riesgo L, Areal F and Rodriguez-Cerezo E. How can specific market demand for non GM maize affect the profitability of Bt and conventional maize? A case study for the middle Ebro Valley, Spain. Spanish Journal of Agricultural Research 2012, 10 (4) 867-876 Robertson et al (2000) Greenhouse Gases in Intensive Agriculture: Contributions of Individual Gases to the Radioactive Forces of the Atmosphere. Science Vol 289 September 15 2000 1922-1925 USDA Energy Estimator: tillage. 2013 http://ecat.sc.egov.usda.gov Subramanian A & Qaim M. Village-wide effects of agricultural biotechnology: the case of Bt cotton in India. 2008. World Development, vol 37, N0 1, 256-262 Torres C, Daya R, Osalla T and Gopela J (2013) Adoption and uptake pathway of MG/biotech crops by small scale, resource-poor Filipino farmers, ISAAA, CDC-UPLB and SEARCA, ISBN 978-971-95921-005. www.isaaa.org Van der Walt W. Final report on the adoption of GM maize in South Africa for the 2008/09 season, South African Maize Trust, 2009 West T.O. and Post W.M. (2002) Soil Organic Carbon Sequestration Rates by Tillage and Crop Rotation: A Global Analysis. Soil Science Society of American Journal. Vol 66 November/December: 930-1046 Yorobe J. Economics impact of Bt corn in the Philippines, 2004, Paper presented to the 45th PAEDA Convention, Querzon City Zilberman D et al. The impact of agricultural biotechnology on yields, risks and biodiversity in low income countries. 2007. Journal of Development Studies, vol 43, 1, 63-78