Embed Size (px)
Citation preview
International Journal of Advanced Academic Research | Sciences, Technology & Engineering | ISSN: 2488-9849
Vol. 3, Issue 5 (May 2017)
Worldwide Knowledge Sharing Platform | www.ijaar.org
Page 51
POTENTIAL HEALTH IMPACTS OF PHYTOPLANKTON
COMPOSITION IN WATARI DAM, KANO - NIGERIA
*1Nafiu S. A;
2Rabiu, H. D;
3Abdullahi, M. T;
4Halliru, S. N;
5Kabiru, M.Y;
6Ishaq, S. A
1&3
Department of Science Laboratory Technology, Kano State Polytechnic, Kano 2 and 6
Department of Biology, Federal College of Education Technical Bichi 5National Primary Health Care Development Agency, Kano –Nigeria
4Department of Biology, Sa’ adatu Rimi College of Education, Kano
Corresponding author: [email protected], 07030918094
ABSTRACT
Phytoplankton composition as bioindicators of water quality was determined for six months
in Watari Dam, Kano between March and August, 2016. Water samples for phytoplankton
and physicochemical parameters were collected and analyzed fortnightly between 8:00 –
10:00AM using standard methods. Four sampling sites (A, B, C and D) were chosen on the
Dam based on the ecological setting and impact of anthropogenic activities. The mean range
of physicochemical parameters studied were, water temperature (22 – 27.8 °
C), pH (5.9 –
9.3), DO (4.6 – 6.9mg/L), BOD (2.1 – 4.1mg/L), turbidity (28 – 42 NTU), electrical
conductivity (630 – 860µS/cm), TDS (470 - 860 mg/L), phosphate (2.0- 3.8mg/L) and nitrate
(13.6 -23.3mg/L). Total dissolved solids, turbidity and nitrate recorded significant difference
between wet and dry season (P<0.05) while no significant difference was observed in DO,
BOD, phosphate, temperature and pH. Sixteen (16) phytoplankton species were identified in
which Cyanophyta had 25%, Chlorophyta (37.5%), Bacillariophyta (25%) and Euglenophyta
(12.5%). Cholorophyta was the dominant group contributing 39.9% of the total floral
composition of 286.7org/L. With regards to Palmer Pollution Index (P.P.I) 32 score was
recorded from the 11 phytoplankton pollution indicator genera. The presence of pollution
indicator phytoplankton species such as Microcystis sp., Oscillatoria sp., Scenedesmus sp.,
Euglena sp. and Phacus sp. indicates high degree of organic pollution in the Dam. Shannon-
Wiener Index and Evenness Index showed high phytoplankton composition and abundance
during wet season than the dry season. The present study revealed that the water body is
impacted with various anthropogenic activities which affect the water quality negatively. It is
therefore recommended that uncontrolled discharge of agrochemicals around the Dam
through irrigation and other human activities should be controlled in order to curtail
degradation of the aquatic biota over a period of time.
Keywords: Phytoplankton, Physicochemical parameters, Water Quality, Seasonal Variation,
Watari Dam.
International Journal of Advanced Academic Research | Sciences, Technology & Engineering | ISSN: 2488-9849
Vol. 3, Issue 5 (May 2017)
Worldwide Knowledge Sharing Platform | www.ijaar.org
Page 52
INTRODUCTION
Phytoplankton are the primary producers forming the first trophic level in the food chain
(Khattak et al., 2005). According to Khatri (2014), based on the distribution pattern of the
phytoplankton the water quality of the environment can be assessed. Drinking water supply,
recreational activities and fisheries can be impaired by high phytoplankton biomass (Khatri,
2014). The use of phytoplankton as biological indicators of pollution has been studied by
rating pollution tolerant algae in a water body based on the report of Palmer (1969).
Phytoplankton populations are highly dynamic and in many environments, they experience
episodes of rapid biomass increase (blooms), often due to the recurrent changes of the
environmental variables (Cloern, 1991). Phytoplankton has long been used as effective
bioindicators of eutrophic water that is sensitive to environmental changes (Chekryzheva,
2014). The rate of production of phytoplankton is determined by a host of environmental
parameters like physicochemical properties of water and soil, meteorological characteristics
of the region and hydrographic features of the water body (Dahl and Wilson, 2000).
According to Sanet et al. (2006), the distribution, abundance, species diversity and
composition of the phytoplankton are used to assess the biological integrity of a water body.
In view of the foregoing, this research aimed at assessing the potential health impacts of
Watari Dam, Kano using phytoplankton composition.
MATERIALS AND METHODS
Study Area
Watari Dam impounded in 1977 is situated about 47 km away from Kano city along old
Bichi-Gwarzo road in Bagwai and Bichi Local Governments Area of Kano 2 km from
Bagwai town and 8km south west of Bichi, Kano, Nigeria. It has 1,959 hectares surface area
and active storage capacity of 92.74million litres. The dam is located between latitude
12°9'24"N and 8°8'12"E with two distinct seasons (wet and dry). The rainy season which last
from May to October and the dry season last from November to April. The mean annual
temperature is between 16 – 410C
and the mean annual rainfall range from 700 – 813mm
(MANR, 1982 and Adamu et al., 2014).
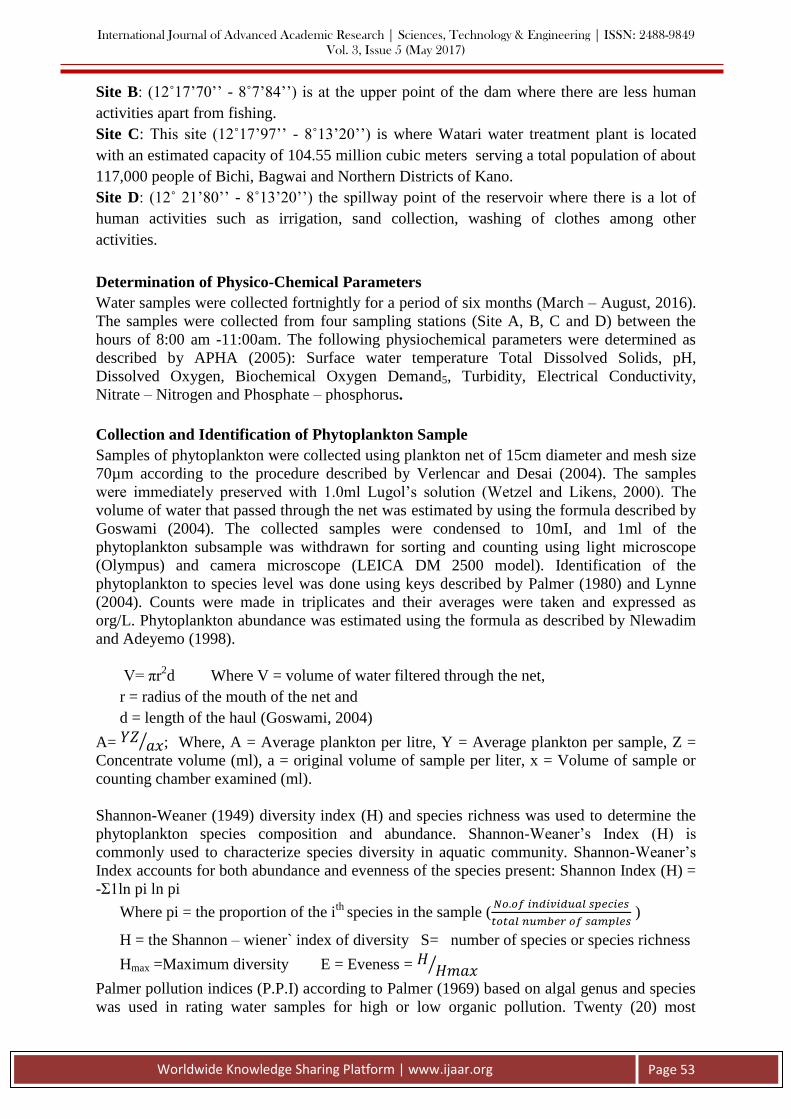
Fig. I: Map of Watari Dam Showing the Sampling Sites (Source: Cartography Lab.
Geography Dept. Bayero Univesity Kano, 2017)
Sampling sites
Site A: In this site (12˚18’ 70’’N - 8˚ 07’84’’) the Dam forms a confluence with small rivers.
International Journal of Advanced Academic Research | Sciences, Technology & Engineering | ISSN: 2488-9849
Vol. 3, Issue 5 (May 2017)
Worldwide Knowledge Sharing Platform | www.ijaar.org
Page 53
Site B: (12˚17’70’’ - 8˚7’84’’) is at the upper point of the dam where there are less human
activities apart from fishing.
Site C: This site (12˚17’97’’ - 8˚13’20’’) is where Watari water treatment plant is located
with an estimated capacity of 104.55 million cubic meters serving a total population of about
117,000 people of Bichi, Bagwai and Northern Districts of Kano.
Site D: (12˚ 21’80’’ - 8˚13’20’’) the spillway point of the reservoir where there is a lot of
human activities such as irrigation, sand collection, washing of clothes among other
activities.
Determination of Physico-Chemical Parameters
Water samples were collected fortnightly for a period of six months (March – August, 2016).
The samples were collected from four sampling stations (Site A, B, C and D) between the
hours of 8:00 am -11:00am. The following physiochemical parameters were determined as
described by APHA (2005): Surface water temperature Total Dissolved Solids, pH,
Dissolved Oxygen, Biochemical Oxygen Demand5, Turbidity, Electrical Conductivity,
Nitrate – Nitrogen and Phosphate – phosphorus.
Collection and Identification of Phytoplankton Sample
Samples of phytoplankton were collected using plankton net of 15cm diameter and mesh size
70µm according to the procedure described by Verlencar and Desai (2004). The samples
were immediately preserved with 1.0ml Lugol’s solution (Wetzel and Likens, 2000). The
volume of water that passed through the net was estimated by using the formula described by
Goswami (2004). The collected samples were condensed to 10mI, and 1ml of the
phytoplankton subsample was withdrawn for sorting and counting using light microscope
(Olympus) and camera microscope (LEICA DM 2500 model). Identification of the
phytoplankton to species level was done using keys described by Palmer (1980) and Lynne
(2004). Counts were made in triplicates and their averages were taken and expressed as
org/L. Phytoplankton abundance was estimated using the formula as described by Nlewadim
and Adeyemo (1998).
V= πr2d Where V = volume of water filtered through the net,
r = radius of the mouth of the net and
d = length of the haul (Goswami, 2004)
A= ⁄ ; Where, A = Average plankton per litre, Y = Average plankton per sample, Z =
Concentrate volume (ml), a = original volume of sample per liter, x = Volume of sample or
counting chamber examined (ml).
Shannon-Weaner (1949) diversity index (H) and species richness was used to determine the
phytoplankton species composition and abundance. Shannon-Weaner’s Index (H) is
commonly used to characterize species diversity in aquatic community. Shannon-Weaner’s
Index accounts for both abundance and evenness of the species present: Shannon Index (H) =
-Σ1ln pi ln pi
Where pi = the proportion of the ith
species in the sample (
)
H = the Shannon – wiener` index of diversity S= number of species or species richness
Hmax =Maximum diversity E = Eveness = ⁄
Palmer pollution indices (P.P.I) according to Palmer (1969) based on algal genus and species
was used in rating water samples for high or low organic pollution. Twenty (20) most
International Journal of Advanced Academic Research | Sciences, Technology & Engineering | ISSN: 2488-9849
Vol. 3, Issue 5 (May 2017)
Worldwide Knowledge Sharing Platform | www.ijaar.org
Page 54
frequent genera of algae were taken into account. A pollution index factor was assigned to
each genus by determining relative number of total points scored by each phytoplankton. The
range of palmer index values indicative of organic pollution are 0 - 14: Organic pollution is
absent, 15 - 20: Presence of organic pollution and > 20: Presence of high level of organic
pollution.
Statistical Analyses
Analysis of variance (ANOVA) was used to compare the means of seasonal variations of
phytoplankton species composition and physico chemical parameters during wet and dry
seasons to find out if there is significant difference or otherwise. Duncan Multiple Range Test
was used to separate the means. All the analyses were carried out using SPSS software (16.0
version).
RESULTS
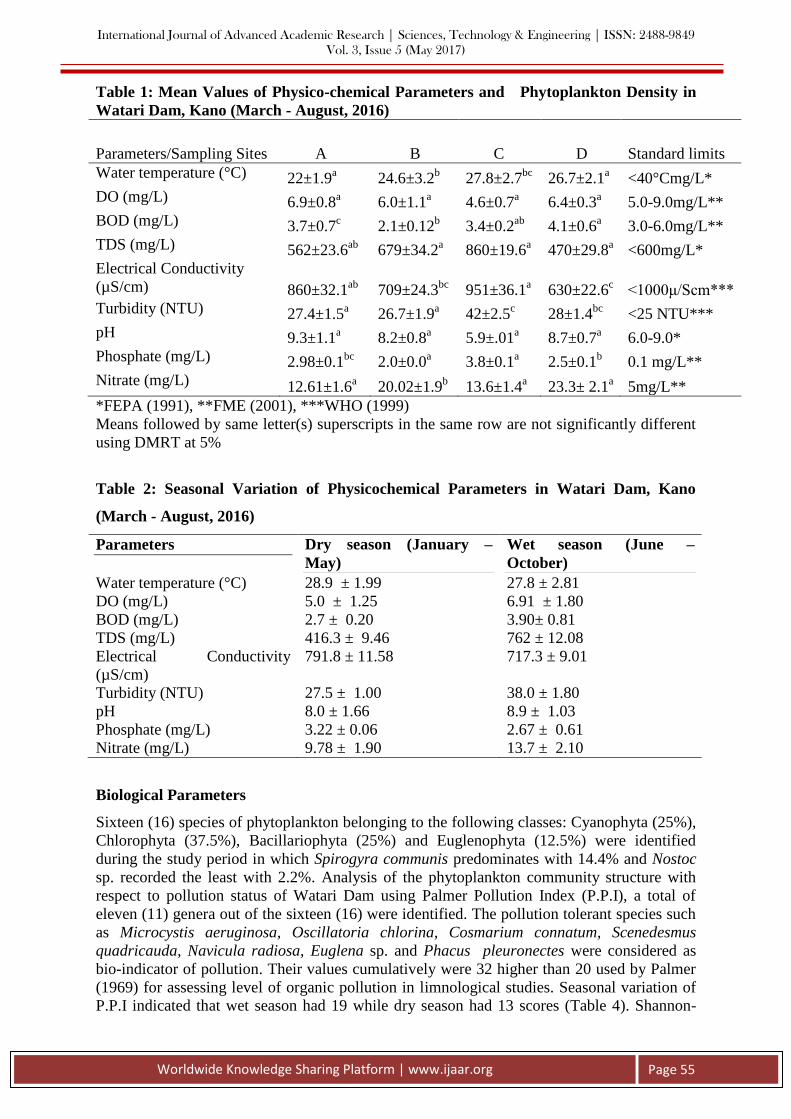
Physicochemical Parameters
The mean range of the water temperature recorded was between 22.0oC and 27.8
oC with the
lowest value recorded in July and the highest in May. Similarly, mean water temperature
during dry season (March – May) was 28.9± 1.99°C while higher value of 27.8±2.81
°C was
recorded during wet season (June – August) as presented in Table 2. Temperature variations
between seasons indicated no significant difference (p<0.05). The range of pH values was pH
5.9 – 9.3) with the lowest value recorded in June and the highest in March. The seasonal
variation of pH indicated that the mean pH of dry season was 8.0± 1.66 while that of wet
season was 8.9±1.03. There was no significant difference recorded between the two seasons
(P< 0.05). The seasonal difference for TDS indicates mean dry season values of 416.3mg/L
and 763mg/L in the wet season (Table 2). It revealed significant differences between the two
seasons at P< 0.05.
The DO ranged between 4.6 mg/L in March and to 6.9mg/L in August. Seasonally, the
highest mean DO value during dry season was 5.0±1.25mg/L while wet season had the least
value of 6.9±1.00mg/L (Table 2). The seasonal variations in the mean BOD values indicated
that dry season had 2.7±0.20mg/L while wet season recorded 3.9±0.81mg/L. Statistically,
there was no significant difference in DO and BOD between the two seasons (p<0.05). Mean
monthly values of turbidity ranged between 28NTU and 42NTU. The mean value recorded
during the dry season was 27.5±1.00NTU while 38.0±1.80NTU was recorded during the wet
season (Table 2). Mean turbidity values revealed significant difference between the seasons
(p< 0.05).
Mean monthly values of Electrical Conductivity ranged from 630µS/cm to 860µS/cm.
Phosphate – phosphorus concentration was observed to be higher in wet season with
2.67±0.61mg/L and low in the dry season with 2.2±0.0.6mg/L. Statistically, no significant
difference was observed between the seasons (P<0.05). There was high concentration of
Nitrate- nitrogen in wet season with 13.7±2.10 mg/L than that of dry season with 9.78±1.90
mg/L which was significantly different at P<0.05 (Table 4).
International Journal of Advanced Academic Research | Sciences, Technology & Engineering | ISSN: 2488-9849
Vol. 3, Issue 5 (May 2017)
Worldwide Knowledge Sharing Platform | www.ijaar.org
Page 55
Table 1: Mean Values of Physico-chemical Parameters and Phytoplankton Density in
Watari Dam, Kano (March - August, 2016)
Parameters/Sampling Sites A B C D Standard limits
Water temperature (°C) 22±1.9a 24.6±3.2
b 27.8±2.7
bc 26.7±2.1
a <40°Cmg/L*
DO (mg/L) 6.9±0.8a 6.0±1.1
a 4.6±0.7
a 6.4±0.3
a 5.0-9.0mg/L**
BOD (mg/L) 3.7±0.7c 2.1±0.12
b 3.4±0.2
ab 4.1±0.6
a 3.0-6.0mg/L**
TDS (mg/L) 562±23.6ab
679±34.2a 860±19.6
a 470±29.8
a <600mg/L*
Electrical Conductivity
(µS/cm) 860±32.1ab
709±24.3bc
951±36.1a 630±22.6
c <1000μ/Scm***
Turbidity (NTU) 27.4±1.5a 26.7±1.9
a 42±2.5
c 28±1.4
bc <25 NTU***
pH 9.3±1.1a 8.2±0.8
a 5.9±.01
a 8.7±0.7
a 6.0-9.0*
Phosphate (mg/L) 2.98±0.1bc
2.0±0.0a 3.8±0.1
a 2.5±0.1
b 0.1 mg/L**
Nitrate (mg/L) 12.61±1.6a 20.02±1.9
b 13.6±1.4
a 23.3± 2.1
a 5mg/L**
*FEPA (1991), **FME (2001), ***WHO (1999)
Means followed by same letter(s) superscripts in the same row are not significantly different
using DMRT at 5%
Table 2: Seasonal Variation of Physicochemical Parameters in Watari Dam, Kano
(March - August, 2016)
Parameters Dry season (January –
May)
Wet season (June –
October)
Water temperature (°C) 28.9 ± 1.99 27.8 ± 2.81
DO (mg/L) 5.0 ± 1.25 6.91 ± 1.80
BOD (mg/L) 2.7 ± 0.20 3.90± 0.81
TDS (mg/L) 416.3 ± 9.46 762 ± 12.08
Electrical Conductivity
(µS/cm)
791.8 ± 11.58 717.3 ± 9.01
Turbidity (NTU) 27.5 ± 1.00 38.0 ± 1.80
pH 8.0 ± 1.66 8.9 ± 1.03
Phosphate (mg/L) 3.22 ± 0.06 2.67 ± 0.61
Nitrate (mg/L) 9.78 ± 1.90 13.7 ± 2.10
Biological Parameters
Sixteen (16) species of phytoplankton belonging to the following classes: Cyanophyta (25%),
Chlorophyta (37.5%), Bacillariophyta (25%) and Euglenophyta (12.5%) were identified
during the study period in which Spirogyra communis predominates with 14.4% and Nostoc
sp. recorded the least with 2.2%. Analysis of the phytoplankton community structure with
respect to pollution status of Watari Dam using Palmer Pollution Index (P.P.I), a total of
eleven (11) genera out of the sixteen (16) were identified. The pollution tolerant species such
as Microcystis aeruginosa, Oscillatoria chlorina, Cosmarium connatum, Scenedesmus
quadricauda, Navicula radiosa, Euglena sp. and Phacus pleuronectes were considered as
bio-indicator of pollution. Their values cumulatively were 32 higher than 20 used by Palmer
(1969) for assessing level of organic pollution in limnological studies. Seasonal variation of
P.P.I indicated that wet season had 19 while dry season had 13 scores (Table 4). Shannon-
International Journal of Advanced Academic Research | Sciences, Technology & Engineering | ISSN: 2488-9849
Vol. 3, Issue 5 (May 2017)
Worldwide Knowledge Sharing Platform | www.ijaar.org
Page 56
Wiener diversity Index (H) and Evenness Index (E) were highest at site A with 1.42,0.86
while the least were at site B with 1.23, 0.68 respectively. Seasonal variation of indicated that
Shannon wiener Index and Evennes Index had the highest values in wet season of 1.36 and
0.80 while dry season had 1.20 and 0.69 respectively. Seasonal variation revealed more
species richness and abundance during wet season than during dry season.
Table 3: Phytoplankton Species Composition and Palmer Pollution Index in obtained
from Watari Dam, Kano (March - August, 2016)
Phytoplankton taxa
Palmer
Pollution
Index A B C D Total
%
frequency
Cyanophyta (25%)
Microcystis aeruginosa 5 7.3 3.7 4.4 4.9 20.3 7
Nostoc sp.
2.2 2.1 0.8 1.2 6.3 2.2
Oscillataria chlorine 5 1.6 5.8 5.1 5.7 18.2 6.3
Phormidium uncinatum 1 5.9 6 4.2 5.7 21.8 7.6
Chlorophyta (37.5%)
Closterium sp. 1 3.7 2.7 1.7 2.8 10.9 3.8
Spirogyra communis
13.4 6.5 8.8 12.7 41.4 14.4
Pediastrum duplex
3.7 3.1 4.7 1.8 13.3 4.6
Cosmarium connatum 2 2.2 1.4 0.6 3.6 7.8 2.7
Scenedesmus quadricauda 4 3.4 5.6 7.3 6.8 23.1 8
Palmella sp.
3 2.2 4.8 2.8 12.8 4.4
Bacillariophyta (25%)
Nitzchia sp. 3 4.5 2.5 2.9 1.9 11.8 4.8
Navicula radiosa 3 6.8 10.2 9 6.8 32.8 11.4
Gyrosigma sp.
7.4 4.6 6.7 5.8 24.5 8.4
Cyclotella sp. 1 2.6 3 3.4 2.6 11.6 4
Euglenophyta (12.5% )
Phacus sp. 2 2.7 1.4 1.8 3.8 9.7 3.3
Euglena acus 5 5.8 4.8 4.6 5.2 20.4 7.1
Total no. of individuals per
site 32 76.2 65.6 70.8 74.1 286.7 100
Shanno-diversity (H) 1.42 1.23 1.3 1.39
Evenness (E) 0.86 0.68 0.72 0.78
Table 4: Seasonal Variation of Phytoplankton Taxa and Palmer Pollution Index of
Watari Dam, Kano (March - August, 2016)
Diversity indices Wet season (June- Aug.) Dry season (March- May)
Phytoplankton Total
count(org/L) 176 110
Shannon - wiener index(H) 1.36 1.2
Evenness index (E) 0.8 0.69
Palmer indices 19 13
International Journal of Advanced Academic Research | Sciences, Technology & Engineering | ISSN: 2488-9849
Vol. 3, Issue 5 (May 2017)
Worldwide Knowledge Sharing Platform | www.ijaar.org
Page 57
Discussion
Dallas (2004) pointed out that various physicochemical and biological circumstances must be
simultaneously taken into consideration for understanding fluctuation of biological
population in water body. In Watari Dam, limnological parameters were observed to fluctuate
slightly during the study period. The mean water temperature of the dam fluctuates between
22 – 27.8°C. The relatively high water temperature in May could be due to characteristic of
hot weather in Kano. This trend of temperature variation is in tandem with the findings of
Ibrahim (2009) in Challawa River, Kano State and Kefas et al. (2015) in Lake Geriyo,
Adamawa State. The pH value recorded in this study (7.5 -8.9) was observed to increase
slightly from January to October. The pH recorded fall within the acceptable limits of 5.9 -
9.3 for fresh water bodies set FEPA (1991). TDS in water consist of inorganic salts and
dissolved materials and high values of TDS may lead to change in water taste (Pandey,
1997). The TDS values recorded in the dam varied from 470mg/L to 860mg/L. The value is
higher than the maximum limit of 600mg/L set by FEPA (1991). In the present investigation,
Dissolved Oxygen ranged between 4.6 - 6.9mg/L, which is quite satisfactory to support
aquatic life perhaps due to good aeration rate and photosynthetic activity as reported by Jaji
et al. (2007). The distribution of Dissolved Oxygen in water body has been reported to be
governed by a balance between input from the atmosphere, rainfall, photosynthesis and losses
by the chemical and biotic oxidations (Adesalu and Nwankwo, 2010). Turbidity of the water
body also varied significantly according to the season it ranged from 28NTU - 42NTU during
dry and wet season respectively. The water turbidity during wet season might be related to
cloudiness of water body as a result of particulate matter being suspended within it (Kutama
et al., 2013). Phosphates- phosphorus ranges between 2.0-3.8mg/L and Nitrate- nitrogen with
13.6 – 23.3mg/L. The values recorded were higher than the standard limit for fresh water set
by FEPA (1991).This corroborates with the findings of Umar and Bashir (2014) who
recorded higher values of both nitrate and phosphate in their work on seasonal comparison of
physicochemical parameters in Thomas Dam, Kano State. The higher values of phosphate
and nitrate concentrations could be attributed to the inputs from agricultural activities around
the study area. The values recorded were higher than what was reported by Kefas et al.
(2015) in Lake Geriyo, Adamawa state, Nigeria.
The significance of this study goes a long way to determine the water quality of Watari dam
in relation to pollution indicator phytoplankton species and the implication of anthropogenic
activities around the water body. The phytoplankton community in the present study is
characterized by four phyla: Cyanophyta (25%), Chlorophyta (37.5%), Bacillariophyta (25%)
and Euglenophyta (12.5%). Sixteen genera identified in which eleven (11) have been reported
as indicators of organic pollution by Palmer (1969) who specified the range of organic
pollution by the tolerance capacity of the phytoplankton species. The presence of 11 pollution
tolerant genera with 32 palmer pollution indices corroborates with the findings of Indabawa
and Mukhtar (2002) and Verma et al. (2012) who described phytoplankton as rapid detectors
of water pollution due to their quick response to changes in environmental variables and
produce toxic substances which can accumulate and intoxicate the entire food chain.
Similarly Hegde (1988) and Anuja and Chandra (2014) reported the significance of
phytoplankton in evaluation of eutrophic potentials and pollution status of an aquatic
environment.
Results of P.P.I from all the sampling sites categorized the water as being high of organic
pollution with 32 score. Similar observation was raised by Suryakant and Awasthi (2012).
The present finding is consistent with work of Nandan and Aher (2005) and Ayodhya et al.
(2012) and Anuja and Chandra (2014) who recorded Palmer’s index of pollution score
International Journal of Advanced Academic Research | Sciences, Technology & Engineering | ISSN: 2488-9849
Vol. 3, Issue 5 (May 2017)
Worldwide Knowledge Sharing Platform | www.ijaar.org
Page 58
greater than twenty in their work on phytoplankton as indicators of water quality. Seasonal
variation with respect to Palmer pollution index demonstrates that Watari dam had high
organic pollution value of 19 during wet season and absent of organic pollution with 13 score
during dry season. Observation at the sampling sites indicated that surface run off into the
dam from nearby farm lands and other human activities facilitate the enrichment of dam
during wet season which possibly lead the high phytoplankton growth. Similar observation
was made by Ayodhya et al. (2012) in Mula River, India. The high phytoplankton species
diversity recorded may be due to the favourable physiochemical parameters that greatly
influenced their growth as reported by Muhammad and Saminu (2012) in Salanta River,
Kano. Similar observation was made by Anago et al. (2013) who reported that in water body
where domestic and agricultural activities persists pollution is accelerated through the growth
of Chlorophyta and Cyanophyta. The presence of bloom producing species such as
Microcystis sp., Anabaena sp. and Oscillatria sp. is an indication that the Dam is undergoing
gradual decrease in water quality.
Shannon Weiner diversity index adopted by Islam (2008) revealed that when the value is <
1, the water body is heavenly polluted; 1 - 3, moderately polluted and > 3, clean water. site A
from the present finding had the highest value of 1.42 and the least was site B with 1.23
which indicates a moderately polluted water body. Tanimu et al.(2012) made similar
observation in Bauchi and Hadejia Nguru wetlands.
Conclusion
The present study identified bioindicator phytoplankton species such as Microcystis sp.,
Oscillatoria sp., Scenedesmus sp., Euglena sp. and Phacus which can pose potential health
impacts on the inhabitants. Irrigation and other domestic activities close to the sampling sites
influenced seasonal variations in the phytoplankton composition. The large number of
pollution indicator phytoplankton observed which can tolerate various degrees of organic
pollution revealed the need for the continuous bio-monitoring and control of organic
pollution in the water body. It is therefore recommended that relevant organizations should
encourage continual research on the general biology and physicochemical parameters of
inland water bodies with the view to track adverse environmental changes in the aquatic
environment like Watari Dam in Kano State.
International Journal of Advanced Academic Research | Sciences, Technology & Engineering | ISSN: 2488-9849
Vol. 3, Issue 5 (May 2017)
Worldwide Knowledge Sharing Platform | www.ijaar.org
Page 59
REFERENCES
Abdullahi, B.A. and Indabawa, I.I. (2005). Ecology of Freshwater Phytoplankton of River
Hadejia, Jigawa State, Nigerian Biological and Environmental Sciences Journal for
the Tropics, 1(2):141-146.
Adakole, J.A., Abolude, D.S. and Balarabe, M.L. (2008). Assessment of Water Quality of a
Man-Made Lake in Zaria, Nigeria. Proceedings of Taal: The 12th World Lake
Conference: 1373-1382.
Adesalu, T.A. and Nwankwo, D. I. (2010). Cyanobacteria of a Tropical Lagoon, Nigeria.
Journal of American Science, 6(4): 74- 79.
Anago, I.J., Esenowo, I.K, and Ugwumba, A.A.A. (2013). The Physico-chemical and
Plankton Diversity of Awba Reservoir University of Ibadan, Ibadan. Nigeria
Research Journal of Environmental and Earth Sciences, 5(1): 638-644.
Anuja. J and Chandra.S., (2014). Studies on fresh water algae in relation to chemical
constituents of Thiruneermalai temple tank near Chennai, India. Int.J.Curr.Sci., 4:21-
29.
APHA (1985). Standard methods of Examination of Waste water, 20th edition, AWAA,
WPCF Washingtion, DC, USA, pp 1-1268.
APHA. (2005). Manual of Standard Methods For Examination For Water and Waste water.
14th Edition. Washington Dc. pp. 121-132.
Ayodhya, D; Kshirsagar, M. L; A; and Venkat, R. G. (2012). Phytoplankton Diversity
Related to Pollution from Mula River at Pune City, Terrestrial and Aquatic
Environmental Toxicology, 6 (2):136-142.
Cloern, J.E. (1991). Tidal Stirring and Phytoplankton Bloom Dynamics in an Estuary.
Journal of Marine Research, 49(1) 203– 221.
Chekryzheva,T.A. (2014). Anthropogenic changes in Phytoplankton in Lakes of the Kanti
River System (Republic of Keralia). Water Resourc, 41 (1): 431 – 438.
Dahl, M. and Wilson, D. (2000)- Current status of freshwater quality models. Technical
report, Karlstad University, pp 28.
Dallas, H. F. (2004) Seasonal variability of macroinvertebrate assemblages in two regions of
South African implications for aquatic bioassessment. African Journal of Aquatic
Science, 29(2): 173-184.
Elleta, O. A., Adekola, F. A and Aderanti, M. A. (2005). Assessment of Asa River: Impact of
Water Discharge from Soft Drink Plant into Asa River, Ilorin, Nig. J. of App. Sci.
Environ. Mana., 9(1):187-190.
Ewa, E.E; Iwara, A.I; Alade, A.O and Adeyemi, J.A. (2013). Spatio-temporal Distribution to
Phytoplankton in the Industrial Area of Calabar River, Nigeria. Advances in
Environmental Biology, 7(3): 466-470.
International Journal of Advanced Academic Research | Sciences, Technology & Engineering | ISSN: 2488-9849
Vol. 3, Issue 5 (May 2017)
Worldwide Knowledge Sharing Platform | www.ijaar.org
Page 60
FEPA (1991). National Environmental Protection (Effluent Limitation) Regulations of 1991.
Federal Environmental Protection Agency, Lagos, Nigeria. pp1-8.
Goswami, S.C. (2004). Zooplankton Methodology Collection and Identification - a Field
Manual: National Institute of Oceanography, Dona Paula, Goa- 403004 Pp5-8.
Hegde, G.R. (1988): Limnological Studies of Temple Ponds of Dharwad, Karnataka State.
Proc. Nat. Symposium, Past. Present and future, 1(1): 247- 252.
Hosmani, S. P. and Bharti, S.G. (1980): Algae as indicators of organic pollution. Phykos.,
19(1):23-26
Ibrahim, S. (2009). A Survey of Zooplankton Diversity of Challawa River, Kano and
Evaluation of Some of its Physico-chemical Conditions : Bayero Journal of Pure
and Applied Sciences, 2(1) : 19-26.
Indabawa, I.I. (2009). Studies on Limnological Parameters and Phytoplankton Dynamics of
Nguru Lake, Yobe State, Nigeria. Bioscience Research Communications, 21(4): 183-
188.
Islam, M.S. (2008). Phytoplankton Diversity Index with Reference to Mucalinda Serovar,
Bodh- Gaya. Proceedings of the Taal’2007:The 12th
World Lake Conference,
October28 – November 2, 2007, Jaipur India, pp:462 -463.
Jaji M.O, Bamgbose . O and Arowolo T.A (2007). Water quality assessment of Ogun River,
South West Nigeria. Environmental Monitoring and assessment, 133: 473–482.
Khattak, T.M; Noorzaman, B and Ghulam, M. (2005). Evaluation of Algae from the Effluent
of Dandot Cement Company, Dandot, Pakistan. J. Appl. Sci. Environ. Mgt., 9(1) 147
– 149.
Khatri, T. C. (2014). Seasonal Distribution of Phytoplankton in Iduki Reservoir of Kerala,
India. Environmental and Ecology, 5(1): 71 – 73.
Kutama, A.S., Umar, S., Fagwalawa, L.D, Ahmed, M.K and Bilkisu, A.I. (2013). Detection
of Fish Saprolegniasis in Thomas Dam and Challawa Commercial Fish Pond: Global
Advanced Research Journal of Agricultural Science, 2(12): 315-321.
Kefas. M, Abubakar. K.Aand Ali.J. (2015). The Assessment of Water Quality via
Physicochemical Parameters and Macro Invertebrates in Lake Geriyo, Yola,
Adamawa State, Nigeria. The International Journal Of Science & Technoledge, 3 (3):
284- 290.
Lynne M. W. (2004). Aquatic Invertebrate Taxonomist, Cooperative Freshwater Ecology
Unit, 2nd
edition, Laurentian University pp 32 -44 http://coopunit.laurentian.ca
MANR(1982). Ministry Of Agric And Natural Resource. Kano. Pp.38-49.
Mohammed, M. A. and Saminu M.Y. (2012). Water Quality and Phytoplankton of Salanta
River Kano, Nigeria. Journal of Biological Science and Bioconservation, (4):65-73.
International Journal of Advanced Academic Research | Sciences, Technology & Engineering | ISSN: 2488-9849
Vol. 3, Issue 5 (May 2017)
Worldwide Knowledge Sharing Platform | www.ijaar.org
Page 61
Nlewadim, A. A. and Adeyemo, A. A. (1998): Effect of Inorganic Fertilization on
Zooplankton Production in Brackish Water (ed.). Selected Papers from 9th/10th
Annual Conference of the Nigerian Association for Aquatic Sciences.Theme:
Sustainable Utilization of Aquatic/wetland Resources, held at University of
Agriculture, Abeokuta, Ogun State, Nigeria, 30th November – 2nd December, 1995.
Pp 75–82.
Nigerian Standard for Drinking Water Quality NSDWQ (2007): Nigerian Industrial Standard.
NIS 554, Standard Organization of Nigeria. Lagos. Pp 30.
Nandan, S; and Aher, N.H. (2005). Algal community used for assessment of water quality of
Haranbaree dam and Mosam river of Maharashtra. Journal of Environmental Biology
26, 223-227.
Olajire, A. A. and Imeokparia, F. E. (2001). Water quality assessment of Osun River: Studies
on inorganic nutrients. Environmental Monitoring and Assessment, 69:17-28.
Olaniyan, C.I.O. (1969). The Seasonal Variation in the Hydrology and Total Plankton of the
Lagoons of South West-Nigeria. Nigerian Journal of Science, 3(2): 101-106.
Palmer, C.M. (1969): Composite rating of algae tolerating organic pollution. Journal of
Phycology, 5: 78-82.
Palmer, M.C. (1980). Algae and Water Pollution. Castle House Publications Ltd., England,
pp: 68-71.
Park, K.S. and Shin, H.W. (2007). Studies on Phytoplankton and Zooplankton Composition
and its Relation to Fish Productivity in a West Coast Fish Pond Ecosystem. Journal of
Environmental Biology, (28): 415-422.
Peerapornpisal, Y; Pongswat, S., Thammathaworn, S.;Thanee, N. and Somsiri, C. (2004).
Diversity of Phytoplankton in the Rama IX Lake, as Man-made Lake, Pathumthani
Province, Thailand. Science Asia, 30(1): 261-267.
Pandey, G.N. (1997): Environmental Management. Vikas Publishing House, New Delhi,
India. P: 33-37.
Ramesh, C; Sharma,N.S and Anita, C. (2016). The Influence of Physicochemical Parameters
on Phytoplankton Distribution in a Head Water Stream of Garhwal Himalayas: A
Case Study. Egyptian Journal of Aquatic Research, 42: 11-21.
Suthers, I.M. and Rissik, D. (2009). Plankton: A Guide to their Ecology and Monitoring for
Water Quality. CSIRO Publishing, Collingwood, Vic., Pp: 272
Suryakant, S and Awasthi, A.K. (2012). Pollution Causing Algae of Kali at Mainpuri. Indian
Streams Research Journal, 2(9): 1-5.
Shannon, C.E, and Weaver, W. (1949). The Mathematical Theory of Communication. Urban
University, Illinois Press, Illinois, P. 125.
International Journal of Advanced Academic Research | Sciences, Technology & Engineering | ISSN: 2488-9849
Vol. 3, Issue 5 (May 2017)
Worldwide Knowledge Sharing Platform | www.ijaar.org
Page 62
Shitu, M.B. (2006). State Educational Sector Project: Institutional Assessment –Kano State,
ESSPIN. Retrieved on 20-05-2016.
Tanimu, Y., Bako, S.P., Adakole, J.A. and Tanimu, J. (2011). Phytoplankton as Bioindicators
of Water Quality in Saminaka Reservoir, Northern-Nigeria. Proceeding of the 2011
International Symposium on Environmental Science and Technology. Dongguan,
Guandong province, China. Published by Science press USA: 318-322.\
Tanimu , Y;Tiseer F.A; Ati, O.F and Ezealor A.U. (2012). Survey of Phytoplankton in the
Bauchi and Yobe States Segment of the Hadejia-Nguru Wetlands, Northeastern
Nigeria. Ecologia, 2(4): 114-122.
Umar, Z.D and Bashir, A. (2014). Assesment Of Potential Health Impacts On Surface Water
Sources In Northern Nigeria, International Journal of Environment, 3(2): 125-136
Verlencar, X.N and Desai, S. (2004).Phytoplankton Identification Manual. National Institute
of Oceanography New Delhi, 1st ed Pp 4.
Verma, P.U; Purohit, A and Patel, N.J. (2012). Pollution Status of Chandlodia Lake Located
in Ahmedbad Gujarat. IJERA., 2(1) : 1600- 1606.
Wetzel, R.G and Liken,s G.E. (2000). Limnological Analyses, Third Edition Springer, New
York p.429.
World Health Organization (2003). Guidelines for Safe Recreational Water Environment
Volume 1: Coastal and Fresh Waters, Geneva, pp 1-33.