Embed Size (px)
Citation preview
Potential for the Conservation Security Program to Induce More Ecologically Diverse Crop Rotations in the Western Corn Belt
by
Thomas L. Dobbs and Nicholas J. Streff
Selected Paper for Presentation at the American Agricultural Economics Association Annual Meeting
Providence, Rhode Island July 24-27, 2005
Thomas Dobbs, the contact author, can be reached at: Economics Department Box 504, Scobey Hall South Dakota State University Brookings, South Dakota 57007-0895 e-mail: [email protected] Nicholas Streff is at: National Agricultural Statistics Service U.S. Department of Agriculture Columbia, Missouri e-mail: [email protected] Summary: The potential of the USDA’s new Conservation Security Program (CSP) for inducing farmers to adopt more ecologically diverse crop rotations in the Western Corn Belt is examined. Simulations are conducted for a representative farm model in southeastern South Dakota, using different assumptions about commodity policies and CSP payments. Keywords: agri-environmental policies, Conservation Security Program, farm policy, resource conservation, ecological diversity, organic farming
Potential for the Conservation Security Program to Induce More Ecologically Diverse Crop Rotations in the Western Corn Belt
by
Thomas L. Dobbs and Nicholas J. Streff
The Conservation Security Program (CSP) is the most significant agri-
environmental component of the 2002 Federal Farm Bill because of its holistic
conception and its Congressional intent to apply to all types of farms across the U.S. The
CSP has the potential to be a major step in the direction of European-style
“multifunctionality”. Congress intended the program to address a broad range of
environmental concerns, without taking farmed land out of food and fiber production.
The program, as legislated, consists of three potential ‘tiers’, with the highest tier
available to operators willing to address all resource concerns on the entire farm. Budget
constraints and consequent debates about how to live within those constraints resulted in
numerous delays while implementation rules were being written, reviewed, and revised.
The Natural Resources Conservation Service (NRCS) finally held the first signup during
the summer of 2004, but it was restricted to farmers in selected watersheds. Moreover,
criteria for eligibility were much narrower than most observers felt that Congress
originally intended; major emphasis was placed on soil and water concerns. A second
signup in selected additional watersheds is underway in Spring 2005. However, it
remains to be seen if and when the CSP will be implemented as a true entitlement
program that addresses a broad of range of resource concerns on U.S. farms.
With Congress’s original apparently broad intent in mind, we have examined the
potential for the CSP to bring about truly significant ecological change on farms in the
2
Western Corn Belt. Many sustainable agriculture researchers and educators have
expressed growing concern about the ecological sustainability of the corn-soybean
systems that dominate a wide swath of the Midwestern U.S. They cite mounting
problems of soil structure breakdown, water contamination, crop disease, pesticide
resistance to agri-chemicals, and loss of plant and animal biodiversity. Therefore, it is
important to know just how much difference the CSP conceivably might make in the
relative profitability of corn-soybean and more ecologically diverse crop rotation
systems.
To examine this policy issue of the CSP’s potential impact on relative
profitability, we developed a ‘representative farm’ model for a six-county area of
southeastern South Dakota that covers the State’s most productive corn-soybean ground.
Of major crops grown in this area in 1997-2001, corn acres made up 44 percent, soybean
acres 48 percent, and alfalfa acres 6 percent. The amount of alfalfa grown on most farms
in the region is too small at present to substantially alter the basic corn-soybean rotation
pattern. Small amounts of oats and wheat also were grown in the study area during this
time period.
We defined the ‘representative farm’ as rotating 500 acres of corn and 500 acres
of soybeans on 1,000 cropland acres. Crop enterprise and whole-farm budgets were
developed to determine profitability of the representative farm under assumptions of the
2002 Farm Bill and average crop prices in recent years. Then, we specified a number of
more ecologically diverse rotations that included either small grains or alfalfa—in
addition to corn and soybeans—and most of the alternative rotations included both alfalfa
and a small grain crop. The alternative rotations ranged from 3-year (e.g.,
3
corn/soybeans/spring wheat) to 8-year rotations (e.g., alfalfa under-seeded with oats/3
years of harvested alfalfa/corn/soybeans/corn/soybeans). The more ecologically diverse
rotations permit application of lower amounts of synthetic chemical inputs; some of the
specified rotations are certifiable as ‘organic’, involving no synthetic chemical input use.
All of the rotations we examined are similar to ones that at least some farmers in the
study region already are using.1
The CSP is too new for published ex-post studies of its effectiveness to have
appeared in the literature. An ex-ante analysis by Westra, Zimmerman, and Vodracek,
similar in some respects to our study, recently appeared in the Agricultural and Resource
Economics Review, however. In that analysis, potential environmental and farm
profitability effects of CSP and Conservation Reserve Program (CRP) payments in two
Minnesota watersheds were examined. The researchers utilized what they referred to as
‘integrated bioeconomic modeling’. They analyzed the potential effects of adoption of
certain conservation practices intended to address resource concerns of sediment losses
and declines in fish populations. Their assumed CSP payments were sufficient to prevent
the new practices from causing net farm income declines in one of the watersheds
studied, but not in the other. When both CSP and CRP payments—the latter for removing
land from production within 100 yards of water bodies—were included, estimated net
farm incomes actually increased by 7-8 percent in both watersheds.
Methods of Analysis
In this section of the paper, we describe the study region and the representative
farm model developed for our analysis. Then we describe the rotation systems that were
1 A more detailed account of this study is found in a thesis by Streff. The data reported in the present paper reflect some revisions made since that thesis was completed, however.
4
analyzed. After that, the farm policy assumptions, including those for the CSP, are
explained.
The study region
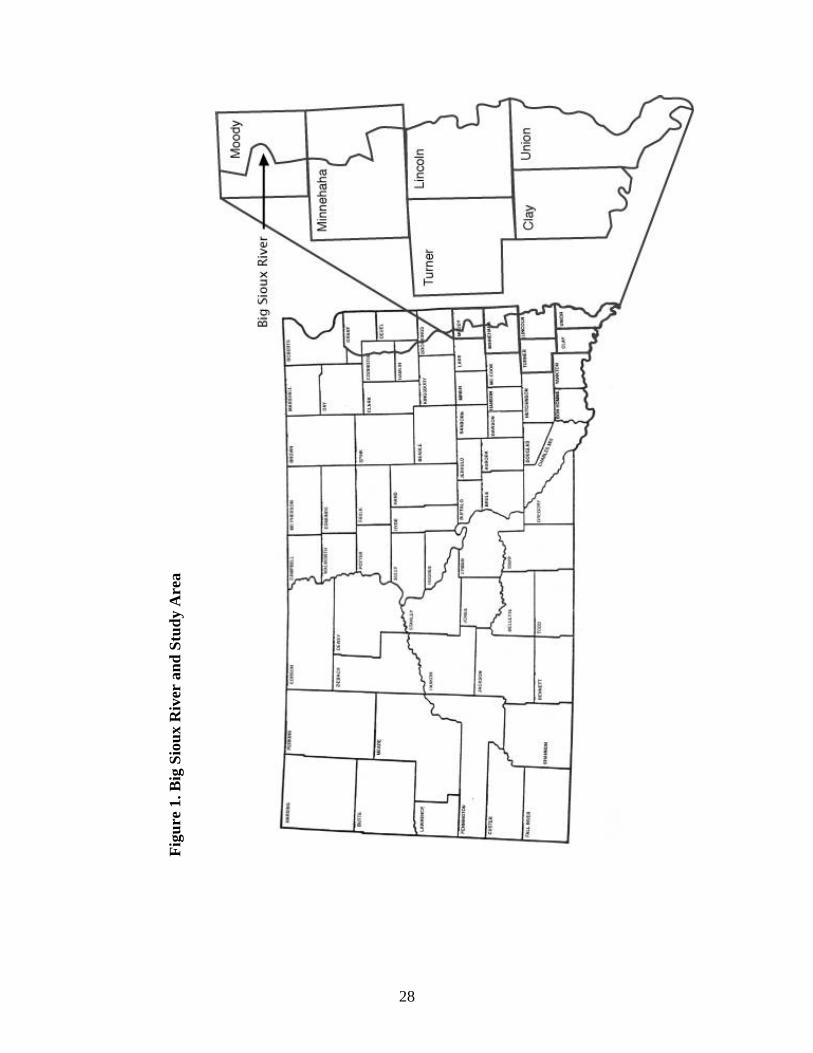
The study area lies in southeastern South Dakota, covering much of the Big Sioux
Aquifer (Figure 1). This area constitutes a major portion of the Big Sioux River drainage
area in South Dakota. The aquifer underlying the Big Sioux River provides drinking
water for a large portion of the state’s population. Therefore, agricultural practices that
potentially affect the river and underlying aquifer are of great interest to both farmers and
the general public (Dobbs and Carr). This area is on the edge of the Western Corn Belt,
with corn and soybeans being the dominant crops (Dumke and Dobbs). The six counties
that were included in the study area are Moody, Minnehaha, Lincoln, Turner, Union, and
Clay.
The representative farm model
The “representative” rotation for the study region was considered to be equal parts
corn and soybeans. ‘Conventional tillage’ in the study region was determined to be a
system consisting of chiseling corn stalks and small grain stubble after fall harvest and
either field cultivating or disking soybean and wheat residue in the spring, as needed to
incorporate fertilizer and herbicides during seedbed preparation. Conventional tillage, as
defined for this study, does not include a moldboard plow. Interviews suggested that no-
till farming systems are also frequently used, especially when planting soybeans. In the
case of the corn-soybean rotation, drilled soybeans, with soybeans planted in less than
30-inch rows with a no-till drill or air seeder, were just as common as conventionally
planted soybeans in 30-inch rows in some parts of the study area. We decided to include
5
both a conventionally rowed soybean system and a system in which soybeans are no-till
drilled in 15-inch rows.
The tillage system of a farm can play a large role in the bottom-line for the
operation, but with the increased use of genetically modified organisms (GMOs) in seed
varieties, the seed type can also play a role in the profitability of the operation. The
primary types of seeds planted in the study region are varieties of GMO corn and GMO
soybeans. Results of interviews indicated that Bt corn, which includes a gene that makes
the plant produce a substance that kills the European corn borer, was the most common
type of corn planted. Roundup Ready (RR) soybeans, which have an added gene that
inhibits the effects of the quickly-degrading Roundup herbicide, was the most commonly
planted soybean seed variety in the study region.
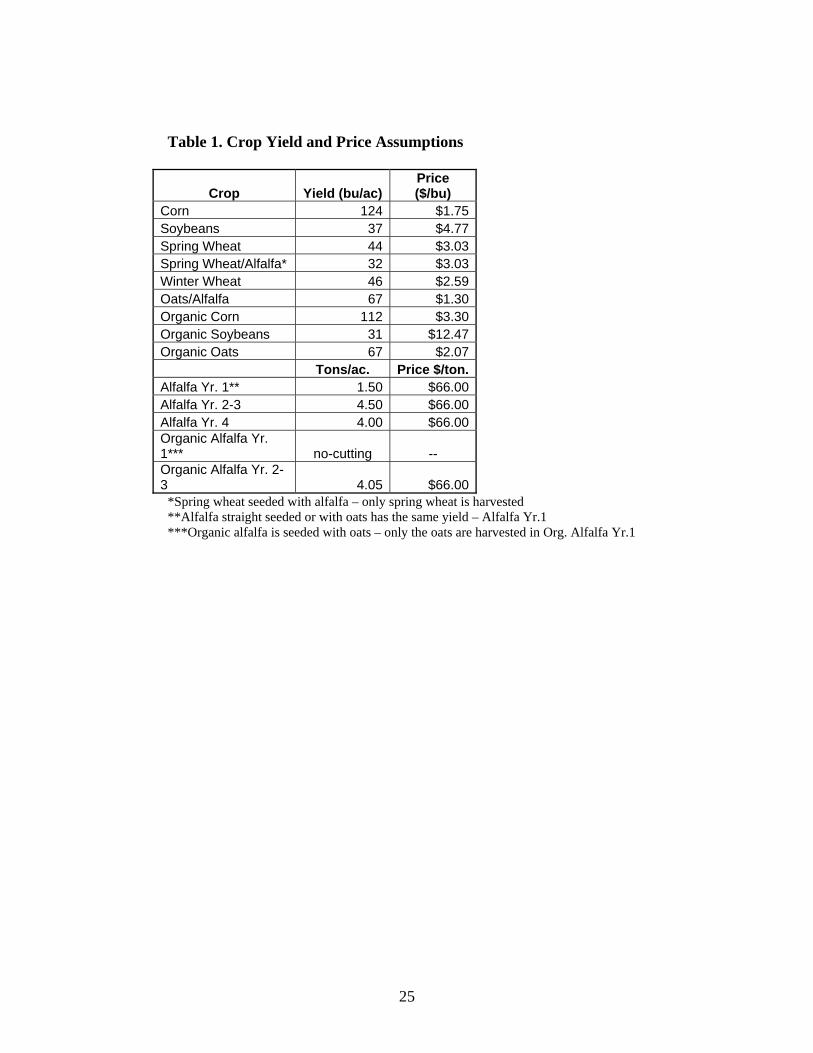
Crop price assumptions (Table 1) for the enterprise budgets were based on data
from May and Diersen. The prices were South Dakota 5-year (1997-2001) average prices
for each commodity. In the case of organic rotations, price premiums were included in
some of the selling prices. Streff and Dobbs reported price comparisons for organically
grown crops and conventionally grown crops. An organic farm price-to-South Dakota
cash price ratio was established for corn, soybeans, and oats from 1998 through 2002.
The organic prices used in the enterprise budgets were calculated by taking the 5-year
average organic farm and South Dakota cash price ratios and applying the ratios to the
conventional prices used in the enterprise budgets. The organic premiums were
discounted to account for the 3-year transition period required for a farmer to become
certified organic, at which time the crops sold are eligible for the organic premium. Based
on a 10-year time frame, a farmer transitioning from conventional to organic practices
6
would be eligible for the organic premium eight out of ten years, or 80 percent of the
time. Therefore, the prices used for organic crops reflected the assumption that
conventional prices would be received 20 percent of the time. Organic prices shown in
Table 1 reflect that transition period adjustment.
Yields for crops in each rotation (Table 1) were derived from statistics for the
study region and recent research on organic agriculture in nearby States. A 5-year
average per acre yield was calculated for each crop in the study region. These 5-year
averages were used in the crop enterprise budgets. Yields for the organically grown crops
were assumed to be different. In a Minnesota study, Porter et al. found that yields of
organically grown corn were, on average, 92 percent of yields from conventionally grown
corn. Yields from organically grown soybeans in the same study were approximately 83
percent of conventional yields. Porter et al. also found that organic alfalfa yield was 92
percent of the conventional yield, but organic oats yields were similar to conventional
yields in their study. In a recent Iowa study reported by Delate et al., organic corn yield
was 96 percent of the conventional yield, and the average organic soybean yield was
higher than the conventional yield. To present a conservative approach to the organic
rotations, ratios similar to those found by Porter et al. were utilized in our organic
enterprise budgets—90 percent for corn and alfalfa and 84 percent for soybeans. The
assumed yields for each crop are shown in Table 1.
The assumptions for yields, prices, machinery use, and land charge were entered
into the Cost and Returns Estimator (CARE) program to calculate each crop’s enterprise
budget.
7
Rotations analyzed
After formulating the “representative” farm for the study region and a baseline
rotation, alternative and organic crop rotations were formulated for CSP analyses and
comparisons with baseline systems. The alternative and organic rotations include
rotations of various lengths and crop mixes. Information from County Extension
Educator and farmer interviews, together with data from SDSU’s Southeast South Dakota
Experiment Farm, were used to specify alternative rotations. The alternative and organic
rotations were compared to the baseline corn-soybean rotation, to measure profitability
and the potential affects of CSP payments.
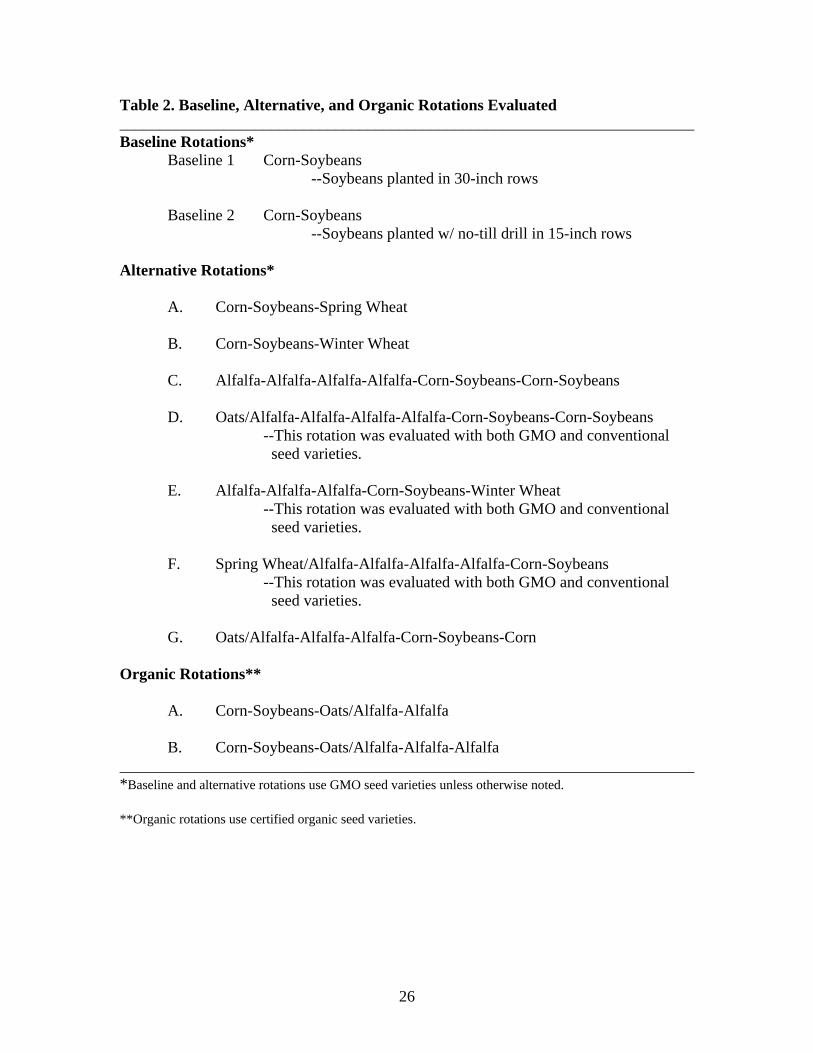
The baseline, alternative, and organic rotations that were analyzed are listed in
Table 2. The rotations ranged in length from the 2-year corn-soybean rotation used as the
baseline to an 8-year oats/alfalfa-alfalfa-alfalfa-alfalfa-corn-soybeans-corn-soybeans
rotation. Some rotations included both GMO and non-GMO seed varieties. Only one
rotation, baseline 2, had no-till soybeans; otherwise, all rotations with soybeans were
assumed to be planted with a min-till planter in 30-inch rows. The organic rotations
follow National Organic Program guidelines and practices commonly accepted for
organic certification—the use of manure for fertilization, no synthetic chemical
herbicides or insecticides, and use of certified organic (non-GMO) seed.
Commodity program policy assumptions
Since this study focused on the potential incentives for a “representative” farmer
to switch from a baseline rotation to an alternative or organic rotation, Federal farm
program payment assumptions—which cover direct payments (DPs), counter-cyclical
payments (CCPs), and loan deficiency payments (LDPs)—had to be the same for all
8
rotations analyzed. The 2002 Farm Bill left producers with several options to update base
acres and payment yields used for certain commodity program payments. For this
analysis, the producer was assumed to update his or her base acres and payment yields
with the baseline rotation of corn and soybeans in mind.
In the case of the “representative” farm with a corn-soybeans rotation, a base of
500 acres of corn and 500 acres of soybeans was assumed. Direct payments are
decoupled from price and production and are determined by the base acres and base
yields. Counter-cyclical payments (CCPs) are available for covered commodities
whenever the effective price is less than the target price. Loan deficiency payments
(LDPs) are coupled to current production and prices.
Conservation Security Program assumptions
The CSP legislation called for three tiers in which farmers could enroll land. A
Tier 1 contract would consist of a maximum annual payment of $20,000, and a 5-year
contract that is renewable for 5 to 10 years with a possible upgrade to a higher level. Tier
1 would involve only partial farm enrollment, and the farmer would address one
significant resource of concern for the enrolled portion of land. A Tier 2 contract would
have a maximum annual payment of $35,000 and a 5 to 10-year contract that is
renewable for up to 10 years. Tier 2 would require whole-farm enrollment and would
need to address at least one significant resource of concern for the entire operation. A
Tier 3 contract would have a maximum annual payment of $45,000 with a 5 to 10-year
contract that is renewable for up to 10 years. A Tier 3 contract would require whole-farm
enrollment, and the farmer would have to apply a resource management system that
addresses all resources of concern for the entire operation.
9
Payments for the CSP consist of three types. We describe here the apparent
legislative intent for payments in these tiers, and this does not necessarily completely
coincide with what has been done thus far in 2004 and 2005 signups. First, there is a base
payment. The base payment is supposed to be the average national per acre rental rate
for a specified use during 2001 or an appropriately adjusted rate to ensure regional equity
(NRCS, 2004b). The second portion of a CSP payment is to be based on the average
county cost of adopting or maintaining the practice for the 2001 crop year. Average
county costs are to be determined by the US Secretary of Agriculture. Cost share
payments can cover up to 75 percent (up to 90 percent for beginning farmers) of the cost
of maintaining or implementing a practice (NRCS, 2004b). The third portion of a CSP
payment is an “enhanced payment.” Enhanced payments are to be determined by the
Secretary and involve payments for producers who exceed contract expectations, such as
by participating in on-farm conservation research (Duffy; NRCS, 2004b).
In establishing our CSP assumptions, we used tier definitions and base payment
levels as specified in the original legislative language. We applied the CSP to each
alternative and organic rotation, but not to the baseline rotations. The CSP payment rates
varied for each rotation because the rotations were assumed to be enrolled in different
tiers.
According to legislation, the base payment for Tier 1 is 5 percent of the rental
rate, but the payments may not exceed $5,000. The base payment for Tier 2 is 10 percent
of the rental rate, not to exceed $10,500. The base payment for Tier 3 is 15 percent of the
rental rate, not to exceed $13,500 (NRCS, 2003b).
10
For our analyses, the 2001 average cropland cash rental rate for the six-county
area (as published by the South Dakota Office of the National Agricultural Statistics
Service) was used. The average cropland cash rental rate for the study area in 2001 was
$84 per acre. The legislative language specifies that 2001 data will be used for the life of
the program regardless of the actual year (NRCS, 2003b).
Each rotation (other than the baseline rotations) was enrolled in Tier 1, 2, or 3,
based on definitions set forth in the CSP legislation and assumptions that were made
about the potential environmental gains each rotation might provide. A Tier 1 contract
would receive a base payment per acre enrolled equal to 5 percent of the $84 rental rate,
or $4.20 per acre. A Tier 2 contract base payment would be equal to 10 percent of the
$84 rental rate, or $8.40 per acre. A Tier 3 contract would receive a base payment equal
to 15 percent of the $84 rental rate, or $12.60 per acre.
According to the CSP legislation, both costs of new practices and costs of
maintaining existing practices can be eligible for cost share payments (NRCS, 2003b).
Although the cost share payments for the 2004 signup were under review by
policymakers when our analyses were conducted, and the payments could have been
reduced to only 5 percent cost share, we assumed 75 percent cost share as allowed in the
original legislative language. The cost share payments were applied only to rotations that
contain alfalfa, since the establishment costs for alfalfa tend to be relatively high. The
cost share payments for alfalfa included only the establishment costs. Establishment
costs include spring tillage operations, fertilizer, seed, and planting. We assumed that a
farmer participating in the CSP would receive a payment equal to 75 percent of the
alfalfa establishment costs.
11
Enhanced payments may be provided if the CSP’s activities will increase
conservation performance as a result of additional effort made by the producer that:
improves a resource of concern to a condition that exceeds the minimum eligibility
requirements for the participant’s tier of participation or for other actions; addresses local
conservation priorities in addition to the concerns for the agricultural operation; or
involves the producer in research and demonstration projects, cooperation with other
producers to implement watershed or regional conservation plans covering at least 75
percent of the targeted area, or assessment and evaluation activities relating to practices
included in a conservation security plan. Rates for the enhanced payments in the 2004
signup had not been determined at the time our analyses were conducted. Therefore, we
did not include them. Some of our alternative and organic systems might be eligible for
enhanced payments, but without clear guidelines at the time for estimating payment rates,
a defensible method for specifying payment rates could not be established.
A CSP contract must address resource concerns faced by a farm operation.
Resource concerns may include, but are not limited to: soil erosion, water
quality/quantity, air quality (wind erosion), animal grazing productivity, or wildlife
(NRCS, 2003a). The main resource concerns outlined in the proposed “rule” were water
quality/quantity and soil erosion. To achieve the goal of maintaining the resource of
concern at a non-degradation standard, which means maintaining the resource at a level
adequate to protect and prevent degradation, the producer may employ any number of
conservation practices outlined and approved by the NRCS. The proposed “rule” for the
initial (2004) signup asserted that the CSP might be limited to sensitive water quality
12
areas (such as the Big Sioux Aquifer). In our analyses, we assumed that the CSP would
not be limited to particular geographic areas or specifically to soil and water concerns.
Our study focused on the conservation practice of a resource-conserving crop
rotation. We assumed that alternative and organic rotations would fall within the
guidelines for a resource-conserving crop rotation. A resource-conserving crop rotation
(or conservation crop rotation) is defined as a crop rotation that includes at least one
resource-conserving crop, reduces erosion, improves soil fertility and tilth, interrupts pest
cycles, and reduces depletion of soil moisture (Harkin et al.). By definition, this means
growing various crops in a planned sequence. This sequence may involve growing high
residue producing crops such as corn or wheat in rotation with low residue producing
crops such as vegetables or soybeans, as stated in the NRCS Field Office Technical
Guide.
Alternative rotations A and B (Table 1) may not qualify as resource-conserving
crop rotations, since they may not have a large or diverse enough crop mix to provide
sufficient environmental benefits. However, we assumed that rotations A and B each
would be eligible for a Tier 1 CSP contract. Alternative rotations C through G and the
organic rotations for this analysis (Table 1) clearly should be considered resource-
conserving rotations. Alternative rotations C through G were assumed to be enrolled in
Tier 2 CSP contracts. Organic rotations were assumed to address all resources of concern
for the farm operation, resulting in Tier 3 CSP contracts.
13
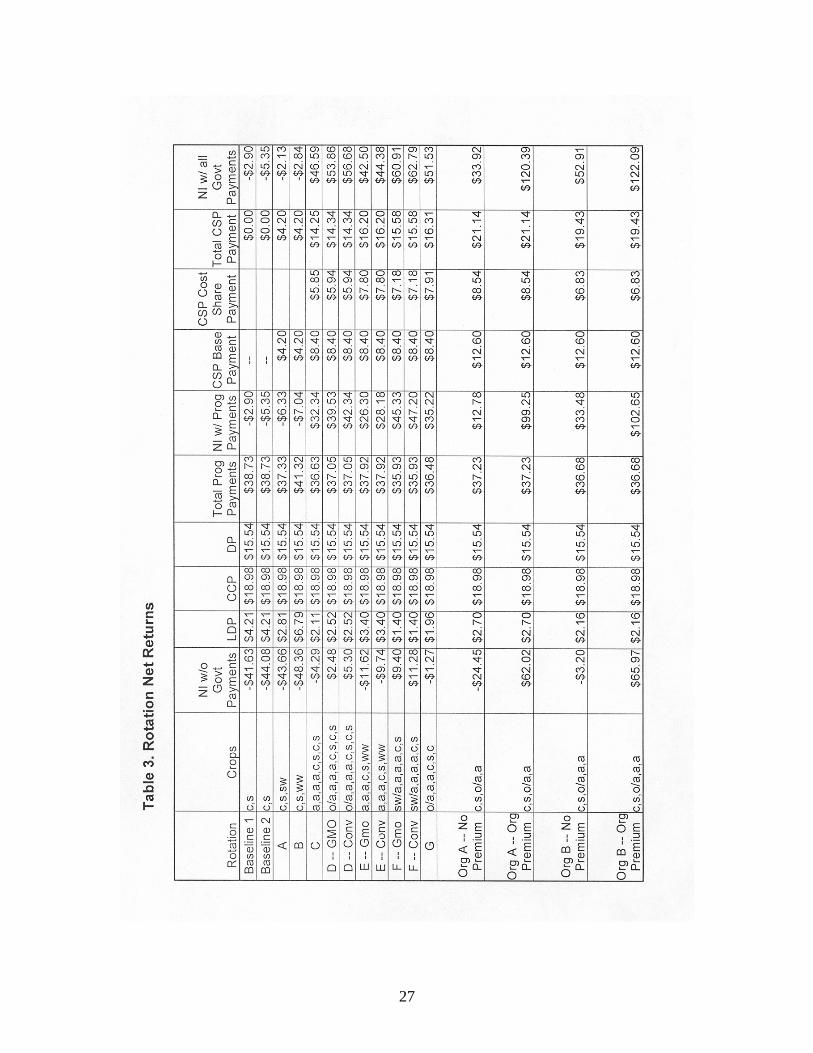
Results
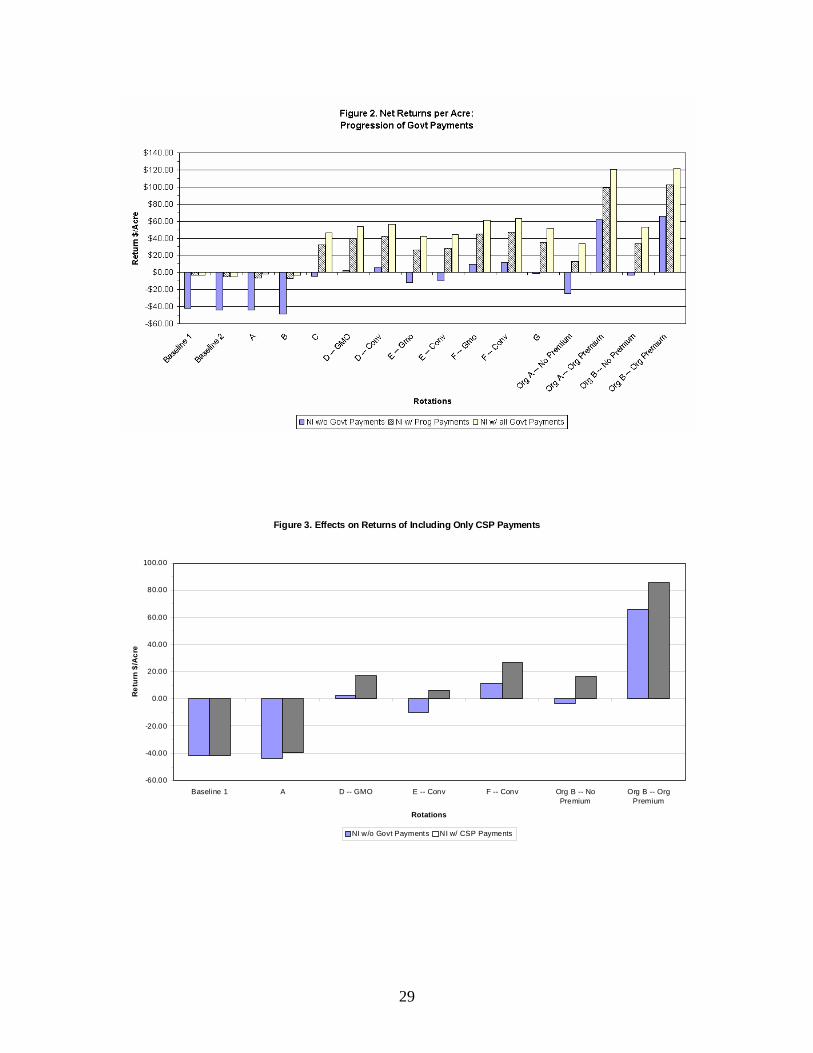
Net return results for the baseline and alternative systems are shown in Table 3
and Figure 2. First, we will explain the results without inclusion of CSP payments. Then,
we will discuss the potential effects of including CSP payments on relative profitability.
Without CSP payments
The baseline corn-soybean systems on our representative farm exhibit negative
net returns when all costs—including land, labor, and machinery charges—are included.
Baseline systems 1 and 2 show losses of $41 and $44/acre, respectively, when
government payments are ignored. Had the 2002 Farm Bill been in effect during the
1997-2001 period on which our average market price assumptions were based, combined
LDPs, CCPs, and DPs would have been $38/acre for these baseline systems (Table 3),
nearly enough to cause these systems to ‘break even’ in an average year. Stated another
way, total program payments constitute more than 40 percent of the assumed $90/acre
land charge included in the enterprise budgets.2 Without these government program
payments, one would expect rental rates in the study region to have been about $50/acre,
rather than $90/acre in 2003.
Of the alternative, non-organic rotations analyzed, those showing the highest net
returns without government payments included are ones with substantial amounts of
alfalfa in the system (Table 3 and Figure 2). Rotation F (both with and without GMO
seed) performed the best, with net returns (excluding government payments) of $9-
$11/acre. Except for Rotations A and B—which added some ecological diversity by
2 This was the average cropland cash rental rate in the study region in 2003. The $84/acre rental rate used in CSP base payment calculations was the average rental rate in the study region in 2001, as called for in the CSP legislation.
14
including either spring wheat or winter wheat in a 3-year rotation system—all of the
alternative systems had higher net returns or smaller net losses than the baseline corn-
soybean systems. Rotation A, with spring wheat, had net losses very similar to Baseline
systems 1 and 2, whereas Rotation B, with winter wheat, showed a slightly higher loss
per acre than those baseline systems.
Inclusion of government program payments did not change the overall pattern of
comparison for the baseline and alternative, non-organic rotation systems, because CCPs
and DPs per acre remained the same. This is because we assumed that the starting point
for farms switching to more ecologically diverse systems was a corn-soybean system
farm program acreage and yield base. LDPs, being based on actual planted acres and
yields, did differ slightly for the alternative systems. Except for Rotation B, that included
winter wheat, LDPs for the alternative systems were lower than for the baseline systems.
This is due primarily, of course, to there being no LDPs for alfalfa production. However,
when program payments were included, all of the alternative systems except for
Rotations A and B showed positive net returns. Those net returns ranged from $26/acre
for Rotation E with GMO seed to $47/acre for Rotation F with conventional seed.
Rotation F, a 6-year rotation, has 3 years of harvested alfalfa after the establishment year
and only 1 year each of corn and soybeans. Although Rotation F only benefited from
LDPs on one-third of the average acreage, assumed alfalfa yields and prices (Table 2)
were sufficient to much more than make up the difference.
Two different organic systems were analyzed (Table 2), each of them both with
and without assumed organic price premiums (Table 1). Organic Rotation A had only 1
year of alfalfa after the establishment year, whereas Organic Rotation B had 2 such years.
15
Excluding government farm program payments, Organic Rotation A showed a net loss of
$24/acre and Organic Rotation B was within $3/acre of being a break-even system when
possible organic price premiums were not accounted for (Table 3). When organic price
premiums were included for corn, soybeans, and oats (but not alfalfa), both organic
systems had much higher net returns (exclusive of government program payments) than
any of the other systems (Figure 2).
Like the alternative, non-organic systems, the organic systems had the same CCPs
and DPs per acre as the baseline corn-soybean systems, but lower per acre LDPs—
because they had smaller portions of the crop acreage in LDP-qualifying crops than the
baseline systems. Nevertheless, inclusion of government program payments did not
change the overall pattern of comparison with other systems, because the average
program payments of $36-$37/acre were quite similar to those for the alternative, non-
organic systems. Inclusion of government program payments resulted in positive net
returns for both organic systems, even when organic price premiums were excluded; net
returns were $12/acre for Organic System A and $33/acre for Organic System B (Table
3). When both government program payments and organic price premiums were included
in the analysis, the organic systems had net returns ($99-102/acre) that substantially
exceeded those for any of the other systems (Table 3 and Figure 2).
With CSP payments
Assumed CSP payments at the Tier 1 level for rotations A and B—which include
base payments only—add a little over $4/acre to net returns (Table 3). This is not enough
payment to make much difference in the profitability of these systems relative to either
the baseline corn-soybean systems or to the more ecologically diverse organic and non-
16
organic rotations (Figure 2). Tier 2 CSP payments for the non-organic rotations that
included alfalfa were in the $14-$16/acre range. These rotations already were more
profitable than the baseline rotations, which we assumed did not qualify for any CSP
payments based on resource-conserving crop rotation criteria, and the CSP payments
substantially increased that profitability advantage. Tier 3 contracts for the organic
systems were assumed to add $19-$21/acre to the net returns of these systems. These
payments increased the competitiveness of the organic systems relative to the alternative,
non-organic systems when no price premiums were assumed. Of course, no ‘enhanced’
CSP payments were included in the calculations. Were the organic systems to qualify for
greater enhanced payments than the other systems, that would further strengthen their
relative profitability.
A more radical way to look at the potential impact of CSP payments is to assume
existence of the CSP but no commodity ‘program’ payments. Potential effects of a U.S.
farm bill that includes CSP payments but no LDPs, CCPs, or DPs are illustrated for
selected rotation systems in Figure 3. The Baseline 1 corn-soybean system, not qualifying
for CSP payments under our assumptions, of course fails to cover current land charges.
Rotation A, which includes spring wheat along with corn and soybeans, receives only a
very modest CSP payment and, therefore, also falls far short of covering land charges.
The more diverse systems shown in Figure 3, however, all exhibit positive net returns
when CSP payments are included. This includes Organic Rotation B even without any
price premiums included.
Tier 2 and Tier 3 payments assumed in our analysis could provide significant
incentive for farmers to convert to more diverse rotations in the southeastern South
17
Dakota study region. For a representative 1,000 acre farm, these payments could add
approximately $14,000 to $21,000 annually to whole-farm net returns. If potential
enhanced payments and payments for practices related to other resource concerns also
were included, per farm payments could be considerably higher—up to $35,000 annually
for a Tier 2 contract and $45,000 for a Tier 3 contract.
Implications for Implementation of the CSP
If alternative rotations that incorporate alfalfa—whether or not they are organic—
are so profitable relative to corn-soybean systems, why do corn-soybean systems
continue to dominate the Western Corn Belt? Dumke and Dobbs documented a number
of reasons for this in eastern South Dakota, based on a historical review of the Sioux
River Basin and focus group interviews with farmers. Among the reasons for farmers’
reluctance to move away from the corn-soybean system that evolved over the last half of
the 20th Century are: (a) changing family structures, with less available family labor for
haying operations than in the past; (b) weather risk associated with harvesting hay in a
timely manner; (c) specialization that has led to a less diverse mix of equipment on most
farms; and (d) the absence of farm program price ‘guarantees’ for hay like those that are
available for grain and oilseed crops.
Although Smolik, Dobbs, and Rickerl showed that profitability risk may actually
be less for some organic farming systems than for non-organic systems in the same area,
farmers often mention special risks associated with organic farming. The Organic
Farming Research Foundation’s fourth national survey found that organic farmers ranked
the following as their top eight (in order) production, market, or regulatory “problems”:
(1) weather-related production losses; (2) organic certification costs; (3) obtaining
18
organic price premiums; (4) high input costs; (5) lack of organic marketing networks; (6)
high labor costs; (7) weed-related production losses; and (8) production losses due to
pests and insects (Walz, p. 69). Although some of these problems, especially high input
costs, apply more to organic farming systems in other parts of the U.S. than to Western
Corn Belt grain-oilseed-forage legume systems, the list does provide some indication of
special obstacles to farming with diverse systems that are organic. Hanson, et al.
examined perceived risks associated with organic farming by assembling farmer focus
groups in six areas of the U.S. in 2001 and 2002. Among the risks of organic farming
identified in their focus group interviews are: some ambiguities in the national organic
standards, causing some farmers to be concerned about risks of unintentionally losing
their certification; markets for some organic products are sensitive to oversupply and
prices may be highly variable; and risks of ‘contamination’ of organic fields by
genetically modified organisms, potentially resulting in loss of organic certification.
Although organic farmland acreage has expanded rapidly in the U.S. in recent years—by
74 percent between 1997 and 2001—it was only 0.3 percent of total farmland in 2001
(Greene and Kremen). This suggests that, in spite of the profitability ‘potential’ for at
least some farmers, there must be substantial perceived risks and other obstacles to much
more widespread adoption of organic farming systems.
Given the severe lack of ecological diversity in America’s agricultural
‘heartland’, special policy measures would seem to be called for if restoration of diversity
were to rise to prominence as a national policy goal. Most western European countries
have national programs to help finance the transition to organic agriculture, and many
continue financial support for organic farming even beyond the transition stage (Dabbert,
19
Haring, and Zanoli). The U.S. has no comparable policies, either for organic agriculture
or for other ecologically diverse systems. Recognizing a similar absence of ecological
diversity in the United Kingdom’s principal crop regions, in spite of the existence of
organic transition and other agri-environmental schemes, Dobbs and Pretty recommended
the adoption of a National Capital for Food Security Fund. The proposed fund would
finance an agri-environmental scheme focused on reintroducing legume-based rotations,
in order to halt the trend of “ever-increasing dependence on chemical inputs and
continued decline in soil quality” (Dobbs and Pretty, p. 62). The CSP, if properly
implemented, has the potential to play that role in the U.S.
As indicated previously in this paper, however, the CSP has not been
implemented in ways observers feel that sponsors of the enabling legislation intended.
The initial signup during 2004 in eighteen U.S. watersheds was focused primarily on soil
and water conservation, rather than the much broader spectrum of resource concerns
called for in the legislation. Budget constraints forced the NRCS to develop a
complicated system of categories to determine who would receive contracts in each
watershed. In effect, this was a quasi-ranking system, even though the CSP was intended
by Congress to be an ‘entitlement’ program, not a competitive bid program like the CRP.
The base payment rates—referred to in the implementation rules as ‘stewardship
payment’ rates—were adjusted downward by 25 percent, 50 percent, and 75 percent
“reduction factors” in Tiers 1, 2, and 3, respectively. This means that a Tier 3 base
(‘stewardship’) payment of $12.60/acre in our analysis would actually have been only
$9.45/acre under implementation rules used in the first signup period. Our Tier 2
payments, with the 50 percent reduction factor, would have been $4.20/acre, instead of
20
$8.40/acre. Moreover, new practice payments were capped at 50 percent, rather than 75
percent, of costs. (NRCS, 2004a) At that rate, the CSP payment for alfalfa establishment
in Alternative Rotation F in our analysis, for example, would be $4.78/acre instead of
$7.18/acre (based on the 75 percent cost-share that we assumed).
South Dakota has two watersheds that are eligible for the second signup period,
during Spring 2005. One of these watersheds, the Vermillion watershed, includes
portions of four of the six counties included in our study region, as well as portions of six
other counties to the west of our study area (NRCS, 2005c). The stewardship payment
reduction factors for 2005 remain the same as in 2004 (NRCS, 2005a). Rental rates used
by the NRCS for calculation of stewardship payments in the Vermillion Watershed were
approximately $75/acre, compared to $84/acre in our study region. With the reduction
factors, Vermillion Watershed stewardship (base) payment rates are $3.75/acre for Tier 2
cropland and $8.44/acre for Tier 3 cropland (NRCS, 2005c). By comparison, the rates
that we assumed in our study region—with no reduction factors—were $8.40/acre and
$12.60/acre for Tiers 2 and 3, respectively.
The 50 percent cost-share cap for new practices remains in effect in the 2005 CSP
signup, except for “limited resource” or “beginning” farmers, for whom the cost-share
can go as high as 65 percent (NRCS, 2005b). This extra 15 percent cost-share was not
allowed in the 2004 CSP signup. It appears that alfalfa hay establishment might qualify
for CSP payments under either the new practices cost-share provisions or the enhanced
payment provisions. Under the enhanced payment provision, a $45/acre payment for
newly established hay land apparently could be made for up to 5 years in the Vermillion
Watershed (NRCS, 2005c). In our analyses, we assumed 75 percent CSP cost-share for
21
alfalfa establishment, but no enhanced payment for the ecologically diverse rotations
examined.
The idea of paying farmers for ecologically diverse rotations under the enhanced
payment component of the CSP is conceptually sound. However, for the stewardship and
enhanced payments to be truly effective in weaning Western Corn Belt farmers away
from their heavily subsidized corn-soybean rotations, it is important for farmers to be
able to renew their CSP contracts and continue to receive the enhanced payments.
Although CCPs and DPs are considered to be ‘decoupled’, the fact that farmers were able
to update acreage and yield bases under 2002 Farm Bill provisions suggests that farmers
probably do not consider them decoupled over the long run as they make crop system
decisions. Consequently, as long as the collection of Federal commodity program
payments remain in force and contribute in such a major way to net farm incomes,
countervailing agri-environmental payments of substantial magnitude probably will be
needed. If implemented with a more long-term perspective, the CSP could be a valuable
policy mechanism for inducing greater ecological diversity. The limitations on CSP
funding thus far, and consequent delays and complications in implementation, do not
provide a basis for great optimism, however.
22
REFERENCES
Dabbert, S., A.M. Haring, and R. Zanoli. Organic Farming: Policies and Prospects. Zed Books, London and New York, 2004.
Delate, K., M. Duffy, C. Chase, A. Holste, H. Friedrich, and N. Wantate. “An Economic
Comparison of Organic and Conventional Grain Crops in a Long-Term Agroecological Research (LTAR) Site in Iowa.” American Journal of Alternative Agriculture 18, no. 2(2003):59—69.
Dobbs, T.L., and L.M. Carr. “Changes in Eastern South Dakota Crop Patterns: 1950s to
1990s.” Econ. Pamphlet 97-1, South Dakota State University, 1997. Dobbs, T., and J. Pretty. “Future Directions for Joint Agricultural-Environmental
Policies: Implications of the United Kingdom Experience for Europe and the United States.” Econ. Res. Rep. 2001-1, South Dakota State University, and Centre for Env. and Society Occasional Pap. 2001-5, University of Essex, August 2001.
Duffy. M. “Farm Security and Rural Investment Act of 2002: Conservation Security
Program.” Iowa State University Extension, No. 1872b, July 2002. Dumke, L.M., and T.L. Dobbs. “Historical Evolution of Crop Systems in Eastern South
Dakota: Economic Influences.” Econ. Res. Rep. 99-2, South Dakota State University, 1999.
Greene, C., and A. Kremen. U.S. Organic Farming in 2000-2001: Adoption of Certified
Systems. E.R.S. Agr. Info. Bul. 780, U.S. Department of Agriculture, Washington, DC, February 2003.
Hansen, J., R. Dismukes, W. Chambers, C. Greene, and A. Kremen. “Risk and Risk
Management in Organic Agriculture: Views of Organic Farmers.” Renewable Agriculture and Food Systems 19, no. 4(2004):218—227.
Harkin, T., G. Smith, T. Daschle, P. Leahy, B. Dorgan, T. Johnson, M. Dayton, C.
Schumer, H. Clinton, D. Stabenow, H. Kohl, P. Sarbanes, J. Kerry, E. Kennedy, P. Wellstone, R. Durbin, and B. Boxer. Conservation Security Act, 2001 – S. 932. Congressional Record of the U.S. Senate, Washington DC: 22 May, 2001. http://fb-net.org/FB/CSA/csa-intro.htm.
May, A., and M.A. Diersen. “Commodity Price Outlook 2003.” South Dakota State
University Cooperative Extension Service, No. 926, February 2003. Natural Resources Conservation Service (NRCS), U.S. Department of Agriculture.
“Conservation Security Program: Administrative Actions.” Washington, DC, April, 2005a. http://www.nrcs.usda.gov/programs/csp/2005
23
Natural Resource Conservation Service (NRCS), U.S. Department of Agriculture.
“Conservation Security Program Interim Final Rule with Request for Comments.” Washington, DC, June 9, 2004a. http://www.nrcs.usda.gov/programs/farmbill/2002/rules/csp060904.html.
Natural Resource Conservation Service (NRCS), U.S. Department of Agriculture.
“Conservation Security Program Interim Final Rule with Request for Comments.” Washington, DC, March 25, 2005b. http://www.nrcs.usda.gov/programs/csp/2005
Natural Resource Conservation Service (NRCS), U.S. Department of Agriculture.
“Conservation Security Program: Proposed Rule.” Federal Register 69, no. 1, Washington DC, January 2004b. http://edocket.access.gpo.gov/2004/pdf/03-31916.pdf.
Natural Resource Conservation Service, U.S. Department of Agriculture. “Conservation
Security Program Proposed Rule Benefit Cost Assessment.” Washington DC, November 14, 2003a. http://www.nrcs.usda.gov/programs/csp/CSP%20Economic%20Analysis.pdf.
Natural Resources Conservation Service (NRCS), U.S. Department of Agriculture. “Conservation Security Program: South Dakota.” April 2005c.
http://www.sd.nrcs.usda.gov/programs/CSP.html Natural Resource Conservation Service, U.S. Department of Agriculture. “Conservation
Security Program Summary of Proposed Rule.” Washington DC, December 16, 2003b. http://www.nrcs.usda.gov/programs/farmbill/2002/pdf/cspsummary.pdf.
Porter, P.M., D.R. Huggins, C.A. Perillo, S.R. Quiring, and R.K. Crookston. “Crop
Rotations: Organic and Other Management Strategies with Two- and Four-Year Crop Rotations in Minnesota.” Agronomy Journal 95, no. 2(2003):233—244.
Smolik, J.D., T.L. Dobbs, and D.H. Rickerl. “The Relative Sustainability of Alternative,
Conventional, and Reduced-till Farming Systems.” American Journal of Alternative Agriculture 10, no. 1(1995): 25—35.
Streff, N. “Economic Incentives for South Dakota Farmers to Participate in the
Conservation Security Program.” MS thesis, South Dakota State University, 2004.
Streff, N., and T.L. Dobbs. “Prices of Crop Products Grown Organically in the Northern
Plains and Upper Midwest.” Economics Commentator 437, South Dakota State University, 2003.
24
Walz, E. Fourth National Organic Farmers’ Survey: Sustaining Organic Farms in a Changing Organic Marketplace. Organic Farming Research Foundation, Santa Cruz, CA, 2004.
Westra, J.V., J.K.H. Zimmerman, and B. Vondracek. “Do Conservation Practices and
Programs Benefit the Intended Resource Concern?” Agricultural and Resource Economics Review 33, no. 1(2004):105—120.
25
Table 1. Crop Yield and Price Assumptions
Crop Yield (bu/ac)Price ($/bu)
Corn 124 $1.75Soybeans 37 $4.77Spring Wheat 44 $3.03Spring Wheat/Alfalfa* 32 $3.03Winter Wheat 46 $2.59Oats/Alfalfa 67 $1.30Organic Corn 112 $3.30Organic Soybeans 31 $12.47Organic Oats 67 $2.07 Tons/ac. Price $/ton.Alfalfa Yr. 1** 1.50 $66.00Alfalfa Yr. 2-3 4.50 $66.00Alfalfa Yr. 4 4.00 $66.00Organic Alfalfa Yr. 1*** no-cutting -- Organic Alfalfa Yr. 2-3 4.05 $66.00
*Spring wheat seeded with alfalfa – only spring wheat is harvested **Alfalfa straight seeded or with oats has the same yield – Alfalfa Yr.1 ***Organic alfalfa is seeded with oats – only the oats are harvested in Org. Alfalfa Yr.1
26
Table 2. Baseline, Alternative, and Organic Rotations Evaluated ________________________________________________________________________ Baseline Rotations* Baseline 1 Corn-Soybeans --Soybeans planted in 30-inch rows Baseline 2 Corn-Soybeans --Soybeans planted w/ no-till drill in 15-inch rows Alternative Rotations* A. Corn-Soybeans-Spring Wheat B. Corn-Soybeans-Winter Wheat C. Alfalfa-Alfalfa-Alfalfa-Alfalfa-Corn-Soybeans-Corn-Soybeans D. Oats/Alfalfa-Alfalfa-Alfalfa-Alfalfa-Corn-Soybeans-Corn-Soybeans --This rotation was evaluated with both GMO and conventional seed varieties.
E. Alfalfa-Alfalfa-Alfalfa-Corn-Soybeans-Winter Wheat --This rotation was evaluated with both GMO and conventional seed varieties.
F. Spring Wheat/Alfalfa-Alfalfa-Alfalfa-Alfalfa-Corn-Soybeans --This rotation was evaluated with both GMO and conventional seed varieties.
G. Oats/Alfalfa-Alfalfa-Alfalfa-Corn-Soybeans-Corn Organic Rotations**
A. Corn-Soybeans-Oats/Alfalfa-Alfalfa
B. Corn-Soybeans-Oats/Alfalfa-Alfalfa-Alfalfa ________________________________________________________________________ *Baseline and alternative rotations use GMO seed varieties unless otherwise noted.
**Organic rotations use certified organic seed varieties.
27
28
Figu
re 1
. Big
Sio
ux R
iver
and
Stu
dy A
rea
29
Figure 3. Effects on Returns of Including Only CSP Payments
-60.00
-40.00
-20.00
0.00
20.00
40.00
60.00
80.00
100.00
Baseline 1 A D -- GMO E -- Conv F -- Conv Org B -- NoPremium
Org B -- OrgPremium
Rotations
Ret
urn
$/A
cre
NI w/o Govt Payments NI w/ CSP Payments