Embed Size (px)
Citation preview
1
ST. ANTHONY FALLS LABORATORY Engineering, Environmental and Geophysical Fluid Dynamics
Project Report No. 509
Potential for Groundwater Contamination by
Road Salt in Minnesota
by
Andrew Sander, Eric Novotny, Omid Mohseni, and Heinz Stefan
Prepared for
Local Road Research Board/ Minnesota Department of Transportation
St. Paul, Minnesota
November, 2008
Minneapolis, Minnesota
2
The University of Minnesota is committed to the policy that all persons shall have equal access to its programs, facilities, and employment without regard to race, religion, color, sex, national origin, handicap, age or veteran status.
3
Abstract
In northern states of the U.S. and in virtually all provinces of Canada sodium chloride is becoming a water contaminant of increasing concern. The source of contamination is mostly anthropogenic: Salt (NaCl) is used in large amounts for road deicing and water softening. Sodium chloride enters into the environment easily in snowmelt runoff and from wastewater treatment plant discharges.
Sodium chloride is not removed by conventional waste water treatment. It is a fairly conservative material and can travel long distances without assimilation. It affects terrestrial and aquatic ecosystems. Because of its adverse effects on plants and aquatic animals, water quality standards for Cl have been set, e.g. by the Minnesota Pollution Control Agency (MPCA) at 230mg/L and 800 mg/L for chronic and acute exposure, respectively.
The Minneapolis/St. Paul (Twin Cities) Metropolitan Area (TCMA) is one of the regions where sodium chloride is used for winter road maintenance and for water softening. The TCMA is an urbanized area with a population of about 2.7 million people in seven counties. It is located at about 45oN latitude and has a reputation of cold and long winters. The TCMA is traversed by the Mississippi River and several of its tributaries, and claims to have 949 lakes within its seven counties and over 188 cities and townships. There are over 26,000 lane miles of roadways with impervious surfaces in the TCMA.
In previous reports of this study we have given a budget for road salt applications in the TCMA and field observations of salinity in lakes of the TCMA. The goal of this study is to give an overview of measured chloride and sodium concentrations in groundwater (wells) of the TCMA. The information will be compared to statewide observations in Minnesota, and to other regions in northern climates. Changes in groundwater salinity in the TCMA and Minnesota over time, particularly the last 50 years are of particular interest, because it is suspected that aquifers are the ultimate recipients (sinks) of some of the road salt applied at the ground surface. This study is not aimed at evaluating the effectiveness, suitability or cost of using NaCl as a deicer.
This technical report provides results of a study funded by the Local Roads Research Board (LLRB and Mn/DOT). The purpose of this document is to assemble, review and interpret data on chloride concentrations in aquifers (wells) of the Minneapolis/ St. Paul Metropolitan area and the state of Minnesota. Of specific interest are:
current chloride concentrations in geological formations (aquifers), effects of land use, e.g. urban development and road density on chloride
concentrations in aquifers (spatial dependence), historical trends in chloride concentrations in aquifers (temporal dependence).
Many sources of information on groundwater quality in the TCMA and the state
of Minnesota were consulted: the Minnesota Pollution Control Agency (MPCA), Minnesota Department of Health, Minnesota Geological Survey, US Geological Survey and the water departments of several municipalities. Statewide groundwater quality surveys by the MPCA from 1992 to 1996 and from 2003 to 2005 provided the largest amount of data.
4
The total amount of NaCl applied to roads in the TCMA per season is estimated at 349,000 short tons per year (Sander et al. 2007). The breakdown is: 33% by cities, 23% by MnDOT, 21% by counties, 16% by commercial outfits (bulk), and 5% by others. On a long timescales (decades), population is an indicator of road salt use. The findings of this study indicate that:
1) Chloride concentrations in shallow groundwater wells near major roads are higher
than in other wells.
2) Chloride concentrations in some shallow groundwater wells of urban areas have
increased over the last 15 years.
3) Higher chloride concentrations have been found by the MPCA in shallow
groundwater monitoring wells than in deep wells in the TCMA.
4) Samples with chloride concentrations above 250mg/L have been found by the
MPCA in shallow groundwater wells less than 50ft deep in close proximity to
road networks in the TCMA.
5
Table of Contents
1. INTRODUCTION...................................................................................................... 6
2. GROUNDWATER IN MINNESOTA...................................................................... 7
2.1 GROUNDWATER MONITORING ...................................................................... 7 2.2 MAJOR AQUIFERS IN MINNESOTA AND THE TCMA................................... 9 2.3 WELLS IN MINNESOTA............................................................................................. 9
3. ROAD SALT USE.................................................................................................... 10
3.1 ROAD SALT APPLICATIONS IN THE TCMA ................................................. 10 3.2 ROAD SALT APPLICATIONS IN MINNESOTA.............................................. 14 3.3 ROAD SALT APPLICATIONS IN THE U.S....................................................... 15 3.4 TRENDS IN ROAD SALT USE........................................................................... 16
3.4.1 Trends in the TCMA ...................................................................................... 16 3.4.2 Trends in Minnesota and the U.S. .................................................................. 17
4. ULTIMATE FATE (SINKS) OF ROAD SALT.................................................... 18
5. GROUNDWATER DATA SOURCES AND METHODOLOGY....................... 19
6. CHLORIDE IN MINNESOTA GROUNDWATER............................................. 19
7. COMPARISON WITH THE TORONTO METRO REGION ........................... 25
Acknowledgements ......................................................................................27
References..................................................................................................................... 28
6
1. INTRODUCTION
Salt has been widely used for ice and snow control on roads in the US, Canada and other parts of the world affected by adverse winter driving conditions. The primary product used in North America for deicing is sodium chloride (NaCl), a readily available and inexpensive product that provides adequate treatment to roadways under winter conditions. In the spring, road salt dissolves in the runoff from roadways and parking lots and enters ditches, streams or storm sewers. In metropolitan areas a large portion of the storm sewers drain into streams, rivers, lakes and detention ponds. In the northern states of the U.S. and in the populated provinces of Canada sodium chloride (NaCl) is therefore becoming a water contaminant of increasing concern (see Web Sites at the end of the List of References).
Natural sources of NaCl in the environment include bedrock weathering and atmospheric additions. The latter is mostly from sea spray and can be disregarded for a mid-continent location. The source of contamination is mostly anthropogenic: Salt (NaCl) is used in large amounts for road deicing and water softening. Smaller amounts are used for industrial and agricultural purposes. NaCl enters the environment easily in snowmelt runoff and from wastewater treatment plant discharges. It is not removed by conventional waste water treatment, and is a fairly conservative material that can travel long distances without assimilation.
Sodium chloride affects terrestrial and aquatic ecosystems. Because of its adverse
effects on plants and aquatic animals, water quality standards for Cl have been set, e.g. by the Minnesota Pollution Control Agency (MPCA) at 230mg/L and 800 mg/L for chronic and acute exposure, respectively.
The Minneapolis/St. Paul (Twin Cities) Metropolitan Area (TCMA) is one of the
regions where sodium chloride is used for winter road maintenance and for water softening. The TCMA is an urbanized area with a population of about 2.7 million people in seven counties. It is located at about 45oN latitude and has a reputation of cold and long winters. The TCMA is traversed by the Mississippi River and several of its tributaries, and claims to have 949 lakes within its seven counties and over 188 cities and townships. There are over 26,000 lane miles of roadways with impervious surfaces in the TCMA.
The total amount of NaCl applied to roads in the TCMA per season is currently
estimated to be 349,000 short tons per year: 33% by cities, 23% by MnDOT, 21% by counties, 16% by commercial outfits (bulk), 5% by others. On a long timescale (decades), population is the main indicator of road salt use.
In previous reports of this study we have given an inventory of road salt applications in the TCMA and presented conclusions from field observations of salinity in lakes of the TCMA. The goal of this study is to give an overview of measured chloride and sodium concentrations in groundwater (wells, aquifers) of the TCMA. The information will be compared to statewide observations in Minnesota, and to other regions in northern climates. Changes in groundwater salinity in the TCMA and
7
Minnesota over time, particularly the last 50 years are of particular interest, because it is suspected that aquifers are the ultimate recipients (sinks) of some of the salt used in populated areas and roads. This study is not aimed at evaluating the effectiveness, suitability or cost of using NaCl as a deicer.
This technical report provides results of a study funded by the Local Roads Research Board (LLRB and Mn/DOT). The purpose is to assemble, review and interpret data on sodium and chloride concentrations in aquifers (wells) of the Minneapolis St. Paul Metropolitan area and the state of Minnesota, and to relate this information to road salt uses. Of specific interest are:
current chloride concentrations in geological formations (aquifers), effects of land use, e.g. urban development and road density on chloride
concentrations in aquifers (spatial dependence), historical trends in chloride concentrations in aquifers (temporal dependence).
2. GROUNDWATER IN MINNESOTA
2.1 GROUNDWATER MONITORING
In Minnesota, several state and federal government agencies play a role in groundwater resource control and management. The agencies are charged with tasks that range from resource (quantity) management to water quality and human health. The six main agencies with information on Minnesota’s groundwater are:
Minnesota Department of Health Minnesota Department of Agriculture Minnesota Department of Natural Resources Minnesota Pollution Control Agency Minnesota Geological Survey US Geological Survey
In addition municipal water departments and counties have information on groundwater resources and use.
The Minnesota Department of Health (MDH) is the controlling agency for Health Risk Assessment, Drinking Water Protection, Hazardous Sites and Substances, and Well Management. The latter of these includes maintaining the County Well Index (CWI), a physical geological record of wells in Minnesota. The MDH is also responsible for measuring priority one contaminants in all municipal water supply systems in the state. Since chloride is a secondary contaminant, mainly associated with aesthetics (taste), it does not have a regular testing program associated with it.
The Minnesota Department of Agriculture (MDA) is responsible for the
monitoring of surface and groundwater for contaminants associated with agricultural practices including irrigation and drainage. Of interest is long-term evaluation of regular
8
pesticide applications on water quality. Subsequently, the MDA only samples in areas of agricultural runoff, not including the TCMA.
The Minnesota Department of Natural Resources (DNR) is charged with managing groundwater quantities in the state. The DNR currently operates the Ground Water Level Monitoring Program, and the Ground Water Mapping Program, which collect data on the presence, direction of flow, and natural quality of ground water and on regional geology. The DNR is also responsible for the maintenance of records of streams and lakes in the state to assist in water appropriation permits and conservation plans.
The Minnesota Pollution Control Agency's (MPCA) runs a major groundwater
monitoring program; the Groundwater Monitoring and Assessment Program (GWMAP) which was initiated in 1989. Under GWMAP over 800 wells in the state were sampled once between 1992 and 1996 to determine background concentrations of chemicals in groundwater. This data collection was repeated starting in 2003 when the MPCA initiated a trend analysis study on contaminants in Minnesota. These two data sets are very comprehensive and provide chloride concentrations for each well and physical characteristics of the well, i.e. location, well depth, and geological formations.
The Minnesota Geological Survey (MGS) has developed hydrogeologic maps and
other information on Minnesota’s aquifers. The MGS provides regional information on shallow and deep aquifers.
The USGS monitors groundwater levels and quality in addition to stream flow
throughout the state. The USGS maintains the Active Groundwater Level Network as well as the National Water Quality Assessment Program (NAWQA). The NAWQA program is similar to the efforts of the MPCA: it is aimed at a wide range of water quality metrics and contaminant tracking.
9
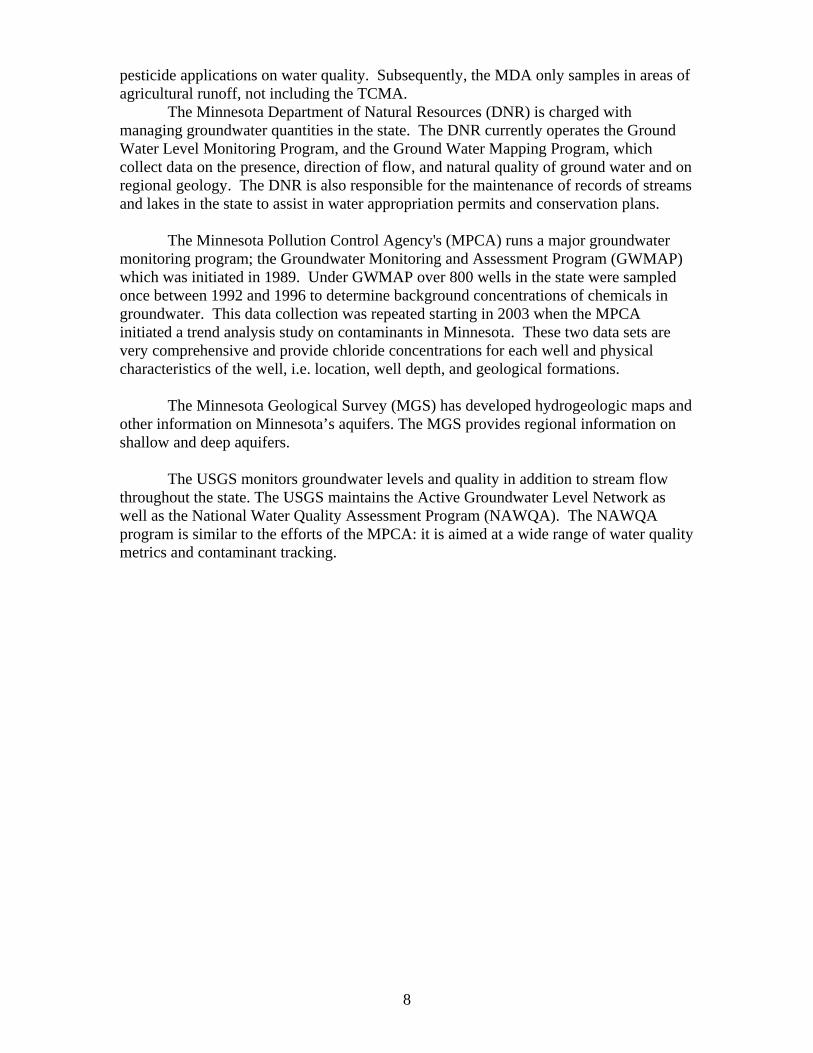
2.2 MAJOR AQUIFERS IN MINNESOTA AND THE TCMA
A schematic geological profile in the Twin cities Metropolitan Area (TCMA) is shown in Figure 2.1. In addition to shallow unconfined aquifers with water tables as shallow as 1 to 2 m below groundlevel (e.g. in the Vermillion River basin near Farmington) there are several confined aquifers in the TCMA, some of which are used for municipal water supplies.
Figure 2.1 Schematic geological stratigraphic profile in the Twin Cities Metropolitan Area.
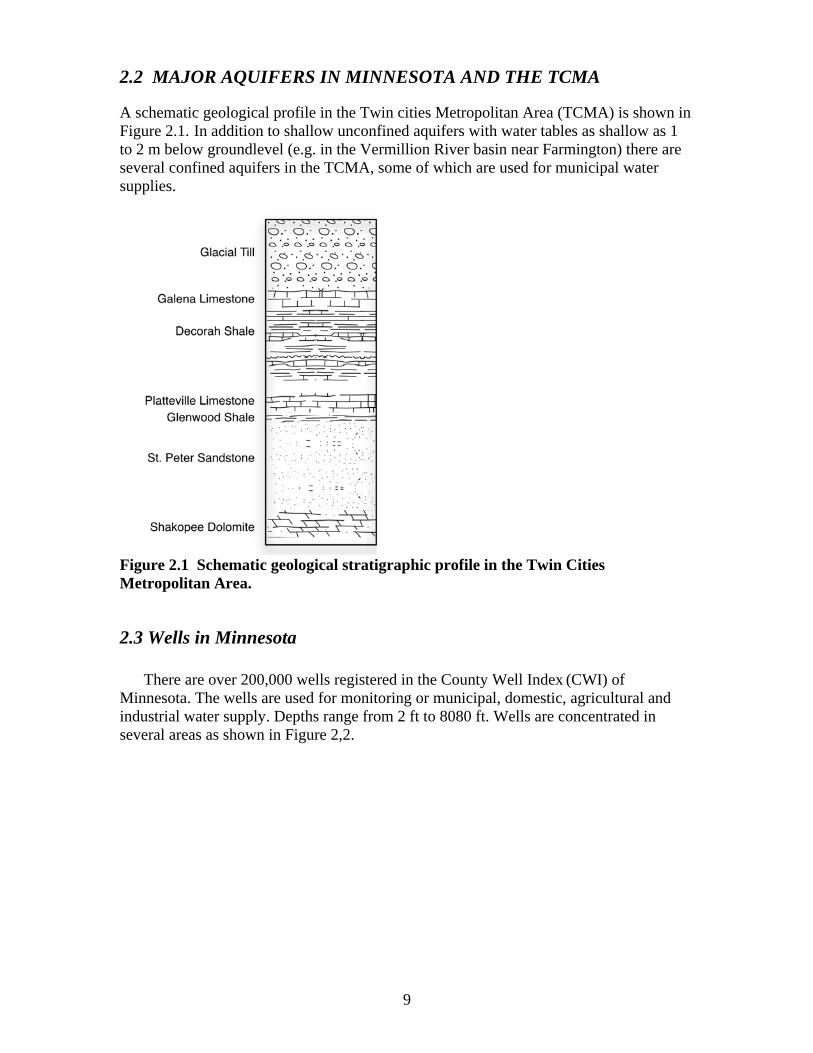
2.3 Wells in Minnesota There are over 200,000 wells registered in the County Well Index (CWI) of
Minnesota. The wells are used for monitoring or municipal, domestic, agricultural and industrial water supply. Depths range from 2 ft to 8080 ft. Wells are concentrated in several areas as shown in Figure 2,2.
10
Figure 2.2 Well locations in Minnesota
3. ROAD SALT USE
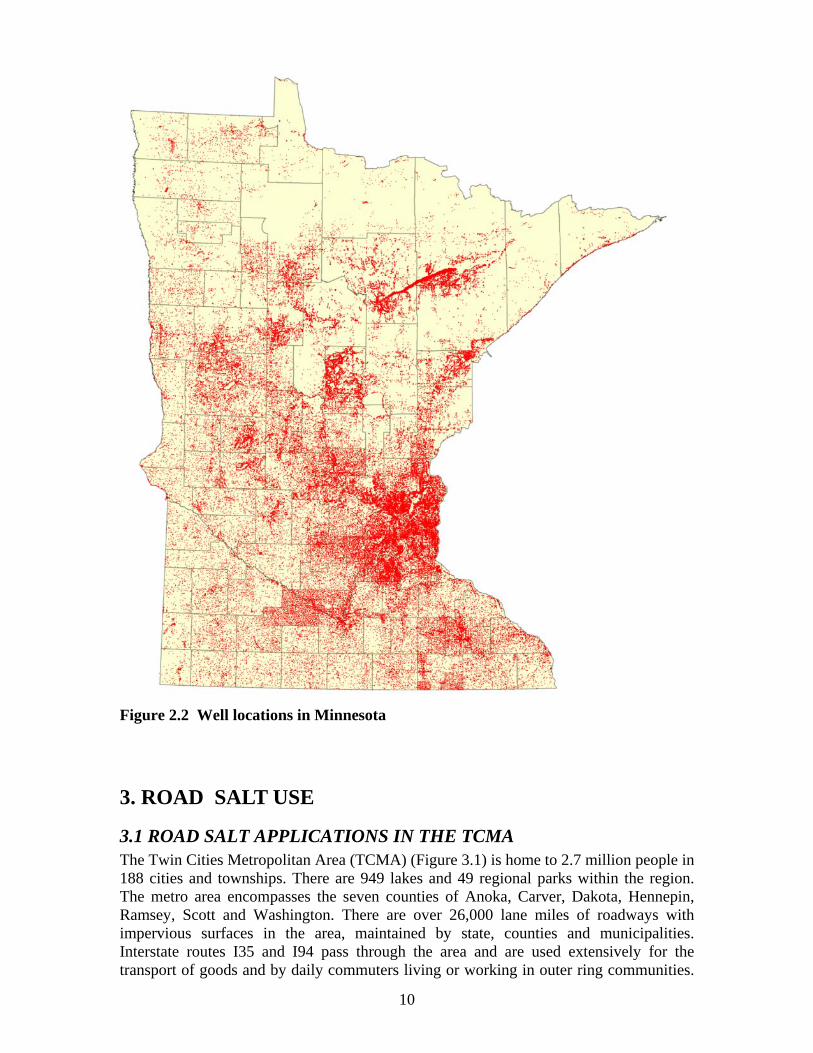
3.1 ROAD SALT APPLICATIONS IN THE TCMA The Twin Cities Metropolitan Area (TCMA) (Figure 3.1) is home to 2.7 million people in 188 cities and townships. There are 949 lakes and 49 regional parks within the region. The metro area encompasses the seven counties of Anoka, Carver, Dakota, Hennepin, Ramsey, Scott and Washington. There are over 26,000 lane miles of roadways with impervious surfaces in the area, maintained by state, counties and municipalities. Interstate routes I35 and I94 pass through the area and are used extensively for the transport of goods and by daily commuters living or working in outer ring communities.
11
Since the TCMA lies within the snow belt of North America, winter travel is a safety and economic concern for citizens and government officials. Nearly 12 million dollars are spent annually to purchase road deicing products, mostly NaCl, by public agencies in Minnesota. This does not include costs associated with equipment or personnel for the spreading of road deicers.
Figure 3.1 Map of the Twin Cities Metropolitan Area. (Metropolitan Council)
In the TCMA, road salt is used by transportation departments representing state
agencies, counties and cities. The Minnesota Department of Transportation (MnDOT) purchases salt through a state bidding program managed by the Materials Management Division (MMD). Counties and cities take advantage of this state program. Amounts of road salt purchased by MMD were a starting point for determining the total NaCl use in the TCMA.
12
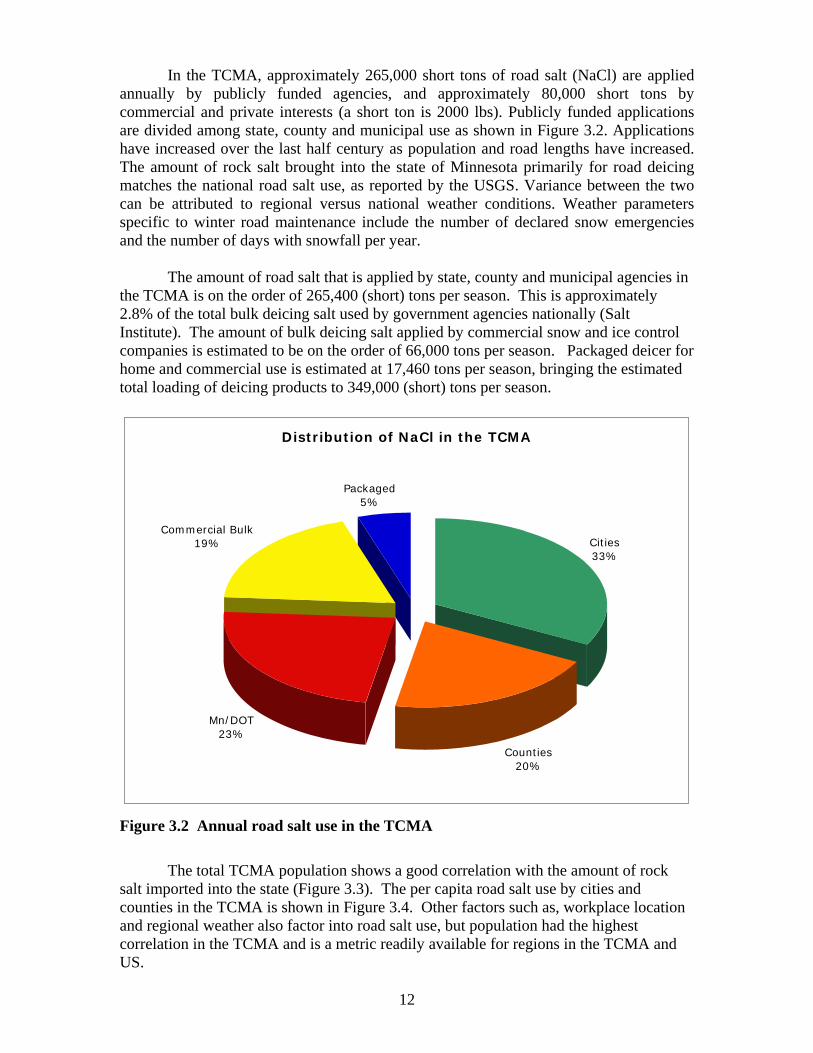
In the TCMA, approximately 265,000 short tons of road salt (NaCl) are applied annually by publicly funded agencies, and approximately 80,000 short tons by commercial and private interests (a short ton is 2000 lbs). Publicly funded applications are divided among state, county and municipal use as shown in Figure 3.2. Applications have increased over the last half century as population and road lengths have increased. The amount of rock salt brought into the state of Minnesota primarily for road deicing matches the national road salt use, as reported by the USGS. Variance between the two can be attributed to regional versus national weather conditions. Weather parameters specific to winter road maintenance include the number of declared snow emergencies and the number of days with snowfall per year.
The amount of road salt that is applied by state, county and municipal agencies in the TCMA is on the order of 265,400 (short) tons per season. This is approximately 2.8% of the total bulk deicing salt used by government agencies nationally (Salt Institute). The amount of bulk deicing salt applied by commercial snow and ice control companies is estimated to be on the order of 66,000 tons per season. Packaged deicer for home and commercial use is estimated at 17,460 tons per season, bringing the estimated total loading of deicing products to 349,000 (short) tons per season.
Distribution of NaCl in the TCMA
Cities33%
Counties20%
Mn/DOT23%
Commercial Bulk19%
Packaged5%
Figure 3.2 Annual road salt use in the TCMA
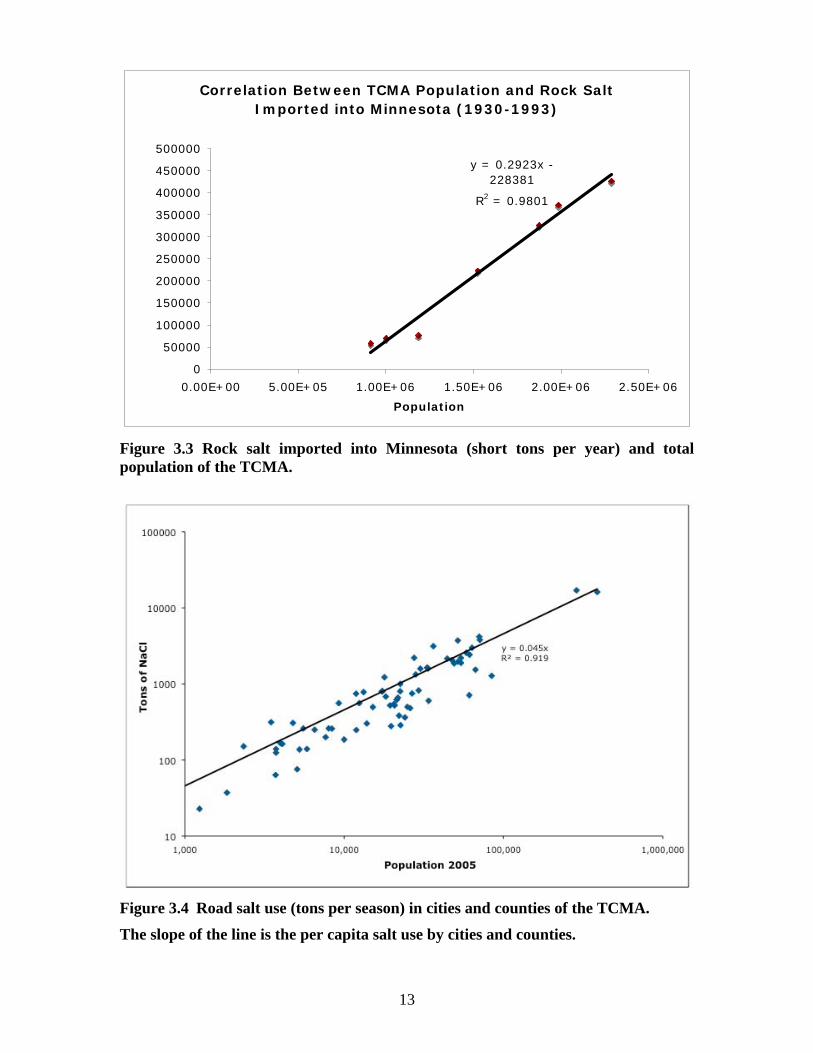
The total TCMA population shows a good correlation with the amount of rock salt imported into the state (Figure 3.3). The per capita road salt use by cities and counties in the TCMA is shown in Figure 3.4. Other factors such as, workplace location and regional weather also factor into road salt use, but population had the highest correlation in the TCMA and is a metric readily available for regions in the TCMA and US.
13
Correlation Between TCMA Population and Rock Salt Imported into Minnesota (1930-1993)
y = 0.2923x - 228381
R2 = 0.9801
0
50000
100000
150000
200000
250000
300000
350000
400000
450000
500000
0.00E+00 5.00E+05 1.00E+06 1.50E+06 2.00E+06 2.50E+06
Population
Figure 3.3 Rock salt imported into Minnesota (short tons per year) and total population of the TCMA.
Figure 3.4 Road salt use (tons per season) in cities and counties of the TCMA.
The slope of the line is the per capita salt use by cities and counties.
14
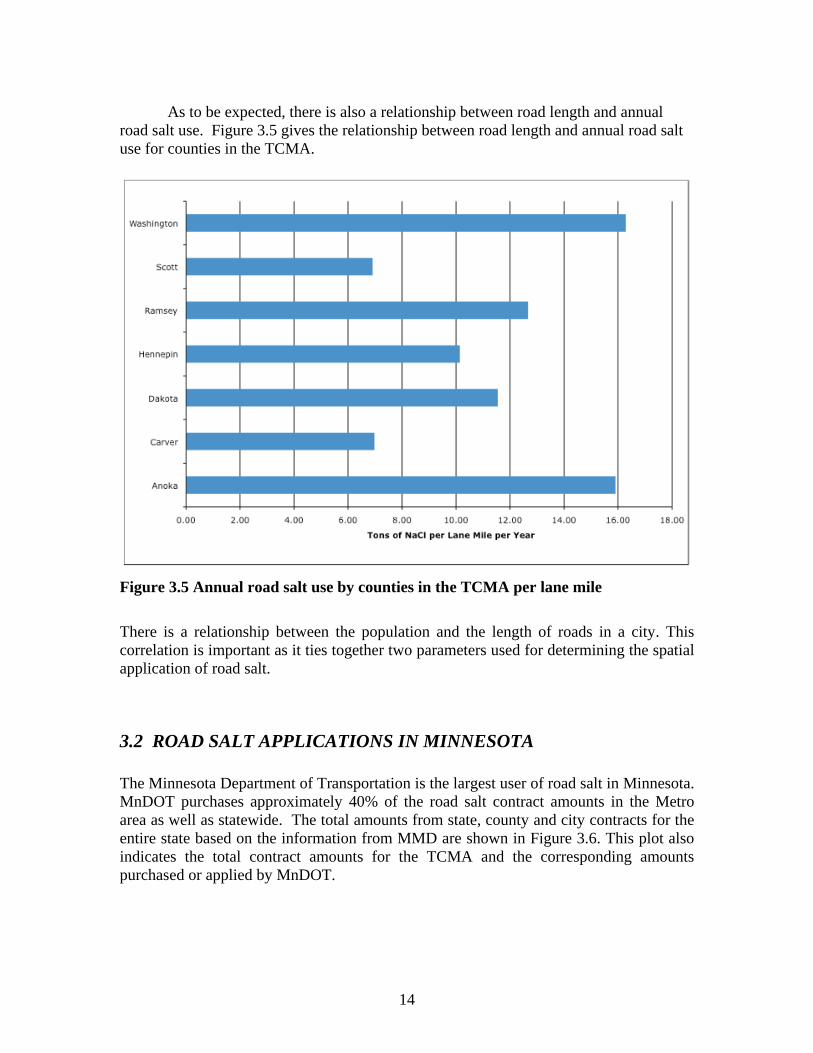
As to be expected, there is also a relationship between road length and annual
road salt use. Figure 3.5 gives the relationship between road length and annual road salt use for counties in the TCMA.
Figure 3.5 Annual road salt use by counties in the TCMA per lane mile
There is a relationship between the population and the length of roads in a city. This correlation is important as it ties together two parameters used for determining the spatial application of road salt.
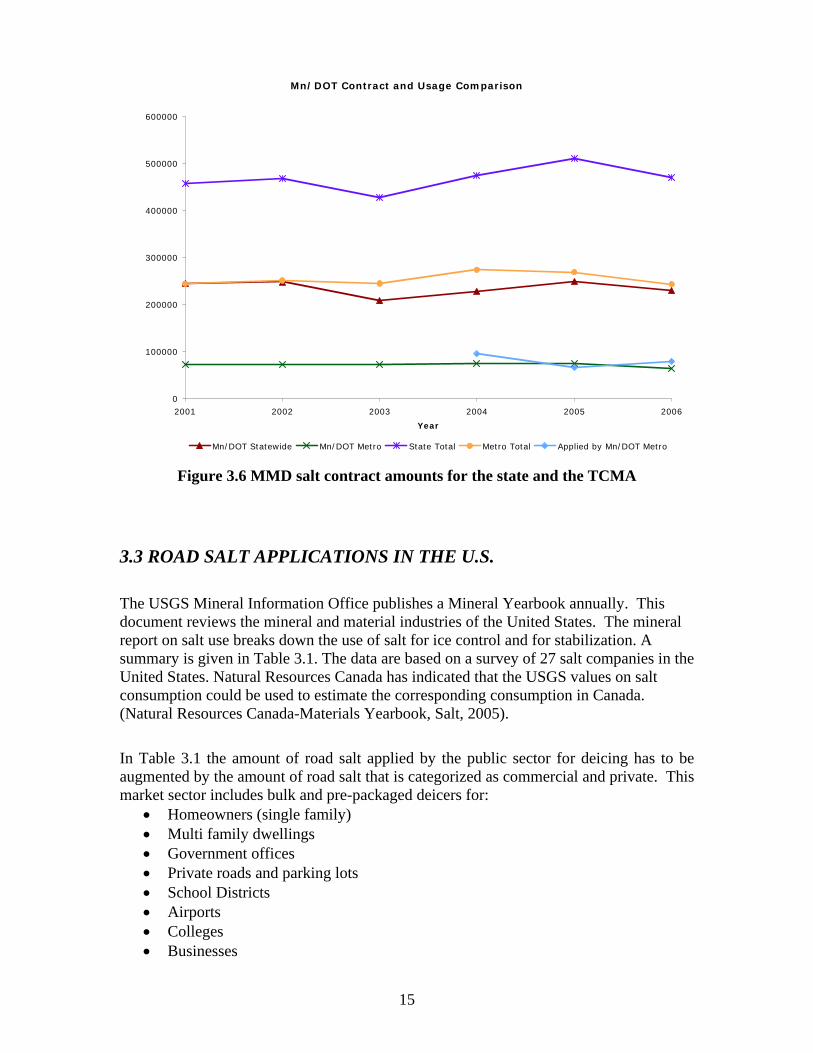
3.2 ROAD SALT APPLICATIONS IN MINNESOTA The Minnesota Department of Transportation is the largest user of road salt in Minnesota. MnDOT purchases approximately 40% of the road salt contract amounts in the Metro area as well as statewide. The total amounts from state, county and city contracts for the entire state based on the information from MMD are shown in Figure 3.6. This plot also indicates the total contract amounts for the TCMA and the corresponding amounts purchased or applied by MnDOT.
15
Mn/DOT Contract and Usage Comparison
0
100000
200000
300000
400000
500000
600000
2001 2002 2003 2004 2005 2006
Year
Mn/DOT Statewide Mn/DOT Metro State Total Metro Total Applied by Mn/DOT Metro
Figure 3.6 MMD salt contract amounts for the state and the TCMA
3.3 ROAD SALT APPLICATIONS IN THE U.S.
The USGS Mineral Information Office publishes a Mineral Yearbook annually. This document reviews the mineral and material industries of the United States. The mineral report on salt use breaks down the use of salt for ice control and for stabilization. A summary is given in Table 3.1. The data are based on a survey of 27 salt companies in the United States. Natural Resources Canada has indicated that the USGS values on salt consumption could be used to estimate the corresponding consumption in Canada. (Natural Resources Canada-Materials Yearbook, Salt, 2005).
In Table 3.1 the amount of road salt applied by the public sector for deicing has to be augmented by the amount of road salt that is categorized as commercial and private. This market sector includes bulk and pre-packaged deicers for:
Homeowners (single family) Multi family dwellings Government offices Private roads and parking lots School Districts Airports Colleges Businesses
16
Table 3.1 Government and commercial use of road salt (metric tons per season) in the U.S. (USGS)
Year Government
(Federal, State, Local) Commercial Total Percent Commercial
1993 12,700,000 896,000 13,596,000 7
1994 15,000,000 1,430,000 16,430,000 9
1995 11,800,000 1,030,000 12,830,000 8
1996 15,300,000 2,400,000 17,700,000 14
1997 13,100,000 1,900,000 15,000,000 13
1998 8,690,000 794,000 9,484,000 8
1999 13,500,000 1,820,000 15,320,000 12
2000 17,400,000 2,370,000 19,770,000 12
2001 14,800,000 2,030,000 16,830,000 12
2002 11,600,000 1,730,000 13,330,000 13
2003 16,200,000 2,320,000 18,520,000 13
2004 15,600,000 2,380,000 17,980,000 13
2005 18,200,000 2,740,000 20,940,000 13
3.4 TRENDS IN ROAD SALT USE
3.4.1 Trends in the TCMA
Percent Change in Salt Usage (based on average)
0.000
20.000
40.000
60.000
80.000
100.000
120.000
140.000
160.000
1988 1990 1992 1994 1996 1998 2000 2002 2004 2006
Year
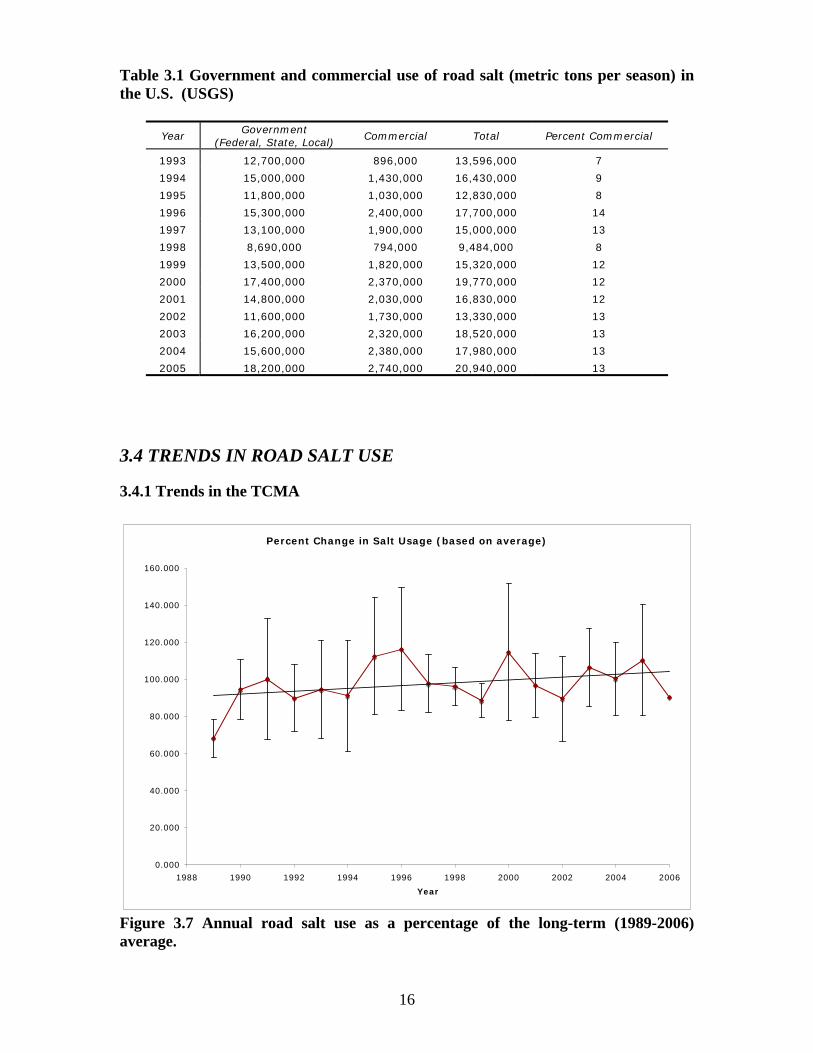
Figure 3.7 Annual road salt use as a percentage of the long-term (1989-2006) average.
17
The data provided by public agencies were used to determine a trend in salt use in the TCMA. (Figure 3.7). In this plot, yearly salt use was compared to an average use by each agency. These values were then averaged to obtain the values in the chart. According to Figure 3.7 the amount of salt used each year by the public sector has risen only slightly over the last decade and a half. Long-term salt use trends in the TCMA are correlated with population or road mile increases, while short-term variations follow weather patterns, e.g. how many days of snowfall occur in a season.
3.4.2 Trends in Minnesota and the U.S.
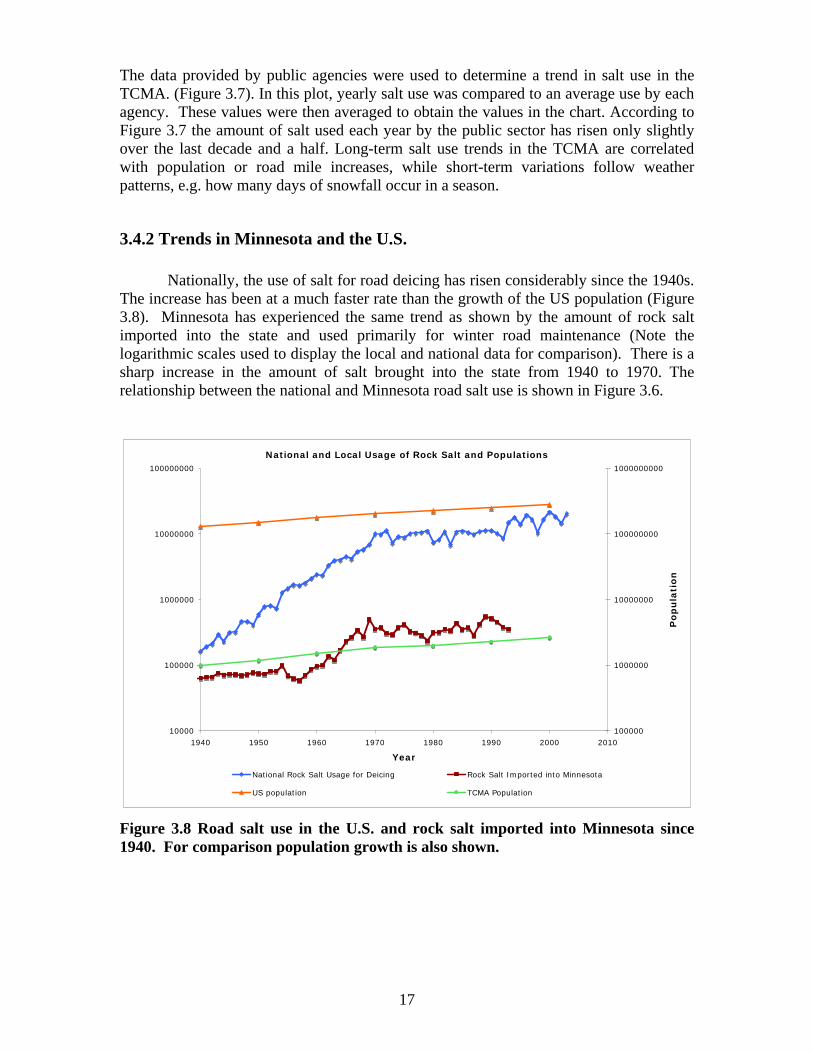
Nationally, the use of salt for road deicing has risen considerably since the 1940s. The increase has been at a much faster rate than the growth of the US population (Figure 3.8). Minnesota has experienced the same trend as shown by the amount of rock salt imported into the state and used primarily for winter road maintenance (Note the logarithmic scales used to display the local and national data for comparison). There is a sharp increase in the amount of salt brought into the state from 1940 to 1970. The relationship between the national and Minnesota road salt use is shown in Figure 3.6.
National and Local Usage of Rock Salt and Populations
10000
100000
1000000
10000000
100000000
1940 1950 1960 1970 1980 1990 2000 2010
Year
100000
1000000
10000000
100000000
1000000000
Pop
ula
tion
National Rock Salt Usage for Deicing Rock Salt Imported into Minnesota
US population TCMA Population
Figure 3.8 Road salt use in the U.S. and rock salt imported into Minnesota since 1940. For comparison population growth is also shown.
18
Correlation Between National Road Salt Usage and Rock Salt Imported into Minnesota
y = 0.0299x + 61912
R2 = 0.7974
0
100000
200000
300000
400000
500000
600000
0.00E+00 4.00E+06 8.00E+06 1.20E+07 1.60E+07
National Road Salt Usage (Tons)
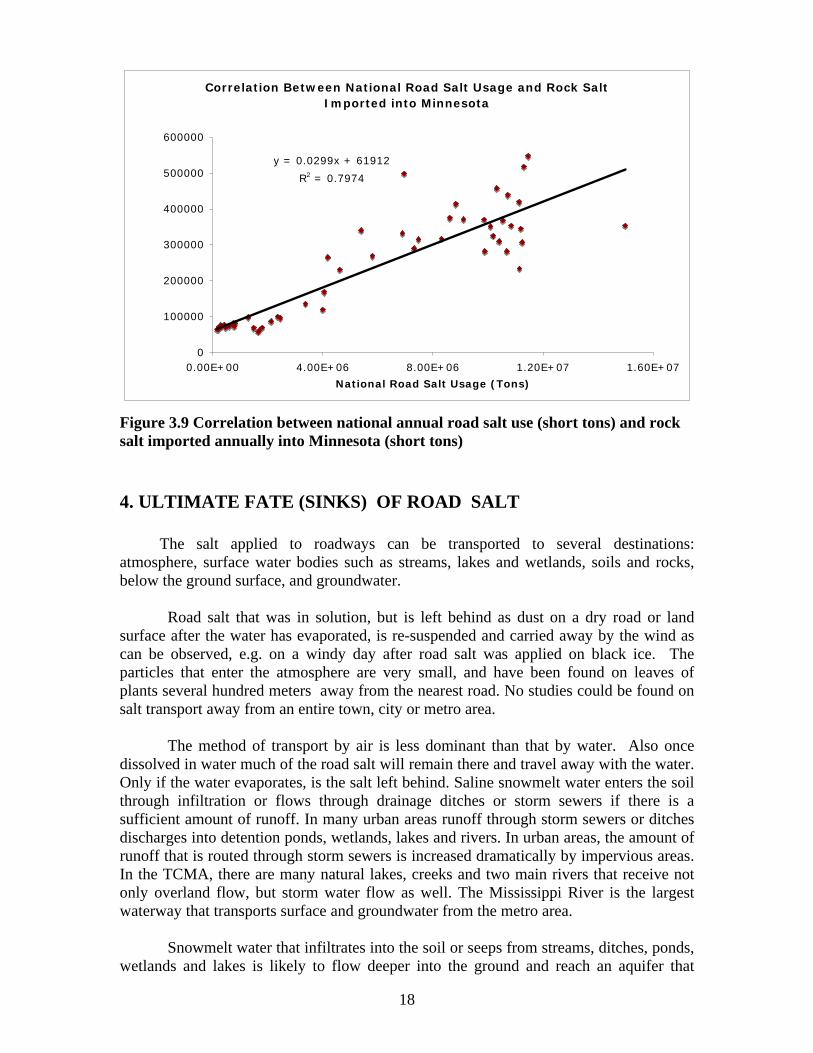
Figure 3.9 Correlation between national annual road salt use (short tons) and rock salt imported annually into Minnesota (short tons)
4. ULTIMATE FATE (SINKS) OF ROAD SALT
The salt applied to roadways can be transported to several destinations: atmosphere, surface water bodies such as streams, lakes and wetlands, soils and rocks, below the ground surface, and groundwater.
Road salt that was in solution, but is left behind as dust on a dry road or land
surface after the water has evaporated, is re-suspended and carried away by the wind as can be observed, e.g. on a windy day after road salt was applied on black ice. The particles that enter the atmosphere are very small, and have been found on leaves of plants several hundred meters away from the nearest road. No studies could be found on salt transport away from an entire town, city or metro area.
The method of transport by air is less dominant than that by water. Also once
dissolved in water much of the road salt will remain there and travel away with the water. Only if the water evaporates, is the salt left behind. Saline snowmelt water enters the soil through infiltration or flows through drainage ditches or storm sewers if there is a sufficient amount of runoff. In many urban areas runoff through storm sewers or ditches discharges into detention ponds, wetlands, lakes and rivers. In urban areas, the amount of runoff that is routed through storm sewers is increased dramatically by impervious areas. In the TCMA, there are many natural lakes, creeks and two main rivers that receive not only overland flow, but storm water flow as well. The Mississippi River is the largest waterway that transports surface and groundwater from the metro area.
Snowmelt water that infiltrates into the soil or seeps from streams, ditches, ponds,
wetlands and lakes is likely to flow deeper into the ground and reach an aquifer that
19
carries fresh groundwater. The salt in the snowmelt water will then become part of the groundwater. In this report we want examine if a relationship exists between groundwater salinity and road salt applications. The TCMA will be a geographic subset of this investigation.
5. GROUNDWATER DATA SOURCES AND METHODOLOGY
Many sources of information on groundwater quality in Minnesota and the TCMA were consulted: MPCA, Minnesota Department of Health (MDH), Minnesota Geological Survey, US Geological Survey and the water departments of several municipalities. Statewide groundwater quality surveys by the MPCA from 1992 to 1996 and from 2003 to 2006 provided the largest amount of data. Using the data sets from the MPCA, USGS and the MDH, snapshots of chloride concentrations in time give the spatial distribution throughout the state and the effects of the following metrics:
land use proximity to road networks proximity to populous regions seasonal weather patterns Specifically two well data sets will be used: data from 1992-1996 and 2003-2006.
Studying two time periods can perhaps reveal changes of chloride concentrations in groundwater and the rates at which they occur. This information can be related to the above metrics.
Long-term groundwater quality data (1940-present) do not seem to be available for the TCMA region or the state of Minnesota. Instead, data from Environment Canada assessment of road salt will be examined for comparisons with a metropolitan area (Toronto) in Canada. We will look for chloride concentration increases in groundwater due to winter maintenance practices in Canada.
6. CHLORIDE IN MINNESOTA GROUNDWATER
Long-term groundwater quality data on chloride concentrations do not seem to be available for the TCMA region or the state of Minnesota. A report by the MPCA (1978,1979) on highway deicing chemicals reviews adverse effects of chloride on biota. Statewide groundwater quality surveys by the MPCA from 1992 to 1996 and from 2003 to 2006 provided the largest amount of useful data. The former was part of the MPCA’s Ambient Ground Water Monitoring and Assessment program that sampled over 800 wells for the four year period. In 2003, the MPCA restarted its groundwater sampling program, concentrating on trend analysis of chloride and nitrate concentrations in wells primarily located in the TCMA, the Rochester and the St. Cloud area. In the fall of 2007, the MPCA published a document (MPCA 2007) which states that:
• Median chloride concentration for the period 1992-1996 was 4.9 mg/l
20
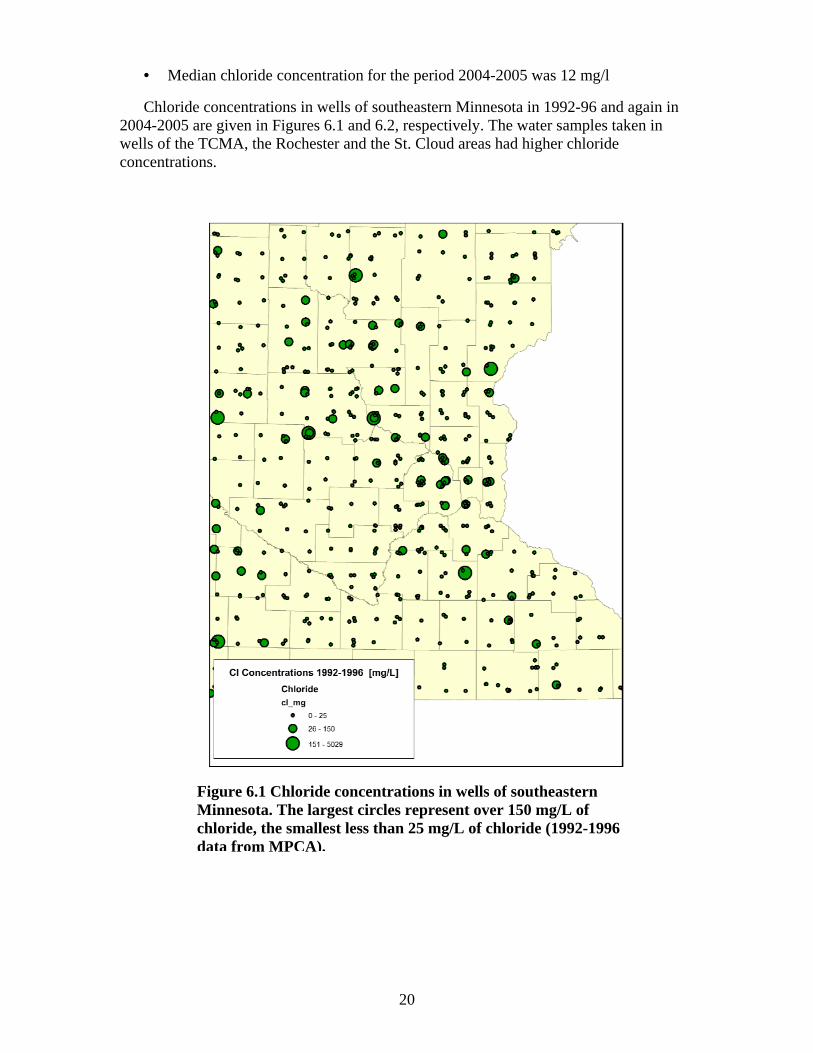
• Median chloride concentration for the period 2004-2005 was 12 mg/l
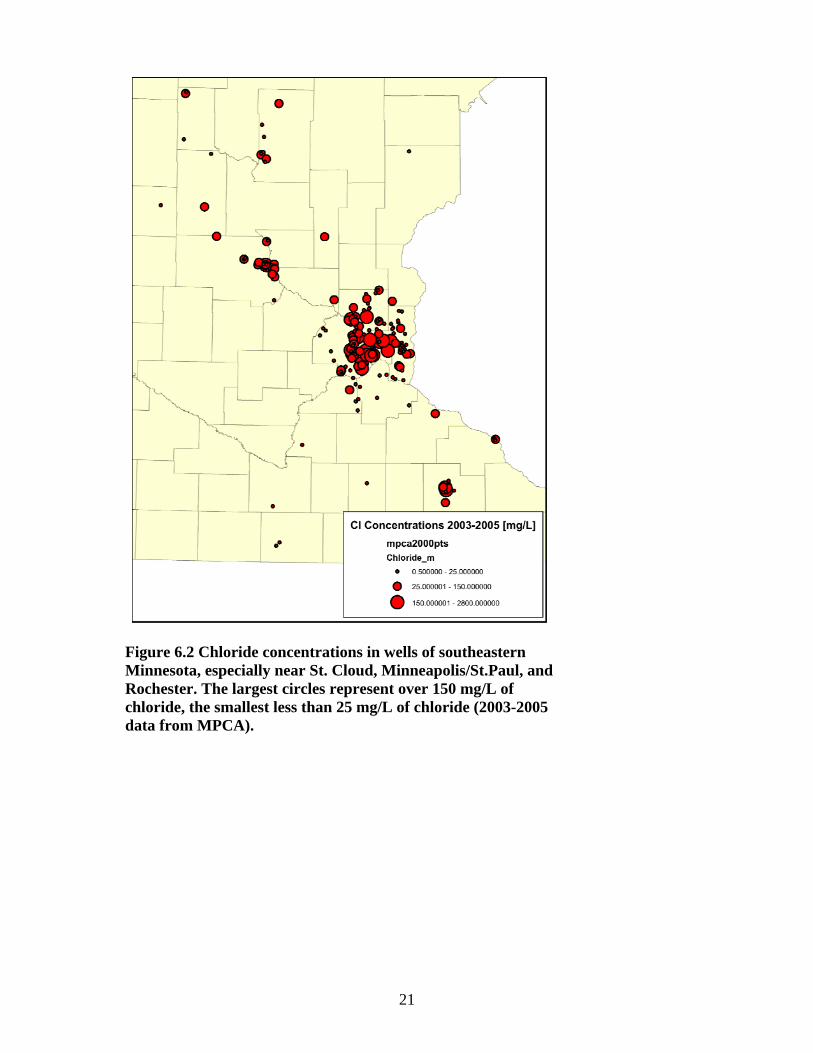
Chloride concentrations in wells of southeastern Minnesota in 1992-96 and again in 2004-2005 are given in Figures 6.1 and 6.2, respectively. The water samples taken in wells of the TCMA, the Rochester and the St. Cloud areas had higher chloride concentrations.
Figure 6.1 Chloride concentrations in wells of southeastern Minnesota. The largest circles represent over 150 mg/L of chloride, the smallest less than 25 mg/L of chloride (1992-1996 data from MPCA).
21
Figure 6.2 Chloride concentrations in wells of southeastern Minnesota, especially near St. Cloud, Minneapolis/St.Paul, and Rochester. The largest circles represent over 150 mg/L of chloride, the smallest less than 25 mg/L of chloride (2003-2005 data from MPCA).
22
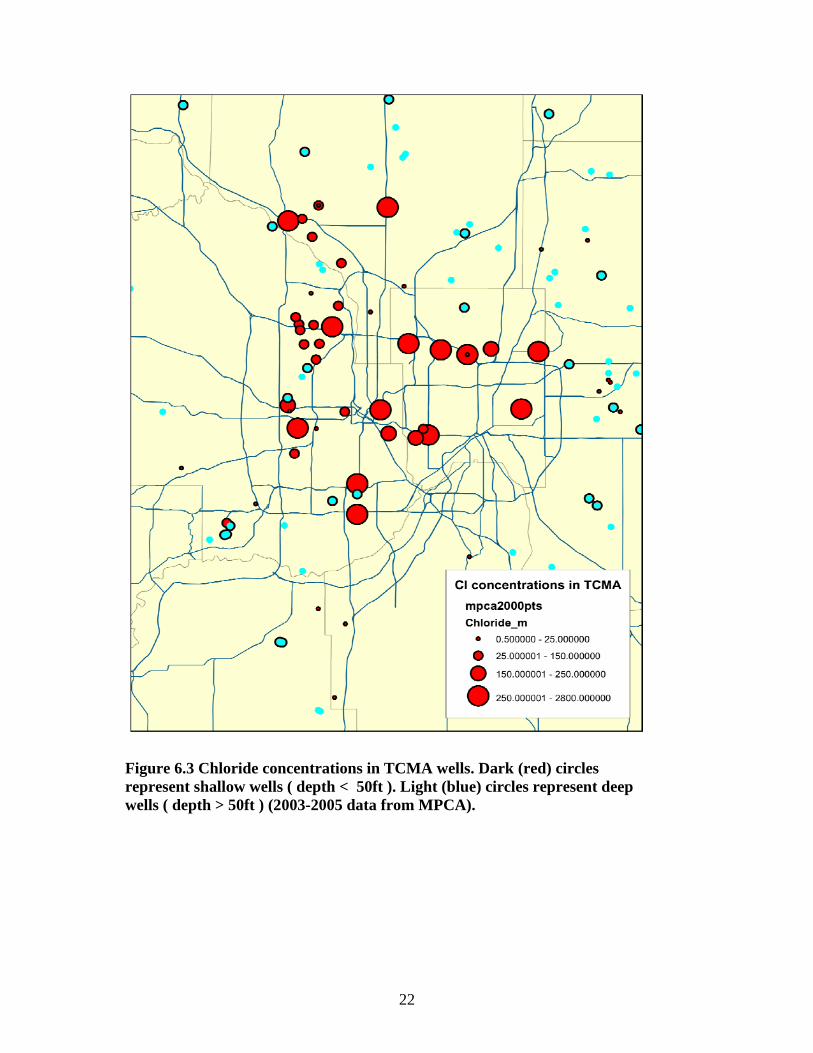
Figure 6.3 Chloride concentrations in TCMA wells. Dark (red) circles represent shallow wells ( depth < 50ft ). Light (blue) circles represent deep wells ( depth > 50ft ) (2003-2005 data from MPCA).
23
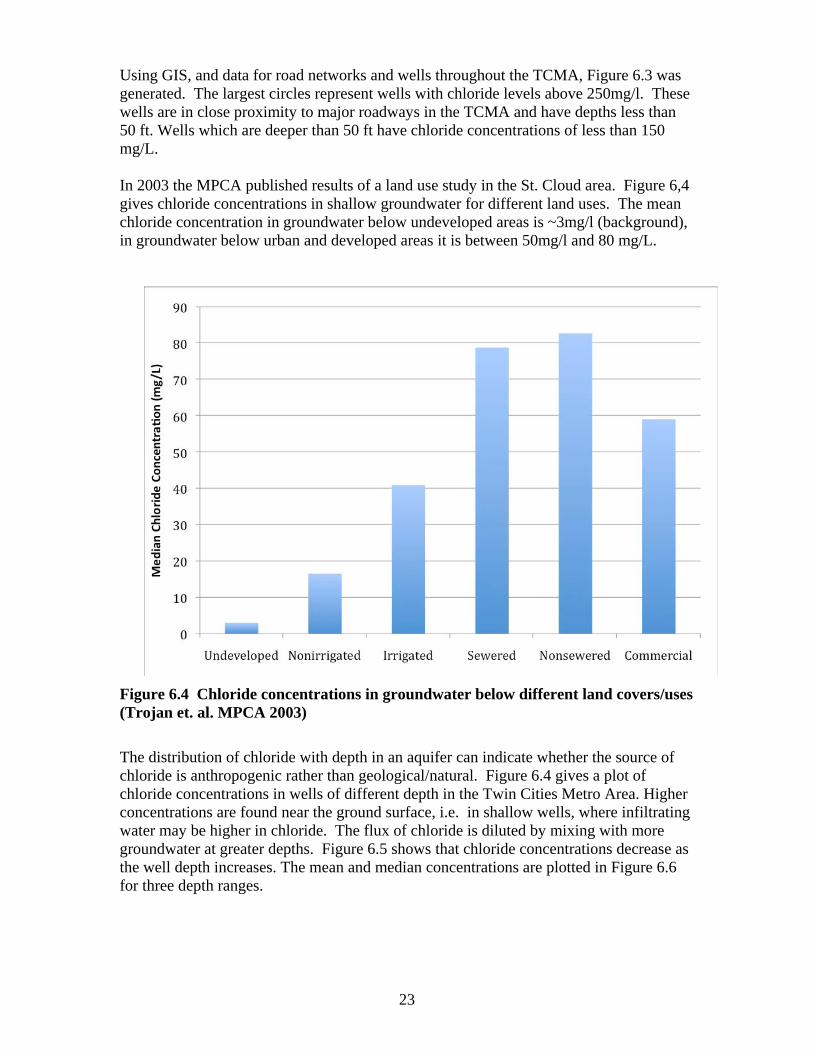
Using GIS, and data for road networks and wells throughout the TCMA, Figure 6.3 was generated. The largest circles represent wells with chloride levels above 250mg/l. These wells are in close proximity to major roadways in the TCMA and have depths less than 50 ft. Wells which are deeper than 50 ft have chloride concentrations of less than 150 mg/L. In 2003 the MPCA published results of a land use study in the St. Cloud area. Figure 6,4 gives chloride concentrations in shallow groundwater for different land uses. The mean chloride concentration in groundwater below undeveloped areas is ~3mg/l (background), in groundwater below urban and developed areas it is between 50mg/l and 80 mg/L.
Figure 6.4 Chloride concentrations in groundwater below different land covers/uses (Trojan et. al. MPCA 2003)
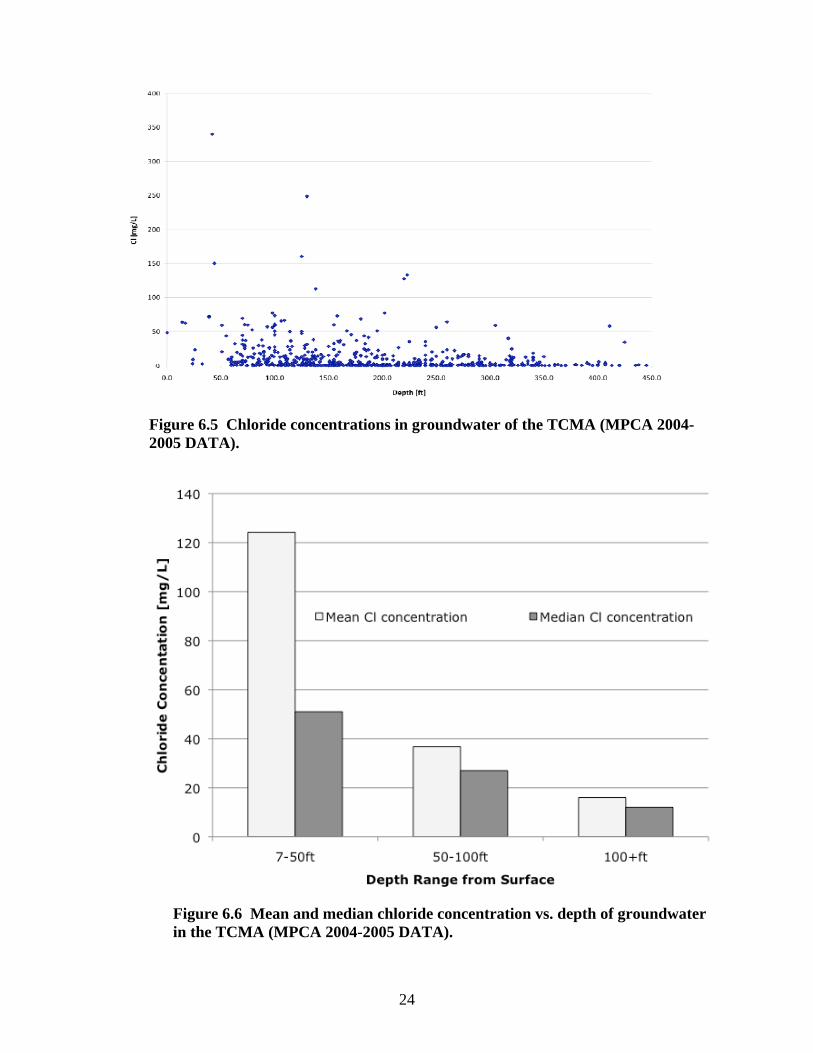
The distribution of chloride with depth in an aquifer can indicate whether the source of chloride is anthropogenic rather than geological/natural. Figure 6.4 gives a plot of chloride concentrations in wells of different depth in the Twin Cities Metro Area. Higher concentrations are found near the ground surface, i.e. in shallow wells, where infiltrating water may be higher in chloride. The flux of chloride is diluted by mixing with more groundwater at greater depths. Figure 6.5 shows that chloride concentrations decrease as the well depth increases. The mean and median concentrations are plotted in Figure 6.6 for three depth ranges.
24
Figure 6.5 Chloride concentrations in groundwater of the TCMA (MPCA 2004-2005 DATA).
Figure 6.6 Mean and median chloride concentration vs. depth of groundwater in the TCMA (MPCA 2004-2005 DATA).
25
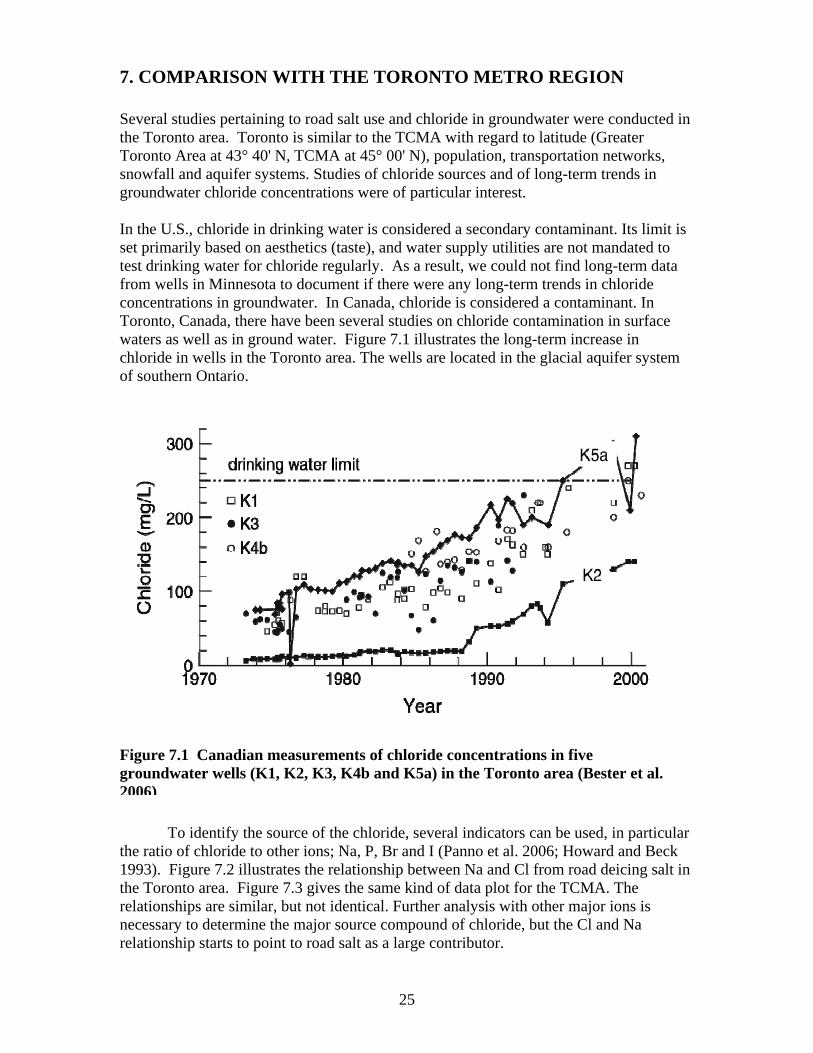
7. COMPARISON WITH THE TORONTO METRO REGION Several studies pertaining to road salt use and chloride in groundwater were conducted in the Toronto area. Toronto is similar to the TCMA with regard to latitude (Greater Toronto Area at 43° 40' N, TCMA at 45° 00' N), population, transportation networks, snowfall and aquifer systems. Studies of chloride sources and of long-term trends in groundwater chloride concentrations were of particular interest. In the U.S., chloride in drinking water is considered a secondary contaminant. Its limit is set primarily based on aesthetics (taste), and water supply utilities are not mandated to test drinking water for chloride regularly. As a result, we could not find long-term data from wells in Minnesota to document if there were any long-term trends in chloride concentrations in groundwater. In Canada, chloride is considered a contaminant. In Toronto, Canada, there have been several studies on chloride contamination in surface waters as well as in ground water. Figure 7.1 illustrates the long-term increase in chloride in wells in the Toronto area. The wells are located in the glacial aquifer system of southern Ontario.
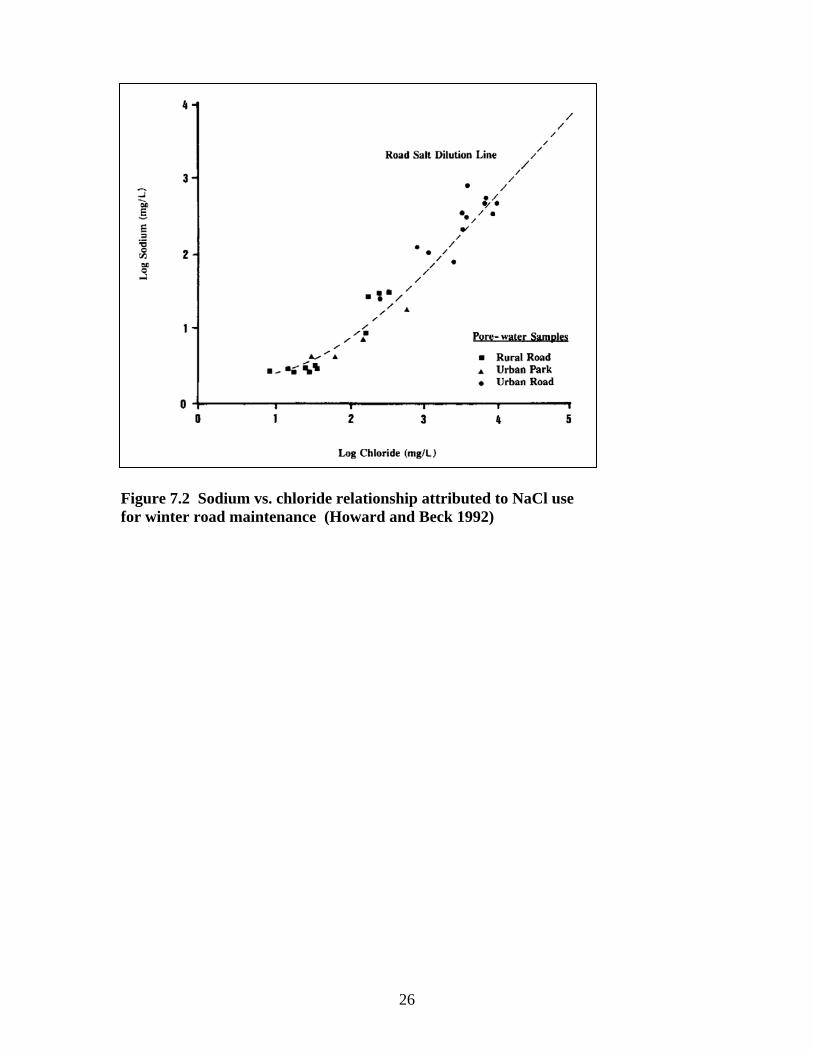
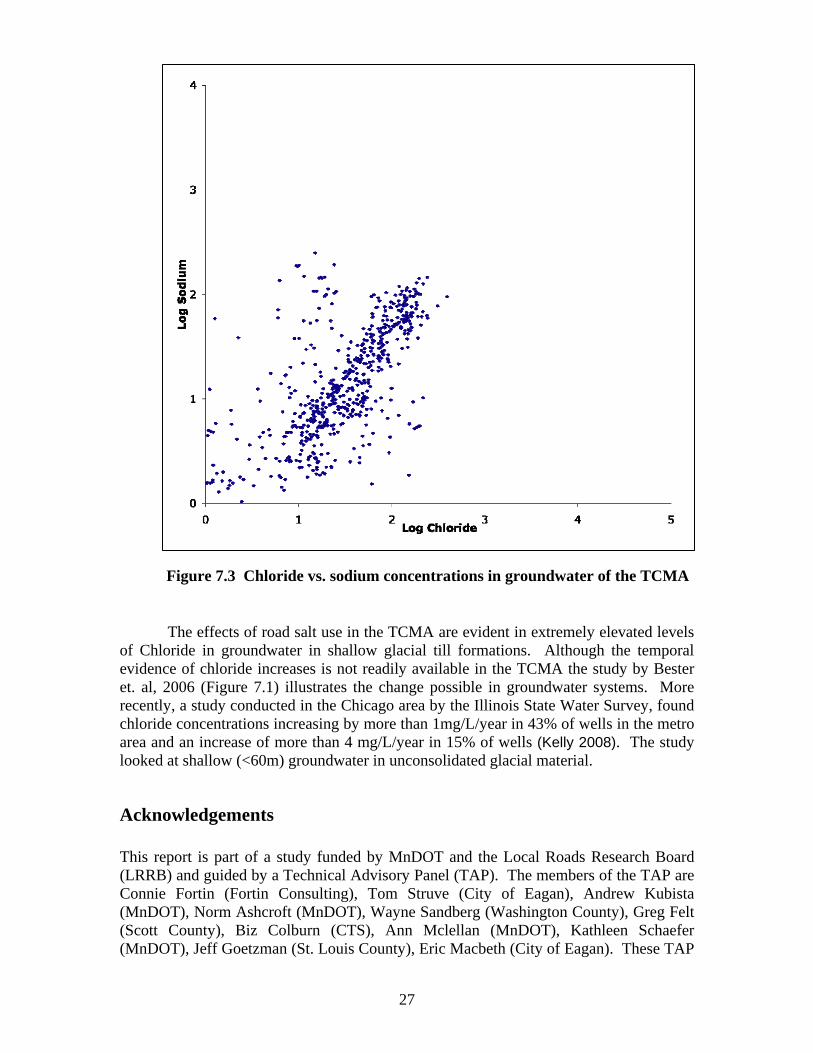
To identify the source of the chloride, several indicators can be used, in particular the ratio of chloride to other ions; Na, P, Br and I (Panno et al. 2006; Howard and Beck 1993). Figure 7.2 illustrates the relationship between Na and Cl from road deicing salt in the Toronto area. Figure 7.3 gives the same kind of data plot for the TCMA. The relationships are similar, but not identical. Further analysis with other major ions is necessary to determine the major source compound of chloride, but the Cl and Na relationship starts to point to road salt as a large contributor.
Figure 7.1 Canadian measurements of chloride concentrations in five groundwater wells (K1, K2, K3, K4b and K5a) in the Toronto area (Bester et al. 2006)
26
Figure 7.2 Sodium vs. chloride relationship attributed to NaCl use for winter road maintenance (Howard and Beck 1992)
27
The effects of road salt use in the TCMA are evident in extremely elevated levels of Chloride in groundwater in shallow glacial till formations. Although the temporal evidence of chloride increases is not readily available in the TCMA the study by Bester et. al, 2006 (Figure 7.1) illustrates the change possible in groundwater systems. More recently, a study conducted in the Chicago area by the Illinois State Water Survey, found chloride concentrations increasing by more than 1mg/L/year in 43% of wells in the metro area and an increase of more than 4 mg/L/year in 15% of wells (Kelly 2008). The study looked at shallow (<60m) groundwater in unconsolidated glacial material.
Acknowledgements This report is part of a study funded by MnDOT and the Local Roads Research Board (LRRB) and guided by a Technical Advisory Panel (TAP). The members of the TAP are Connie Fortin (Fortin Consulting), Tom Struve (City of Eagan), Andrew Kubista (MnDOT), Norm Ashcroft (MnDOT), Wayne Sandberg (Washington County), Greg Felt (Scott County), Biz Colburn (CTS), Ann Mclellan (MnDOT), Kathleen Schaefer (MnDOT), Jeff Goetzman (St. Louis County), Eric Macbeth (City of Eagan). These TAP
Figure 7.3 Chloride vs. sodium concentrations in groundwater of the TCMA
28
members represent a wide range of agencies within the TCMA with an interest in winter road maintenance and environmental protection. There were many people from the state, county and municipal levels that gave their time to provide information for this report. These are mostly winter maintenance supervisors and superintendents that have a great deal of first hand knowledge and experience dealing with the use of road salt in the TCMA. Jackie Finger and Aric Wilson at the MMD provided a great deal of help on state contracts and bid information. Mark Filipi at the Metropolitan Council along with Gene Hicks and Matthew Koukol at MnDOT provided information on road systems within the study region, along with GIS information gathered by Eric Novotny. Dennis Kostick at the USGS and Dick Hanneman at the Salt Institute provided information and insight on the use of road salt in different sectors. Valerie Hourdebaigt, with the Chemicals Sector at Environment Canada provided supporting documents for Environment Canada’s assessment of road salt effects. References Bester, M. L., E. O. Frind, J. W. Molson, and D. L. Rudolph. (2006). “Numerical Investigation of Road Salt Impact on an Urban Well Field”. Groundwater 44:165 - 175. Cheminfo Services Inc., 1999. Socio-Economic Background and Options Study on the Canadian Salt Industry, Report for Environment Canada - Regulatory and Economic Assessment Branch, Toronto, Ontario. Howard, K. W.F. and P.J. Beck. (1993). “Hydro-geochemical implications of groundwater contamination by road de-icing chemicals". Journal of Contaminant Hydrology. 12: 245-268. Kelly, W. R. (2008). “Long-Term Trends in Chloride Concentrations in Shallow Aquifers near Chicago”. Ground Water. 46(5) 772-781 Minnesota Pollution Control Agency (MPCA), 1978. “Highway De-Icing Chemicals” Package 1. January 1978, 125 pp. Minnesota Pollution Control Agency (MPCA), 1979. “Highway De-Icing Chemicals” Package 2. May 1978, pp. 51-72. Minnesota Pollution Control Agency (MPCA), 1979. “Highway De-Icing Chemicals” Package 3. March 1979, 13 pp. Minnesota Pollution Control Agency (MPCA), 2004. St. Cloud Report. Minnesota Pollution Control Agency (MPCA), 2006. Shingle Creek Chloride TMDL, Report, St. Paul, Minnesota. Morin, D. and M. Perchanok, 2000. Road Salt Loadings in Canada. Report for Environment Canada, CEPA Priority Substances List, Environmental Resource Group on
29
Road Salts. June 2000. Environment Canada, Commercial Chemicals Evaluation Branch. Hull, Quebec. Muntz, H., 2004. 67% Reduction in Road Chlorides on Caledon Roads achieved in 8 Years. Report submitted for 2003 Transportation Association of Canada’s Environmental Achievement Award. Caledon, Ontario.
Panno S. V., K.C. Hackley, H.H. Hwang, S. Greenberg, I.G. Krapac, S. Landsberger,
O’Kelly, D.J. (2006). “Characterization and Identification of Na- Cl Sources in Ground Water”. Ground Water 44(2): 176-187. The Salt Institute, 2006. Statistical Report of U.S. Salt Sales,.Direct communication with Salt Institute. Alexandria, Virginia. Transportation Association of Canada (TAC), 2003. Syntheses of Best Practices - Road Salt Management, Ottawa, Ontario. Trojan, Mike D., Jennifer S. Maloney, James M. Stockinger, Erin P. Eid, and Mark J. Lahtinen, 2003. Effects of Land Use of Ground Water Quality in the Anoka Sand Plain Aquifer of Minnesota, Ground Water, 41, pp. 482-492. United State Geological Survey (USGS) 2006, 1932-2005. Minerals Yearbook – Salt, Reston, Virginia. Williams, D.D., N.E. Williams and Yong Cao, 1999. Road Salt Contamination of Groundwater in a Major Metropolitan Area and Development of a Biological Index to Monitor its Impact. Water Research 34(1): 127-138. Web Resources Road Salt: Can we have Safe Roads and Healthy Streams? http://www.lakesuperiorstreams.org/understanding/impact_salt.html How Much Salt is a Problem? http://www.lakesuperiorstreams.org/understanding/impact_salt_2.html Deicing Salt Still on the Table (Scroll down to Minneapolis section) http://www.stormcon.com/sw_0106_deicing.html Special Investigation: Ditch 6 Water Quality http://www.anokanaturalresources.com/acd/tech_assist/monitoring/Special%20Study%2 -%20Ditch%206.pdf Minnesota Shade Tree Advisory Committee Monthly Meeting Minutes http://www.mnstac.org/WH/minutes/2006_Member_Minutes/1-19 06%20MtgMinutes1.doc
30
7th Annual Road Salt Symposium http://www.freshwater.org/programs/road-salt-symposium.html Analysis of Highway Storm Water Runoff Impacts to Potable Groundwater Aquifers http://www.dot.state.mn.us/metro/projects/stcroix/pdfs/sdeis/Tech%20Memos/Groundwater/Groundwater.pdf Detailed Assessment of Phosphorus Sources to Minnesota Watersheds – Deicing Agents http://proteus.pca.state.mn.us/publications/reports/pstudy-appendix-f.pdf Salt’s Lasting Impact http://www.snowbusiness.net/snowbusiness/data/articlestandard//snowbusiness/472007/474206/article.pdf Study of Environmental Effects of Deicing Salt on Water Quality in Minnesota http://rip.trb.org/browse/dproject.asp?n=13152

31