Embed Size (px)
Citation preview

October 2011 www.camsys.com
Potential Effects of the Panama Canal Expansion on the Texas Transportation System
prepared for
Texas Department of Transportation
prepared by
Cambridge Systematics, Inc.
with
Center for Transportation Research – University of Texas
final
report

final report
Potential Effects of the Panama Canal Expansion on the Texas Transportation System
prepared for
Texas Department of Transportation
prepared by
Cambridge Systematics, Inc. 9015 Mountain Ridge Drive, Suite 210 Austin, TX 78759
with
Center for Transportation Research – University of Texas
date
October 2011


Potential Effects of the Panama Canal Expansion on the Texas Transportation System
Cambridge Systematics, Inc. i 8119-020
Table of Contents
1.0 Summary ................................................................................................................. 1
2.0 Introduction ............................................................................................................ 1
3.0 Panama Canal Overview and Background ....................................................... 1
3.1 Demand ........................................................................................................... 1
3.2 Pricing ............................................................................................................. 4
4.0 Potential Impacts on the Texas Transportation System ................................. 1
4.1 Trade with Asia .............................................................................................. 1
4.2 Panama Canal Routes Post 2014 .................................................................. 6
4.3 Hub and Spoke, Direct Service, and Load Centers ................................... 7
4.4 Additional Texas Freight .............................................................................. 8
5.0 Capacity Enhancement Projects at Texas Ports ................................................ 1
5.1 Land Development Activities ...................................................................... 1
5.2 Landside Access Strategies and Activities ................................................. 8
6.0 Implications for Texas Transportation Stakeholders ..................................... 1

Potential Effects of the Panama Canal Expansion on the Texas Transportation System
Cambridge Systematics, Inc. iii
List of Tables
Table 4.1 Through Rate Cost Comparison – Import ............................................... 4
Table 4.2 Californian Ports vs. Panama Canal: A SWOT Analysis ...................... 5
Table 4.3 Top Commodities Transiting the Panama Canal by Tonnage .............. 9


Potential Effects of the Panama Canal Expansion on the Texas Transportation System
Cambridge Systematics, Inc. 1
List of Figures
Figure 3.1 Common Asia – U.S. Trade Routes .......................................................... 1
Figure 3.2 Panama Canal Tonnage, 2006 to 2015 ...................................................... 2
Figure 3.3 Panama Canal Total TEU, 2006 to 2015.................................................... 3
Figure 3.4 Panama Canal Transits: Total and by Key Ship Type ........................... 4
Figure 4.1 Planned Container Capacity at Asian and North American West Coast Ports ......................................................................................... 2
Figure 4.2 Panama Canal Competitive Markets, Post-2014 ..................................... 4
Figure 4.3 Historic Global Demand and Supply (1995 to 2008) and Predicted Demand and Supply (2009 to 2013) for the Container Sector ............................................................................................................. 7
Figure 4.4 Estimated Panama Canal Tonnage Originating or Terminating in Texas by Transit Direction, 2009 and 2025 ........................................ 10
Figure 5.1 Land Development Patterns near the Port of Beaumont ....................... 2
Figure 5.2 Completion of Orange County General Cargo Wharf ........................... 2
Figure 5.3 Land Development Patterns at the Port of Corpus Christi ................... 4
Figure 5.4 Land Development Patterns at the Port of Houston .............................. 6
Figure 5.5 Port of Orange Industrial Park .................................................................. 7
Figure 5.6 Land Development Patterns at the Port of Victoria ............................... 8
Figure 5.7 Port Access Improvement Activities ...................................................... 10

Potential Effects of the Panama Canal Expansion on the Texas Transportation System
Cambridge Systematics, Inc. 1
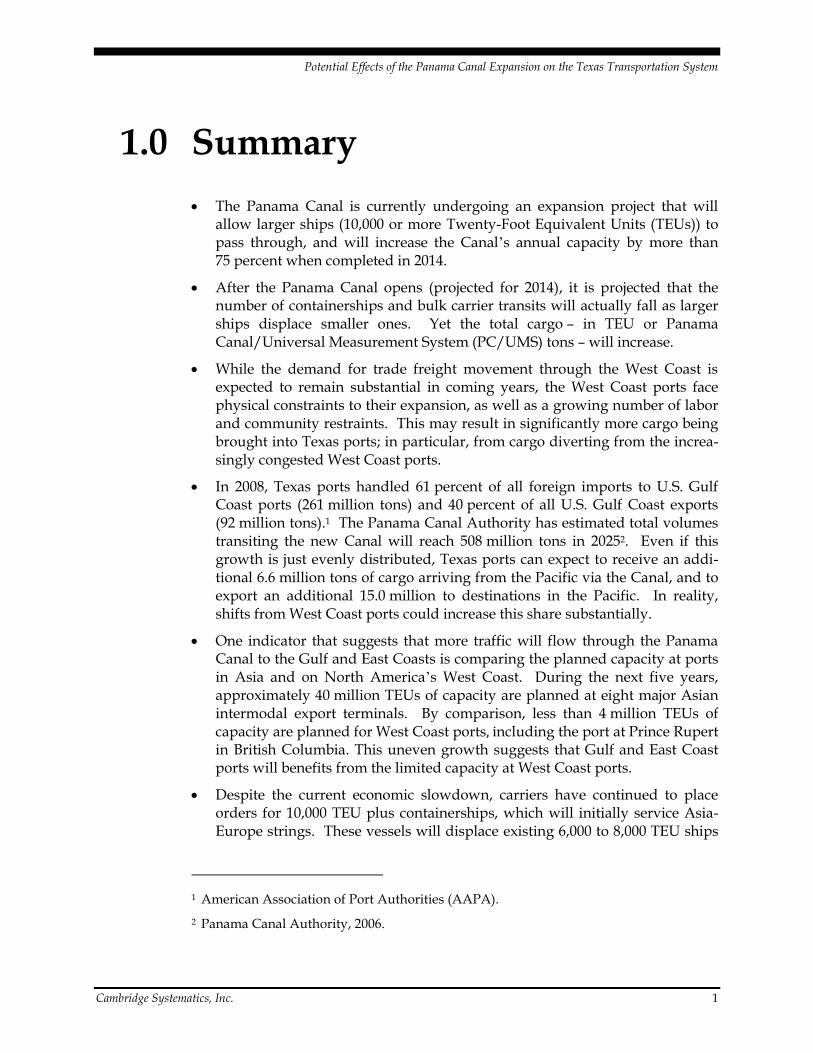
1.0 Summary
The Panama Canal is currently undergoing an expansion project that will allow larger ships (10,000 or more Twenty-Foot Equivalent Units (TEUs)) to pass through, and will increase the Canal’s annual capacity by more than 75 percent when completed in 2014.
After the Panama Canal opens (projected for 2014), it is projected that the number of containerships and bulk carrier transits will actually fall as larger ships displace smaller ones. Yet the total cargo – in TEU or Panama Canal/Universal Measurement System (PC/UMS) tons – will increase.
While the demand for trade freight movement through the West Coast is expected to remain substantial in coming years, the West Coast ports face physical constraints to their expansion, as well as a growing number of labor and community restraints. This may result in significantly more cargo being brought into Texas ports; in particular, from cargo diverting from the increa-singly congested West Coast ports.
In 2008, Texas ports handled 61 percent of all foreign imports to U.S. Gulf Coast ports (261 million tons) and 40 percent of all U.S. Gulf Coast exports (92 million tons).1 The Panama Canal Authority has estimated total volumes transiting the new Canal will reach 508 million tons in 20252. Even if this growth is just evenly distributed, Texas ports can expect to receive an addi-tional 6.6 million tons of cargo arriving from the Pacific via the Canal, and to export an additional 15.0 million to destinations in the Pacific. In reality, shifts from West Coast ports could increase this share substantially.
One indicator that suggests that more traffic will flow through the Panama Canal to the Gulf and East Coasts is comparing the planned capacity at ports in Asia and on North America’s West Coast. During the next five years, approximately 40 million TEUs of capacity are planned at eight major Asian intermodal export terminals. By comparison, less than 4 million TEUs of capacity are planned for West Coast ports, including the port at Prince Rupert in British Columbia. This uneven growth suggests that Gulf and East Coast ports will benefits from the limited capacity at West Coast ports.
Despite the current economic slowdown, carriers have continued to place orders for 10,000 TEU plus containerships, which will initially service Asia-Europe strings. These vessels will displace existing 6,000 to 8,000 TEU ships
1 American Association of Port Authorities (AAPA).
2 Panama Canal Authority, 2006.
Potential Effects of the Panama Canal Expansion on the Texas Transportation System
2 Cambridge Systematics, Inc.
will be relocated to routes served by the Canal, including Asia to the Gulf, South America, and South Atlantic ports.
The expansion is likely to have significant impacts on many Texas ports – some of which may develop feeder services connecting them to larger hubs. In advance of the Panama Canal’s expansion, some of Texas’ largest ports – including Port of Corpus Christi, Port of Galveston, and the Port of Houston – are undertaking major capacity enhancement projects to enhance their ability to attract a portion of the Canal’s new traffic.
Potential Effects of the Panama Canal Expansion on the Texas Transportation System
Cambridge Systematics, Inc. 1
2.0 Introduction
The Panama Canal is currently undergoing an expansion project that will allow larger ships to pass through and will increase the Canal’s annual capacity by more than 75 percent. The expansion is scheduled for completion in 2014 and, due to the importance of the Canal in global trade, the expansion is likely to have wide-ranging impacts.
This technical report is designed to help the Texas Department of Transportation (TxDOT) more fully understand the potential impacts that the Panama Canal expansion may have on the Texas transportation system and provide guidance on how best to address the associated infrastructure, operational, and policy issues in statewide planning activities. This report builds on previous efforts of the Department in understanding and addressing potential Panama Canal impacts, most notably the Impacts of the Panama Canal on Texas Ports and Highway Corridors (TxDOT Government and Public Affairs Division, 2006) and the Texas Waterborne Freight Corridor Study Phase I Final Report (TxDOT Transportation Planning and Programming Division, 2010).
The remaining sections of this report describe:
Panama Canal Overview and Background, including updated Canal pricing and fee information;
Potential Impacts on the Texas Transportation System due to increases in demand resulting from the Panama Canal expansion;
Capacity Enhancement Projects at Texas Ports, including land development and port access improvement activities; and
Implications for Texas Stakeholders, including the key impacts of the Panama Canal’s expansion on Texas and recommendations for TxDOT and Texas ports to take advantage of these changes.

Potential Effects of the Panama Canal Expansion on the Texas Transportation System
Cambridge Systematics, Inc. 1
3.0 Panama Canal Overview and Background
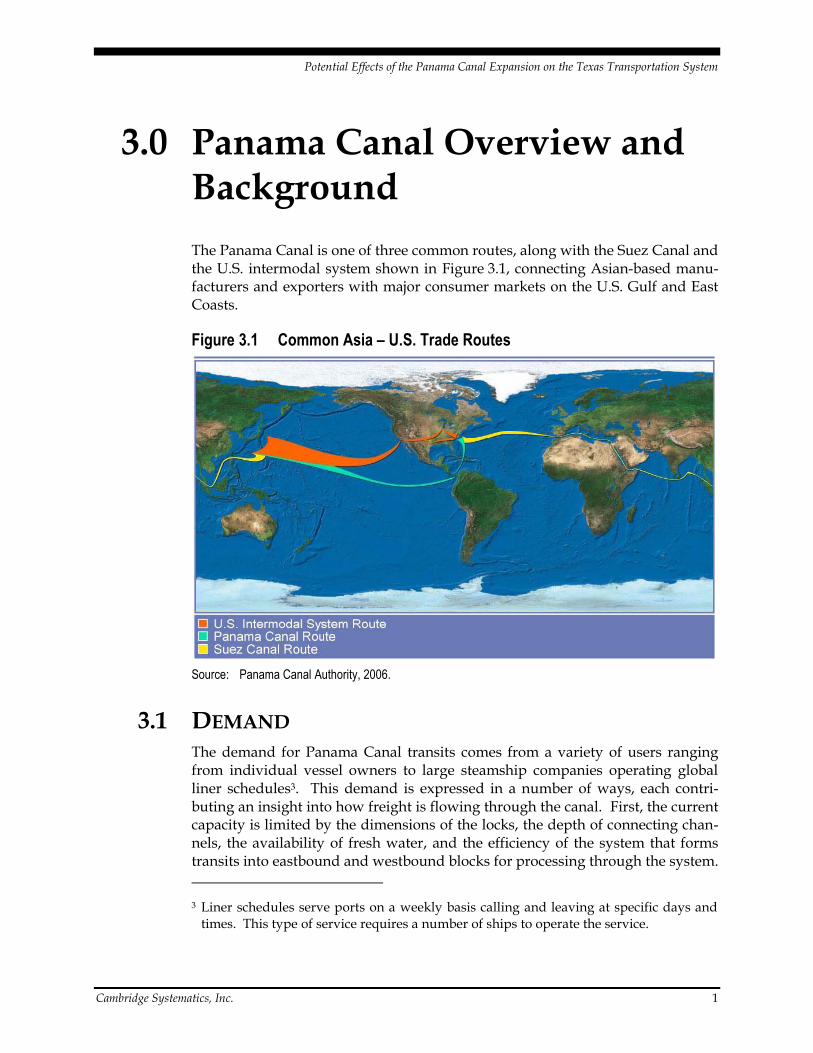
The Panama Canal is one of three common routes, along with the Suez Canal and the U.S. intermodal system shown in Figure 3.1, connecting Asian-based manu-facturers and exporters with major consumer markets on the U.S. Gulf and East Coasts.
Figure 3.1 Common Asia – U.S. Trade Routes
Source: Panama Canal Authority, 2006.
3.1 DEMAND The demand for Panama Canal transits comes from a variety of users ranging from individual vessel owners to large steamship companies operating global liner schedules3. This demand is expressed in a number of ways, each contri-buting an insight into how freight is flowing through the canal. First, the current capacity is limited by the dimensions of the locks, the depth of connecting chan-nels, the availability of fresh water, and the efficiency of the system that forms transits into eastbound and westbound blocks for processing through the system.
3 Liner schedules serve ports on a weekly basis calling and leaving at specific days and times. This type of service requires a number of ships to operate the service.
Potential Effects of the Panama Canal Expansion on the Texas Transportation System
2 Cambridge Systematics, Inc.
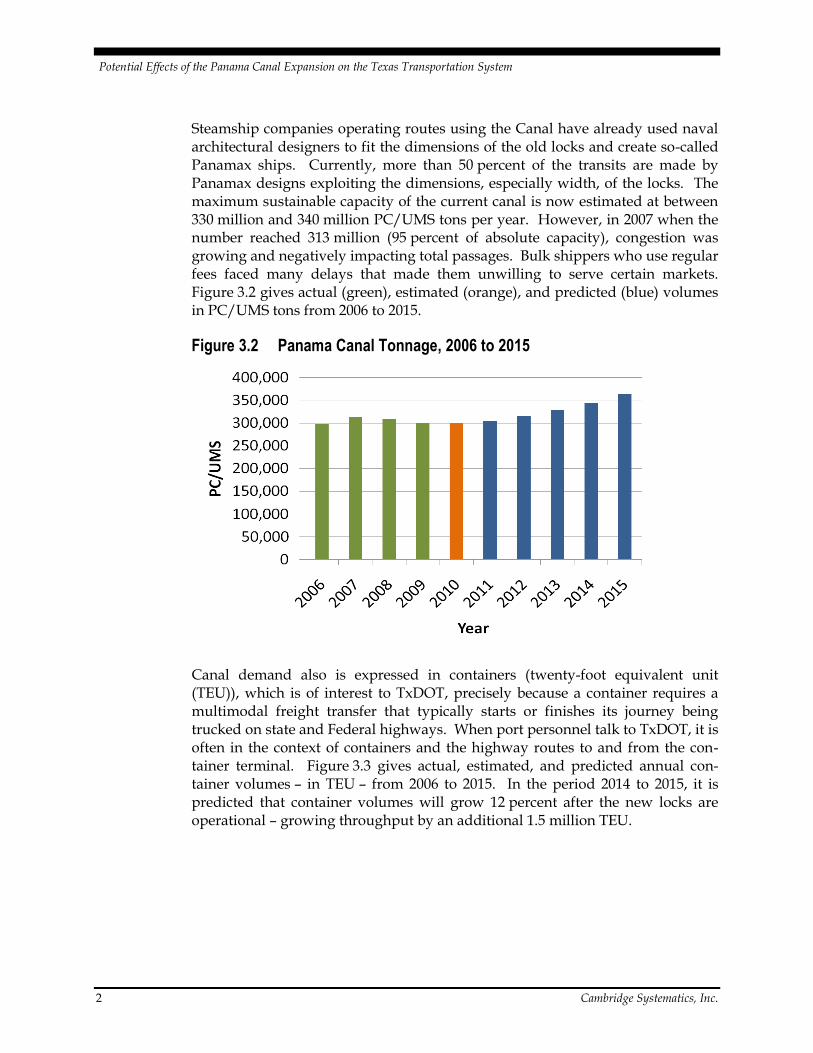
Steamship companies operating routes using the Canal have already used naval architectural designers to fit the dimensions of the old locks and create so-called Panamax ships. Currently, more than 50 percent of the transits are made by Panamax designs exploiting the dimensions, especially width, of the locks. The maximum sustainable capacity of the current canal is now estimated at between 330 million and 340 million PC/UMS tons per year. However, in 2007 when the number reached 313 million (95 percent of absolute capacity), congestion was growing and negatively impacting total passages. Bulk shippers who use regular fees faced many delays that made them unwilling to serve certain markets. Figure 3.2 gives actual (green), estimated (orange), and predicted (blue) volumes in PC/UMS tons from 2006 to 2015.
Figure 3.2 Panama Canal Tonnage, 2006 to 2015
Canal demand also is expressed in containers (twenty-foot equivalent unit (TEU)), which is of interest to TxDOT, precisely because a container requires a multimodal freight transfer that typically starts or finishes its journey being trucked on state and Federal highways. When port personnel talk to TxDOT, it is often in the context of containers and the highway routes to and from the con-tainer terminal. Figure 3.3 gives actual, estimated, and predicted annual con-tainer volumes – in TEU – from 2006 to 2015. In the period 2014 to 2015, it is predicted that container volumes will grow 12 percent after the new locks are operational – growing throughput by an additional 1.5 million TEU.

Potential Effects of the Panama Canal Expansion on the Texas Transportation System
Cambridge Systematics, Inc. 3
Figure 3.3 Panama Canal Total TEU, 2006 to 2015
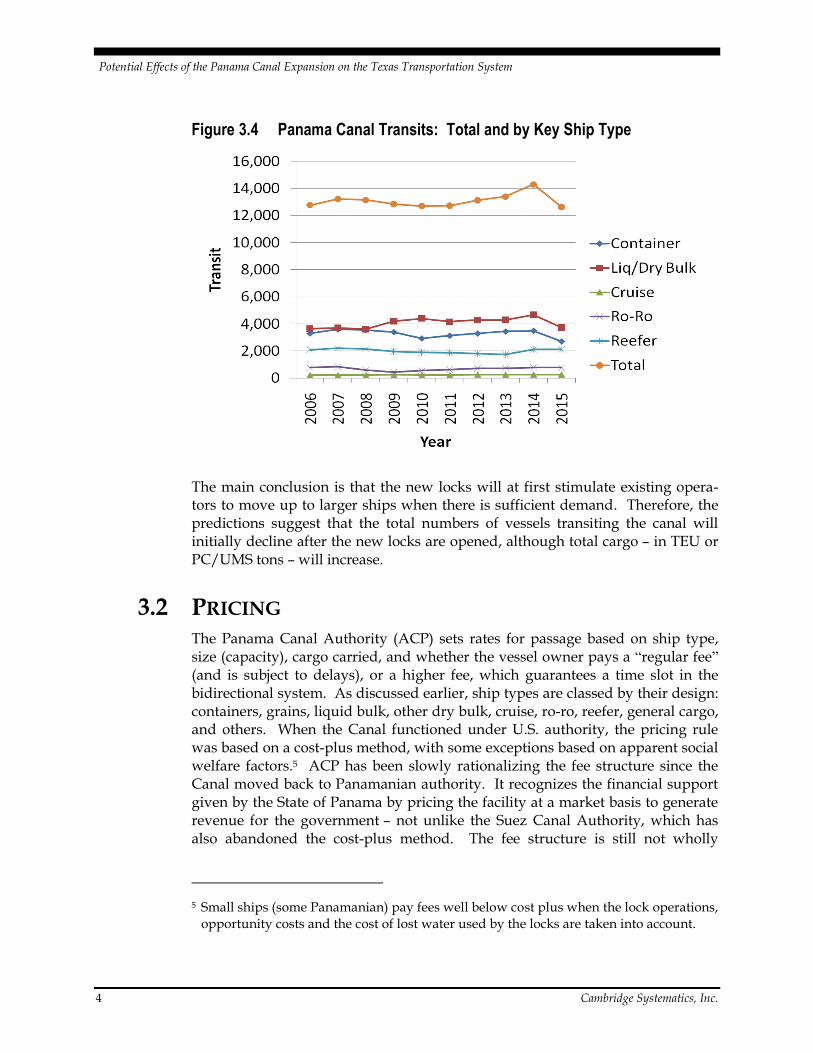
The third measure of demand is transits – the numbers of different ships using the canal in any one year. Figure 3.4 gives the key ship types for Texas Gulf ports: containerships, liquid and dry bulk carriers, cruise ships, and roll-on/roll-off (ro-ro) and reefer, together with the total transits during 2006 through 2015, using actual, estimated, and predicted values. First, cruise, ro-ro and reefer numbers remain fairly constant, though some larger cruise ships will use the new locks. Ro-ros and reefers are specialized ships and may not be quickly replaced,4 so their prediction numbers are modest. The number of containerships and bulk carrier transits actually falls, as larger ships are substituted for current smaller ones. Strong orders for the 10,000 TEU plus containership class now being deli-vered to steamship companies suggest that numbers of the displaced 6,000 to 8,000 TEU ships will be relocated to routes served by the Canal, including Asia to the Gulf, South America, and South Atlantic ports.
4 Perhaps they may not be replaced in any great numbers at all. There is much discussion on the future of dedicated refrigerated ships, given the wide variety of refrigerated containers now available on many routes.
Potential Effects of the Panama Canal Expansion on the Texas Transportation System
4 Cambridge Systematics, Inc.
Figure 3.4 Panama Canal Transits: Total and by Key Ship Type
The main conclusion is that the new locks will at first stimulate existing opera-tors to move up to larger ships when there is sufficient demand. Therefore, the predictions suggest that the total numbers of vessels transiting the canal will initially decline after the new locks are opened, although total cargo – in TEU or PC/UMS tons – will increase.
3.2 PRICING The Panama Canal Authority (ACP) sets rates for passage based on ship type, size (capacity), cargo carried, and whether the vessel owner pays a “regular fee” (and is subject to delays), or a higher fee, which guarantees a time slot in the bidirectional system. As discussed earlier, ship types are classed by their design: containers, grains, liquid bulk, other dry bulk, cruise, ro-ro, reefer, general cargo, and others. When the Canal functioned under U.S. authority, the pricing rule was based on a cost-plus method, with some exceptions based on apparent social welfare factors.5 ACP has been slowly rationalizing the fee structure since the Canal moved back to Panamanian authority. It recognizes the financial support given by the State of Panama by pricing the facility at a market basis to generate revenue for the government – not unlike the Suez Canal Authority, which has also abandoned the cost-plus method. The fee structure is still not wholly
5 Small ships (some Panamanian) pay fees well below cost plus when the lock operations, opportunity costs and the cost of lost water used by the locks are taken into account.
Potential Effects of the Panama Canal Expansion on the Texas Transportation System
Cambridge Systematics, Inc. 5
consistent with a market-based method and, therefore, produces a wide range of fees levied in any one year, as shown in the box below.
Fee Structure
Ships are first classified by type as noted above, whether the ship is loaded or empty; and whether or not the vessel is a containership, cruise ship, or cargo carrier. For container-ships, the capacity of the vessel is expressed in TEUs. However, that term can be misleading, as ships are rated both on a nominal basis, where each TEU is loaded to 14 metric tons; and on their capacity when normal commercial conditions are in place. In this latter state, the container mix com-prises empties and a range of loads depending on the commodities carried. This raises the TEU measure signifi-cantly as demonstrated by ships, such as the Emma Maersk, which can carry more than 14,000 TEUs. Fifteen years ago, a typical Panamax ship (the largest ship that can fit through the Panama Canal) had a nominal capacity of around 3,500 TEUs. This increased to a current value in excess of 5,000 TEUs, in part by stacking more containers on deck. The ACP wants to ensure that the fee struc-ture reflected both the actual TEUs carried, as well as the volumetric capacity of the ship.6
If the Canal had based its fee system solely on cargo carried, it would be poten-tially disadvantaged by the trade imbalance between Asia and the United States, in which many ships return to Asia only partially loaded. The rate effective on May 1, 2009 was $72.00 USD per TEU of capacity, a value that is currently under review. The toll is lower for cruise and container ships carrying no cargo (“in ballast”), which in May 2009 was $57.60 USD per TEU of capacity. Further planned rate increases have been repeatedly delayed due to the global economic slowdown.
Passenger vessels (cruise ships) exceeding 30,000 tons pay a rate based on the number of passengers that can be accommodated on a berth/passenger basis. The per-berth charge is currently $92 for unoccupied berths and $115 for occu-pied berths. This charge, which began in 2007, has greatly increased tolls on the larger cruise ships, while those under 30,000 tons, or less than 33 tons per pas-senger, are charged on the same “per-ton” schedule as freighters.
6 Leach, Peter, “Panama Canal Freezes Tolls, Proposes New Structure,” Journal of Commerce Online, April 28, 2010.
Panama Canal Fees In 2008, the most expensive regular toll was levied in May, when the Disney Magic paid $331,200, while the highest fee for a priority passage was $220,300 (additional) paid by a Panamax oil tanker to bypass a queue of almost 100 ships delayed by maintenance activities at the Gatun locks. Avoiding a wait of seven days suggests that the opportunity cost of cargo exceeded $30,000 a day for this cargo.

Potential Effects of the Panama Canal Expansion on the Texas Transportation System
6 Cambridge Systematics, Inc.
Finally, most cargo ships pay a fee based on a PC/UMS net ton basis, where one ton is equivalent to a volume of 100 cubic feet. The calculation of tonnage for commercial vessels is quite complex but forms the metric reported by ACP for all noncontainerized passages. As of fiscal year 2008, this toll is $3.90 USD per ton for the first 10,000 tons; $3.19 USD per ton for the next 10,000 tons; $3.82 USD per ton for the next 10,000 tons; and $3.76 USD per ton thereafter. As with container-ships, a reduced toll is charged for freight ships “in ballast.” The magnitude of the fees for passages through the new locks is, at this time, unknown, but they will almost certainly be derived from a market-based method, incorporating the state of the global economy, price of fuel, and the fees charged for similar sized ships by the Suez Canal Authority.
Potential Effects of the Panama Canal Expansion on the Texas Transportation System
Cambridge Systematics, Inc. 1
4.0 Potential Impacts on the Texas Transportation System
The U.S. Gulf Coast and East Coast ports, including those in Texas, should bene-fit from the projected increased in Panama Canal traffic. Exactly how much traf-fic moves through the widened Panama Canal to ports in Gulf and East Coast will be determined by the capacity of the U.S. West Coast ports to handle the projected growth in trade with Asia. The more trade handled through West Coast ports, the less trade that will be routed through the Canal to Gulf Coast and East Coast ports; and conversely, the less through the West Coast, the more through the Gulf and East Coast.
4.1 TRADE WITH ASIA While the demand for trade freight movement through the West Coast is expected to be substantial in coming years, the West Coast ports face physical constraints to their expansion, as well as community demands that the volume of port-related truck and rail movements and their associated congestion, noise, and air pollution impacts be reduced.
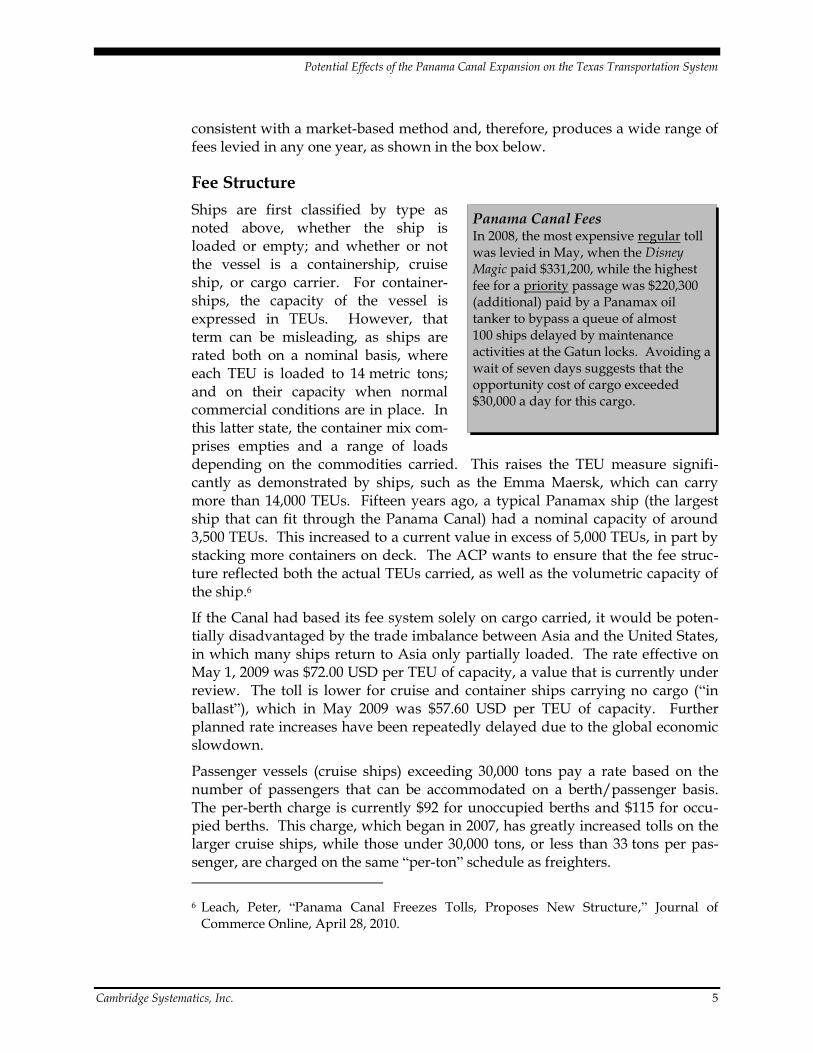
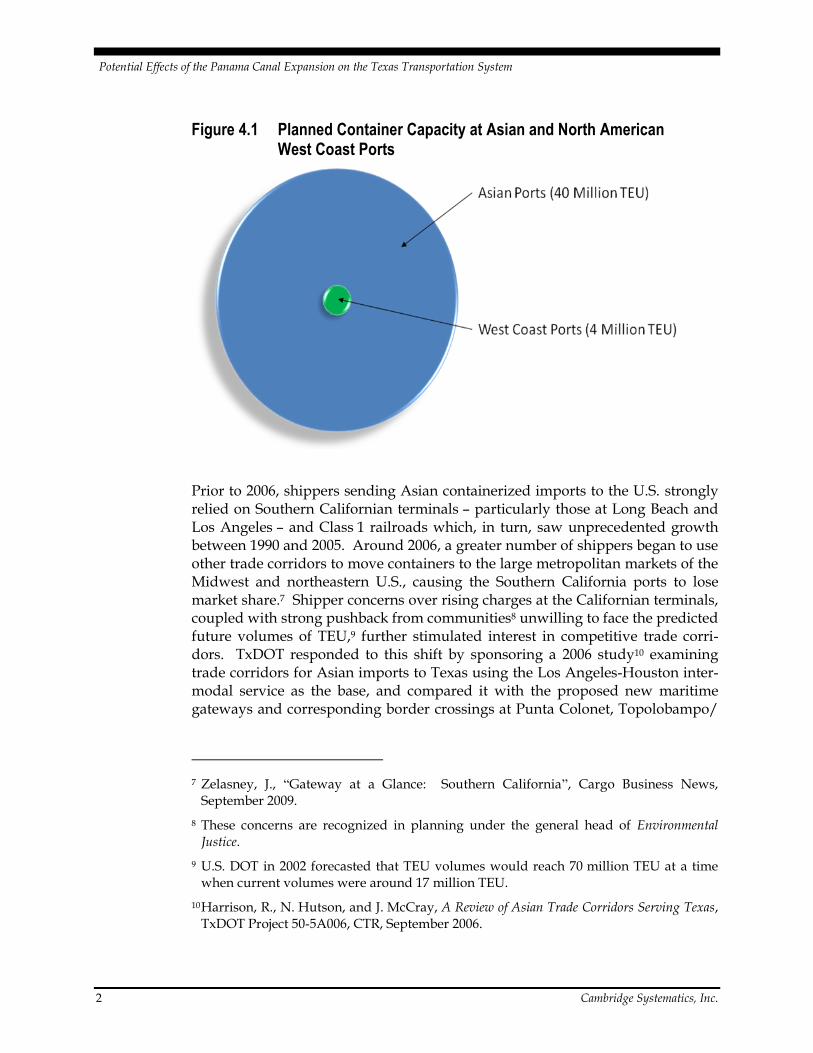
One indicator that suggests that more traffic will flow through the Panama Canal to the Gulf and East Coasts because of limited capacity at West Coast ports is the planned capacity at ports in Asia and on North America’s West Coast. During the next five years, approximately 40 million TEUs of capacity are planned at eight major Asian intermodal export terminals. By comparison, less than 4 million TEUs of capacity are planned for West Coast ports, including the port at Prince Rupert in British Columbia (see Figure 4.1).
Not all the capacity of the Asian ports will be dedicated to trade with the Americas and the recession will slow plans for capacity expansion; however, the compari-son suggests that the U.S. West Coast ports may not accommodate all the antic-ipated trade, and that a significant portion of that trade could divert to the Panama Canal to reach Gulf and East Coasts markets.
Potential Effects of the Panama Canal Expansion on the Texas Transportation System
2 Cambridge Systematics, Inc.
Figure 4.1 Planned Container Capacity at Asian and North American West Coast Ports
Prior to 2006, shippers sending Asian containerized imports to the U.S. strongly relied on Southern Californian terminals – particularly those at Long Beach and Los Angeles – and Class 1 railroads which, in turn, saw unprecedented growth between 1990 and 2005. Around 2006, a greater number of shippers began to use other trade corridors to move containers to the large metropolitan markets of the Midwest and northeastern U.S., causing the Southern California ports to lose market share.7 Shipper concerns over rising charges at the Californian terminals, coupled with strong pushback from communities8 unwilling to face the predicted future volumes of TEU,9 further stimulated interest in competitive trade corri-dors. TxDOT responded to this shift by sponsoring a 2006 study10 examining trade corridors for Asian imports to Texas using the Los Angeles-Houston inter-modal service as the base, and compared it with the proposed new maritime gateways and corresponding border crossings at Punta Colonet, Topolobampo/
7 Zelasney, J., “Gateway at a Glance: Southern California”, Cargo Business News, September 2009.
8 These concerns are recognized in planning under the general head of Environmental Justice.
9 U.S. DOT in 2002 forecasted that TEU volumes would reach 70 million TEU at a time when current volumes were around 17 million TEU.
10 Harrison, R., N. Hutson, and J. McCray, A Review of Asian Trade Corridors Serving Texas, TxDOT Project 50-5A006, CTR, September 2006.
Potential Effects of the Panama Canal Expansion on the Texas Transportation System
Cambridge Systematics, Inc. 3
Presidio, Manzanillo/Laredo, Lazaro Cardenas/Laredo, Panama Canal, and finally Suez-North Atlantic port of entries.
It was estimated, using a basic cost model, that Southern California would remain the main corridor for deliveries to Texas, unless the import industry11 continued to add costs to containerized freight movements within the port hinterland. The Panama Canal came next, followed by the Port of Lazaro Cardenas on the Mexican pacific coast. It was argued that if Asian trade grew as predicted then all trade corridors would be needed to carry the traffic most suited to the commodities; and that a variety of trade corridors serving Texas was better than depending on one single corridor, even when this was feasible.
A more recent document by Drewry shipping consultants12 examines the issue from a different perspective. First, it views the entire U.S. and not just Texas ports. Then it asks, “At what geographic point does the Southern California and transcontinental rail bridge become uncompetitive vs. an all-water Panama Canal service?” Three cost/containership models – West Coast 8,000 TEU ship vs. East and Gulf 6,400 TEU ship and East and Gulf 8,000 TEU ship – were used to derive a through rate cost value for both imports and exports to various U.S. cities. The work seeks the cost inflection point when the advantage moves from the West Coast to the Panama Canal.
Table 4.1 gives the values for imports, and Figure 4.2 plots the cities where Panama service is lower than West Coast service, as indicated in Table 4.1. The results are striking and indicate that a large part of the current U.S. population can be served by larger containerships using the new Panama Canal locks, given a moderate market-based fee structure. The results are estimates and are subject to the assumptions and costs chosen to drive the models. But even accepting this caveat, it appears that the Canal will prove to be a strong contender for Asian trade serving not only the East Coast, but also most of Texas and the Midwest after 2014.
11 Importers, forwarders, labor rates, terminal fees like Pier Pass and fees like the TEU fee on the Alameda corridor levied whether the box was full or empty.
12 U.S. Transpacific Intermodal Today and Tomorrow, Drewry Shipping Consultants Ltd., 2008.

Potential Effects of the Panama Canal Expansion on the Texas Transportation System
4 Cambridge Systematics, Inc.
Table 4.1 Through Rate Cost Comparison – Import
West Coast 8,000 TEU Ship vs.
East and Gulf 6,400 TEU Ship East and Gulf 8,000 TEU Ship
Import Destination
Container Sizes
20 Feet 40 Feet 20 Feet 40 Feet
Atlanta $595 $580 $665 $720
Chicago $185 $270 $255 $410
Cincinnati $185 $120 $255 $260
Cleveland $85 $70 $155 $210
Columbus $460 $370 $530 $510
Dallas -$65 -$255 $1 -$115
Detroit $85 $220 $155 $360
Indianapolis $630 $670 $955 $810
Kansas City $335 $70 $405 $210
Louisville $885 $670 $955 $810
Minneapolis -$15 -$55 $55 $85
Memphis $260 $70 $330 $210
Saint Louis $1,070 $875 $1,140 $995
Source: Drewry Supply Chain Advisors.
Note: Positive numbers favor East Coast and Gulf routing.
Figure 4.2 Panama Canal Competitive Markets, Post-2014
Potential Effects of the Panama Canal Expansion on the Texas Transportation System
Cambridge Systematics, Inc. 5
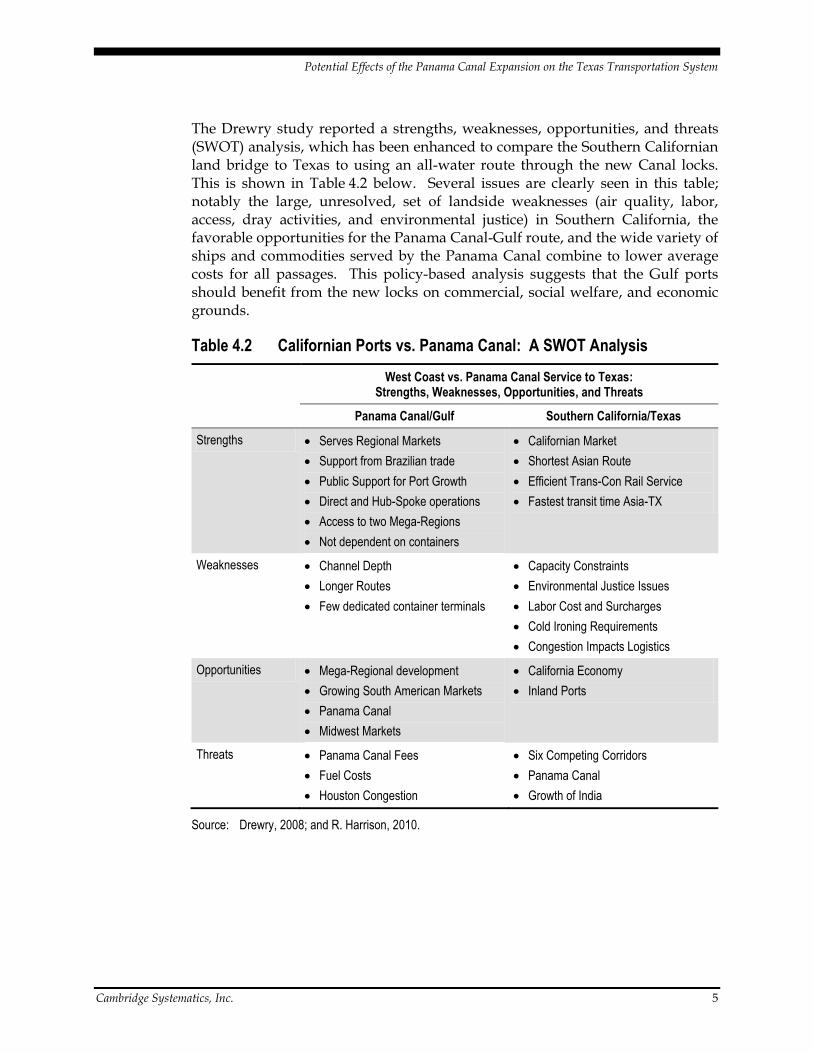
The Drewry study reported a strengths, weaknesses, opportunities, and threats (SWOT) analysis, which has been enhanced to compare the Southern Californian land bridge to Texas to using an all-water route through the new Canal locks. This is shown in Table 4.2 below. Several issues are clearly seen in this table; notably the large, unresolved, set of landside weaknesses (air quality, labor, access, dray activities, and environmental justice) in Southern California, the favorable opportunities for the Panama Canal-Gulf route, and the wide variety of ships and commodities served by the Panama Canal combine to lower average costs for all passages. This policy-based analysis suggests that the Gulf ports should benefit from the new locks on commercial, social welfare, and economic grounds.
Table 4.2 Californian Ports vs. Panama Canal: A SWOT Analysis
West Coast vs. Panama Canal Service to Texas: Strengths, Weaknesses, Opportunities, and Threats
Panama Canal/Gulf Southern California/Texas
Strengths Serves Regional Markets
Support from Brazilian trade
Public Support for Port Growth
Direct and Hub-Spoke operations
Access to two Mega-Regions
Not dependent on containers
Californian Market
Shortest Asian Route
Efficient Trans-Con Rail Service
Fastest transit time Asia-TX
Weaknesses Channel Depth
Longer Routes
Few dedicated container terminals
Capacity Constraints
Environmental Justice Issues
Labor Cost and Surcharges
Cold Ironing Requirements
Congestion Impacts Logistics
Opportunities Mega-Regional development
Growing South American Markets
Panama Canal
Midwest Markets
California Economy
Inland Ports
Threats Panama Canal Fees
Fuel Costs
Houston Congestion
Six Competing Corridors
Panama Canal
Growth of India
Source: Drewry, 2008; and R. Harrison, 2010.
Potential Effects of the Panama Canal Expansion on the Texas Transportation System
6 Cambridge Systematics, Inc.
4.2 PANAMA CANAL ROUTES POST 2014 The ability of the Panama Canal Authority to stay on the multistage, critical path construction schedule13 suggests that the new locks will be opened in 2014 – the centennial year of the Canal. Two observations can be made about routes that will be operating at that date. First, many will not change in the short to medium term, 2016 to 2020. This is particularly true for imports if the U.S. economy recovers slowly. Where the demand justifies higher cargo volumes, steamship companies will move to larger ships at some cost inflection point. The Drewry work suggests that two inflection points are 6,400 and 8,000 TEUs for the current Panamax containership.14 The displacement of ships within that broad class by the 10,000-plus TEU ships now entering service on the Pacific and Suez routes suggests that steamship companies will have available vessels to put on the Panama routes, if justified by demand.
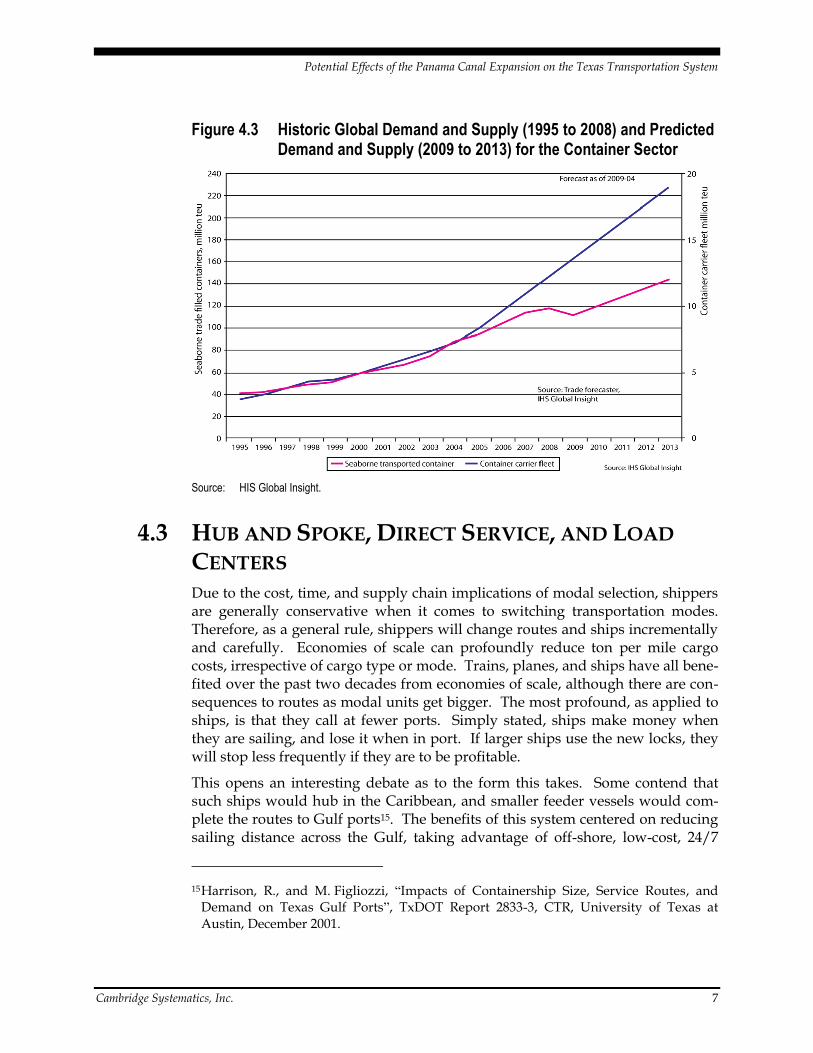
The marine shipping sector remains weak and is still struggling with the conse-quence of new ships, ordered when demand was high, now being delivered by shipyards. Data taken from a 2009 Global Insight webinar described the situa-tion that the industry faced at the peak of the overcapacity crisis. Figure 4.3 shows the historic balance between supply and demand, which began to become unstable in 2006; the post-2009 gap between the container fleet capacity and pro-jected demand clearly illustrates the difficult situation. The second observation is that, if routes change because of larger ships, the shape of the routes – partic-ularly the number of port calls – may diminish. The final section considers some of the key characteristics of post-2014 Canal routes.
13 On schedule and under budget at June 2010.
14 The current limit is around 5,200 TEUs.
Potential Effects of the Panama Canal Expansion on the Texas Transportation System
Cambridge Systematics, Inc. 7
Figure 4.3 Historic Global Demand and Supply (1995 to 2008) and Predicted Demand and Supply (2009 to 2013) for the Container Sector
Source: HIS Global Insight.
4.3 HUB AND SPOKE, DIRECT SERVICE, AND LOAD
CENTERS Due to the cost, time, and supply chain implications of modal selection, shippers are generally conservative when it comes to switching transportation modes. Therefore, as a general rule, shippers will change routes and ships incrementally and carefully. Economies of scale can profoundly reduce ton per mile cargo costs, irrespective of cargo type or mode. Trains, planes, and ships have all bene-fited over the past two decades from economies of scale, although there are con-sequences to routes as modal units get bigger. The most profound, as applied to ships, is that they call at fewer ports. Simply stated, ships make money when they are sailing, and lose it when in port. If larger ships use the new locks, they will stop less frequently if they are to be profitable.
This opens an interesting debate as to the form this takes. Some contend that such ships would hub in the Caribbean, and smaller feeder vessels would com-plete the routes to Gulf ports15. The benefits of this system centered on reducing sailing distance across the Gulf, taking advantage of off-shore, low-cost, 24/7
15 Harrison, R., and M. Figliozzi, “Impacts of Containership Size, Service Routes, and Demand on Texas Gulf Ports”, TxDOT Report 2833-3, CTR, University of Texas at Austin, December 2001.
Potential Effects of the Panama Canal Expansion on the Texas Transportation System
8 Cambridge Systematics, Inc.
port operations; and concentrating on the trade lanes carrying high volumes of trade, such as from South America. Furthermore, smaller vessels could serve a wider variety of Gulf ports currently limited by channel depth16. More recently, direct service to key ports like Houston appears commercially feasible based on the 6,000 to 8,000 TEU ship class – technically not a true Mega-ship. The tipping point between hub and spoke and direct service is demand. If a Gulf port is a true load center – which none is at the moment – direct service is viable. Load centers have several key characteristics:
They are the gateways to regions, not states;
They generate high volumes of trade, which, in the case of containers, exceeds 4 million TEUs; and
They have strong landside connections linking multiple modes, and they can offer steamship companies a fast turnaround to keep ships sailing.
As such centers emerge in the next two decades in the U.S. Gulf and South Atlantic, direct service will grow. At this moment, route development following the new Panama Canal locks is speculative and imprecise. TxDOT should maintain scrutiny on how the marketing of steamship companies changes from 2013 onwards in the build up to the opening of the expanded Panama Canal for business.
4.4 ADDITIONAL TEXAS FREIGHT Clearly, due to the many uncertainties described previously, it is impossible to determine with certainty how much additional freight movement in Texas will result from the expansion of the Panama Canal. However, it is possible to esti-mate the amount of freight moving within the State that has arrived at Texas ports from the Pacific via the Canal, and the amount of freight being exported from Texas that is likely to pass through the Canal on the way to its final destination.
According to the ACP, approximately 84 million tons of cargo transited the Panama Canal from the Pacific to the Atlantic, while approximately 123 million tons transited the Canal from the Atlantic to the Pacific in 2009. Of this, the Gulf Coast handled approximately 21 percent of the Pacific-Atlantic cargo (17.7 million tons) and roughly 50 percent of the Atlantic-Pacific cargo (61.1 million tons). This is in contrast to U.S. ports on the East Coast and on the Great Lakes, which handled roughly 35 percent of the Pacific-Atlantic freight (28.9 million tons) and 15 percent of the Atlantic-Pacific freight (18.8 million tons).
16 The 11,000 TEU ship needs a 50-foot channel – only Texas City has a permit for such a channel at this time.
Potential Effects of the Panama Canal Expansion on the Texas Transportation System
Cambridge Systematics, Inc. 9
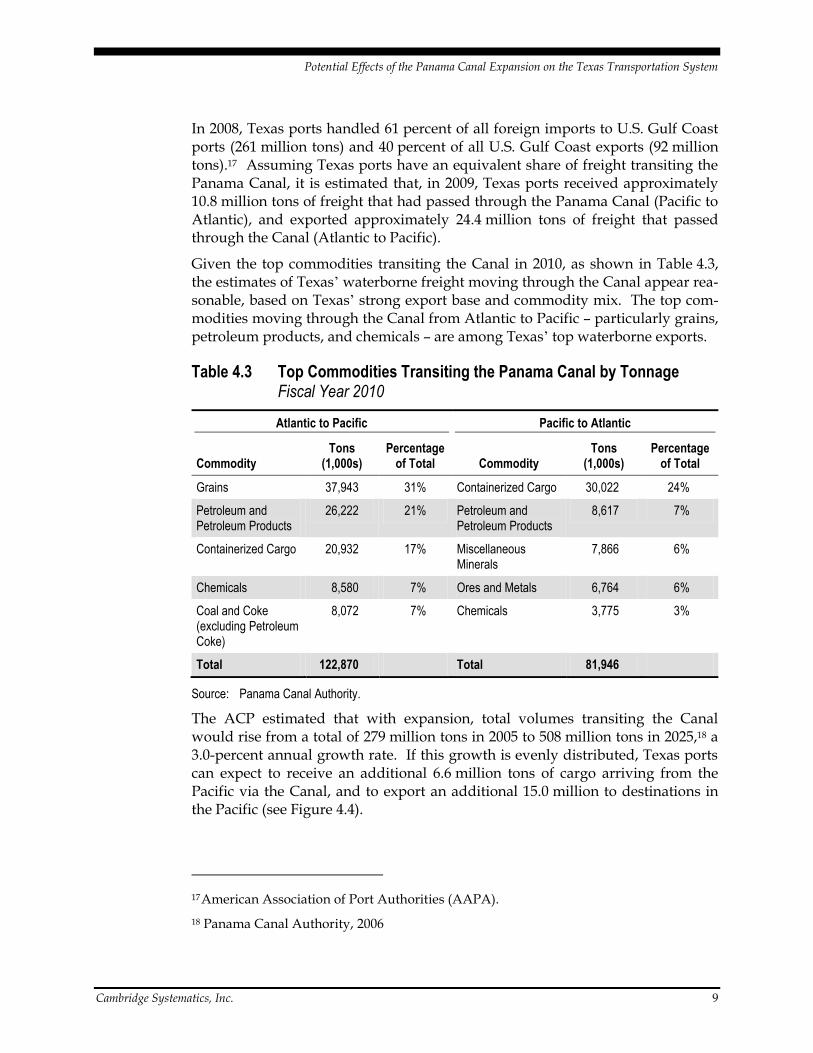
In 2008, Texas ports handled 61 percent of all foreign imports to U.S. Gulf Coast ports (261 million tons) and 40 percent of all U.S. Gulf Coast exports (92 million tons).17 Assuming Texas ports have an equivalent share of freight transiting the Panama Canal, it is estimated that, in 2009, Texas ports received approximately 10.8 million tons of freight that had passed through the Panama Canal (Pacific to Atlantic), and exported approximately 24.4 million tons of freight that passed through the Canal (Atlantic to Pacific).
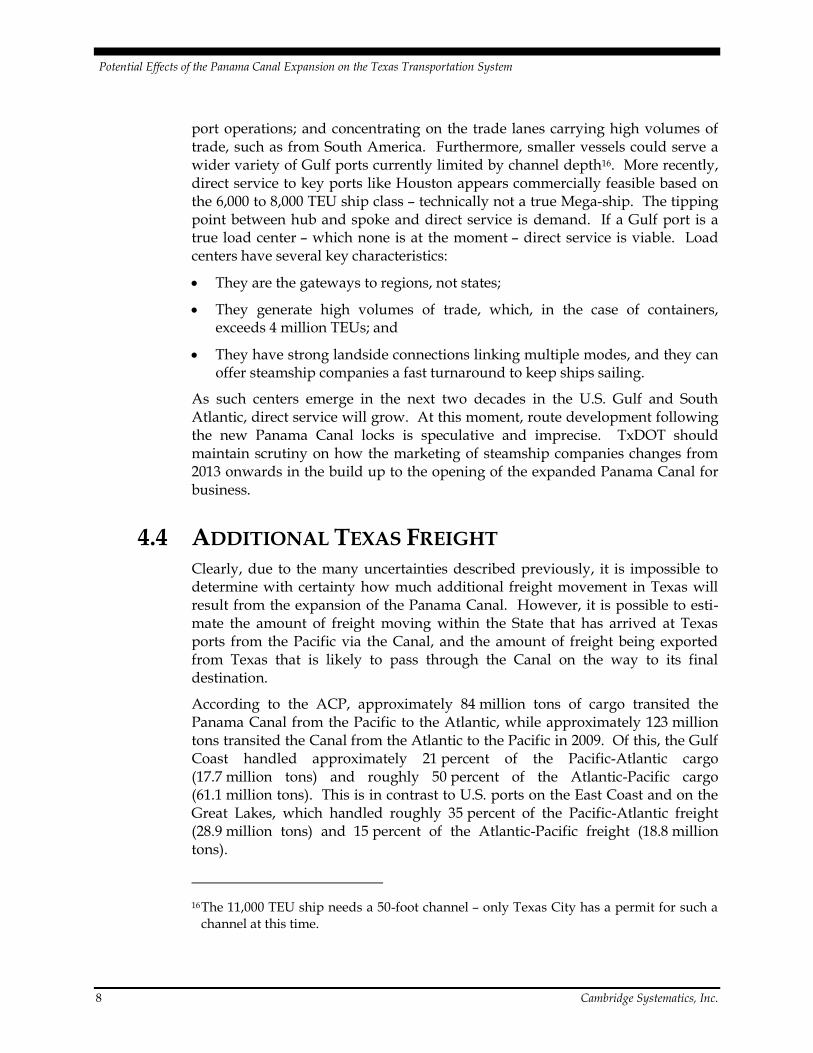
Given the top commodities transiting the Canal in 2010, as shown in Table 4.3, the estimates of Texas’ waterborne freight moving through the Canal appear rea-sonable, based on Texas’ strong export base and commodity mix. The top com-modities moving through the Canal from Atlantic to Pacific – particularly grains, petroleum products, and chemicals – are among Texas’ top waterborne exports.
Table 4.3 Top Commodities Transiting the Panama Canal by Tonnage Fiscal Year 2010
Atlantic to Pacific Pacific to Atlantic
Commodity Tons
(1,000s) Percentage
of Total Commodity Tons
(1,000s) Percentage
of Total
Grains 37,943 31% Containerized Cargo 30,022 24%
Petroleum and Petroleum Products
26,222 21% Petroleum and Petroleum Products
8,617 7%
Containerized Cargo 20,932 17% Miscellaneous Minerals
7,866 6%
Chemicals 8,580 7% Ores and Metals 6,764 6%
Coal and Coke (excluding Petroleum Coke)
8,072 7% Chemicals 3,775 3%
Total 122,870 Total 81,946
Source: Panama Canal Authority.
The ACP estimated that with expansion, total volumes transiting the Canal would rise from a total of 279 million tons in 2005 to 508 million tons in 2025,18 a 3.0-percent annual growth rate. If this growth is evenly distributed, Texas ports can expect to receive an additional 6.6 million tons of cargo arriving from the Pacific via the Canal, and to export an additional 15.0 million to destinations in the Pacific (see Figure 4.4).
17 American Association of Port Authorities (AAPA).
18 Panama Canal Authority, 2006
Potential Effects of the Panama Canal Expansion on the Texas Transportation System
10 Cambridge Systematics, Inc.
Figure 4.4 Estimated Panama Canal Tonnage Originating or Terminating in Texas by Transit Direction, 2009 and 2025
Potential Effects of the Panama Canal Expansion on the Texas Transportation System
Cambridge Systematics, Inc. 1
5.0 Capacity Enhancement Projects at Texas Ports
In advance of the Panama Canal’s expansion, some of Texas’ largest ports are undertaking major capacity enhancement projects to enhance their ability to attract a portion of the Canal’s new traffic. For more detailed information on these investments, see TxDOT’s Waterborne Freight Corridor Study Phase I Final Report.
5.1 LAND DEVELOPMENT ACTIVITIES One requirement for successful waterborne trade is the availability of land to handle growing freight needs and existing or potential access to deepwater navi-gation channels and proximity to major roadway and railroad corridors. Texas ports and local partners are making investments in order to position themselves to capture increasing trade volumes. These investments, and how shippers respond, will impact the volume and types of goods moving through the system, and the specific logistics network shippers and operators will rely upon for effi-cient transport of commodities from origin to destination. It is, therefore, important to understand, at a high level, the types of land development activities. This section discusses major land development and expansion activi-ties at the Ports of Beaumont, Corpus Christi, Freeport, Galveston, Houston, Orange, and Victoria given that these port facilities are likely to see the most direct impact of the Panama Canal’s expansion. The findings in this section are built off of consultant research, and interviews and conversations with port officials.
Port of Beaumont
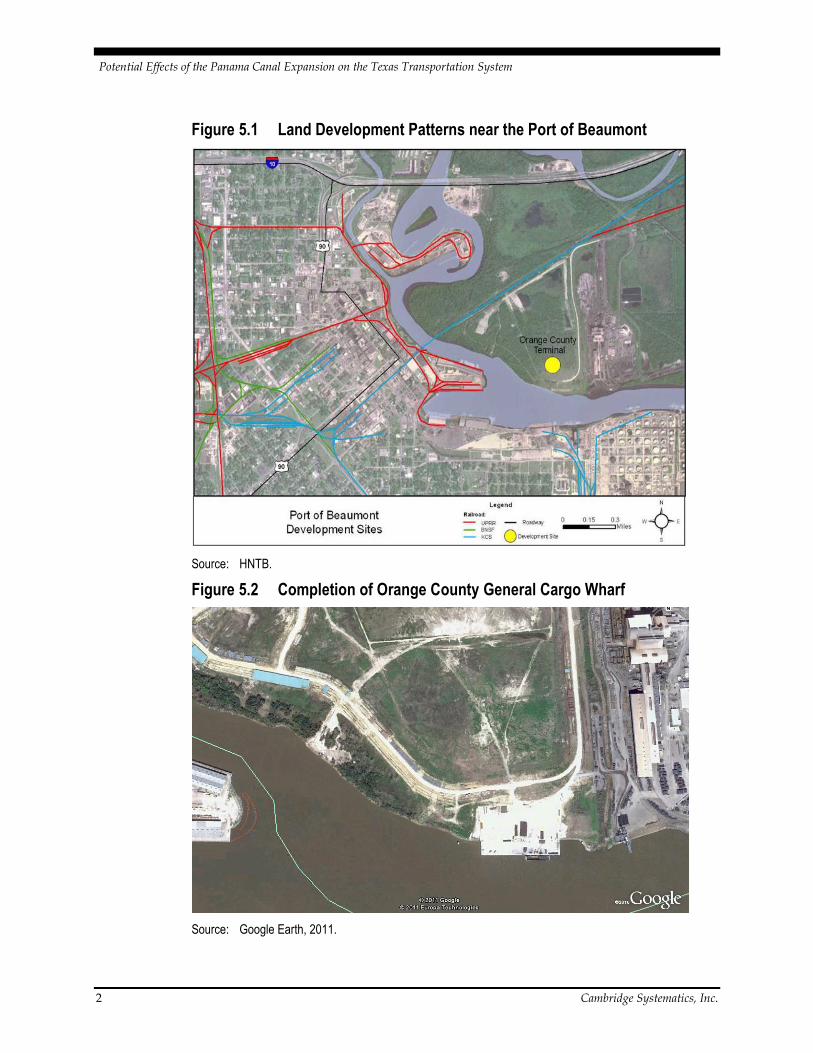
Situated 84 miles east of Houston in Jefferson, the Port of Beaumont is under-taking a number of key development activities and investments to enable rail lines to better serve importers and exporters, and minimize logistics costs asso-ciated with limited access to highways and freight railroads (Figure 5.1). Key investments include:
Triangle Marine Industrial Park – A 400-acre site development with 1,700 feet of water frontage and a 90-acre turning basin, located just east of the conflu-ence of U.S. 287/96/69 and SH 347. The site includes a 23-acre rail yard and one mile of track paralleling the alignment of the KCS Beaumont Subdivision.
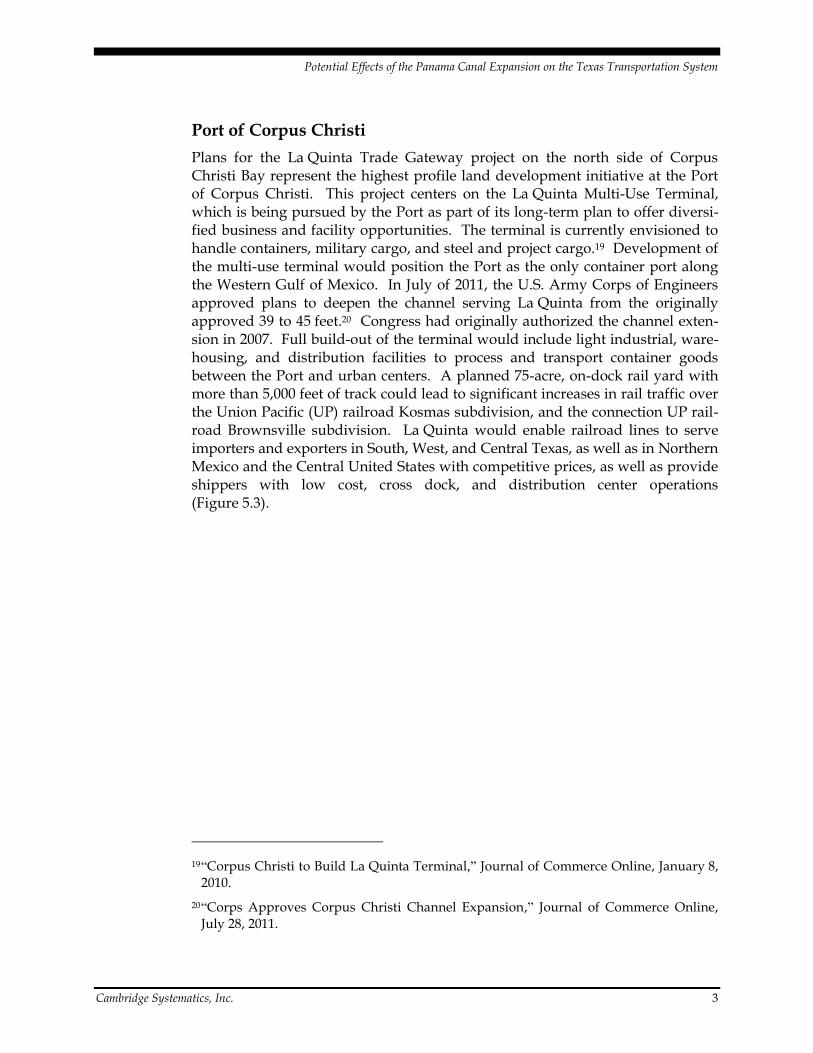
New $22 million wharf in Orange County, directly across from its main ter-minals on the west side of the Neches River.
Potential Effects of the Panama Canal Expansion on the Texas Transportation System
2 Cambridge Systematics, Inc.
Figure 5.1 Land Development Patterns near the Port of Beaumont
Source: HNTB.
Figure 5.2 Completion of Orange County General Cargo Wharf
Source: Google Earth, 2011.
Potential Effects of the Panama Canal Expansion on the Texas Transportation System
Cambridge Systematics, Inc. 3
Port of Corpus Christi
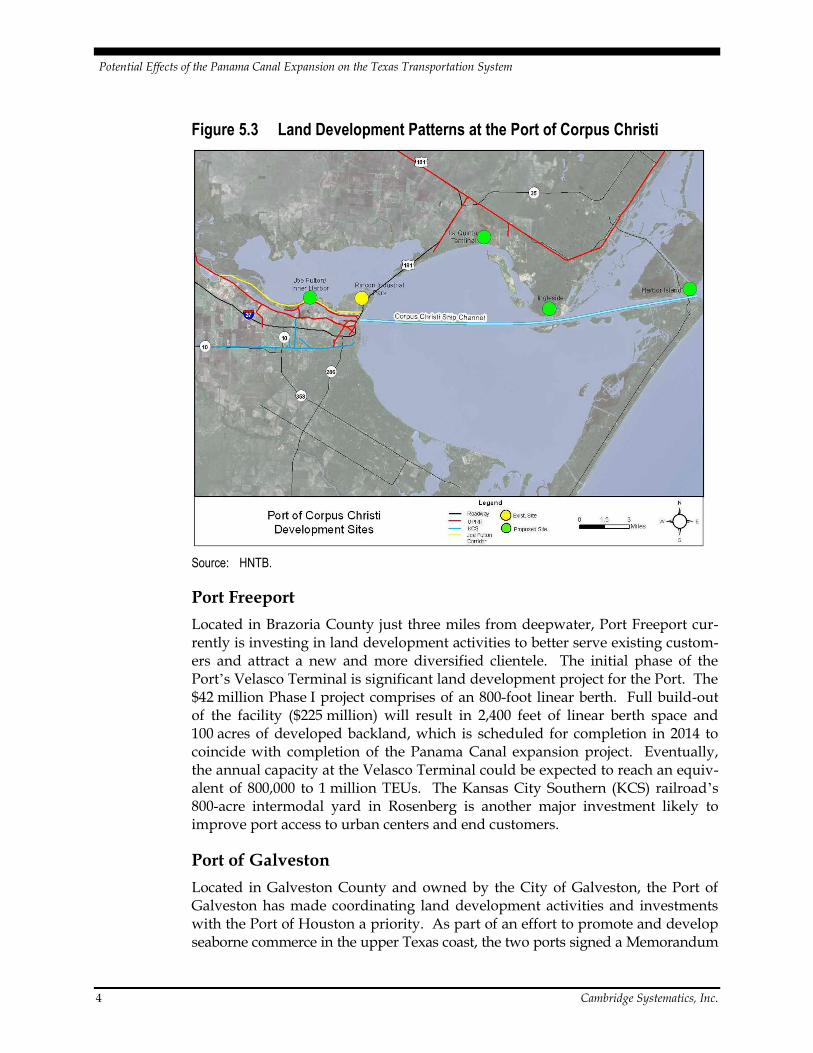
Plans for the La Quinta Trade Gateway project on the north side of Corpus Christi Bay represent the highest profile land development initiative at the Port of Corpus Christi. This project centers on the La Quinta Multi-Use Terminal, which is being pursued by the Port as part of its long-term plan to offer diversi-fied business and facility opportunities. The terminal is currently envisioned to handle containers, military cargo, and steel and project cargo.19 Development of the multi-use terminal would position the Port as the only container port along the Western Gulf of Mexico. In July of 2011, the U.S. Army Corps of Engineers approved plans to deepen the channel serving La Quinta from the originally approved 39 to 45 feet.20 Congress had originally authorized the channel exten-sion in 2007. Full build-out of the terminal would include light industrial, ware-housing, and distribution facilities to process and transport container goods between the Port and urban centers. A planned 75-acre, on-dock rail yard with more than 5,000 feet of track could lead to significant increases in rail traffic over the Union Pacific (UP) railroad Kosmas subdivision, and the connection UP rail-road Brownsville subdivision. La Quinta would enable railroad lines to serve importers and exporters in South, West, and Central Texas, as well as in Northern Mexico and the Central United States with competitive prices, as well as provide shippers with low cost, cross dock, and distribution center operations (Figure 5.3).
19 “Corpus Christi to Build La Quinta Terminal,” Journal of Commerce Online, January 8, 2010.
20 “Corps Approves Corpus Christi Channel Expansion,” Journal of Commerce Online, July 28, 2011.
Potential Effects of the Panama Canal Expansion on the Texas Transportation System
4 Cambridge Systematics, Inc.
Figure 5.3 Land Development Patterns at the Port of Corpus Christi
Source: HNTB.
Port Freeport
Located in Brazoria County just three miles from deepwater, Port Freeport cur-rently is investing in land development activities to better serve existing custom-ers and attract a new and more diversified clientele. The initial phase of the Port’s Velasco Terminal is significant land development project for the Port. The $42 million Phase I project comprises of an 800-foot linear berth. Full build-out of the facility ($225 million) will result in 2,400 feet of linear berth space and 100 acres of developed backland, which is scheduled for completion in 2014 to coincide with completion of the Panama Canal expansion project. Eventually, the annual capacity at the Velasco Terminal could be expected to reach an equiv-alent of 800,000 to 1 million TEUs. The Kansas City Southern (KCS) railroad’s 800-acre intermodal yard in Rosenberg is another major investment likely to improve port access to urban centers and end customers.
Port of Galveston
Located in Galveston County and owned by the City of Galveston, the Port of Galveston has made coordinating land development activities and investments with the Port of Houston a priority. As part of an effort to promote and develop seaborne commerce in the upper Texas coast, the two ports signed a Memorandum
Potential Effects of the Panama Canal Expansion on the Texas Transportation System
Cambridge Systematics, Inc. 5
of Understanding (MOU) for the ports for the joint development and use of por-tions of Pelican Island as a potential future container-handling facility.
Port of Houston
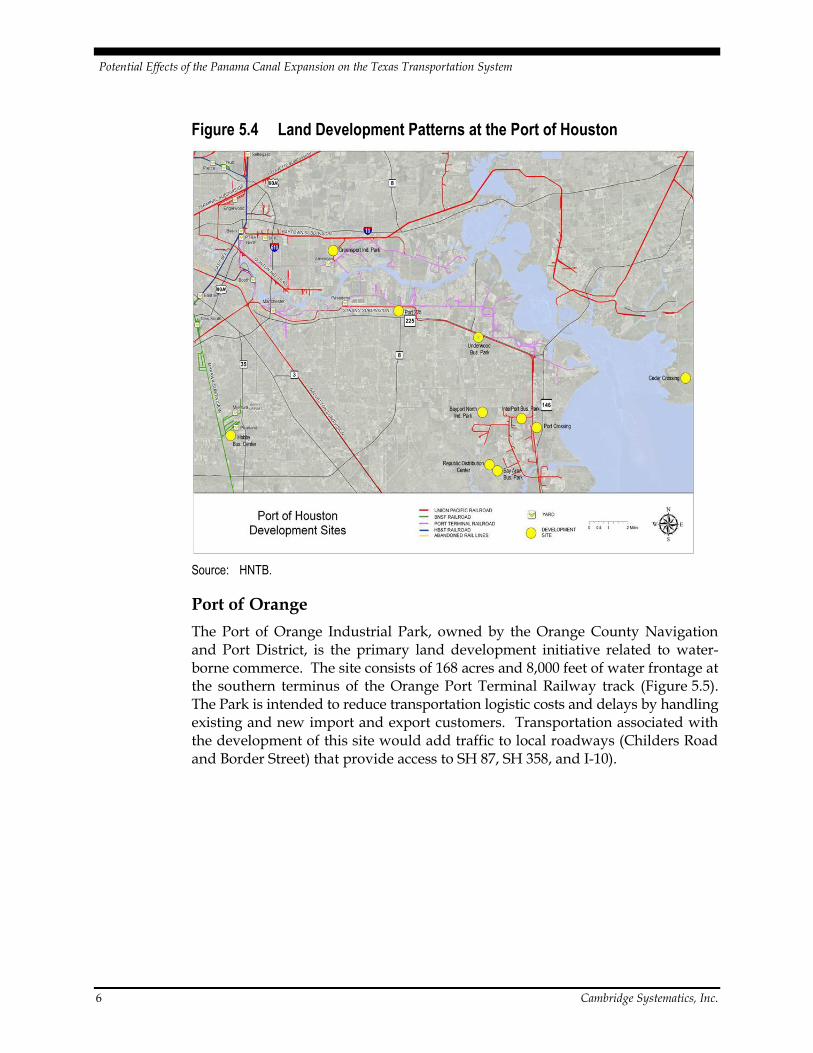
Land development at the Port of Houston is largely driven by the growth in container traffic coincident to the expansion of container handling facilities at Barbours Cut and Bayport. Trends in new construction of industrial parks and distribution centers reflect the strategic positioning of these facilities near the Port’s container operations (Figure 5.4). Sites that will create the most direct increase in traffic on SH 146 and adjoining roadways (e.g., Barbours Cut Boulevard, Red Bluff Road, Bay Area Boulevard, Choate Road, and Port Road include the following:
Bay Area Business Park (137 acres);
Bayport North Industrial Park (130 acres);
InterPort Business Park (88 acres);
Port Crossing Commerce Center (300 acres); and
Republican Distribution Center (191 acres).
In addition to land development associated with existing container terminal operations, future development will be increasingly driven by new demand resulting from the expansion of the Panama Canal, and by the Port’s selection of a site for its next container terminal. Currently, the Baytown area is experiencing strong growth in transportation and logistics industries – the area’s Cedar Crossing Industrial Park, which is adjacent to the Cedar Bayou navigation chan-nel and is home to the largest Wal-Mart import and distribution facility in the country. Home Depot also has selected this location as its distribution base for the Southwest United States.
Potential Effects of the Panama Canal Expansion on the Texas Transportation System
6 Cambridge Systematics, Inc.
Figure 5.4 Land Development Patterns at the Port of Houston
Source: HNTB.
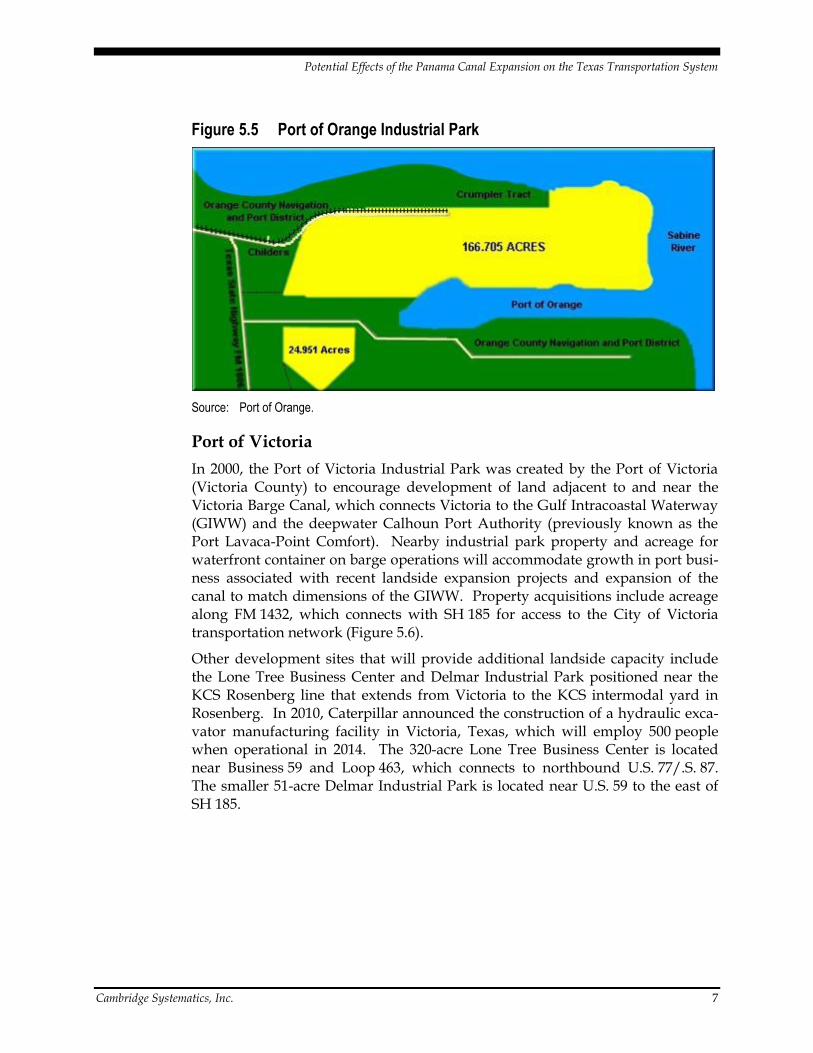
Port of Orange
The Port of Orange Industrial Park, owned by the Orange County Navigation and Port District, is the primary land development initiative related to water-borne commerce. The site consists of 168 acres and 8,000 feet of water frontage at the southern terminus of the Orange Port Terminal Railway track (Figure 5.5). The Park is intended to reduce transportation logistic costs and delays by handling existing and new import and export customers. Transportation associated with the development of this site would add traffic to local roadways (Childers Road and Border Street) that provide access to SH 87, SH 358, and I-10).
Potential Effects of the Panama Canal Expansion on the Texas Transportation System
Cambridge Systematics, Inc. 7
Figure 5.5 Port of Orange Industrial Park
Source: Port of Orange.
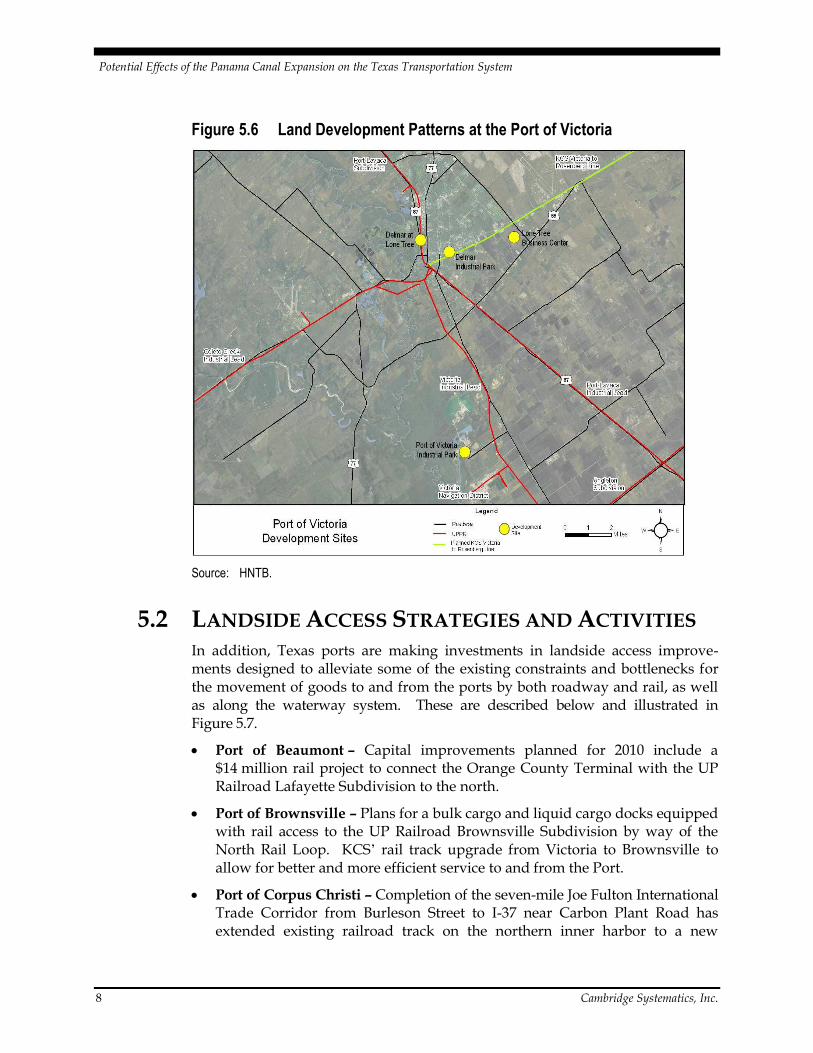
Port of Victoria
In 2000, the Port of Victoria Industrial Park was created by the Port of Victoria (Victoria County) to encourage development of land adjacent to and near the Victoria Barge Canal, which connects Victoria to the Gulf Intracoastal Waterway (GIWW) and the deepwater Calhoun Port Authority (previously known as the Port Lavaca-Point Comfort). Nearby industrial park property and acreage for waterfront container on barge operations will accommodate growth in port busi-ness associated with recent landside expansion projects and expansion of the canal to match dimensions of the GIWW. Property acquisitions include acreage along FM 1432, which connects with SH 185 for access to the City of Victoria transportation network (Figure 5.6).
Other development sites that will provide additional landside capacity include the Lone Tree Business Center and Delmar Industrial Park positioned near the KCS Rosenberg line that extends from Victoria to the KCS intermodal yard in Rosenberg. In 2010, Caterpillar announced the construction of a hydraulic exca-vator manufacturing facility in Victoria, Texas, which will employ 500 people when operational in 2014. The 320-acre Lone Tree Business Center is located near Business 59 and Loop 463, which connects to northbound U.S. 77/.S. 87. The smaller 51-acre Delmar Industrial Park is located near U.S. 59 to the east of SH 185.
Potential Effects of the Panama Canal Expansion on the Texas Transportation System
8 Cambridge Systematics, Inc.
Figure 5.6 Land Development Patterns at the Port of Victoria
Source: HNTB.
5.2 LANDSIDE ACCESS STRATEGIES AND ACTIVITIES In addition, Texas ports are making investments in landside access improve-ments designed to alleviate some of the existing constraints and bottlenecks for the movement of goods to and from the ports by both roadway and rail, as well as along the waterway system. These are described below and illustrated in Figure 5.7.
Port of Beaumont – Capital improvements planned for 2010 include a $14 million rail project to connect the Orange County Terminal with the UP Railroad Lafayette Subdivision to the north.
Port of Brownsville – Plans for a bulk cargo and liquid cargo docks equipped with rail access to the UP Railroad Brownsville Subdivision by way of the North Rail Loop. KCS’ rail track upgrade from Victoria to Brownsville to allow for better and more efficient service to and from the Port.
Port of Corpus Christi – Completion of the seven-mile Joe Fulton International Trade Corridor from Burleson Street to I-37 near Carbon Plant Road has extended existing railroad track on the northern inner harbor to a new
Potential Effects of the Panama Canal Expansion on the Texas Transportation System
Cambridge Systematics, Inc. 9
connection with the UP Railroad Corpus Christi Subdivision mainline near Viola Yard. In addition, new road and rail infrastructure are being planned for the proposed La Quinta Terminal on the north side of Corpus Christi Bay.
Port of Houston – Several roadway projects are proposed, including grade separation and capacity projects, proposed for SH 146 to reduce port-related congestion at the Ports of Galveston and Houston. In addition, various rail-related improvement projects are under study by the Gulf Coast Rail District to improve the efficiency of freight movements through Houston.
Port Isabel – Plans for a reliever road between the Port and SH 48 that will bypass residential areas and public parks are underway. The results are reduced noise pollution and emissions, and improved quality of life, as well as more efficient movement of freight and goods from and to Port Isabel.
Calhoun Port Authority – Track construction to connect the Port with the new KCS intermodal facility at Rosenberg.
Port of Victoria – The Port plans to expand rail storage areas and extend rail service to the dock.

Potential Effects of the Panama Canal Expansion on the Texas Transportation System
10 Cambridge Systematics, Inc.
Figure 5.7 Port Access Improvement Activities
Source: TxDOT Waterborne Freight Corridor Study Phase I Final Report.

Potential Effects of the Panama Canal Expansion on the Texas Transportation System
Cambridge Systematics, Inc. 1
6.0 Implications for Texas Transportation Stakeholders
While the expansion of the Panama Canal is targeted toward serving container traffic – in particular consumer goods originating in Asia and bound for markets on the East Coast of the U.S. – the Canal also is likely to continue carrying a large amount of exported bulk freight from Texas ports to destinations in the Pacific. Though only a handful of ports in Texas serves significant volumes of containe-rized traffic or will be able to accommodate the very large ships newly able to transit the Canal, the impact of the Canal expansion will not be limited to only those facilities. Rather, the expansion is likely to have significant impacts on many Texas ports – some of which may develop feeder services connecting them to larger hubs, their surrounding communities, and the highways and rail lines that serve them.
Key factors likely to impact Texas as a result of the Panama Canal’s expansion include:
Accelerated growth at Texas ports;
Higher volumes on intermodal connectors;
Increased development of distribution and warehouse facilities in port areas;
More distribution centers focusing on Asian trade;
New competitive pressures on ports to increase channel depths;
More extensive communication with other Gulf and Atlantic ports;
More communication with Caribbean Transshipment hubs;
Inquiries from Midwest shippers in Texas ports and Texas-based distribution centers;
Resistance from environmental advocates and/or regulatory agencies to pro-posed new dredging projects; and
Air quality and other environmental impacts.
There are several steps that the Texas transportation stakeholders can take in order to maximize the benefits accruing to Texas as a result of the Panama Canal’s expansion, including the following:
Deepening channels and berths, where necessary, to accommodate larger vessels – The Port of Houston is one of several Gulf and East Coast ports with the greatest potential to handle post-Panamax vessels; the largest vessels passing through the Canal are likely to call only at the largest ports, while most Texas ports are expected to receive calls from these new mega-ships as
Potential Effects of the Panama Canal Expansion on the Texas Transportation System
2 Cambridge Systematics, Inc.
frequently, the Port of Houston has already received light-loaded vessels with capacity of more than 8,000 TEUs.21
Improving intermodal truck and rail connections between the ports and the major U.S. consumer markets – Better regional highways and port con-nector roads (typically, the “last mile” of roadway between the port and the nearest interstate highway) are needed to handle trucks draying containers between the port and local and regional markets, and additional rail capacity and services also will be needed. Capitalization of the Texas Rail Relocation and Improvement Fund would allow the State’s railroads to improve their infrastructure and operations, improving freight mobility and economic competitiveness for shippers. Since its creation in 2001, no funding has been appropriated for the Port Access Account Fund, which was originally set up to enhance port competitiveness and economic development. Yet, if a funding stream can be identified, the fund could serve as tool to coordinate and finance the $673 million of future capital projects that have been identified by Texas port authorities.22 In addition, TxDOT should work closely with its district and metropolitan planning organization (MPO) partners, private-sector freight stakeholders, and neighboring states, as appropriate, to identify key bottlenecks on the highway and rail systems that may be exacerbated by the anticipated growth in container traffic derived from both imports and exports caused by the Panama Canal expansion.
Responding creatively and effectively to environmental and community concerns regarding the impacts of port activities – Added freight through-put to the Texas port system will generate many legitimate environmental and community concerns regarding emissions, noise, and changes in land use. Even prior the Canal’s expansion, Texas had seen periods of rapid cargo growth and facility expansion in recent years and is, therefore, in a good position to anticipate the types of issues that will be raised. Given current trends in logistics, Texas could see more distribution centers shifting to 24-hour operation, which will create the potential for community impacts. TxDOT should work with the Port Authority Advisory Committee, other stakeholders in the maritime community, MPOs, districts, and other planning agencies to ensure that potential environmental issues related to the Panama Canal expansion and other global maritime trends are identified and accounted for within the transportation planning process at the statewide, regional, district, and metropolitan levels.
Integrating freight and land use decision-making at the local and regional levels – TxDOT should encourage MPOs and other local planning agencies to
21 Leach, P., “Houston’s Future Arrives Early,” Journal of Commerce Online, June 13, 2011.
22 Texas Ports 2011-2012 Capital Program, Texas Department of Transportation, ftp://ftp.dot.state.tx.us/pub/txdot-info/library/reports/gov/tpp/tpa_report11.pdf.
Potential Effects of the Panama Canal Expansion on the Texas Transportation System
Cambridge Systematics, Inc. 3
work closely with ports to ensure that land use and master planning activi-ties or strategies are coordinated. TxDOT should identify those areas near ports or freight corridors that are most likely to require future expansion, and inform the public regarding the location of strategic freight corridors in order to lower the potential for incompatible development in these areas. TxDOT should also work with ports, port authorities, motor carrier associations, and local planning agencies to develop a better understanding of how port-related drayage movements affect the performance of the transportation sys-tem; the overall mobility of people and goods in and around key port facilities; and how drayage movements are expected to change as a result of the Panama Canal expansion.
Developing transloading and marine highway services to feed traffic from the major, deepwater hubs to smaller ports across the Gulf and East Coast – Most Panama Canal traffic will not be moving in the largest post-Panamax vessels for some time into the future. Much of the traffic will continue to move in smaller vessels that can provide point-to-point service for medium-sized markets. Small and medium-sized Texas ports have the opportunity to maintain or capture this traffic, possibly through employing feeder collection and distribution networks to and from the larger hubs. Texas is well posi-tioned to take advantage of the emerging network of marine highways for domestic maritime shipping. An expansion of domestic short sea services could help to relieve pressure on other modes.