Embed Size (px)
Citation preview
POTENTIAL EFFECTS OF CLIMATE CHANGESON AQUATIC SYSTEMS: LAURENTIANGREAT LAKES AND PRECAMBRIAN
SHIELD REGION
J. J. MAGNUSON,1 K. E. WEBSTER,1;2 R. A. ASSEL,3 C. J. BOWSER,1 P. J. DILLON,4
J. G. EATON,5 H. E. EVANS,4 E. J. FEE,6 R. I. HALL,7 L. R. MORTSCH,8 D. W. SCHINDLER9
AND F. H. QUINN3
1Center for Limnology, University of Wisconsin-Madison, 680 N. Park St., Madison, WI, USA2Wisconsin Department of Natural Resources, Madison, WI, USA
3NOAA Great Lakes Environmental Research Laboratory, Ann Arbor, MI, USA4Dorset Research Centre, ON, Canada
5US Environmental Protection Agency, Duluth MN, USA6Freshwater Institute, Winnipeg, MB, Canada7University of Regina, Regina, SK, Canada
8Environmental Adaptation Research Group, Environment Canada, Burlington, ON, Canada9University of Alberta, Edmonton, AB, Canada
ABSTRACT
The region studied includes the Laurentian Great Lakes and a diversity of smaller glacial lakes, streams and wetlandssouth of permanent permafrost and towards the southern extent of Wisconsin glaciation. We emphasize lakes andquantitative implications. The region is warmer and wetter than it has been over most of the last 12 000 years. Since 1911observed air temperatures have increased by about 0.118C per decade in spring and 0.068C in winter; annual precipitationhas increased by about 2.1% per decade. Ice thaw phenologies since the 1850s indicate a late winter warming of about2.58C. In future scenarios for a doubled CO2 climate, air temperature increases in summer and winter and precipitationdecreases (summer) in western Ontario but increases (winter) in western Ontario, northern Minnesota, Wisconsin andMichigan. Such changes in climate have altered and would further alter hydrological and other physical features of lakes.Warmer climates, i.e. 2� CO2 climates, would lower net basin water supplies, stream ¯ows and water levels owing toincreased evaporation in excess of precipitation. Water levels have been responsive to drought and future scenarios forthe Great Lakes simulate levels 0.2 to 2.5 m lower. Human adaptation to such changes is expensive. Warmer climateswould decrease the spatial extent of ice cover on the Great Lakes; small lakes, especially to the south, would no longerfreeze over every year. Temperature simulations for strati®ed lakes are 1±78C warmer for surface waters, and 68C coolerto 88C warmer for deep waters. Thermocline depth would change (4 m shallower to 3.5 m deeper) with warmer climatesalone; deepening owing to increases in light penetration would occur with reduced input of dissolved organic carbon(DOC) from dryer catchments. Dissolved oxygen would decrease below the thermocline. These physical changes wouldin turn a�ect the phytoplankton, zooplankton, benthos and ®shes. Annual phytoplankton production may increase butmany complex reactions of the phytoplankton community to altered temperatures, thermocline depths, light penetra-tions and nutrient inputs would be expected. Zooplankton biomass would increase, but, again, many complex inter-actions are expected.Generally, the thermal habitat for warm-, cool- and even cold-water ®shes would increase in size in deep strati®ed
lakes, but would decrease in shallow unstrati®ed lakes and in streams. Less dissolved oxygen below the thermocline oflakes would further degrade strati®ed lakes for cold water ®shes. Growth and production would increase for ®shes thatare now in thermal environments cooler than their optimum but decrease for those that are at or above their optimum,provided they cannot move to a deeper or headwater thermal refuge. The zoogeographical boundary for ®sh speciescould move north by 500±600 km; invasions of warmer water ®shes and extirpations of colder water ®shes shouldincrease. Aquatic ecosystems across the region do not necessarily exhibit coherent responses to climate changes andvariability, even if they are in close proximity. Lakes, wetlands and streams respond di�erently, as do lakes of di�erentdepth or productivity. Di�erences in hydrology and the position in the hydrological ¯ow system, in terrestrial vegetationand land use, in base climates and in the aquatic biota can all cause di�erent responses. Climate change e�ects interactstrongly with e�ects of other human-caused stresses such as eutrophication, acid precipitation, toxic chemicals and thespread of exotic organisms. Aquatic ecological systems in the region are sensitive to climate change and variation.
CCC 0885±6087/97/080825±47$17.50 Received 15 February 1996# 1997 by John Wiley & Sons, Ltd. Accepted 17 June 1996
HYDROLOGICAL PROCESSES, VOL. 11, 825±871 (1997)
Assessments of these potential e�ects are in an early stage and contain many uncertainties in the models and propertiesof aquatic ecological systems and of the climate system. # 1997 by John Wiley & Sons, Ltd.
Hydrological Processes, vol. 11, 825±871 (1997)
(No. of Figures: 20 No. of Tables: 3 No. of Refs: 222)
KEY WORDS Laurentian Great Lakes; Precambrian Shield; climate change; aquatic systems; north temperate glaciallakes; hydrology; paleoclimates; lake ice; water level; physical limnology; chemical limnology; phyto-plankton; zooplankton; ®sh; terrestrial-aquatic linkages; interaction with other stresses; heterogeneityin response; biogeochemistry
INTRODUCTION
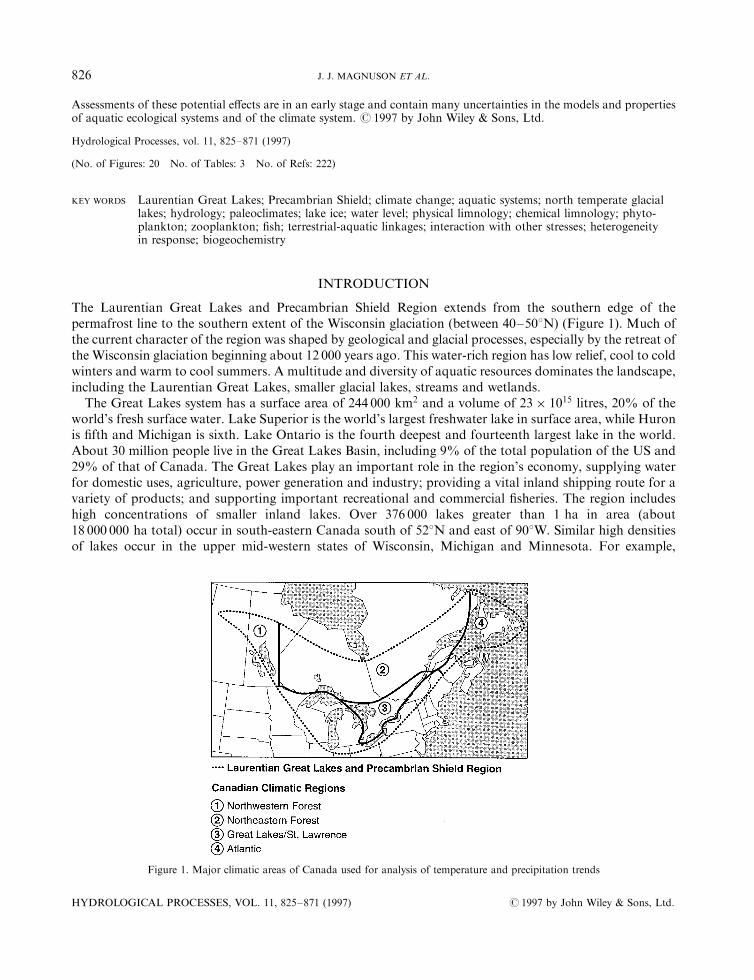
The Laurentian Great Lakes and Precambrian Shield Region extends from the southern edge of thepermafrost line to the southern extent of the Wisconsin glaciation (between 40±508N) (Figure 1). Much ofthe current character of the region was shaped by geological and glacial processes, especially by the retreat ofthe Wisconsin glaciation beginning about 12 000 years ago. This water-rich region has low relief, cool to coldwinters and warm to cool summers. A multitude and diversity of aquatic resources dominates the landscape,including the Laurentian Great Lakes, smaller glacial lakes, streams and wetlands.
The Great Lakes system has a surface area of 244 000 km2 and a volume of 23� 1015 litres, 20% of theworld's fresh surface water. Lake Superior is the world's largest freshwater lake in surface area, while Huronis ®fth and Michigan is sixth. Lake Ontario is the fourth deepest and fourteenth largest lake in the world.About 30 million people live in the Great Lakes Basin, including 9% of the total population of the US and29% of that of Canada. The Great Lakes play an important role in the region's economy, supplying waterfor domestic uses, agriculture, power generation and industry; providing a vital inland shipping route for avariety of products; and supporting important recreational and commercial ®sheries. The region includeshigh concentrations of smaller inland lakes. Over 376 000 lakes greater than 1 ha in area (about18 000 000 ha total) occur in south-eastern Canada south of 528N and east of 908W. Similar high densitiesof lakes occur in the upper mid-western states of Wisconsin, Michigan and Minnesota. For example,
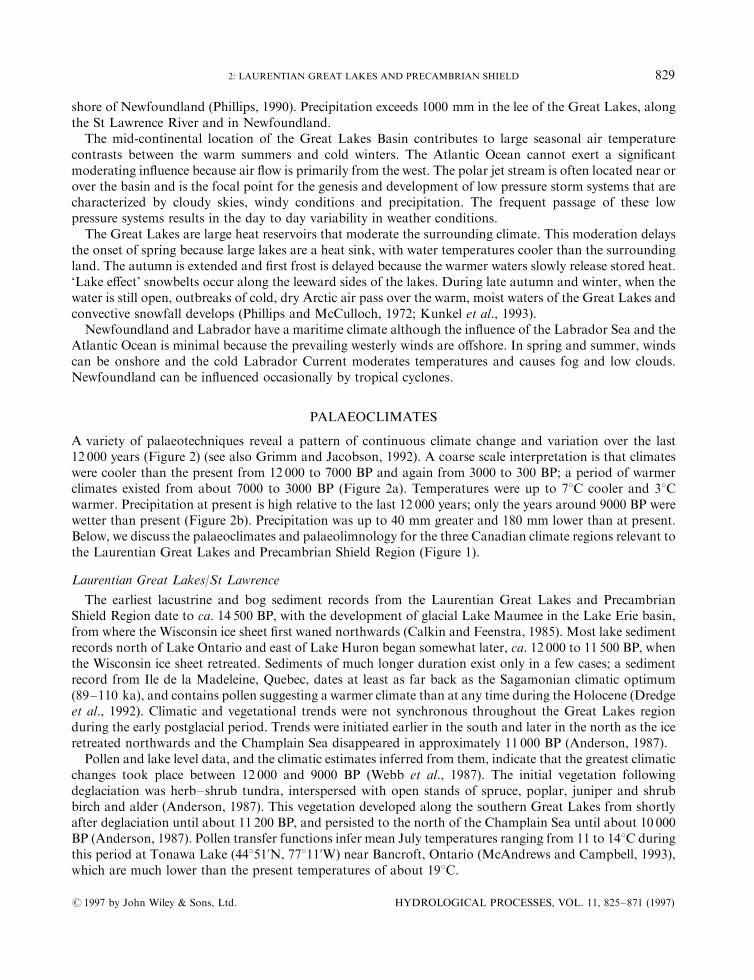
Figure 1. Major climatic areas of Canada used for analysis of temperature and precipitation trends
HYDROLOGICAL PROCESSES, VOL. 11, 825±871 (1997) # 1997 by John Wiley & Sons, Ltd.
826 J. J. MAGNUSON ET AL.
Wisconsin alone has 12 500 natural lakes covering 140 000 ha (Wisconsin Department of NaturalResources, 1995), or, on a smaller scale, nearly 2500 lakes occur in Vilas and Oneida Counties, Wisconsin,where they cover about 12% of the landscape. Wisconsin also contains about 2 000 000 ha of wetlands andperhaps 53 000 km of streams. These are important components of the landscape that are strong attractorsfor humans.
The physical, chemical and biological processes and attributes of these systems are sensitive to climatechange as are the values placed on these aquatic systems by humans. Two overarching considerations shapedour thoughts; ®rst, the wide array of limnological processes and phenomena expected to be in¯uenced byclimate changes; and, secondly, the heterogeneity or di�erences in responses expected among water bodies.Our interests were also drawn to quantitative estimates over qualitative ones. Our review builds on generaloverviews of the potential changes in aquatic ecosystems related to climatic warming (J. B. Smith, 1991;Carpenter et al., 1992; Arnell et al., 1996). We address potential changes in the climate itself; physicallimnology, including ice phenologies, water temperatures and mixing regimes; hydrology, with respect towater levels, runo�, weathering and residence times; light availability, with respect to changes in waterclarity; chemical limnology, such as dissolved organic carbon concentrations, nutrient availability and deepwater oxygen concentrations; and distribution, growth and persistence of the fauna and ¯ora. Watershed-and lake-speci®c factors were identi®ed as being key in determining the heterogeneity of response betweenwaters. Even adjacent lakes can respond di�erently owing to di�erences in morphology and position in thehydrological ¯ow system.
PRESENT CLIMATE
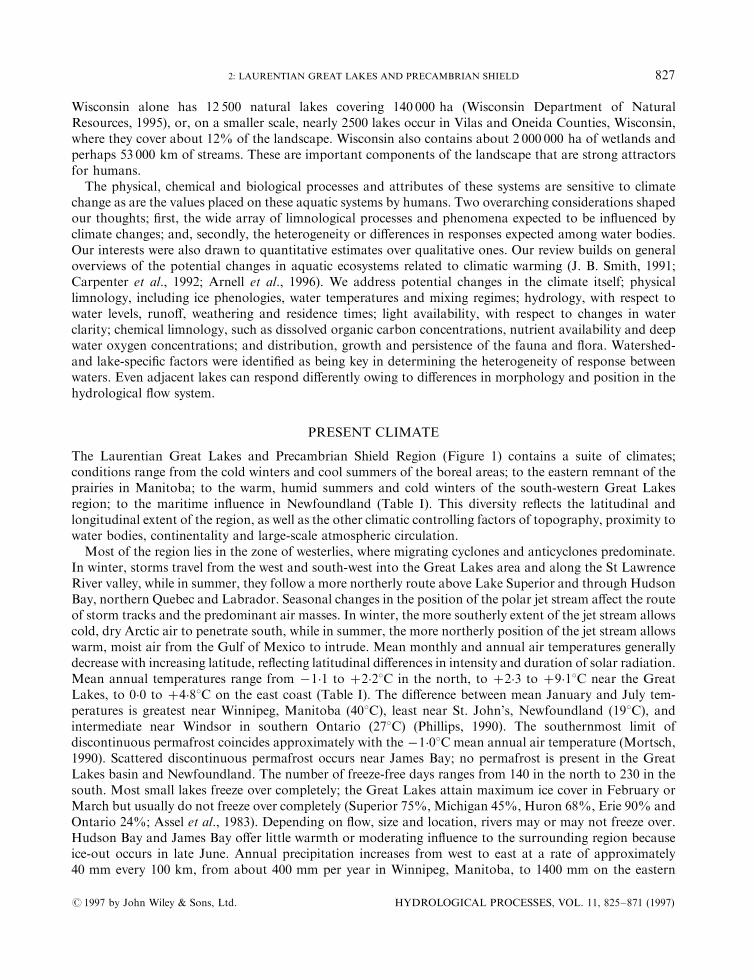
The Laurentian Great Lakes and Precambrian Shield Region (Figure 1) contains a suite of climates;conditions range from the cold winters and cool summers of the boreal areas; to the eastern remnant of theprairies in Manitoba; to the warm, humid summers and cold winters of the south-western Great Lakesregion; to the maritime in¯uence in Newfoundland (Table I). This diversity re¯ects the latitudinal andlongitudinal extent of the region, as well as the other climatic controlling factors of topography, proximity towater bodies, continentality and large-scale atmospheric circulation.
Most of the region lies in the zone of westerlies, where migrating cyclones and anticyclones predominate.In winter, storms travel from the west and south-west into the Great Lakes area and along the St LawrenceRiver valley, while in summer, they follow a more northerly route above Lake Superior and through HudsonBay, northern Quebec and Labrador. Seasonal changes in the position of the polar jet stream a�ect the routeof storm tracks and the predominant air masses. In winter, the more southerly extent of the jet stream allowscold, dry Arctic air to penetrate south, while in summer, the more northerly position of the jet stream allowswarm, moist air from the Gulf of Mexico to intrude. Mean monthly and annual air temperatures generallydecrease with increasing latitude, re¯ecting latitudinal di�erences in intensity and duration of solar radiation.Mean annual temperatures range from ÿ1�1 to �2�28C in the north, to �2�3 to �9�18C near the GreatLakes, to 0.0 to �4�88C on the east coast (Table I). The di�erence between mean January and July tem-peratures is greatest near Winnipeg, Manitoba (408C), least near St. John's, Newfoundland (198C), andintermediate near Windsor in southern Ontario (278C) (Phillips, 1990). The southernmost limit ofdiscontinuous permafrost coincides approximately with the ÿ1�08C mean annual air temperature (Mortsch,1990). Scattered discontinuous permafrost occurs near James Bay; no permafrost is present in the GreatLakes basin and Newfoundland. The number of freeze-free days ranges from 140 in the north to 230 in thesouth. Most small lakes freeze over completely; the Great Lakes attain maximum ice cover in February orMarch but usually do not freeze over completely (Superior 75%, Michigan 45%, Huron 68%, Erie 90% andOntario 24%; Assel et al., 1983). Depending on ¯ow, size and location, rivers may or may not freeze over.Hudson Bay and James Bay o�er little warmth or moderating in¯uence to the surrounding region becauseice-out occurs in late June. Annual precipitation increases from west to east at a rate of approximately40 mm every 100 km, from about 400 mm per year in Winnipeg, Manitoba, to 1400 mm on the eastern
# 1997 by John Wiley & Sons, Ltd. HYDROLOGICAL PROCESSES, VOL. 11, 825±871 (1997)
2: LAURENTIAN GREAT LAKES AND PRECAMBRIAN SHIELD 827
Table I. Current climate statistics for sites in, or somewhat north of, the Great Lakes and Laurentian Shield Region. Data are from AtmosphericEnvironment Service (1982a±f) and McIver and Isaac (1989)
Climate station Location Mean Mean Mean Mean Mean Mean Total Total Total Totalannual January July annual annual annual annual annual January Julydaily temp. temp. freeze-free growing growing precip. snowfall precip. precip.temp. (8C) (8C) days season degree±days (mm) (cm) (mm) (mm)(8C) (days) (days) (8C)
ManitobaWinnipeg Int'l A 49854'N 97814'W 2.2 ÿ19�3 19.6 170 159 1784.9 525.5 125.5 21.3 75.9
OntarioMoosonee 51816'N 80839'W ÿ1�1 ÿ20�4 15.3 139 123 1107.4 727.7 239.3 40.7 95.9Thunder Bay A 48822'N 89819'W 2.3 ÿ15�4 17.6 161 147 1425.4 711.8 213.0 40.9 75.4Wiarton 44845'N 81806'W 6.0 ÿ7�1 18.5 141 N/A 1821.0 964.7 352.6 97.0 75.1Windsor A 42816'N 82858'W 9.1 ÿ4�9 22.2 231 213 2533.3 848.8 117.4 55.0 83.4
QuebecSept-Isles A 50813'N 66816'W 1.1 ÿ14�0 15.2 158 135 1015.6 1124.9 426.9 95.5 97.0
NewfoundlandSt John's A 47837'N 52845'W 4.8 ÿ3�9 15.5 189 169 1196.1 1513.6 359.4 155.8 75.3Goose (Bay) A 53819'N 60825'W 0.0 ÿ16�4 15.8 151 135 1021.9 946.1 445.2 74.4 105.1
HYDROLOGIC
AL
PROCESSES,VOL.11,825±871(1997)
#1997byJohnWiley
&Sons,Ltd.
828
J.J.
MAGNUSON
ETAL.
shore of Newfoundland (Phillips, 1990). Precipitation exceeds 1000 mm in the lee of the Great Lakes, alongthe St Lawrence River and in Newfoundland.
The mid-continental location of the Great Lakes Basin contributes to large seasonal air temperaturecontrasts between the warm summers and cold winters. The Atlantic Ocean cannot exert a signi®cantmoderating in¯uence because air ¯ow is primarily from the west. The polar jet stream is often located near orover the basin and is the focal point for the genesis and development of low pressure storm systems that arecharacterized by cloudy skies, windy conditions and precipitation. The frequent passage of these lowpressure systems results in the day to day variability in weather conditions.The Great Lakes are large heat reservoirs that moderate the surrounding climate. This moderation delays
the onset of spring because large lakes are a heat sink, with water temperatures cooler than the surroundingland. The autumn is extended and ®rst frost is delayed because the warmer waters slowly release stored heat.`Lake e�ect' snowbelts occur along the leeward sides of the lakes. During late autumn and winter, when thewater is still open, outbreaks of cold, dry Arctic air pass over the warm, moist waters of the Great Lakes andconvective snowfall develops (Phillips and McCulloch, 1972; Kunkel et al., 1993).Newfoundland and Labrador have a maritime climate although the in¯uence of the Labrador Sea and the
Atlantic Ocean is minimal because the prevailing westerly winds are o�shore. In spring and summer, windscan be onshore and the cold Labrador Current moderates temperatures and causes fog and low clouds.Newfoundland can be in¯uenced occasionally by tropical cyclones.
PALAEOCLIMATES
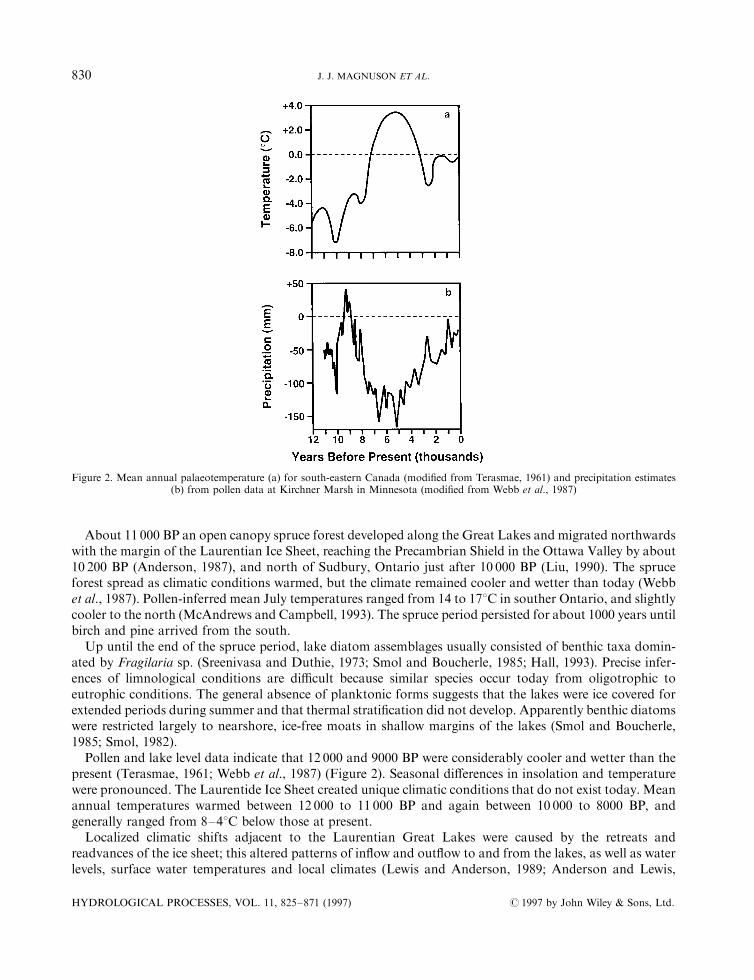
A variety of palaeotechniques reveal a pattern of continuous climate change and variation over the last12 000 years (Figure 2) (see also Grimm and Jacobson, 1992). A coarse scale interpretation is that climateswere cooler than the present from 12 000 to 7000 BP and again from 3000 to 300 BP; a period of warmerclimates existed from about 7000 to 3000 BP (Figure 2a). Temperatures were up to 78C cooler and 38Cwarmer. Precipitation at present is high relative to the last 12 000 years; only the years around 9000 BP werewetter than present (Figure 2b). Precipitation was up to 40 mm greater and 180 mm lower than at present.Below, we discuss the palaeoclimates and palaeolimnology for the three Canadian climate regions relevant tothe Laurentian Great Lakes and Precambrian Shield Region (Figure 1).
Laurentian Great Lakes/St Lawrence
The earliest lacustrine and bog sediment records from the Laurentian Great Lakes and PrecambrianShield Region date to ca. 14 500 BP, with the development of glacial Lake Maumee in the Lake Erie basin,from where the Wisconsin ice sheet ®rst waned northwards (Calkin and Feenstra, 1985). Most lake sedimentrecords north of Lake Ontario and east of Lake Huron began somewhat later, ca. 12 000 to 11 500 BP, whenthe Wisconsin ice sheet retreated. Sediments of much longer duration exist only in a few cases; a sedimentrecord from Ile de la Madeleine, Quebec, dates at least as far back as the Sagamonian climatic optimum(89±110 ka), and contains pollen suggesting a warmer climate than at any time during the Holocene (Dredgeet al., 1992). Climatic and vegetational trends were not synchronous throughout the Great Lakes regionduring the early postglacial period. Trends were initiated earlier in the south and later in the north as the iceretreated northwards and the Champlain Sea disappeared in approximately 11 000 BP (Anderson, 1987).
Pollen and lake level data, and the climatic estimates inferred from them, indicate that the greatest climaticchanges took place between 12 000 and 9000 BP (Webb et al., 1987). The initial vegetation followingdeglaciation was herb±shrub tundra, interspersed with open stands of spruce, poplar, juniper and shrubbirch and alder (Anderson, 1987). This vegetation developed along the southern Great Lakes from shortlyafter deglaciation until about 11 200 BP, and persisted to the north of the Champlain Sea until about 10 000BP (Anderson, 1987). Pollen transfer functions infer mean July temperatures ranging from 11 to 148C duringthis period at Tonawa Lake (44851'N, 77811'W) near Bancroft, Ontario (McAndrews and Campbell, 1993),which are much lower than the present temperatures of about 198C.
# 1997 by John Wiley & Sons, Ltd. HYDROLOGICAL PROCESSES, VOL. 11, 825±871 (1997)
2: LAURENTIAN GREAT LAKES AND PRECAMBRIAN SHIELD 829
About 11 000 BP an open canopy spruce forest developed along the Great Lakes and migrated northwardswith the margin of the Laurentian Ice Sheet, reaching the Precambrian Shield in the Ottawa Valley by about10 200 BP (Anderson, 1987), and north of Sudbury, Ontario just after 10 000 BP (Liu, 1990). The spruceforest spread as climatic conditions warmed, but the climate remained cooler and wetter than today (Webbet al., 1987). Pollen-inferred mean July temperatures ranged from 14 to 178C in souther Ontario, and slightlycooler to the north (McAndrews and Campbell, 1993). The spruce period persisted for about 1000 years untilbirch and pine arrived from the south.
Up until the end of the spruce period, lake diatom assemblages usually consisted of benthic taxa domin-ated by Fragilaria sp. (Sreenivasa and Duthie, 1973; Smol and Boucherle, 1985; Hall, 1993). Precise infer-ences of limnological conditions are di�cult because similar species occur today from oligotrophic toeutrophic conditions. The general absence of planktonic forms suggests that the lakes were ice covered forextended periods during summer and that thermal strati®cation did not develop. Apparently benthic diatomswere restricted largely to nearshore, ice-free moats in shallow margins of the lakes (Smol and Boucherle,1985; Smol, 1982).
Pollen and lake level data indicate that 12 000 and 9000 BP were considerably cooler and wetter than thepresent (Terasmae, 1961; Webb et al., 1987) (Figure 2). Seasonal di�erences in insolation and temperaturewere pronounced. The Laurentide Ice Sheet created unique climatic conditions that do not exist today. Meanannual temperatures warmed between 12 000 to 11 000 BP and again between 10 000 to 8000 BP, andgenerally ranged from 8±48C below those at present.Localized climatic shifts adjacent to the Laurentian Great Lakes were caused by the retreats and
readvances of the ice sheet; this altered patterns of in¯ow and out¯ow to and from the lakes, as well as waterlevels, surface water temperatures and local climates (Lewis and Anderson, 1989; Anderson and Lewis,
Figure 2. Mean annual palaeotemperature (a) for south-eastern Canada (modi®ed from Terasmae, 1961) and precipitation estimates(b) from pollen data at Kirchner Marsh in Minnesota (modi®ed from Webb et al., 1987)
HYDROLOGICAL PROCESSES, VOL. 11, 825±871 (1997) # 1997 by John Wiley & Sons, Ltd.
830 J. J. MAGNUSON ET AL.
1992). Lake Agassiz discharged cold glacial meltwater eastwards through the Great Lakes and the Gulf ofSt Lawrence during two distinct periods, 11 000±10 500 and 9600±8300 BP, when the Laurentide Ice Sheetmigrated northwards (Teller and Thorliefson, 1983; Teller, 1985). Cold meltwater ¯owing into the GreatLakes most likely increased several-fold, cooled surface waters (Lewis and Anderson, 1989), cooled localclimates and reduced the growing season around the upper Great Lakes and Gulf of St Lawrence (Lewis andAnderson, 1989, 1992).
Pollen assemblages and, thus, climatic and edaphic conditions, became largely synchronous everywhere inthe Great Lakes/St. Lawrence area after 9500 BP, when a closed pine forest developed in response to awarmer and drier climate (Anderson, 1987). In southern Ontario, pollen-inferred July temperatures averaged19±218C, similar to those of today (McAndrews and Campbell, 1993). The warmer temperatures probablyextended the growing season of phytoplankton in the deep water regions of lakes (Smol and Boucherle,1985), and permitted planktonic diatom and chrysophyte communities to develop. Lake nutrientconcentrations were low because watershed nutrient release was low from the immature pine forest.The Hypsithermal, or mid-Holocene warm period, occurred between 8000 and 4000 BP. The pollen±
climate transfer functions of Bartlein and Webb (1985) and Bartlein and Whitlock (1993, in Yu andMcAndrews, 1994) indicated mean July temperatures 1±28C warmer, and precipitation 10±20% less than atpresent. These conditions permitted hemlock, beech and thermophilous hardwood taxa (including maple,elm and oak) to migrate into southern Ontario. By 7500 BP, a forest similar to the present Great Lakes/StLawrence forest became established in the southern parts of the region (Rowe, 1977). Independent evidencefrom stable isotopes (Edwards and Fritz, 1988) and lower lake levels (Webb et al., 1987; Yu andMcAndrews,1994) also indicated a warm/dry climate between 7400 and 4000 BP.
About 3500 BP, during the Neoglacial cooling, the climate became cooler and moister (Anderson, 1989).Palaeoecological evidence for this cooling is not straightforward in the Great Lakes/St Lawrence region.Pollen-inferred temperatures did not decline at this time in southern Ontario (McAndrews and Campbell,1993) but palaeolimnological evidence indicates that water levels rose in Rice Lake, which is attributable tocooler and wetter conditions as well as continued isostatic uplift (Yu and McAndrews, 1994). Perhaps thebest evidence for Neoglacial cooling comes from sites farther north in the boreal forest, where the ecotonalboundary shifted southwards (see below).
Campbell and McAndrews (1991, 1993) presented pollen stratigraphical evidence of the Little Ice Agecooling between 1450 and 1850 AD; beech pollen declined at its northern limit just south of Lake Nippissing,and the climate optimum for white pine shifted 100±140 km southwards. Pollen transfer functions inferredthat mean July temperatures declined by about 0.58C during this period at Tonawa Lake, near Bancroft,Ontario.
North-eastern forest
A steep climatic gradient and ecotonal boundary between the boreal and Great Lakes/St Lawrence forestexists between Lake Huron and James Bay (Liu, 1990). Its position is controlled by continent-scaleatmospheric circulation that determines the position of the arctic front. Thus, the boundary shifted markedlywith postglacial climatic changes (Liu, 1990); climatic shifts did not occur synchronously across the entirearea.
Lake sedimentation began after 10 000 BP, later than in the Great Lakes/St Lawrence area, because theglacier retreated later. Spruce forests began about 9500 BP near the southern edge of the area (Nina Lake,46836'N, 81830'W; Liu, 1990) and was delayed until about 7500 BP 220 km farther north (Lake Six, 48824'N,81819'W). The pine forest was also delayed relative to more southern sites. Pollen pro®les near Sudbury andSault Ste. Marie inferred relatively rapid increases in mean July temperatures, from 16 to 198C, in the pineperiod (McAndrews and Campbell, 1993). Jack pine forest development occurred later at sites farther north,beginning about 9000 BP at Nina Lake, and not until about 7000 BP at Lake Six (Liu, 1990). The period ofjack pine forest was shorter at more northern sites, as white pine became established and dominanteverywhere by about 7000 BP (Liu, 1990).
# 1997 by John Wiley & Sons, Ltd. HYDROLOGICAL PROCESSES, VOL. 11, 825±871 (1997)
2: LAURENTIAN GREAT LAKES AND PRECAMBRIAN SHIELD 831
Hypsithermal warming caused a marked northward migration of the boundary between the boreal andGreat Lakes forests. By 7400 BP this ecotone had migrated north of Sudbury (Nina Lake). By 3000 BP theboundary advanced to its northernmost position of the entire postglacial period, i.e. 140 km north of itspresent position (Liu, 1990). Southward movement of the boundary in the area north of Sudbury providesstrong evidence for Neoglacial cooling (Liu, 1990). The boundary migrated pass Lake Six (to the north)about 4000 BP and Nina Lake (to the south) about 2500 BP. Pollen-inferred mean July temperature droppedabout 0.5±18C both at Lake QC (46850'N, 80842'W) near Sudbury and R Lake (54818'N, 84834'W) near thenorth-western edge of James Bay (McAndrews and Campbell, 1993).
Atlantic
The timing and nature of climatic and vegetational shifts in eastern maritime Canada were somewhatdi�erent from Quebec and Ontario, possibly owing to oceanic in¯uences and di�erent soil development.Sediment records in New Brunswick and Nova Scotia began just before 12 500 BP (Wilson et al., 1993).Pollen stratigraphies indicated that the region was initially colonized by herb±shrub tundra. Prior to11 000 BP, spruce trees became established, but appeared unable to colonize sites with direct exposure tooceanic weather, i.e. Brier Island Bog Lake (Wilson et al., 1993). Pollen pro®les typically showed a declinein spruce abundance and an increase in tundra-like vegetation (Mott et al., 1986) in the cool YoungerDryas (ca. 11 000±10 000 BP). Based on reconstructions using chironomid assemblages, Wilson et al.(1993) approximated midsummer water temperatures at 17±208C prior to the Younger Dryas (before11 000 BP) at Brier Island Bog Lake, Nova Scotia, and at Splan Lake, New Brunswick. During theYounger Dryas midsummer, water temperatures dropped to 13±168C, and subsequently increased after10 000 BP to 20±248C (Wilson et al., 1993). Diatom assemblages indicated that the lakes supportedseasonally ice-free, open water, and possibly turbulent, wind-mixed conditions during the Younger Dryas(Wilson et al., 1993).
In Labrador, initial vegetation developed between 10 500 and 9500 BP, and consisted of an open tundradominated by sedges, grasses, herbs and shrubs (Engstrom and Hansen, 1985). The climate was cold, butgenerally warmer than present day tundra. From 9500 to 8000 BP, shrub taxa, including birch and alder,increased, creating a vegetation similar to the shrub tundra that exists today. Continuous vegetation changesoccurred from 8000 to 6000 BP owing to the sequential rise and replacement of Labrador's major treespecies. White spruce arrived at ca. 8000 BP, substantially later relative to sites farther south along the Gulfof St Lawrence where spruce appeared between 10 000 and 9000 BP (Engstrom and Hansen, 1985). This shiftwas attributed to progressive changes in soil conditions, towards more waterlogged peat, rather than toclimatic factors.
A relatively stable pollen assemblage characteristic of the present boreal forest has persisted in Labradorfrom 6000 BP to present. However, pollen and geochemical evidence indicated a regional shift to colderconditions after 4000 BP, resulting in decreased tree density and thinner soil humus (Engstrom and Hansen,1985). Interior sites were more strongly a�ected than coastal ones. This cooling, which began between 4000and 3000 BP, corresponds with the period of Neoglacial cooling detected at a number of sites in theLaurentian Great Lakes and Precambrian Shield Region.
RECENT CLIMATE TRENDS
Four climatic regions delineated for analysis of the Canadian climate include portions of the LaurentianGreat Lakes and Precambrian Shield Region; these are the North western Forest, the North eastern Forest,the Great Lakes/St Lawrence and the Atlantic (Figure 1). Daily temperature and precipitation (Mekis andHogg, 1997) and monthly temperature and precipitation (Gullett et al., 1992) data sets were developed toanalyse climate trends across Canada. The daily data were a contribution to the 1995 IntergovernmentalPanel on Climate Change (IPCC) report and the monthly data comprise the Historical Canadian ClimateDatabase (HCCD). Daily precipitation data were corrected for under catch from wind and other factors,
HYDROLOGICAL PROCESSES, VOL. 11, 825±871 (1997) # 1997 by John Wiley & Sons, Ltd.
832 J. J. MAGNUSON ET AL.
wetting loss, trace value correction and instrumentation changes (Mekis and Hogg, 1997; Metcalfe et al.,1994). Monthly precipitation data were not corrected. Monthly temperature data were adjusted to accountfor discontinuities or `inhomogeneities' from changes in observing programme, instrumentation, siteconditions and other non-climatic e�ects (Gullet et al., 1992; Skinner and Gullet, 1993). For both data sets,methodologies were developed for joining observation records of nearby stations to extend the time-series.Missing values were estimated (Gullet et al., 1992; Mekis and Hogg, 1997). Monthly temperature and dailyprecipitation data were selected to provide the most reliable time-series. The 83 years from 1911 to 1993generally comprised the daily precipitation time-series, while 1895±1993 were used for temperature time-series. In addition, for major Great Lake basins, we examined precipitation and temperature trends from1900 to 1990. Two primary hydrometeorological variables a�ecting the Great Lakes/St Lawrence RiverBasin ecosystem are precipitation and air temperature. Monthly precipitation data (Croley and Hunter,1994) were based on US Lake Survey District, Corps of Engineers areally weighted `precipitation districts'for 1900±1929 (Quinn and Norton, 1982); a modi®ed Thiessen approach using a 5-km grid for 1930±1947(Quinn and Norton, 1982); and a Thiessen weighting approach using a 1-km grid and daily data for1948±1990 (Croley and Hartmann, 1985). Air temperature data were an update of Bolsenga and Norton(1993) from gridded data of quality controlled land stations for the Great Lakes Basin. Primary sources werethe Carbon Dioxide Information Analysis Center and the Canadian Climate Centre.Annual and seasonal temperature and precipitation trends for each Canadian climate region (Figure 1)
within the Laurentian Great Lakes and Precambrian Shield, are summarized in Table II. Both the GreatLakes/St Lawrence and North eastern Forest areas show temperature and precipitation trends (Figure 3).An analysis of the linear trend in the temperature time-series for the Great Lakes/St Lawrence areaindicates an increase of 0.68C from 1895 to 1993. Weak oscillations are suggested from visual inspection,with the values peaking near 1950. For the North eastern Forest, temperature increased 0.48C from 1895 to1993; virtually all of the warming had occurred by 1940. Examination of seasonal data reveals that most ofthe increase in both areas was during the spring. The most signi®cant temperature increases occurred inspring and winter. Across the Great Lakes basin as a whole the long-term trend in annual temperature isweak and inconsistent over time (Figure 4). However, spring air temperatures over the basin have warmedpersistently, summer temperatures have a slow downward trend since the 1940s, autumn temperatures havedeclined since the 1960s and winter temperatures have been lower since the late 1950s (Bolsenga andNorton, 1993).
Precipitation trends are more variable in both the Great Lakes/St Lawrence (1911±1993) and the North-eastern Forest (1918±1993) (Figure 3, bottom). Annual precipitation increased 2.0 mm per decade, or 2.1%per decade, for the Great Lakes and 2.4% per decade for the North eastern Forest, corresponding to anincrease of 21±24% per century. These two areas demonstrate the largest absolute rate of change of the 11Canadian climatic regions. Scrutiny of both time-series (Figure 3, bottom) reveals that precipitation peakedin the late 1960s to early 1970s and has been declining since then.
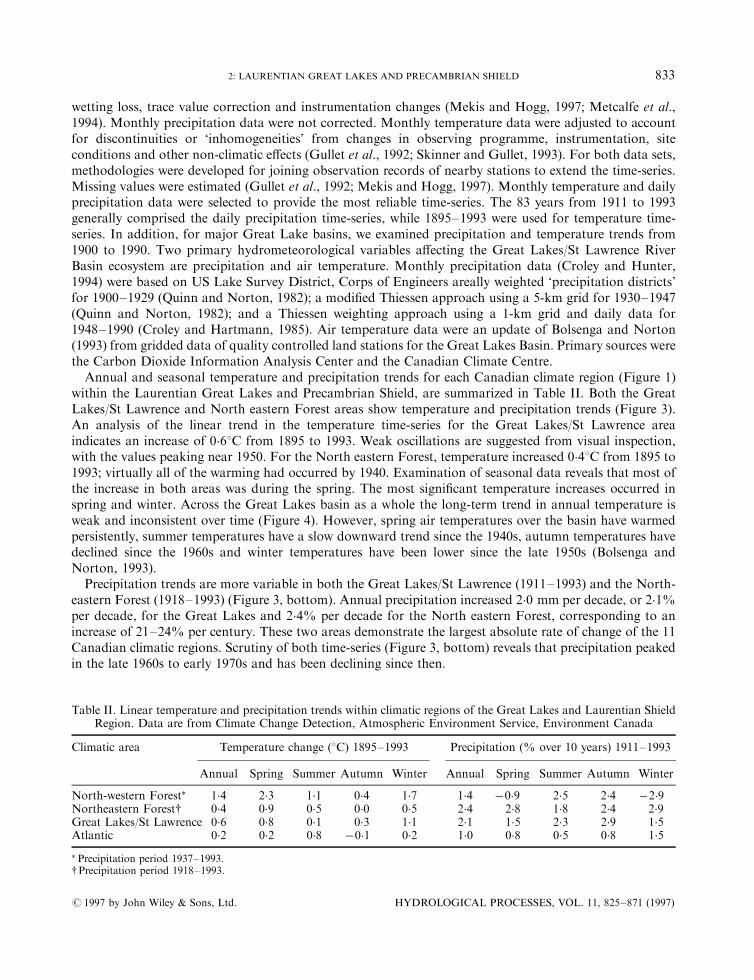
Table II. Linear temperature and precipitation trends within climatic regions of the Great Lakes and Laurentian ShieldRegion. Data are from Climate Change Detection, Atmospheric Environment Service, Environment Canada
Climatic area Temperature change (8C) 1895±1993 Precipitation (% over 10 years) 1911±1993
Annual Spring Summer Autumn Winter Annual Spring Summer Autumn Winter
North-western Forest� 1.4 2.3 1.1 0.4 1.7 1.4 ÿ0�9 2.5 2.4 ÿ2�9Northeastern Forest{ 0.4 0.9 0.5 0.0 0.5 2.4 2.8 1.8 2.4 2.9Great Lakes/St Lawrence 0.6 0.8 0.1 0.3 1.1 2.1 1.5 2.3 2.9 1.5Atlantic 0.2 0.2 0.8 ÿ0�1 0.2 1.0 0.8 0.5 0.8 1.5
� Precipitation period 1937±1993.{Precipitation period 1918±1993.
# 1997 by John Wiley & Sons, Ltd. HYDROLOGICAL PROCESSES, VOL. 11, 825±871 (1997)
2: LAURENTIAN GREAT LAKES AND PRECAMBRIAN SHIELD 833
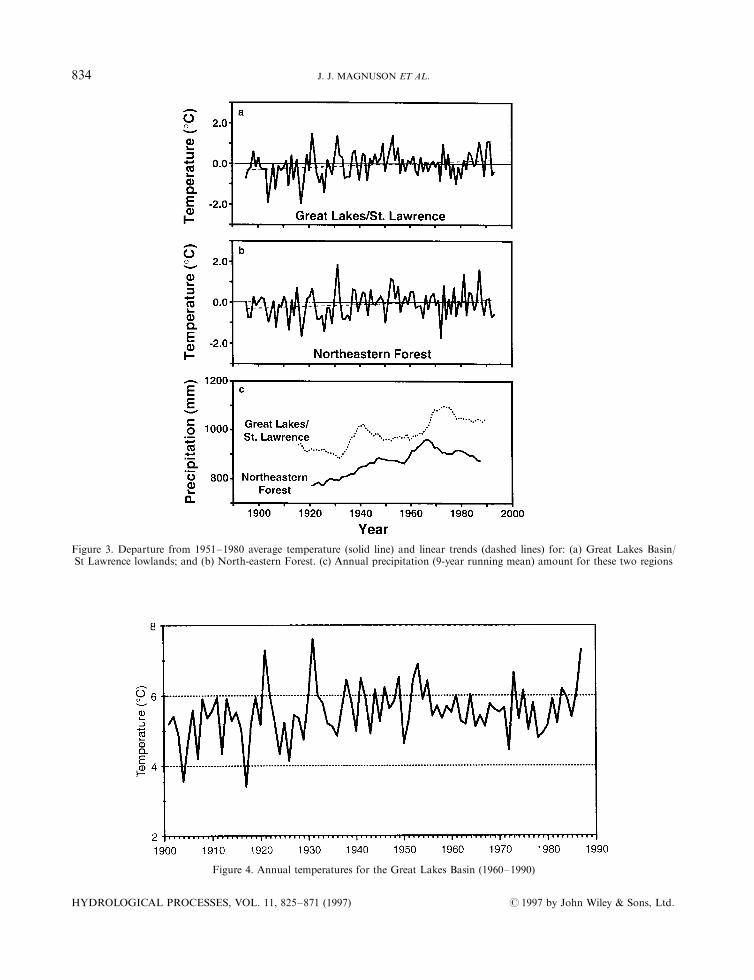
Figure 3. Departure from 1951±1980 average temperature (solid line) and linear trends (dashed lines) for: (a) Great Lakes Basin/St Lawrence lowlands; and (b) North-eastern Forest. (c) Annual precipitation (9-year running mean) amount for these two regions
Figure 4. Annual temperatures for the Great Lakes Basin (1960±1990)
HYDROLOGICAL PROCESSES, VOL. 11, 825±871 (1997) # 1997 by John Wiley & Sons, Ltd.
834 J. J. MAGNUSON ET AL.
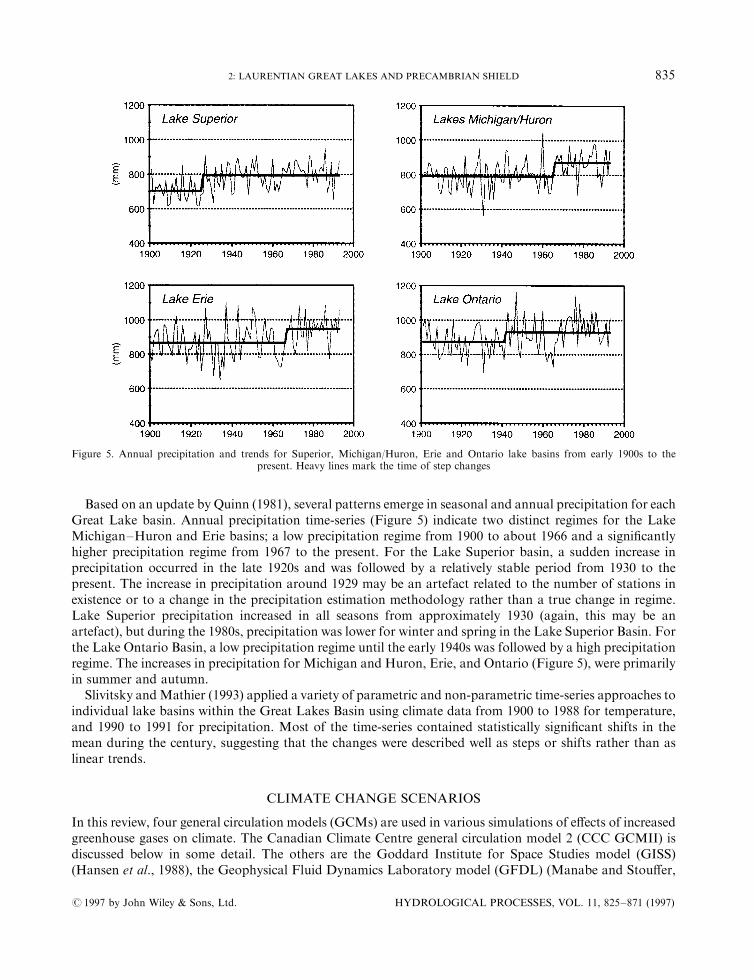
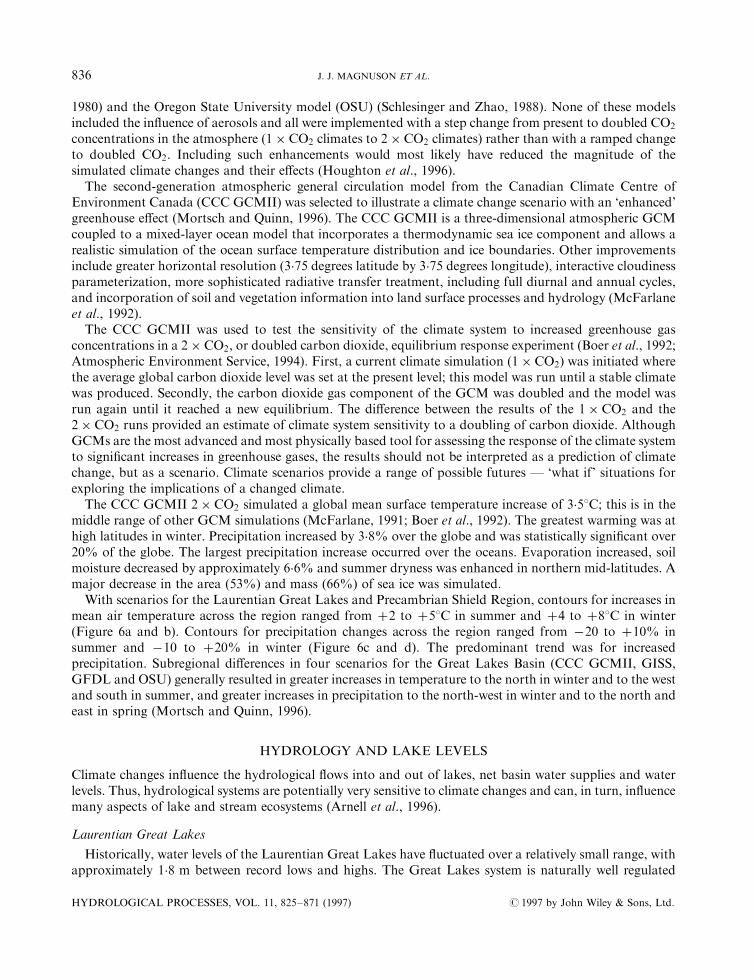
Based on an update by Quinn (1981), several patterns emerge in seasonal and annual precipitation for eachGreat Lake basin. Annual precipitation time-series (Figure 5) indicate two distinct regimes for the LakeMichigan±Huron and Erie basins; a low precipitation regime from 1900 to about 1966 and a signi®cantlyhigher precipitation regime from 1967 to the present. For the Lake Superior basin, a sudden increase inprecipitation occurred in the late 1920s and was followed by a relatively stable period from 1930 to thepresent. The increase in precipitation around 1929 may be an artefact related to the number of stations inexistence or to a change in the precipitation estimation methodology rather than a true change in regime.Lake Superior precipitation increased in all seasons from approximately 1930 (again, this may be anartefact), but during the 1980s, precipitation was lower for winter and spring in the Lake Superior Basin. Forthe Lake Ontario Basin, a low precipitation regime until the early 1940s was followed by a high precipitationregime. The increases in precipitation for Michigan and Huron, Erie, and Ontario (Figure 5), were primarilyin summer and autumn.
Slivitsky andMathier (1993) applied a variety of parametric and non-parametric time-series approaches toindividual lake basins within the Great Lakes Basin using climate data from 1900 to 1988 for temperature,and 1990 to 1991 for precipitation. Most of the time-series contained statistically signi®cant shifts in themean during the century, suggesting that the changes were described well as steps or shifts rather than aslinear trends.
CLIMATE CHANGE SCENARIOS
In this review, four general circulation models (GCMs) are used in various simulations of e�ects of increasedgreenhouse gases on climate. The Canadian Climate Centre general circulation model 2 (CCC GCMII) isdiscussed below in some detail. The others are the Goddard Institute for Space Studies model (GISS)(Hansen et al., 1988), the Geophysical Fluid Dynamics Laboratory model (GFDL) (Manabe and Stou�er,
Figure 5. Annual precipitation and trends for Superior, Michigan/Huron, Erie and Ontario lake basins from early 1900s to thepresent. Heavy lines mark the time of step changes
# 1997 by John Wiley & Sons, Ltd. HYDROLOGICAL PROCESSES, VOL. 11, 825±871 (1997)
2: LAURENTIAN GREAT LAKES AND PRECAMBRIAN SHIELD 835
1980) and the Oregon State University model (OSU) (Schlesinger and Zhao, 1988). None of these modelsincluded the in¯uence of aerosols and all were implemented with a step change from present to doubled CO2
concentrations in the atmosphere �1� CO2 climates to 2� CO2 climates) rather than with a ramped changeto doubled CO2. Including such enhancements would most likely have reduced the magnitude of thesimulated climate changes and their e�ects (Houghton et al., 1996).
The second-generation atmospheric general circulation model from the Canadian Climate Centre ofEnvironment Canada (CCC GCMII) was selected to illustrate a climate change scenario with an `enhanced'greenhouse e�ect (Mortsch and Quinn, 1996). The CCC GCMII is a three-dimensional atmospheric GCMcoupled to a mixed-layer ocean model that incorporates a thermodynamic sea ice component and allows arealistic simulation of the ocean surface temperature distribution and ice boundaries. Other improvementsinclude greater horizontal resolution (3.75 degrees latitude by 3.75 degrees longitude), interactive cloudinessparameterization, more sophisticated radiative transfer treatment, including full diurnal and annual cycles,and incorporation of soil and vegetation information into land surface processes and hydrology (McFarlaneet al., 1992).
The CCC GCMII was used to test the sensitivity of the climate system to increased greenhouse gasconcentrations in a 2� CO2, or doubled carbon dioxide, equilibrium response experiment (Boer et al., 1992;Atmospheric Environment Service, 1994). First, a current climate simulation �1� CO2� was initiated wherethe average global carbon dioxide level was set at the present level; this model was run until a stable climatewas produced. Secondly, the carbon dioxide gas component of the GCM was doubled and the model wasrun again until it reached a new equilibrium. The di�erence between the results of the 1� CO2 and the2� CO2 runs provided an estimate of climate system sensitivity to a doubling of carbon dioxide. AlthoughGCMs are the most advanced and most physically based tool for assessing the response of the climate systemto signi®cant increases in greenhouse gases, the results should not be interpreted as a prediction of climatechange, but as a scenario. Climate scenarios provide a range of possible futures Ð `what if' situations forexploring the implications of a changed climate.The CCC GCMII 2� CO2 simulated a global mean surface temperature increase of 3.58C; this is in the
middle range of other GCM simulations (McFarlane, 1991; Boer et al., 1992). The greatest warming was athigh latitudes in winter. Precipitation increased by 3.8% over the globe and was statistically signi®cant over20% of the globe. The largest precipitation increase occurred over the oceans. Evaporation increased, soilmoisture decreased by approximately 6.6% and summer dryness was enhanced in northern mid-latitudes. Amajor decrease in the area (53%) and mass (66%) of sea ice was simulated.
With scenarios for the Laurentian Great Lakes and Precambrian Shield Region, contours for increases inmean air temperature across the region ranged from �2 to �58C in summer and �4 to �88C in winter(Figure 6a and b). Contours for precipitation changes across the region ranged from ÿ20 to �10% insummer and ÿ10 to �20% in winter (Figure 6c and d). The predominant trend was for increasedprecipitation. Subregional di�erences in four scenarios for the Great Lakes Basin (CCC GCMII, GISS,GFDL and OSU) generally resulted in greater increases in temperature to the north in winter and to the westand south in summer, and greater increases in precipitation to the north-west in winter and to the north andeast in spring (Mortsch and Quinn, 1996).
HYDROLOGY AND LAKE LEVELS
Climate changes in¯uence the hydrological ¯ows into and out of lakes, net basin water supplies and waterlevels. Thus, hydrological systems are potentially very sensitive to climate changes and can, in turn, in¯uencemany aspects of lake and stream ecosystems (Arnell et al., 1996).
Laurentian Great Lakes
Historically, water levels of the Laurentian Great Lakes have ¯uctuated over a relatively small range, withapproximately 1.8 m between record lows and highs. The Great Lakes system is naturally well regulated
HYDROLOGICAL PROCESSES, VOL. 11, 825±871 (1997) # 1997 by John Wiley & Sons, Ltd.
836 J. J. MAGNUSON ET AL.
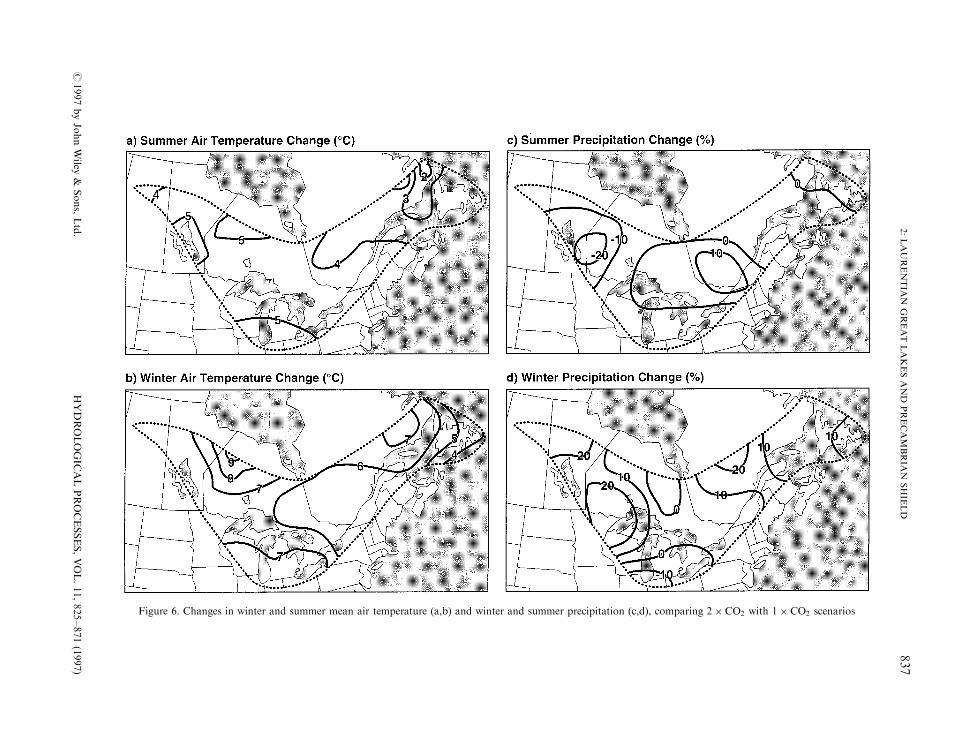
Figure 6. Changes in winter and summer mean air temperature (a,b) and winter and summer precipitation (c,d), comparing 2� CO2 with 1� CO2 scenarios
#1997byJohnWiley
&Sons,Ltd.
HYDROLOGIC
ALPROCESSES,VOL.11,825±871(1997)
2:LAURENTIA
NGREAT
LAKESAND
PRECAMBRIA
NSHIE
LD
837
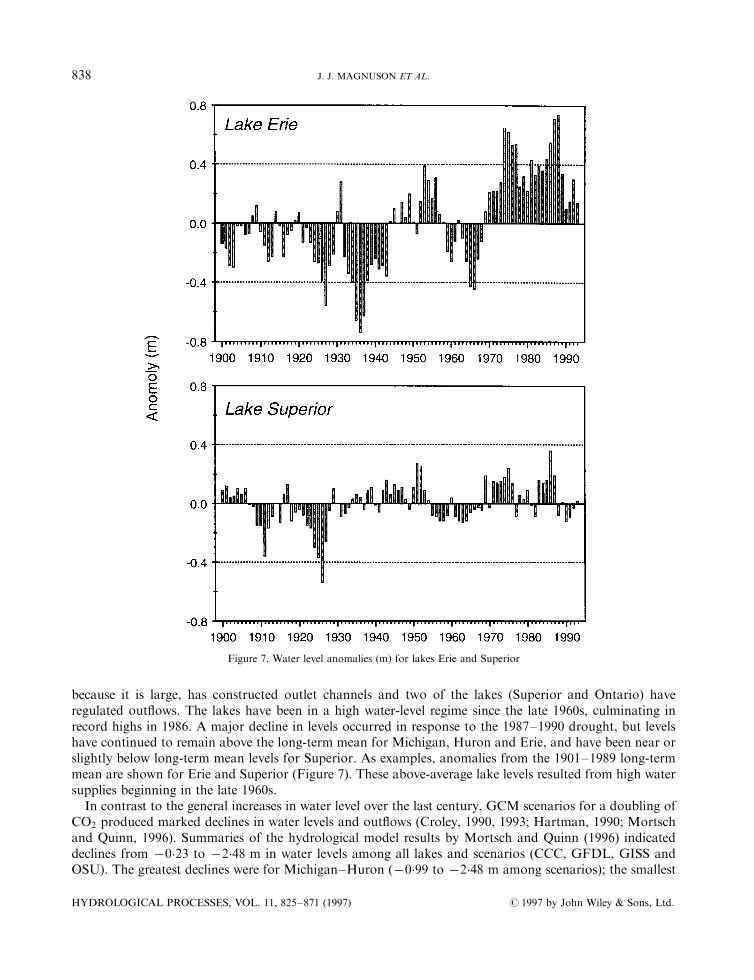
because it is large, has constructed outlet channels and two of the lakes (Superior and Ontario) haveregulated out¯ows. The lakes have been in a high water-level regime since the late 1960s, culminating inrecord highs in 1986. A major decline in levels occurred in response to the 1987±1990 drought, but levelshave continued to remain above the long-term mean for Michigan, Huron and Erie, and have been near orslightly below long-term mean levels for Superior. As examples, anomalies from the 1901±1989 long-termmean are shown for Erie and Superior (Figure 7). These above-average lake levels resulted from high watersupplies beginning in the late 1960s.In contrast to the general increases in water level over the last century, GCM scenarios for a doubling of
CO2 produced marked declines in water levels and out¯ows (Croley, 1990, 1993; Hartman, 1990; Mortschand Quinn, 1996). Summaries of the hydrological model results by Mortsch and Quinn (1996) indicateddeclines from ÿ0�23 to ÿ2�48 m in water levels among all lakes and scenarios (CCC, GFDL, GISS andOSU). The greatest declines were for Michigan±Huron (ÿ0�99 to ÿ2�48 m among scenarios); the smallest
Figure 7. Water level anomalies (m) for lakes Erie and Superior
HYDROLOGICAL PROCESSES, VOL. 11, 825±871 (1997) # 1997 by John Wiley & Sons, Ltd.
838 J. J. MAGNUSON ET AL.
decline was for Superior �ÿ0�23 to ÿ0�47 m among scenarios); and Erie, Ontario and the St Lawrence Riverat Montreal were intermediate at about ÿ1�3 m. Mean annual out¯ows also declined for all lakes; LakeSuperior declined only ÿ8% while the others ranged from ÿ20 to ÿ40% among scenarios, with a mean ofabout ÿ30%. These declines in water level and out¯ows resulted from the simulated declines in in¯ows ofÿ2 to ÿ54% among lakes and scenarios. Greatest declines were for the Lake Erie Basin �ÿ19 to ÿ54%);smallest declines were for the Lake Superior Basin �ÿ2 to ÿ12%�; and Michigan, Huron and Ontario wereintermediate with declines ranging from ÿ7 to ÿ38%.
The seasonal pattern of hydrological parameters did not shift in the 2� CO2 simulations, nor wereseasonal amplitudes accentuated a great deal (Croley, 1990; Hartman, 1990). However, compared with baseconditions, runo�, temperature and evaporation were higher, and net basin supply was lower, in the 2� CO2
scenarios in all months. Net basin supply was highest in March and April when runo� was maximum andtemperature and evaporation were low, and was lowest in August±October when runo� was low, andtemperatures and evaporation were high.
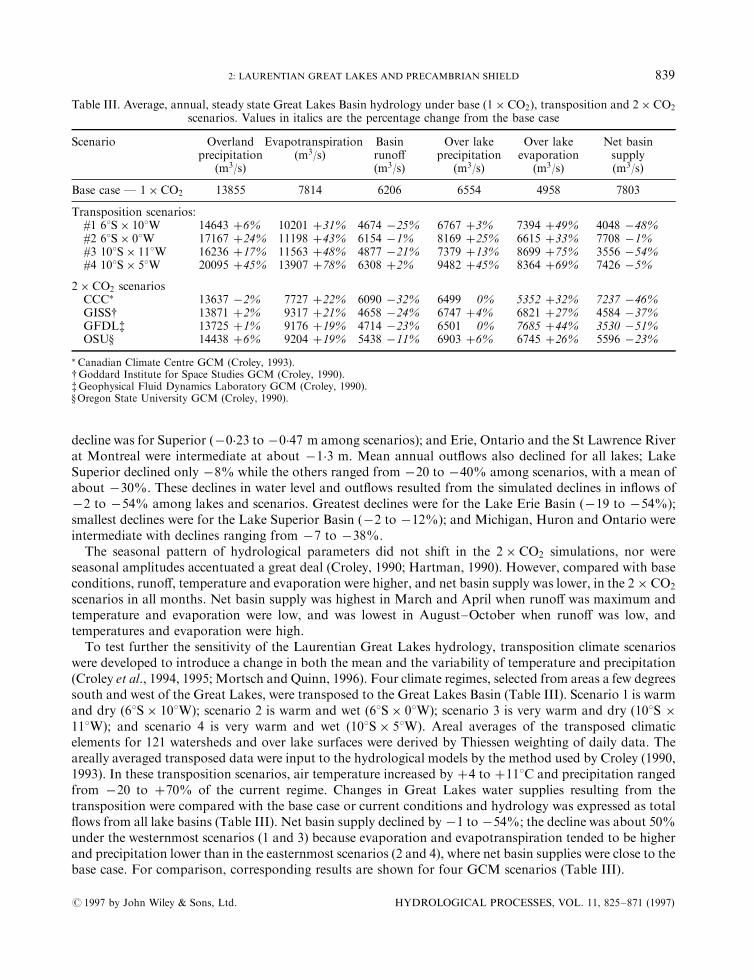
To test further the sensitivity of the Laurentian Great Lakes hydrology, transposition climate scenarioswere developed to introduce a change in both the mean and the variability of temperature and precipitation(Croley et al., 1994, 1995; Mortsch and Quinn, 1996). Four climate regimes, selected from areas a few degreessouth and west of the Great Lakes, were transposed to the Great Lakes Basin (Table III). Scenario 1 is warmand dry �68S� 108W�; scenario 2 is warm and wet �68S� 08W�; scenario 3 is very warm and dry �108S �118W�; and scenario 4 is very warm and wet �108S� 58W�. Areal averages of the transposed climaticelements for 121 watersheds and over lake surfaces were derived by Thiessen weighting of daily data. Theareally averaged transposed data were input to the hydrological models by the method used by Croley (1990,1993). In these transposition scenarios, air temperature increased by �4 to �118C and precipitation rangedfrom ÿ20 to �70% of the current regime. Changes in Great Lakes water supplies resulting from thetransposition were compared with the base case or current conditions and hydrology was expressed as total¯ows from all lake basins (Table III). Net basin supply declined by ÿ1 to ÿ54%; the decline was about 50%under the westernmost scenarios (1 and 3) because evaporation and evapotranspiration tended to be higherand precipitation lower than in the easternmost scenarios (2 and 4), where net basin supplies were close to thebase case. For comparison, corresponding results are shown for four GCM scenarios (Table III).
Table III. Average, annual, steady state Great Lakes Basin hydrology under base �1� CO2�, transposition and 2� CO2
scenarios. Values in italics are the percentage change from the base case
Scenario Overland Evapotranspiration Basin Over lake Over lake Net basinprecipitation (m3/s) runo� precipitation evaporation supply
(m3/s) (m3/s) (m3/s) (m3/s) (m3/s)
Base case Ð 1� CO2 13855 7814 6206 6554 4958 7803
Transposition scenarios:#1 68S� 108W 14643 �6% 10201 �31% 4674 ÿ25% 6767 �3% 7394 �49% 4048 ÿ48%#2 68S� 08W 17167 �24% 11198 �43% 6154 ÿ1% 8169 �25% 6615 �33% 7708 ÿ1%#3 108S� 118W 16236 �17% 11563 �48% 4877 ÿ21% 7379 �13% 8699 �75% 3556 ÿ54%#4 108S� 58W 20095 �45% 13907 �78% 6308 �2% 9482 �45% 8364 �69% 7426 ÿ5%
2� CO2 scenariosCCC� 13637 ÿ2% 7727 �22% 6090 ÿ32% 6499 0% 5352 �32% 7237 ÿ46%GISS{ 13871 �2% 9317 �21% 4658 ÿ24% 6747 �4% 6821 �27% 4584 ÿ37%GFDL{ 13725 �1% 9176 �19% 4714 ÿ23% 6501 0% 7685 �44% 3530 ÿ51%OSU} 14438 �6% 9204 �19% 5438 ÿ11% 6903 �6% 6745 �26% 5596 ÿ23%
� Canadian Climate Centre GCM (Croley, 1993).{Goddard Institute for Space Studies GCM (Croley, 1990).{Geophysical Fluid Dynamics Laboratory GCM (Croley, 1990).}Oregon State University GCM (Croley, 1990).
# 1997 by John Wiley & Sons, Ltd. HYDROLOGICAL PROCESSES, VOL. 11, 825±871 (1997)
2: LAURENTIAN GREAT LAKES AND PRECAMBRIAN SHIELD 839
Small inland lakes and streams
Comparable hydrological models for small lakes in the region have not been undertaken, but Mortschand Quinn (1996) suggested that their water supplies would be expected to decline as well. They simulatedchanges in hydrological parameters (air temperature, precipitation, basin runo� and total basin moisturestorage) for 121 sub-basins draining to the Laurentian Great Lakes. Moisture storage declinedsubstantially in the doubled CO2 scenarios, even though precipitation increased in the northern sub-basins; the declines occurred because temperature and evapotranspiration increased. Declines in basinruno� were greatest where simulated increases in temperature and declines in precipitation were greatest,namely in the southern half of the basin. Such reductions in tributary ¯ow and soil moisture would a�ectthe hydrology and related limnological properties and processes of groundwater, wetland, stream and lakesystems.
The sensitivity of the water levels of small inland lakes to climatic changes is apparent from the observedresponses to recent droughts. During the 1987±1990 drought in Wisconsin, water levels of lakes at the NorthTemperate Lakes Long-Term Ecological Research (LTER) site declined by up to 1 m. Lake level declineswere largest in seepage lakes that were high in the landscape and received most of their water inputs fromdirect precipitation (Webster et al., 1996). In contrast, declines of only a few cm were observed for drainagelakes low in the landscape, which received substantial inputs of both surface and groundwater.
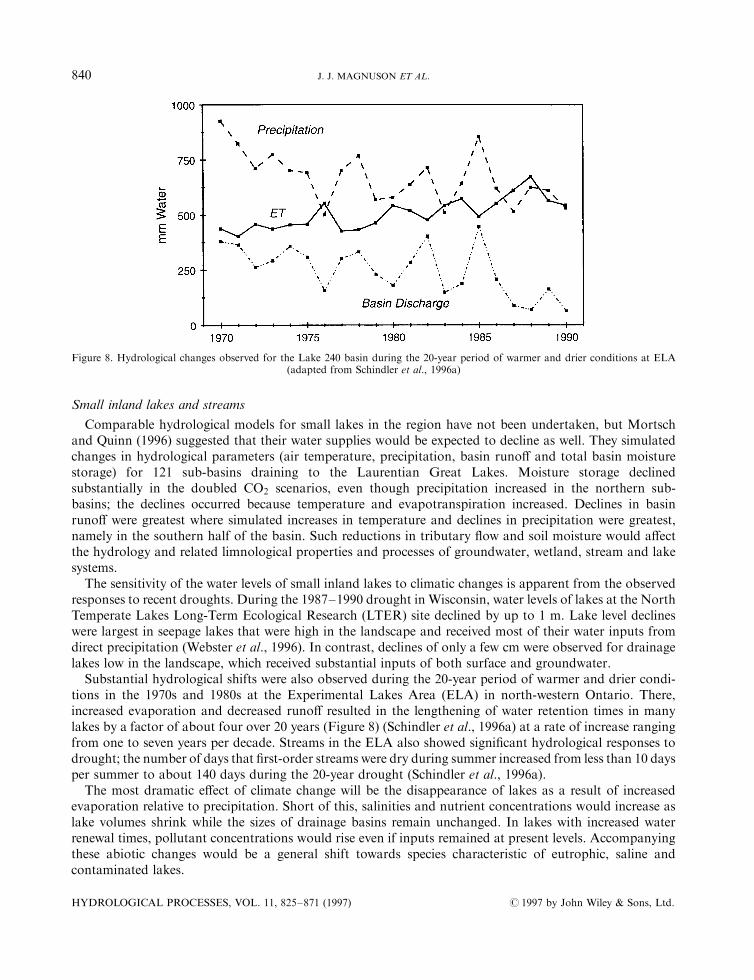
Substantial hydrological shifts were also observed during the 20-year period of warmer and drier condi-tions in the 1970s and 1980s at the Experimental Lakes Area (ELA) in north-western Ontario. There,increased evaporation and decreased runo� resulted in the lengthening of water retention times in manylakes by a factor of about four over 20 years (Figure 8) (Schindler et al., 1996a) at a rate of increase rangingfrom one to seven years per decade. Streams in the ELA also showed signi®cant hydrological responses todrought; the number of days that ®rst-order streams were dry during summer increased from less than 10 daysper summer to about 140 days during the 20-year drought (Schindler et al., 1996a).
The most dramatic e�ect of climate change will be the disappearance of lakes as a result of increasedevaporation relative to precipitation. Short of this, salinities and nutrient concentrations would increase aslake volumes shrink while the sizes of drainage basins remain unchanged. In lakes with increased waterrenewal times, pollutant concentrations would rise even if inputs remained at present levels. Accompanyingthese abiotic changes would be a general shift towards species characteristic of eutrophic, saline andcontaminated lakes.
Figure 8. Hydrological changes observed for the Lake 240 basin during the 20-year period of warmer and drier conditions at ELA(adapted from Schindler et al., 1996a)
HYDROLOGICAL PROCESSES, VOL. 11, 825±871 (1997) # 1997 by John Wiley & Sons, Ltd.
840 J. J. MAGNUSON ET AL.
Human adaptation and costs
Changes in lake levels, recently observed or simulated in 2� CO2 climate change scenarios, exceed thoseobserved or simulated for sea level changes (Arnell et al., 1996). Human responses to such large changeswould be costly, particularly those related to shipping, dredging and replacement or refurbishing of shorelinestructures in the Great Lakes (J. B. Smith, 1991). Changes in ice cover also in¯uence shipping costs. Inaddition, higher demand and usage of water from the Laurentian Great Lakes would probably occurfollowing a decrease in net basin water supplies.
For shipping at simulated water levels, 0.5±1.5 m lower than base levels, dredging costs would be incurredor ships would have to carry lighter loads (Keith et al., 1989). If lighter loads were carried, costs per tontransported in 2� CO2 scenarios increased from 1.6 to 33% depending on the harbour (Duluth/Superior,Two Harbors and White®sh Bay on Lake Superior, and Toledo, Cleveland and Bu�alo on Lake Erie) andthe scenario (GISS, GFDL and OSU). Cargoes would have to be reduced by 1.6±27% to get into theharbours without additional dredging. Dredging costs can be high, ranging from $0.0±31 million perharbour among harbours and scenarios without including the costs associated with shipping-relatedfacilities. For the 101 km Illinois shoreline of Lake Michigan, including Chicago, $138±312 million wouldbe needed over a 50-year period for dredging harbours to compensate for a 1.25±2.5 m decline in lake level(Changnon et al., 1989). The cost of sheeting and bulkheads, slips and docks was estimated at an additional$113±203 million. Taken together these shipping costs for the Illinois shoreline total $251±515 million over a50-year period. Increased dredging activities would also have implications for destruction of benthic habitatsand resuspension of toxics in harbour sediments.
Keith et al. (1989) observed that, even with lighter loads, the same goods could be shipped over a season ifthe ice-free season were longer (see section on ice, below). For Bu�alo, an increase in the shipping season of99 days would be su�cient to compensate for the need for lighter loads with a 1.5 m decline in water level;simulated increases in the ice-free period more than compensated for the need for lighter loads in two (GISSand OSU) of the three scenarios. For Lake Superior ports, a slightly shorter increase in the ice-free seasonwould be su�cient, a value achieved in all GCM scenarios. The bottom line projection for shipping costs forports on Lakes Superior and Erie, as a consequence of reduced water levels plus the longer shipping seasonapparent in 2� CO2 scenarios, was 1±7.5% above present costs or about one-half of the increases in costsfrom water level reductions taken alone.
Additional costs, unrelated to shipping, have been estimated for the Illinois shoreline of LakeMichigan byChangnon et al. (1989) for 2� CO2 scenarios. These included costs to extend water intake structures for citywater supplies ($16±17 million), to relocate beach facilities ($1±2 million) and to extend and modify stormwater outfalls ($2±4 million). These costs are less than those associated with shipping. Historical responsesto lower water in the Chicago area include relocation and encroachment to take advantage of the new beachareas; damage to these structures was extensive when water levels returned to higher levels.
Generation of electricity from hydroelectric facilities in the Great Lakes Basin would also be reduced in adrier and warmer climate. Presently, the capacity of the Great Lakes electric generation system is about 3.2million kW for Ontario, 1.7 million kW for Quebec and 3.1 million kW for New York (Melo, 1989). Thecosts of replacing the hydroelectric power generated at Niagara and along the St Lawrence River following a0.6 m decline in water level in Lakes Erie and Ontario is high. Long-term annual costs of replacing thiscapacity with nuclear or fossil fuel plants were estimated to be in the range of US $160 million in 1988 forNew York (Crissman, 1989), and Can $1 billion for Ontario (Melo, 1989). The output from thesehydropower facilities is of the same magnitude as that of the Tennessee Valley Authority.
ICE COVER
Ice cover on lakes and streams is not only a robust indicator of climate change and variation (Robertsonet al., 1992), but also represents a limnological response to climate change that in¯uences the ecology of
# 1997 by John Wiley & Sons, Ltd. HYDROLOGICAL PROCESSES, VOL. 11, 825±871 (1997)
2: LAURENTIAN GREAT LAKES AND PRECAMBRIAN SHIELD 841
aquatic systems (Vanderploeg et al., 1992). Ice phenologies, i.e. dates of freezing over (ice-on) and break-up(ice-o�), are especially useful because shoreline residents and early navigators of lakes and streams haverecorded these events longer and in more locations than other climatic data. Ice phenologies can also bemeasured by analysis of satellite images over large regions where there are no weather stations (Wynne andLillesand, 1993).
Past trends in ice phenology
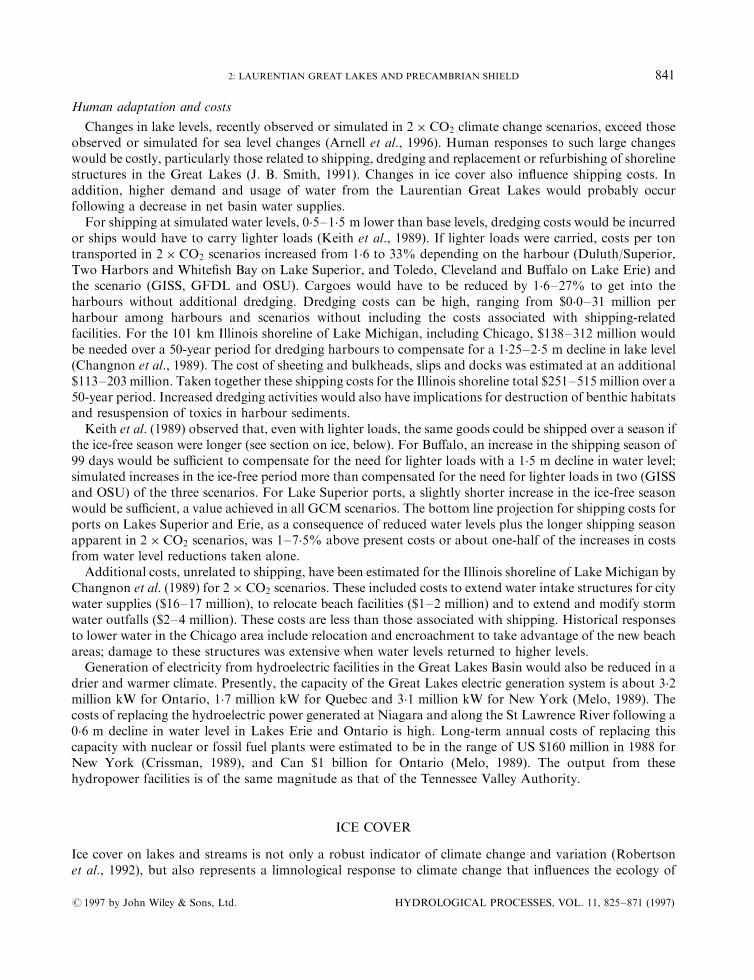
In general, the average duration of ice cover has decreased in a series of step changes in the LaurentianGreat Lakes and Precambrian Shield Region over the last century or so, indicating early and late winterwarming of 1.5±2.78C. Continuous lake ice phenologies date back to 1823 in the Laurentian Great Lakesand 1855 for Lake Mendota, Wisconsin. Analyses of Lake Mendota and Grand Traverse Bay, LakeMichigan (ca. 320 km apart), indicated later ice-on dates and earlier ice-o� dates (Figure 9) (Assel andRobertson, 1995). A step change of eight days (Mendota) and 12 days (Grand Traverse) in average ice-ondate occurred in about the 1888±1889 winter in both systems, representing an increase of about 1.58C in earlywinter air temperatures. Two step changes in average ice-o� dates, totalling 14 days (Mendota) and 20 days(Grand Traverse), have occurred since the 1870s representing an increase in late winter air temperatures of
Figure 9. Ice-o� dates for Lake Mendota and Grand Traverse Bay between 1851 and the present (dashed line) (adapted from Assel andRobertson, 1995). Heavy solid lines mark step changes in the long-term average, while the lighter solid line is a centred 10-year moving
average. Years in which Grand Traverse Bay did not freeze over are marked by a solid square on 8 March
HYDROLOGICAL PROCESSES, VOL. 11, 825±871 (1997) # 1997 by John Wiley & Sons, Ltd.
842 J. J. MAGNUSON ET AL.
2.28C (Mendota) and 2.78C (Grand Traverse). The ®rst step changes were coincident for both sites, ca.1888±1889, while the second occurred in 1939±1940 (Grand Traverse) and 1979±1980 (Lake Mendota). Thetransition to later average ice-on and earlier average ice-o� dates in the late 1800s corresponded with the endof the Little Ice Age.
For the Great Lakes, we simulated annual maximum ice cover averaged by decade from 1900 to 1990 usinga regional winter air temperature model for annual maximum ice cover of the combined surface areas (Asselet al., 1985). Average November±February monthly air temperatures were used from Duluth, Minnesota;Sault Ste. Marie, Michigan; Detroit, Michigan; and Bu�alo, New York. Average ice cover decreased fromapproximately 61% maximum coverage for the decades ending in 1910 and 1920, to near 50% for thedecades ending in 1940, 1950 and 1960. Ice cover then increased over the next two decades [1970 (61%) and1980 (64%)] before declining again in the 1980s [1990 (55%)]. These trends are consistent with simulationsfrom degree±day ice cover models developed for Lakes Erie and Superior (Assel, 1990). The latermodels suggested that decadal midwinter ice cover averaged about 10±25% greater for both 1900±1925 and1960±1983 than for the intervening years (1926±1959). Contemporary midwinter ice cover averages 90% forLake Erie and 56% for Lake Superior (Assel et al., 1983).For the shallow shore zones of the Great Lakes, the timing of ice-on, ice-o� and percentage of lake area
covered by ice are comparable to those of smaller inland lakes. However, because the Great Lakes havegreater thermal inertia and longer wind fetch than the smaller lakes (Assel, 1986), ice forms later and is moredynamic in midlake areas than inshore areas or in the smaller lakes. Ice usually forms in shallow bays andover most of Lake Erie in December and January. Ice forms in the deeper embayments and in midlake areasin February, reaches its maximum extent in February or March and is usually lost by the end of April (Asselet al., 1983). The Great Lakes do not freeze over completely because of their large heat storage capacity, theaction of winds and their exposure to relatively moderate winter temperatures, particularly towards thesouth. During mild winters, midlake areas remain relatively ice free (Assel et al., 1985) and annual maximumice cover is typically less than 35%. During severe winters midlake ice can form as early as January, can lastinto May and can cover 80% of the combined surface area of the Great Lakes (Assel et al., 1996).
Changes and variations in ice-o� dates were coherent between lakes across the Laurentian Great Lakes/Precambrian Shield Region. The recent change to earlier ice-o� dates for Lake Mendota was consistent withdata from 19 other Wisconsin lakes (Anderson et al., 1996) and with Lake 239 in north-western Ontario(Schindler et al., 1990, 1996a). Rates of change were 0.7±8.4 �mean � 4�3� days per decade for northernWisconsin, 0.6±12.2 �mean � 8�1� days per decade in southern Wisconsin and 7.6 days per decade for Lake239. Locations around the Laurentian Great Lakes from Chequamegon Bay (Lake Superior), GrandTraverse Bay (LakeMichigan) and Bu�alo (Lake Erie) also showed an earlier ice-o� during the same 21 years(Assel et al., 1995), and earlier ice-o� dates were apparent in inland Canadian lakes from western Manitobato central Quebec (Reycraft and Skinner, 1993). Ice-on dates, however, had no obvious trend over the same21 years (Robertson et al., 1992; Reycraft and Skinner, 1993; Assel et al., 1995; Schindler et al., 1996a).
In contrast to the apparent coherence in general trends of lake ice phenologies in Wisconsin and across theregion, Wynne et al. (1996) found low average coherence in inter-year patterns among 62 inland lakesspanning a wide range of latitudes in the western part of the region. Using satellite-derived ice-o� dates from1987 to 1994, they measured coherence as the correlation coe�cient between the time-series for each lakepair. In this analysis, two lakes with quite di�erent mean ice-o� dates could still be coherent, i.e. have thesame inter-year pattern in ice-o� dates. While some lake pairs were highly coherent �r � �0�9996� otherswere negatively coherent �r � ÿ0�89�, and average coherence was low �r � �0�45� for the area as a whole.There was a geographical pattern to the coherence. First, adjacent lakes tended to be coherent. Moreinterestingly, lakes tended to be more coherent if their mean ice-o� dates were more similar. Furthermore,lakes that were not close but had high coherence tended to be at similar latitudes; for example, lakes insouthern Wisconsin were highly coherent with those in eastern South Dakota. These results were interpretedto mean that lakes at the same location or latitude with similar ice-o� dates, integrated the same seasonalweather, while those that were neither close nor at the same latitude, integrated di�erent seasonal weather.
# 1997 by John Wiley & Sons, Ltd. HYDROLOGICAL PROCESSES, VOL. 11, 825±871 (1997)
2: LAURENTIAN GREAT LAKES AND PRECAMBRIAN SHIELD 843
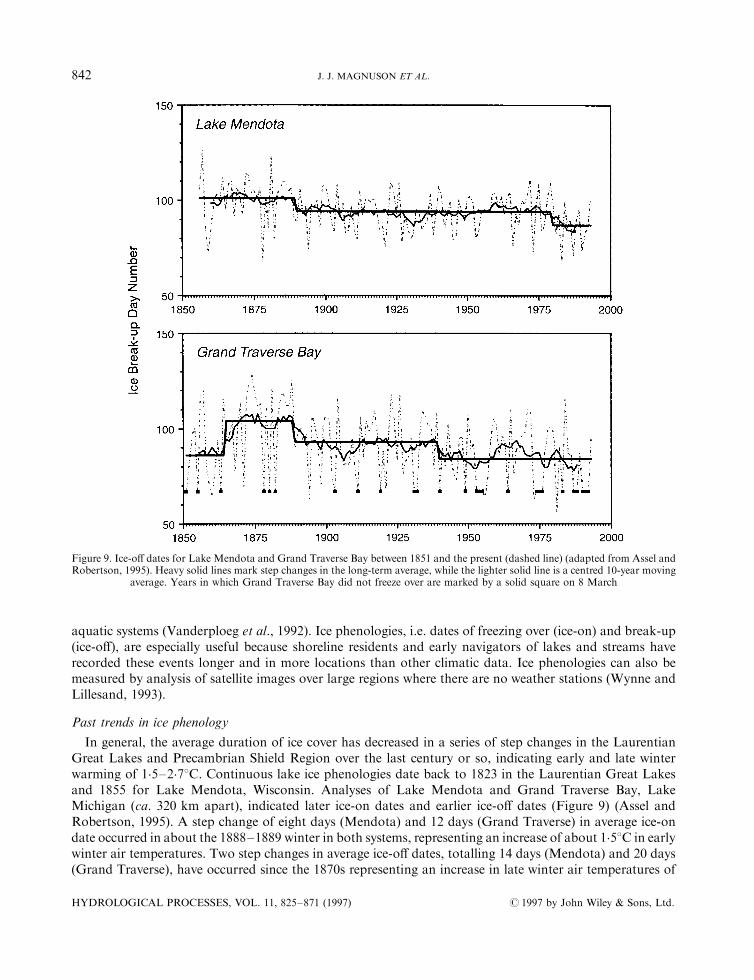
This point was also made by Assel and Robertson (1995) when comparing Grand Traverse Bay and LakeMendota and by Anderson et al. (1996) when comparing El NinÄ o e�ects on ice-out for Wisconsin lakes(Figure 10); lakes freezing or thawing on di�erent dates integrate di�erent climate windows and thus canhave di�erent inter-year patterns of ice phenologies. This suggests that lakes at di�erent latitudes can be usedto represent ®ner seasonal time-scales than, simply, early winter for ice-on or late winter for ice-o�.Ice formation and break-up are dependent on many climatic forcing variables, such as air temperature,
solar radiation, wind and snow depth. Yet, air temperature alone often provides a reasonable prediction ofice phenologies. Using a moving average of air temperatures, McFadden (1965) observed that large lakes incentral Canada and Lake Mendota in Wisconsin, froze when the 40-day average reached 08C and broke upwhen it exceeded �58C. Using a sensible heat transfer model developed by Robertson et al. (1992), Assel andRobertson (1995) found that ice-on changed by 5.3 and 8.4 days and ice-o� changed by 6.4 and 7.1 days per18C change in air temperature for Lake Mendota and Grand Traverse Bay, respectively; conversely, airtemperature increased by 0.18 and 0.128C for each day change in ice-on date and by 0.15 and 0.148C for eachday change in ice-o� date.A more complete process model for lake ice phenologies was developed recently by Vavrus et al. (1996),
patterned after a thermodynamic sea ice model (Maykut and Unterssteiner, 1971; Parkinson andWashington, 1979). Inputs to the model are mean lake depth, air temperature and moisture, wind speed,solar radiation, snowfall and cloudiness; energy transfers between the air±snow, or air±ice, snow±ice andice±water are included. When driven with hourly meteorological data, the model simulated the annual ice-onand ice-o� dates for Lake Mendota between 1961 to 1990 with a median absolute error of two days (ice-on)and four days (ice-o�). In the model, ice-on and ice-o� dates responded strongly to changes in mean annualair temperature, ice-o� was more sensitive to temperature changes than was ice-on and both events weremore sensitive to climate warming than to climate cooling.
Figure 10. E�ect of El NinÄ o events on ice break-up dates for lakes in northern and southern Wisconsin (modi®ed from Andersonet al., 1996)
HYDROLOGICAL PROCESSES, VOL. 11, 825±871 (1997) # 1997 by John Wiley & Sons, Ltd.
844 J. J. MAGNUSON ET AL.
The model developed by Vavrus et al. (1996) was also sensitive to changes in snowfall. A 50% increase insnowfall increased ice-o� by six days and a 50% decrease in snowfall decreased ice-o� by four days; a no-snow scenario, however, again increased ice-o� by one day. Snowfall was also an important factor in thespatial analyses of the satellite-derived time-series discussed above (Wynne et al., 1996). The model ofWynne et al.'s (1996) �R2 � 0�93� was:
Ice-off date � �4�47� latitude� � �0�5� snowfall in cm� ÿ 112
Simulations of changes in ice phenologies with climate warming predicted the occurrence of ice-free years forWisconsin's Long-Term Ecological Research (LTER) lakes, which, historically, have had ice cover every year(Robertson et al., 1992; DeStasio et al., 1996). For Lake Mendota, in southern Wisconsin, a 18C warmingwould shorten ice duration by about 11 days (Robertson et al., 1992); a 48C warming would result infrequent thawing and refreezing events; a 58C warming would reduce mean ice cover by 64 days and result inno ice cover in 1 out of every 15±30 years. Robertson's model was parameterized for three lakes in northernWisconsin (Crystal, Sparkling and Trout) and phenologies calculated with temperature increases for2� CO2 scenarios; ice did not form in 33% of 27 runs (DeStasio et al., 1996). The 27 runs were for threemodel scenarios (GFDL, GISS and OSU), three lakes and three base climates (a cool, intermediate andwarm year). Using the same analysis for Lake Mendota in southern Wisconsin, ice did not form in 89% ofthe nine simulations. For the northern Wisconsin lakes, even when the lakes were simulated to freeze, the ice-free season was increased by 16±64 days.
For Lakes Erie and Superior, ice phenologies were simulated with a single 1� CO2 scenario over a 30-yearbase (1951±1980), and with 2� CO2 scenarios for the same years from three GCMs (GFDL, GISS andOSU) (Assel, 1991). With the 1� CO2 scenario ice cover formed every year for Lake Superior and for 29 ofthe 30 years for Lake Erie. With the 2� CO2 scenarios, ice-free winters appeared with the GFDL scenariosfor Lake Erie in 17% of the 30 years and for Lake Superior in 43% of the years; with the other two scenariosthe simulations were, for GISS, 10% (Superior) and 3% (Erie) and, for OSU, 7% (Superior) and 0% (Erie).Average ice cover duration for the 1951±1980 base period �1� CO2� ranged from 13 to 16 weeks. Iceduration with 2� CO2 scenarios was reduced to 5 to 13 weeks; midlake areas were ice free in most 2� CO2
winters.
PHYSICAL LIMNOLOGY, WATER CLARITY AND DISSOLVED OXYGEN
Lake and stream temperatures are responsive to climate warming in the Laurentian Great Lakes andPrecambrian Shield Region. Lake mixing and strati®cation would be altered directly by the warming, andindirectly by changes in water clarity, responding to decreased inputs of dissolved organic carbon (DOC) orchanges in trophic state. Physical changes would in turn in¯uence the dissolved oxygen availability in thedeep strati®ed waters, with many biological and biogeochemical consequences. Refuges from the warmertemperatures may be available in lakes that have an oxygenated hypolimnion and in some smaller streamsthat receive signi®cant groundwater and shading from riparian vegetation.
Lakes
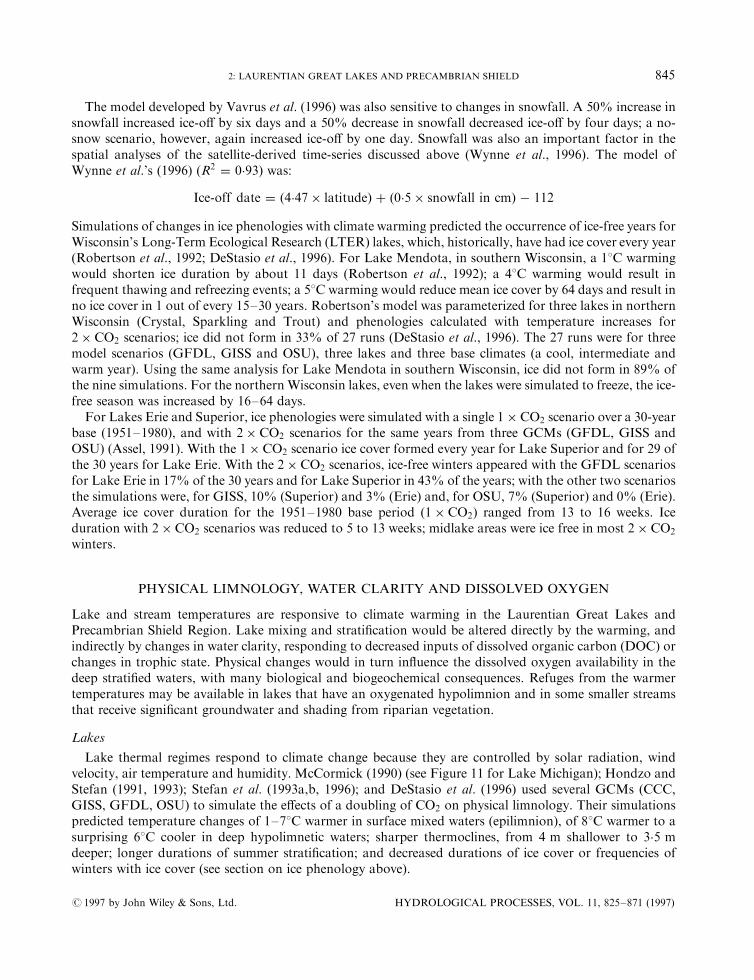
Lake thermal regimes respond to climate change because they are controlled by solar radiation, windvelocity, air temperature and humidity. McCormick (1990) (see Figure 11 for Lake Michigan); Hondzo andStefan (1991, 1993); Stefan et al. (1993a,b, 1996); and DeStasio et al. (1996) used several GCMs (CCC,GISS, GFDL, OSU) to simulate the e�ects of a doubling of CO2 on physical limnology. Their simulationspredicted temperature changes of 1±78C warmer in surface mixed waters (epilimnion), of 88C warmer to asurprising 68C cooler in deep hypolimnetic waters; sharper thermoclines, from 4 m shallower to 3.5 mdeeper; longer durations of summer strati®cation; and decreased durations of ice cover or frequencies ofwinters with ice cover (see section on ice phenology above).
# 1997 by John Wiley & Sons, Ltd. HYDROLOGICAL PROCESSES, VOL. 11, 825±871 (1997)
2: LAURENTIAN GREAT LAKES AND PRECAMBRIAN SHIELD 845
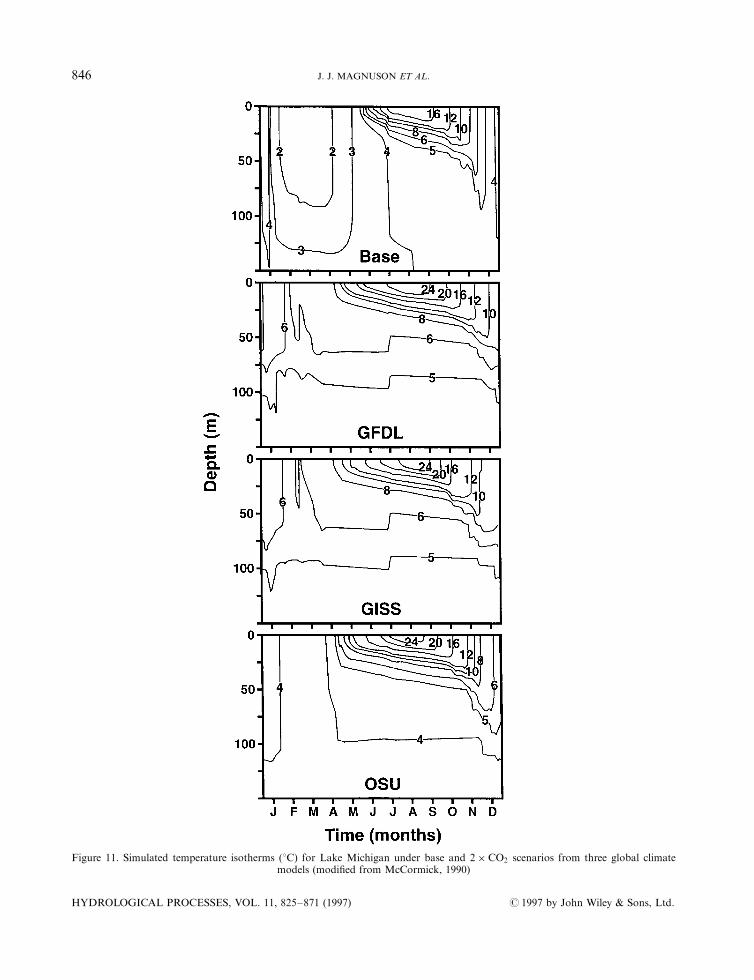
Figure 11. Simulated temperature isotherms (8C) for Lake Michigan under base and 2� CO2 scenarios from three global climatemodels (modi®ed from McCormick, 1990)
HYDROLOGICAL PROCESSES, VOL. 11, 825±871 (1997) # 1997 by John Wiley & Sons, Ltd.
846 J. J. MAGNUSON ET AL.
The simulated changes varied among scenarios and lakes; di�erences in simulated responses weregenerally greater among GCMs than between lakes or base year, at least for the four Wisconsin lakes(Crystal, Sparkling, Trout and Mendota) used by DeStasio et al. (1996). Simulated increases in surfacetemperatures of four Wisconsin lakes averaged �4�2 to �4�88C across four GCMs with a cool, intermediateand warm base climate. However, temperature simulations for bottom waters were more variable, �0�8 to�4�68C, among the four lakes (DeStasio et al., 1996). For 27 Minnesota lake classes (three maximumdepths, three surface areas and three water clarities) 25-year averages of surface temperatures simulated withthe GISS GCM were about 38C warmer, compared with a 4.48C air temperature rise (Hondzo and Stefan,1993); increases in hypolimnetic temperatures ranged up to �38C (Stefan et al., 1996). The largest changes inwater temperature occurred in spring and autumn.Warming also would alter the mixing regimes of lakes. In the southern part of the region, lakes switching
from ice covered to open in winter would become monomictic; i.e. they would mix in autumn, winter andspring, and stratify in summer. In the northern part, some lakes that are presently monomictic and mix onlyduring summer, would stratify in summer and become dimictic, mixing in spring and autumn. Some largedeep lakes, like Lake Michigan, that are dimictic would be less likely to mix completely (Figure 11)(McCormick, 1990).
Inter-lake di�erences in depth and transparency often have a greater in¯uence on measured and simulatedbottom temperatures or thermocline depths than does simulated climate warming (Stefan and Fang, 1995;DeStasio et al., 1996; Fee et al., 1996). Surface temperatures simulated with 1� CO2 climates changed littlewith lake depth or transparency (Hondzo and Stefan, 1993; DeStasio et al., 1996), but bottom temperaturesand thermocline depth did. For shallow lakes, bottom and surface temperatures were the same; for lakes10 m deep bottom temperatures were less than half the surface temperatures; for those greater than 20 mdeep, bottom temperatures were less than one-quarter of the surface temperatures. Simulations for lesstransparent lakes showed cooler hypolimnia and shallower thermoclines with 1� CO2 climates than they didfor more transparent lakes.
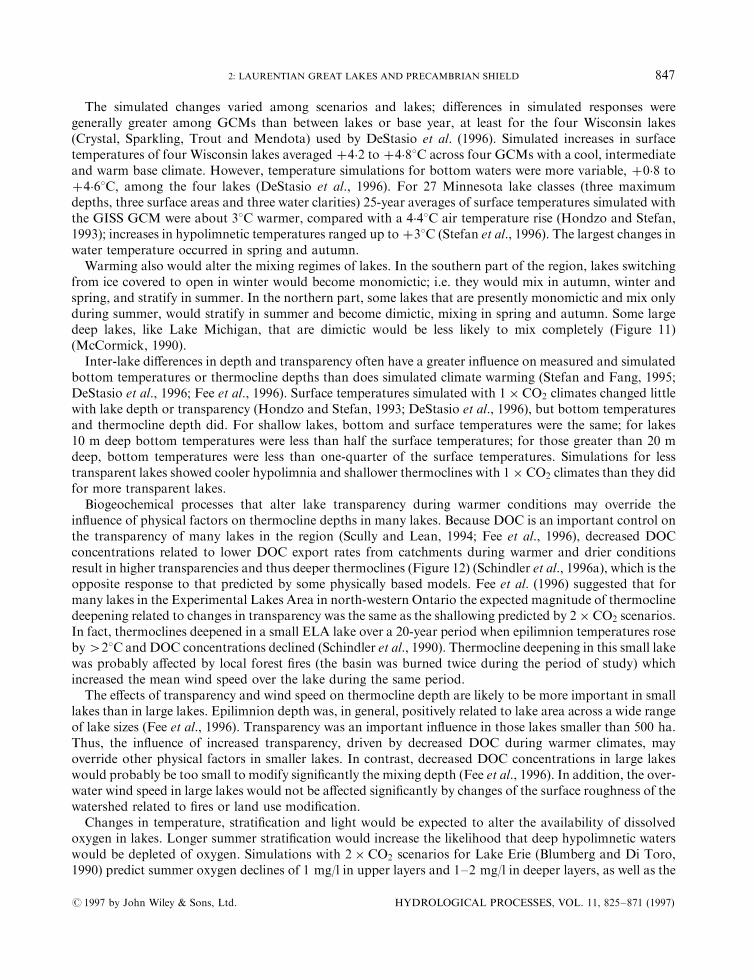
Biogeochemical processes that alter lake transparency during warmer conditions may override thein¯uence of physical factors on thermocline depths in many lakes. Because DOC is an important control onthe transparency of many lakes in the region (Scully and Lean, 1994; Fee et al., 1996), decreased DOCconcentrations related to lower DOC export rates from catchments during warmer and drier conditionsresult in higher transparencies and thus deeper thermoclines (Figure 12) (Schindler et al., 1996a), which is theopposite response to that predicted by some physically based models. Fee et al. (1996) suggested that formany lakes in the Experimental Lakes Area in north-western Ontario the expected magnitude of thermoclinedeepening related to changes in transparency was the same as the shallowing predicted by 2� CO2 scenarios.In fact, thermoclines deepened in a small ELA lake over a 20-year period when epilimnion temperatures roseby428C and DOC concentrations declined (Schindler et al., 1990). Thermocline deepening in this small lakewas probably a�ected by local forest ®res (the basin was burned twice during the period of study) whichincreased the mean wind speed over the lake during the same period.The e�ects of transparency and wind speed on thermocline depth are likely to be more important in small
lakes than in large lakes. Epilimnion depth was, in general, positively related to lake area across a wide rangeof lake sizes (Fee et al., 1996). Transparency was an important in¯uence in those lakes smaller than 500 ha.Thus, the in¯uence of increased transparency, driven by decreased DOC during warmer climates, mayoverride other physical factors in smaller lakes. In contrast, decreased DOC concentrations in large lakeswould probably be too small to modify signi®cantly the mixing depth (Fee et al., 1996). In addition, the over-water wind speed in large lakes would not be a�ected signi®cantly by changes of the surface roughness of thewatershed related to ®res or land use modi®cation.
Changes in temperature, strati®cation and light would be expected to alter the availability of dissolvedoxygen in lakes. Longer summer strati®cation would increase the likelihood that deep hypolimnetic waterswould be depleted of oxygen. Simulations with 2� CO2 scenarios for Lake Erie (Blumberg and Di Toro,1990) predict summer oxygen declines of 1 mg/l in upper layers and 1±2 mg/l in deeper layers, as well as the
# 1997 by John Wiley & Sons, Ltd. HYDROLOGICAL PROCESSES, VOL. 11, 825±871 (1997)
2: LAURENTIAN GREAT LAKES AND PRECAMBRIAN SHIELD 847
development of a more extensive area of anoxia. In these simulations, warmer temperatures increasedbacterial activity in deep waters and sediments; a change in thermocline depth was not the cause. Similarresponses were obtained for smaller Minnesota lakes in model simulations by Stefan et al. (1993a), Stefanand Fang (1995) and Stefan and Fang (1994). Oxygen concentrations declined by 2 mg/l in surface watersand by as much as 8 mg/l in deep hypolimnetic waters, while summer oxygen depletion lasted up to twomonths longer compared with base climate scenarios. These oxygen declines occurred more rapidly and werelonger lasting in eutrophic, compared with oligotrophic, lakes. In winter, shorter ice cover durations woulddecrease the likelihood of winter kill resulting from oxygen depletion in shallow lakes, although this may becountered by predicted declines in lake level and volume, which would lower the total content of dissolvedoxygen available at ice-on.
Streams
Mean weekly temperatures tracked air temperatures closely in six Minnesota streams (Stefan andPreud'homme, 1993) according to the relationship:
Tw�week� � 2�85 � 0�866Ta�week�where Tw�week� is the weekly mean water temperature in 8C and Ta(week) is the weekly mean airtemperature in 8C. The regression slopes for individual rivers ranged from 0.669 for the Vemillion River to
Figure 12. (a) Changes in penetration of photosynthetically active radiation (PAR) in Lake 239 as the depth of the isopleth representing1% of surface light (equivalent to photic zone depth) (modi®ed from Schindler et al., 1996a); (b) changes in thermocline depth
in Lake 239
HYDROLOGICAL PROCESSES, VOL. 11, 825±871 (1997) # 1997 by John Wiley & Sons, Ltd.
848 J. J. MAGNUSON ET AL.
1.026 for the Roseau River; intercepts ranged from 1.408C for the Straight River to 4.498C for theMississippi River at St. Paul. The relationship for daily data was similar but had a larger standard deviationand a time lag of 1±4 days:
Tw�day� � 4�90 � 0�733Ta�day�The regression slopes for individual rivers in Minnesota ranged from 0.604 for the Vermillion River to 0.874for the Roseau River; intercepts ranged from 3.968C for the Straight River to 7.378C for the MississippiRiver at St. Paul.
Other factors besides air temperature in¯uence stream temperatures, such as solar radiation, relativehumidity, wind speed, water depth, groundwater in¯ow, arti®cial heat inputs and the thermal conductivityof the sediments. Of these, radiation is the most important (Sinokrot and Stefan, 1993); thus, diel variationand shading from riparian vegetation are important. Deterministic models including shading and windsheltering can simulate water temperatures with a standard deviation of about 18C, which is considerablysmaller than the above regressions, but such models have much greater data demands; approximations canbe achieved rapidly with the regressions (Stefan and Preud'homme, 1993).
A modi®ed version of the MNSTREM model was used to simulate the potential a�ects of doublingatmospheric CO2 for ®ve Minnesota streams (Stefan and Sinokrot, 1993). Stream temperatures wereprojected to increase 2.4±4.78C with scenario inputs from four GCMs (GISS, GFDL, UKMO and OSU)and 2� CO2 climates. If there was no riparian shading, additional increases up to 68C were projected.Increases in groundwater temperatures with climate warming are expected to be about the same magnitude
as that predicted for mean annual air temperatures (Meisner et al., 1988). As a result, the cooling e�ect ofgroundwater on streams would be reduced, indirectly contributing to stream warming. The combined e�ectof an increase in groundwater temperature of 4.88C, with the direct e�ects of warmer air temperatures, onstream waters in south-central Ontario were simulated to decrease the length of headwater trout streams thatremained below 248C during July and August by 30 and 40%, respectively (Meisner, 1990). For one stream,the increase in water temperature was almost equally attributable to groundwater inputs and to airtemperatures; in the other stream, nearly all of the increase in temperature was accountable by groundwaterinputs. The e�ect of climate change on stream temperatures below dams will be more pronounced where thewater release is from the reservoir epilimnion rather than the hypolimnion. Cold hypolimnetic water releaseis felt as far as 48 km downstream in small, shaded Minnesota streams. This distance is projected to beshortened by 25±50% under a 2� CO2 climate scenario (Sinokrot et al., 1995).
BIOGEOCHEMISTRY
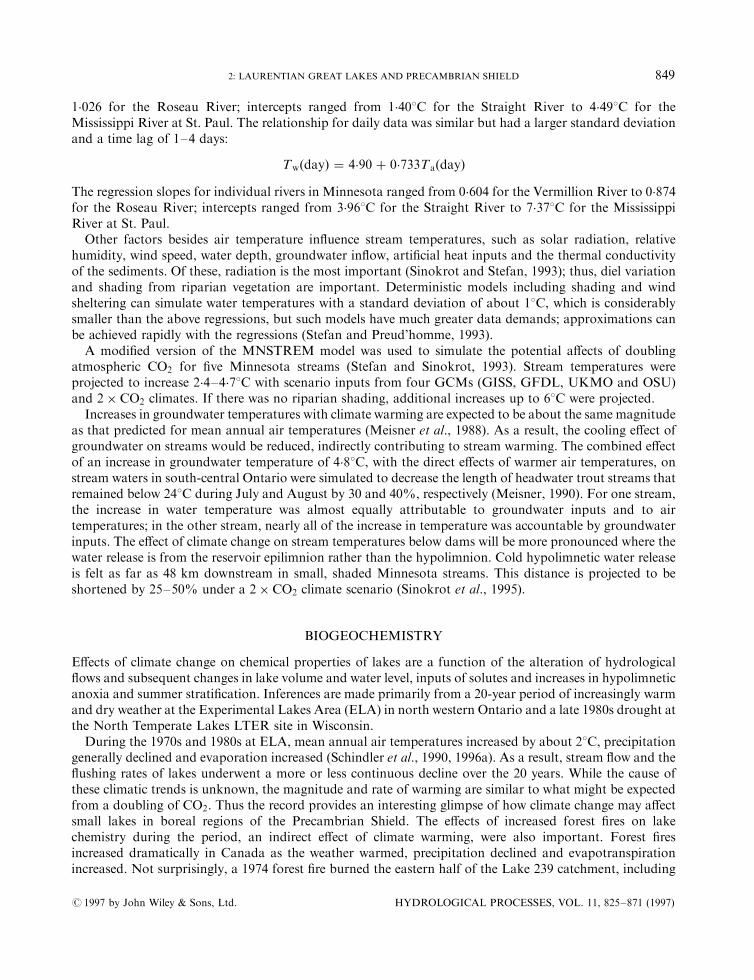
E�ects of climate change on chemical properties of lakes are a function of the alteration of hydrological¯ows and subsequent changes in lake volume and water level, inputs of solutes and increases in hypolimneticanoxia and summer strati®cation. Inferences are made primarily from a 20-year period of increasingly warmand dry weather at the Experimental Lakes Area (ELA) in north western Ontario and a late 1980s drought atthe North Temperate Lakes LTER site in Wisconsin.
During the 1970s and 1980s at ELA, mean annual air temperatures increased by about 28C, precipitationgenerally declined and evaporation increased (Schindler et al., 1990, 1996a). As a result, stream ¯ow and the¯ushing rates of lakes underwent a more or less continuous decline over the 20 years. While the cause ofthese climatic trends is unknown, the magnitude and rate of warming are similar to what might be expectedfrom a doubling of CO2. Thus the record provides an interesting glimpse of how climate change may a�ectsmall lakes in boreal regions of the Precambrian Shield. The e�ects of increased forest ®res on lakechemistry during the period, an indirect e�ect of climate warming, were also important. Forest ®resincreased dramatically in Canada as the weather warmed, precipitation declined and evapotranspirationincreased. Not surprisingly, a 1974 forest ®re burned the eastern half of the Lake 239 catchment, including
# 1997 by John Wiley & Sons, Ltd. HYDROLOGICAL PROCESSES, VOL. 11, 825±871 (1997)
2: LAURENTIAN GREAT LAKES AND PRECAMBRIAN SHIELD 849
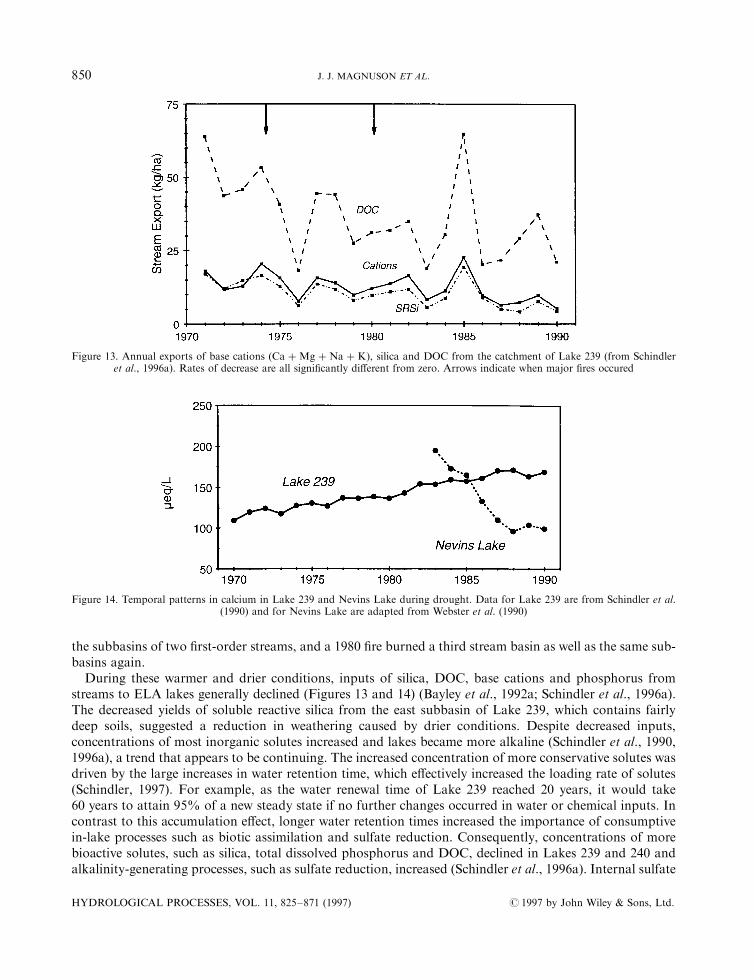
the subbasins of two ®rst-order streams, and a 1980 ®re burned a third stream basin as well as the same sub-basins again.
During these warmer and drier conditions, inputs of silica, DOC, base cations and phosphorus fromstreams to ELA lakes generally declined (Figures 13 and 14) (Bayley et al., 1992a; Schindler et al., 1996a).The decreased yields of soluble reactive silica from the east subbasin of Lake 239, which contains fairlydeep soils, suggested a reduction in weathering caused by drier conditions. Despite decreased inputs,concentrations of most inorganic solutes increased and lakes became more alkaline (Schindler et al., 1990,1996a), a trend that appears to be continuing. The increased concentration of more conservative solutes wasdriven by the large increases in water retention time, which e�ectively increased the loading rate of solutes(Schindler, 1997). For example, as the water renewal time of Lake 239 reached 20 years, it would take60 years to attain 95% of a new steady state if no further changes occurred in water or chemical inputs. Incontrast to this accumulation e�ect, longer water retention times increased the importance of consumptivein-lake processes such as biotic assimilation and sulfate reduction. Consequently, concentrations of morebioactive solutes, such as silica, total dissolved phosphorus and DOC, declined in Lakes 239 and 240 andalkalinity-generating processes, such as sulfate reduction, increased (Schindler et al., 1996a). Internal sulfate
Figure 13. Annual exports of base cations �Ca �Mg � Na � K�, silica and DOC from the catchment of Lake 239 (from Schindleret al., 1996a). Rates of decrease are all signi®cantly di�erent from zero. Arrows indicate when major ®res occured
Figure 14. Temporal patterns in calcium in Lake 239 and Nevins Lake during drought. Data for Lake 239 are from Schindler et al.(1990) and for Nevins Lake are adapted from Webster et al. (1990)
HYDROLOGICAL PROCESSES, VOL. 11, 825±871 (1997) # 1997 by John Wiley & Sons, Ltd.
850 J. J. MAGNUSON ET AL.
reduction caused sulfate : cation ratios to decline rather quickly, despite long water residence times. This,plus the return of base cations from sediments, caused the alkalinity to increase by 30±50% and pH toincrease a few tenths of a unit (Schindler et al., 1990, 1996a). Total dissolved nitrogen increased in Lake 240and initially in Lake 239, with subsequent declines presumably related to changes in in-lake processes(Schindler et al., 1990, 1996a).
A less extensive drought in northern Wisconsin from 1987 to 1990 also altered the hydrological pathwaysof water and solute ¯ow to lake ecosystems. In contrast to the ELA drainage lakes set in thin soils �50�5 m inthickness), the Wisconsin lakes are a mixture of seepage and drainage systems set in thick sandy outwash tilldeposited by receding glaciers. Many chemical, biological and physical attributes of the Wisconsin lakes arerelated to their position in the groundwater ¯ow system, ranging from precipitation-dominated lakes high inthe landscape to groundwater-dominated lakes low in the landscape (Kratz et al., 1997). Changes in thecations, Ca and Mg, during drought were related to lake landscape position (Webster et al., 1996). Cationconcentrations increased during drought as observed for the ELA lakes, but di�erences in the direction ofchange in cation mass, which accounts for the e�ect of evapoconcentration, were related to lake landscapeposition. This suggests that lakes may diverge in their long-term response to warmer and drier conditions.Increases in cation mass for lakes low in the landscape during drought were attributed to proportionatelyhigh inputs of groundwater from deeper ¯ow paths (which are more cation rich) and to a lessening of thediluting e�ect of precipitation. In contrast, cation mass declined for lakes high in the landscape as transientgroundwater in¯ows were interrupted during drought. Such di�erences among lakes are apparent in long-term calcium data on Lake 239 at ELA and Nevins Lake in the upper peninsula of Michigan (Figure 14). InNevins, cation and silica concentrations, alkalinity and pH rapidly declined during the same drought(Webster et al., 1990). This lake has a short water retention time �52 years) compared with other seepagelakes and its chemistry is extremely responsive to changes in groundwater inputs driven by climate(Krabbenhoft and Webster, 1995).
In addition to responses to altered inputs of solutes, the biogeochemical cycling of nutrients and other ionsin lake ecosystems will be in¯uenced greatly by the oxygen conditions in a lake's deep waters. Manycompounds, such as iron phosphates, are more soluble under anoxic conditions; their availability to thewater column from nutrient-rich sediments would be increased with increased anoxic conditions. Thus,recycling of nutrients from the sediments to the water column would be enhanced by climate warming inthermally strati®ed lakes during summer. This would be countered to an unknown extent by reductions inhydrological ¯ow and associated nutrient export from the catchments.Climate conditions also in¯uence retention and cycling of solutes in peatlands. Pulsed exports of sulfate,
acidity and cations occurred from a minerotrophic swamp located near Dorset (LaZerte, 1993) and from apeatland draining into Lake 239 at ELA (Bayley et al., 1992a) after dry summers when accumulated sulfurwas exposed and oxidized. The strength of these acid pulses was related to deposition history; underconditions of higher acid loading and, thus, increased storage of sulfur, the potential for acidi®cation eventsat downstream sites is enhanced (Bayley et al., 1986). The cycling of solutes, particularly carbon, withinpeatlands is a function of groundwater ¯ow patterns, which, in turn, are in¯uenced by climate (Siegel et al.,1995). In a northern Minnesota peatland, groundwater ¯ow advected dissolved organic compounds intodeeper peat layers during wet periods, stimulating methanogenesis, while during dry periods a dischargeregime dominated and organic compounds were advected upwards, limiting methanogenesis to the morerefractory carbon of the peat itself (Siegel et al., 1995).
The biogeochemical responses of small lakes, streams and peatlands to climate change reveal an intricateinteraction between weather, catchments and lakes, and between physical, chemical and biological e�ects.Biological factors on the land and geomorphological legacies in¯uence how aquatic ecosystems respond toclimate change. For example, standing trees on the shoreline a�ect wind exposure and lake thermalproperties; DOC export from catchments in¯uences light penetration and mixing depth; and position in thehydrological ¯ow system in¯uences changes in solute concentrations. Biogeochemical responses are also afunction of lake water retention time and the biological reactivity of a given solute.
# 1997 by John Wiley & Sons, Ltd. HYDROLOGICAL PROCESSES, VOL. 11, 825±871 (1997)
2: LAURENTIAN GREAT LAKES AND PRECAMBRIAN SHIELD 851
AQUATIC ECOLOGY
Responses to the diverse changes in the physicochemical environments induced by changes in climate canoccur in individual organisms, in populations of organisms, in communities of interacting species and in thestructure of interactions between biotic and abiotic components of entire aquatic ecosystems, including thelandscape in which the lakes, streams and wetlands are imbedded. Our review treats these responses for thephytoplankton, zooplankton, benthos and ®shes. The phytoplankton are the microscopic algae that live inthe water column and, through their photosynthetic production of new organic matter, form the major basefor the food-web in lakes. The zooplankton are microscopic animals that live in the water column and,functionally, are either herbivores on the phytoplankton or predators on smaller zooplankton. The benthosare organisms that live on bottom substrates of lakes, wetlands and streams; they include a wide range ofplants and animals, from large-rooted plants and algal mats to immature insects, clams and snails andbottom-dwelling ®shes. The ®shes are generally long lived and mobile; they can be herbivores, predators oromnivores; they play important structuring roles in aquatic communities; and they are valued for sport, foodand biological diversity.
Phytoplankton
Increased epilimnion temperatures are unlikely to a�ect rates of phytoplankton primary productiondirectly, but species composition would change, annual production would increase and phytoplanktondiversity and biomass might increase. The phytoplankton community consists of hundreds of species withsimple life cycles. Even though rates of photosynthesis of nutrient-su�cient algal cultures increaseexponentially with increasing temperature (Eppley, 1972), the realized rate of photosynthesis in lakes isvirtually independent of temperature for several reasons.
1. Algae rapidly adapt to the temperature at which they are grown; thus, realized rates of photosynthesis,even in isolated species, are either partially or fully independent of temperature (Davison, 1991).
2. In freshwater, in situ phytoplankton photosynthesis is typically either nutrient (phosphorus, nitrogen,silica) or light limited, especially during midsummer when the greatest temperature increases are expected(Schindler, 1977; Healey and Hendzel, 1980); these primary limitations prevent phytoplankton fromachieving temperature-determined physiological limits (Fee et al., 1987).
3. Some phytoplankton species are favoured by lower temperatures, while others are favoured by highertemperatures. Because life cycles are short, competition soon results in a community capable of photo-synthesizing optimally at any temperature.
Results from a long-term study of phytoplankton photosynthesis in seven Canadian Shield lakes, rangingin size from 30 to 34 600 ha (Fee et al., 1992), clearly support these ideas.
1. As in most unperturbed temperate zone lakes, variations of chlorophyll concentration andphytoplankton production were highest in the spring and lowest in midsummer; i.e. the inverse of variationsof temperature but precisely the pattern of variation of nutrient availability.
2. Interannual variations of phytoplankton production were unrelated to epilimnion temperatures (whichvaried by43�08C; i.e. similar to the range of the mean temperature rise predicted for a 2� CO2 climate), butwere signi®cantly and positively related with total rainfall, which is the main nutrient source to remote shieldlakes (Fee et al., 1994).
Clearly, nutrients, not temperature, are the factors of greatest importance in determining phytoplanktongrowth and abundance in shield lakes (Hecky and Kilham, 1988). This conclusion is supported by 24 yearsof phytoplankton community composition data at the species level from a variety of lakes in the Experi-mental Lakes Area, where year to year changes of community composition correlated strongly withchemical variables (pH, DOC, nutrients, total cations) but not at all with water temperature (Kasian et al.,
HYDROLOGICAL PROCESSES, VOL. 11, 825±871 (1997) # 1997 by John Wiley & Sons, Ltd.
852 J. J. MAGNUSON ET AL.
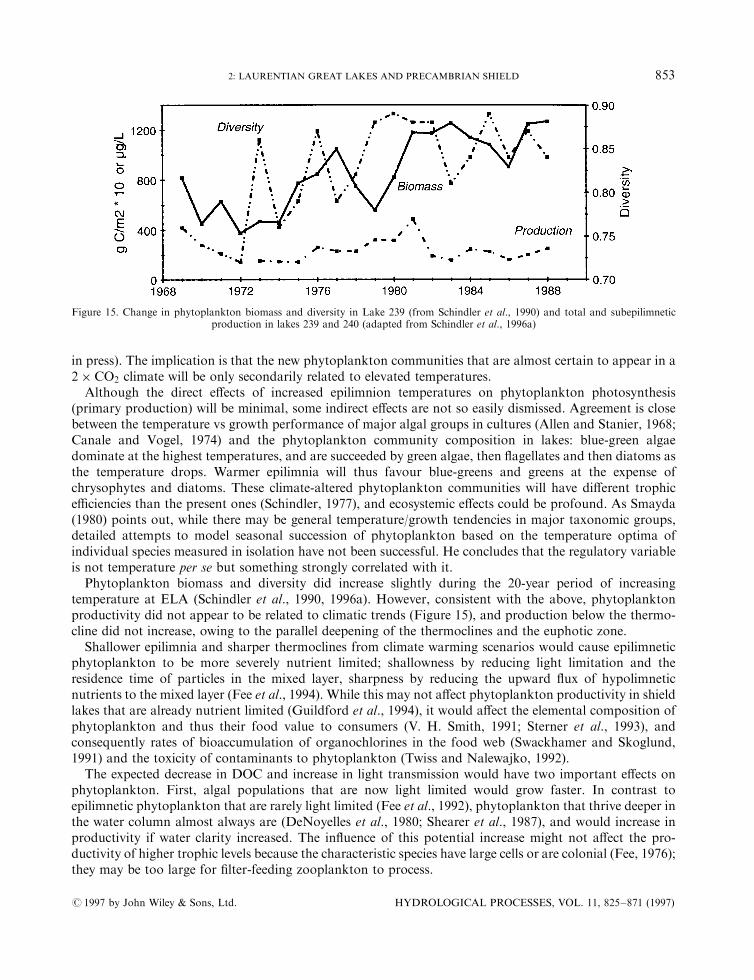
in press). The implication is that the new phytoplankton communities that are almost certain to appear in a2� CO2 climate will be only secondarily related to elevated temperatures.
Although the direct e�ects of increased epilimnion temperatures on phytoplankton photosynthesis(primary production) will be minimal, some indirect e�ects are not so easily dismissed. Agreement is closebetween the temperature vs growth performance of major algal groups in cultures (Allen and Stanier, 1968;Canale and Vogel, 1974) and the phytoplankton community composition in lakes: blue-green algaedominate at the highest temperatures, and are succeeded by green algae, then ¯agellates and then diatoms asthe temperature drops. Warmer epilimnia will thus favour blue-greens and greens at the expense ofchrysophytes and diatoms. These climate-altered phytoplankton communities will have di�erent trophice�ciencies than the present ones (Schindler, 1977), and ecosystemic e�ects could be profound. As Smayda(1980) points out, while there may be general temperature/growth tendencies in major taxonomic groups,detailed attempts to model seasonal succession of phytoplankton based on the temperature optima ofindividual species measured in isolation have not been successful. He concludes that the regulatory variableis not temperature per se but something strongly correlated with it.Phytoplankton biomass and diversity did increase slightly during the 20-year period of increasing
temperature at ELA (Schindler et al., 1990, 1996a). However, consistent with the above, phytoplanktonproductivity did not appear to be related to climatic trends (Figure 15), and production below the thermo-cline did not increase, owing to the parallel deepening of the thermoclines and the euphotic zone.
Shallower epilimnia and sharper thermoclines from climate warming scenarios would cause epilimneticphytoplankton to be more severely nutrient limited; shallowness by reducing light limitation and theresidence time of particles in the mixed layer, sharpness by reducing the upward ¯ux of hypolimneticnutrients to the mixed layer (Fee et al., 1994). While this may not a�ect phytoplankton productivity in shieldlakes that are already nutrient limited (Guildford et al., 1994), it would a�ect the elemental composition ofphytoplankton and thus their food value to consumers (V. H. Smith, 1991; Sterner et al., 1993), andconsequently rates of bioaccumulation of organochlorines in the food web (Swackhamer and Skoglund,1991) and the toxicity of contaminants to phytoplankton (Twiss and Nalewajko, 1992).
The expected decrease in DOC and increase in light transmission would have two important e�ects onphytoplankton. First, algal populations that are now light limited would grow faster. In contrast toepilimnetic phytoplankton that are rarely light limited (Fee et al., 1992), phytoplankton that thrive deeper inthe water column almost always are (DeNoyelles et al., 1980; Shearer et al., 1987), and would increase inproductivity if water clarity increased. The in¯uence of this potential increase might not a�ect the pro-ductivity of higher trophic levels because the characteristic species have large cells or are colonial (Fee, 1976);they may be too large for ®lter-feeding zooplankton to process.
Figure 15. Change in phytoplankton biomass and diversity in Lake 239 (from Schindler et al., 1990) and total and subepilimneticproduction in lakes 239 and 240 (adapted from Schindler et al., 1996a)
# 1997 by John Wiley & Sons, Ltd. HYDROLOGICAL PROCESSES, VOL. 11, 825±871 (1997)
2: LAURENTIAN GREAT LAKES AND PRECAMBRIAN SHIELD 853
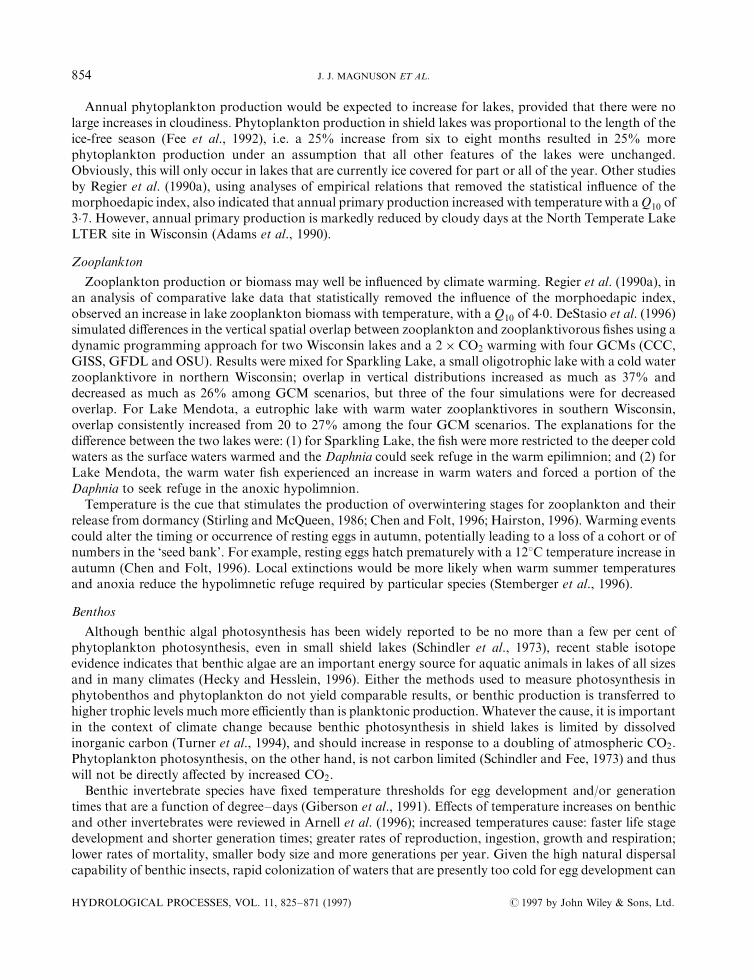
Annual phytoplankton production would be expected to increase for lakes, provided that there were nolarge increases in cloudiness. Phytoplankton production in shield lakes was proportional to the length of theice-free season (Fee et al., 1992), i.e. a 25% increase from six to eight months resulted in 25% morephytoplankton production under an assumption that all other features of the lakes were unchanged.Obviously, this will only occur in lakes that are currently ice covered for part or all of the year. Other studiesby Regier et al. (1990a), using analyses of empirical relations that removed the statistical in¯uence of themorphoedapic index, also indicated that annual primary production increased with temperature with aQ10 of3.7. However, annual primary production is markedly reduced by cloudy days at the North Temperate LakeLTER site in Wisconsin (Adams et al., 1990).
Zooplankton
Zooplankton production or biomass may well be in¯uenced by climate warming. Regier et al. (1990a), inan analysis of comparative lake data that statistically removed the in¯uence of the morphoedapic index,observed an increase in lake zooplankton biomass with temperature, with a Q10 of 4.0. DeStasio et al. (1996)simulated di�erences in the vertical spatial overlap between zooplankton and zooplanktivorous ®shes using adynamic programming approach for two Wisconsin lakes and a 2� CO2 warming with four GCMs (CCC,GISS, GFDL and OSU). Results were mixed for Sparkling Lake, a small oligotrophic lake with a cold waterzooplanktivore in northern Wisconsin; overlap in vertical distributions increased as much as 37% anddecreased as much as 26% among GCM scenarios, but three of the four simulations were for decreasedoverlap. For Lake Mendota, a eutrophic lake with warm water zooplanktivores in southern Wisconsin,overlap consistently increased from 20 to 27% among the four GCM scenarios. The explanations for thedi�erence between the two lakes were: (1) for Sparkling Lake, the ®sh were more restricted to the deeper coldwaters as the surface waters warmed and the Daphnia could seek refuge in the warm epilimnion; and (2) forLake Mendota, the warm water ®sh experienced an increase in warm waters and forced a portion of theDaphnia to seek refuge in the anoxic hypolimnion.
Temperature is the cue that stimulates the production of overwintering stages for zooplankton and theirrelease from dormancy (Stirling andMcQueen, 1986; Chen and Folt, 1996; Hairston, 1996). Warming eventscould alter the timing or occurrence of resting eggs in autumn, potentially leading to a loss of a cohort or ofnumbers in the `seed bank'. For example, resting eggs hatch prematurely with a 128C temperature increase inautumn (Chen and Folt, 1996). Local extinctions would be more likely when warm summer temperaturesand anoxia reduce the hypolimnetic refuge required by particular species (Stemberger et al., 1996).
Benthos
Although benthic algal photosynthesis has been widely reported to be no more than a few per cent ofphytoplankton photosynthesis, even in small shield lakes (Schindler et al., 1973), recent stable isotopeevidence indicates that benthic algae are an important energy source for aquatic animals in lakes of all sizesand in many climates (Hecky and Hesslein, 1996). Either the methods used to measure photosynthesis inphytobenthos and phytoplankton do not yield comparable results, or benthic production is transferred tohigher trophic levels much more e�ciently than is planktonic production. Whatever the cause, it is importantin the context of climate change because benthic photosynthesis in shield lakes is limited by dissolvedinorganic carbon (Turner et al., 1994), and should increase in response to a doubling of atmospheric CO2.Phytoplankton photosynthesis, on the other hand, is not carbon limited (Schindler and Fee, 1973) and thuswill not be directly a�ected by increased CO2.
Benthic invertebrate species have ®xed temperature thresholds for egg development and/or generationtimes that are a function of degree±days (Giberson et al., 1991). E�ects of temperature increases on benthicand other invertebrates were reviewed in Arnell et al. (1996); increased temperatures cause: faster life stagedevelopment and shorter generation times; greater rates of reproduction, ingestion, growth and respiration;lower rates of mortality, smaller body size and more generations per year. Given the high natural dispersalcapability of benthic insects, rapid colonization of waters that are presently too cold for egg development can
HYDROLOGICAL PROCESSES, VOL. 11, 825±871 (1997) # 1997 by John Wiley & Sons, Ltd.
854 J. J. MAGNUSON ET AL.
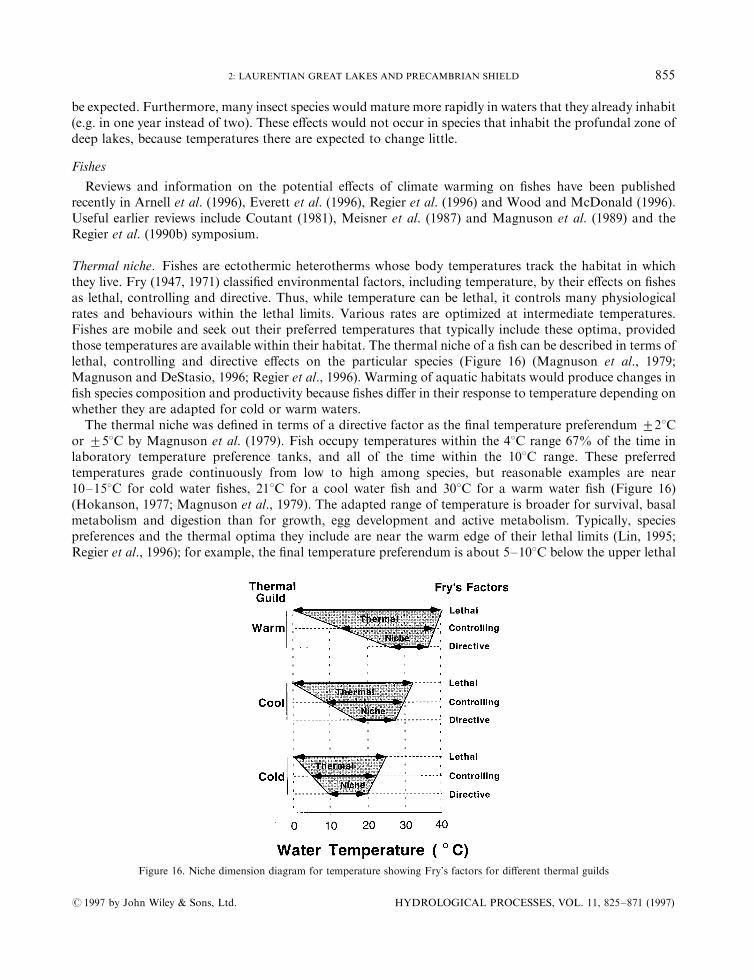
be expected. Furthermore, many insect species would mature more rapidly in waters that they already inhabit(e.g. in one year instead of two). These e�ects would not occur in species that inhabit the profundal zone ofdeep lakes, because temperatures there are expected to change little.
Fishes
Reviews and information on the potential e�ects of climate warming on ®shes have been publishedrecently in Arnell et al. (1996), Everett et al. (1996), Regier et al. (1996) and Wood and McDonald (1996).Useful earlier reviews include Coutant (1981), Meisner et al. (1987) and Magnuson et al. (1989) and theRegier et al. (1990b) symposium.
Thermal niche. Fishes are ectothermic heterotherms whose body temperatures track the habitat in whichthey live. Fry (1947, 1971) classi®ed environmental factors, including temperature, by their e�ects on ®shesas lethal, controlling and directive. Thus, while temperature can be lethal, it controls many physiologicalrates and behaviours within the lethal limits. Various rates are optimized at intermediate temperatures.Fishes are mobile and seek out their preferred temperatures that typically include these optima, providedthose temperatures are available within their habitat. The thermal niche of a ®sh can be described in terms oflethal, controlling and directive e�ects on the particular species (Figure 16) (Magnuson et al., 1979;Magnuson and DeStasio, 1996; Regier et al., 1996). Warming of aquatic habitats would produce changes in®sh species composition and productivity because ®shes di�er in their response to temperature depending onwhether they are adapted for cold or warm waters.The thermal niche was de®ned in terms of a directive factor as the ®nal temperature preferendum +28C
or +58C by Magnuson et al. (1979). Fish occupy temperatures within the 48C range 67% of the time inlaboratory temperature preference tanks, and all of the time within the 108C range. These preferredtemperatures grade continuously from low to high among species, but reasonable examples are near10±158C for cold water ®shes, 218C for a cool water ®sh and 308C for a warm water ®sh (Figure 16)(Hokanson, 1977; Magnuson et al., 1979). The adapted range of temperature is broader for survival, basalmetabolism and digestion than for growth, egg development and active metabolism. Typically, speciespreferences and the thermal optima they include are near the warm edge of their lethal limits (Lin, 1995;Regier et al., 1996); for example, the ®nal temperature preferendum is about 5±108C below the upper lethal
Figure 16. Niche dimension diagram for temperature showing Fry's factors for di�erent thermal guilds
# 1997 by John Wiley & Sons, Ltd. HYDROLOGICAL PROCESSES, VOL. 11, 825±871 (1997)
2: LAURENTIAN GREAT LAKES AND PRECAMBRIAN SHIELD 855
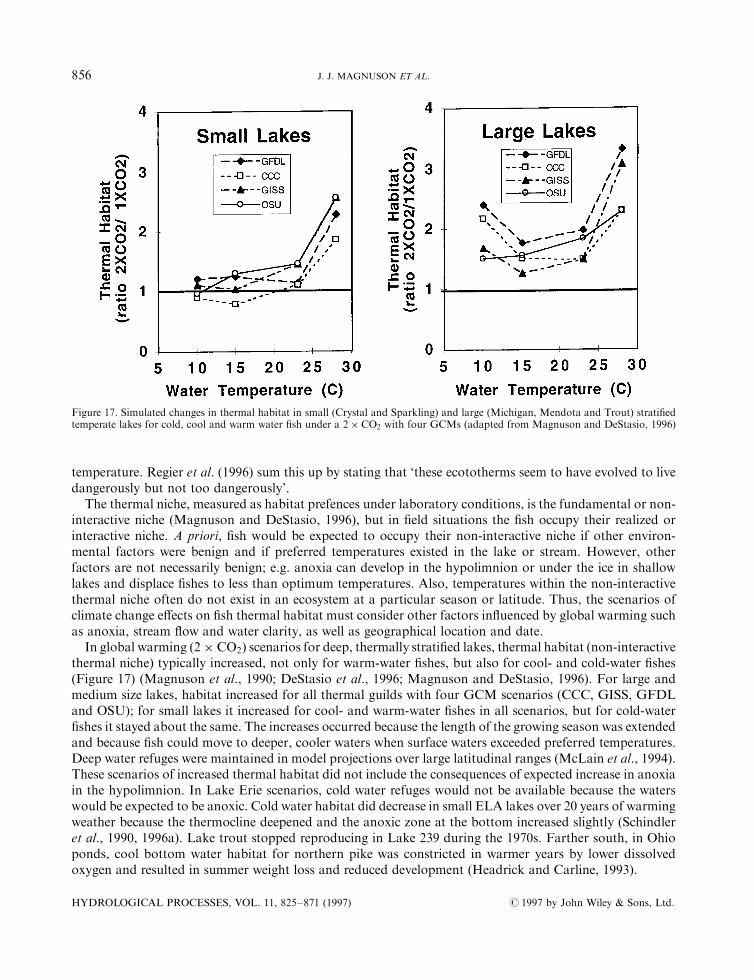
temperature. Regier et al. (1996) sum this up by stating that `these ecototherms seem to have evolved to livedangerously but not too dangerously'.
The thermal niche, measured as habitat prefences under laboratory conditions, is the fundamental or non-interactive niche (Magnuson and DeStasio, 1996), but in ®eld situations the ®sh occupy their realized orinteractive niche. A priori, ®sh would be expected to occupy their non-interactive niche if other environ-mental factors were benign and if preferred temperatures existed in the lake or stream. However, otherfactors are not necessarily benign; e.g. anoxia can develop in the hypolimnion or under the ice in shallowlakes and displace ®shes to less than optimum temperatures. Also, temperatures within the non-interactivethermal niche often do not exist in an ecosystem at a particular season or latitude. Thus, the scenarios ofclimate change e�ects on ®sh thermal habitat must consider other factors in¯uenced by global warming suchas anoxia, stream ¯ow and water clarity, as well as geographical location and date.
In global warming �2� CO2� scenarios for deep, thermally strati®ed lakes, thermal habitat (non-interactivethermal niche) typically increased, not only for warm-water ®shes, but also for cool- and cold-water ®shes(Figure 17) (Magnuson et al., 1990; DeStasio et al., 1996; Magnuson and DeStasio, 1996). For large andmedium size lakes, habitat increased for all thermal guilds with four GCM scenarios (CCC, GISS, GFDLand OSU); for small lakes it increased for cool- and warm-water ®shes in all scenarios, but for cold-water®shes it stayed about the same. The increases occurred because the length of the growing season was extendedand because ®sh could move to deeper, cooler waters when surface waters exceeded preferred temperatures.Deep water refuges were maintained in model projections over large latitudinal ranges (McLain et al., 1994).These scenarios of increased thermal habitat did not include the consequences of expected increase in anoxiain the hypolimnion. In Lake Erie scenarios, cold water refuges would not be available because the waterswould be expected to be anoxic. Cold water habitat did decrease in small ELA lakes over 20 years of warmingweather because the thermocline deepened and the anoxic zone at the bottom increased slightly (Schindleret al., 1990, 1996a). Lake trout stopped reproducing in Lake 239 during the 1970s. Farther south, in Ohioponds, cool bottom water habitat for northern pike was constricted in warmer years by lower dissolvedoxygen and resulted in summer weight loss and reduced development (Headrick and Carline, 1993).
Figure 17. Simulated changes in thermal habitat in small (Crystal and Sparkling) and large (Michigan, Mendota and Trout) strati®edtemperate lakes for cold, cool and warm water ®sh under a 2� CO2 with four GCMs (adapted from Magnuson and DeStasio, 1996)
HYDROLOGICAL PROCESSES, VOL. 11, 825±871 (1997) # 1997 by John Wiley & Sons, Ltd.
856 J. J. MAGNUSON ET AL.
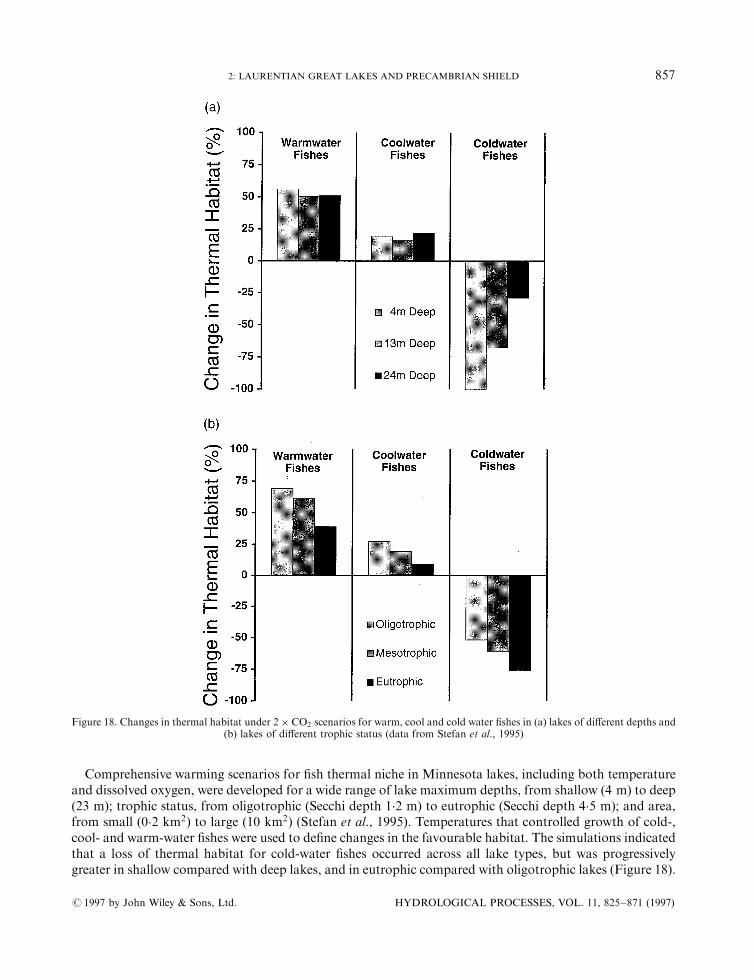
Comprehensive warming scenarios for ®sh thermal niche in Minnesota lakes, including both temperatureand dissolved oxygen, were developed for a wide range of lake maximum depths, from shallow (4 m) to deep(23 m); trophic status, from oligotrophic (Secchi depth 1.2 m) to eutrophic (Secchi depth 4.5 m); and area,from small (0.2 km2) to large (10 km2) (Stefan et al., 1995). Temperatures that controlled growth of cold-,cool- and warm-water ®shes were used to de®ne changes in the favourable habitat. The simulations indicatedthat a loss of thermal habitat for cold-water ®shes occurred across all lake types, but was progressivelygreater in shallow compared with deep lakes, and in eutrophic compared with oligotrophic lakes (Figure 18).
Figure 18. Changes in thermal habitat under 2�CO2 scenarios for warm, cool and cold water ®shes in (a) lakes of di�erent depths and(b) lakes of di�erent trophic status (data from Stefan et al., 1995)
# 1997 by John Wiley & Sons, Ltd. HYDROLOGICAL PROCESSES, VOL. 11, 825±871 (1997)
2: LAURENTIAN GREAT LAKES AND PRECAMBRIAN SHIELD 857
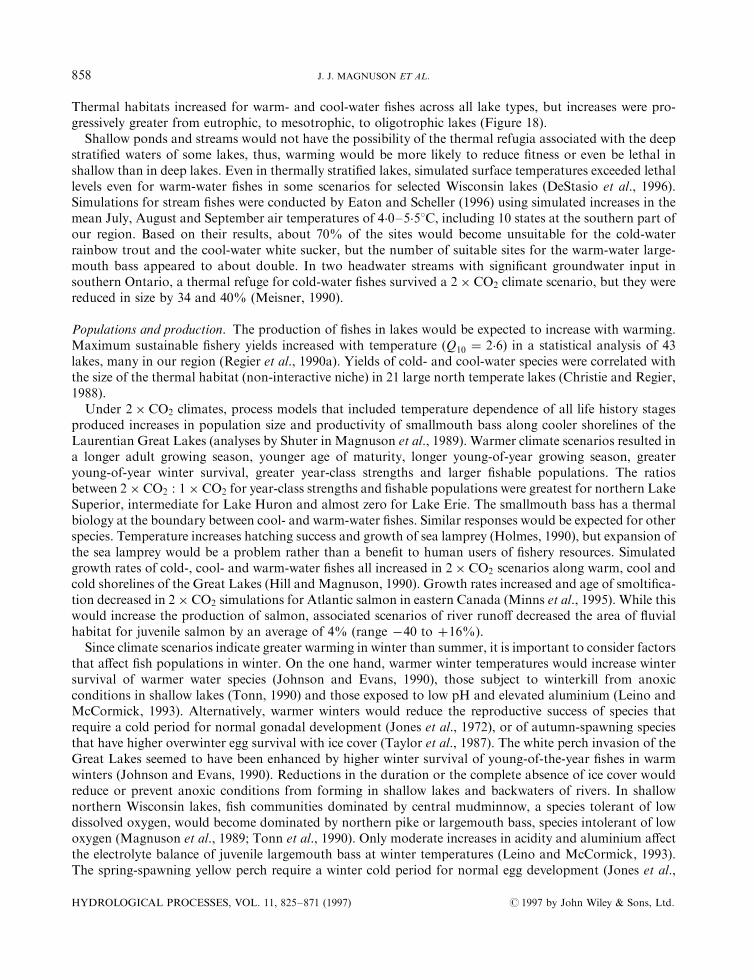
Thermal habitats increased for warm- and cool-water ®shes across all lake types, but increases were pro-gressively greater from eutrophic, to mesotrophic, to oligotrophic lakes (Figure 18).Shallow ponds and streams would not have the possibility of the thermal refugia associated with the deep
strati®ed waters of some lakes, thus, warming would be more likely to reduce ®tness or even be lethal inshallow than in deep lakes. Even in thermally strati®ed lakes, simulated surface temperatures exceeded lethallevels even for warm-water ®shes in some scenarios for selected Wisconsin lakes (DeStasio et al., 1996).Simulations for stream ®shes were conducted by Eaton and Scheller (1996) using simulated increases in themean July, August and September air temperatures of 4.0±5.58C, including 10 states at the southern part ofour region. Based on their results, about 70% of the sites would become unsuitable for the cold-waterrainbow trout and the cool-water white sucker, but the number of suitable sites for the warm-water large-mouth bass appeared to about double. In two headwater streams with signi®cant groundwater input insouthern Ontario, a thermal refuge for cold-water ®shes survived a 2� CO2 climate scenario, but they werereduced in size by 34 and 40% (Meisner, 1990).
Populations and production. The production of ®shes in lakes would be expected to increase with warming.Maximum sustainable ®shery yields increased with temperature �Q10 � 2�6� in a statistical analysis of 43lakes, many in our region (Regier et al., 1990a). Yields of cold- and cool-water species were correlated withthe size of the thermal habitat (non-interactive niche) in 21 large north temperate lakes (Christie and Regier,1988).
Under 2� CO2 climates, process models that included temperature dependence of all life history stagesproduced increases in population size and productivity of smallmouth bass along cooler shorelines of theLaurentian Great Lakes (analyses by Shuter in Magnuson et al., 1989). Warmer climate scenarios resulted ina longer adult growing season, younger age of maturity, longer young-of-year growing season, greateryoung-of-year winter survival, greater year-class strengths and larger ®shable populations. The ratiosbetween 2� CO2 : 1� CO2 for year-class strengths and ®shable populations were greatest for northern LakeSuperior, intermediate for Lake Huron and almost zero for Lake Erie. The smallmouth bass has a thermalbiology at the boundary between cool- and warm-water ®shes. Similar responses would be expected for otherspecies. Temperature increases hatching success and growth of sea lamprey (Holmes, 1990), but expansion ofthe sea lamprey would be a problem rather than a bene®t to human users of ®shery resources. Simulatedgrowth rates of cold-, cool- and warm-water ®shes all increased in 2� CO2 scenarios along warm, cool andcold shorelines of the Great Lakes (Hill and Magnuson, 1990). Growth rates increased and age of smolti®ca-tion decreased in 2� CO2 simulations for Atlantic salmon in eastern Canada (Minns et al., 1995). While thiswould increase the production of salmon, associated scenarios of river runo� decreased the area of ¯uvialhabitat for juvenile salmon by an average of 4% (range ÿ40 to �16%�.
Since climate scenarios indicate greater warming in winter than summer, it is important to consider factorsthat a�ect ®sh populations in winter. On the one hand, warmer winter temperatures would increase wintersurvival of warmer water species (Johnson and Evans, 1990), those subject to winterkill from anoxicconditions in shallow lakes (Tonn, 1990) and those exposed to low pH and elevated aluminium (Leino andMcCormick, 1993). Alternatively, warmer winters would reduce the reproductive success of species thatrequire a cold period for normal gonadal development (Jones et al., 1972), or of autumn-spawning speciesthat have higher overwinter egg survival with ice cover (Taylor et al., 1987). The white perch invasion of theGreat Lakes seemed to have been enhanced by higher winter survival of young-of-the-year ®shes in warmwinters (Johnson and Evans, 1990). Reductions in the duration or the complete absence of ice cover wouldreduce or prevent anoxic conditions from forming in shallow lakes and backwaters of rivers. In shallownorthern Wisconsin lakes, ®sh communities dominated by central mudminnow, a species tolerant of lowdissolved oxygen, would become dominated by northern pike or largemouth bass, species intolerant of lowoxygen (Magnuson et al., 1989; Tonn et al., 1990). Only moderate increases in acidity and aluminium a�ectthe electrolyte balance of juvenile largemouth bass at winter temperatures (Leino and McCormick, 1993).The spring-spawning yellow perch require a winter cold period for normal egg development (Jones et al.,
HYDROLOGICAL PROCESSES, VOL. 11, 825±871 (1997) # 1997 by John Wiley & Sons, Ltd.
858 J. J. MAGNUSON ET AL.
1972); the highest percentages of viable eggs produced were 93% after overwintering at 48C; at 68C only 65%were viable and at 88C only 31%. In Grand Traverse Bay, Lake Michigan, year classes of lake white®sh weresmaller by an order of magnitude in years without ice cover than in years with ice cover, apparently becauseeggs on the bottom were dislodged from favourable substrates by the increased turbulence and currentswithout ice cover (Taylor et al., 1987; Freeberg et al., 1990; Brown and Taylor, 1993).
Species near the northern limits of their range have good years of recruitment and growth that arepositively related to summer temperatures (Pereira et al., 1995a,b). Such relationships were observed forfreshwater drum, walleye, sauger and possibly for smallmouth bass in long-term data fromMinnesota. Thesegrowth and recruitment events related to summer temperatures provide another example that ®shpopulations would be sensitive to warming scenarios.
Many ®sh species, but not all, would grow faster, become more productive and disperse northwards. Theability of young-of-year ®shes to reach a su�cient size to overwinter successfully explains the presentnorthern limit of smallmouth bass and yellow perch across our region and other areas of Canada (Shuter andPost, 1990). Simulations of a new northern limit under 2� CO2 climate scenarios using this criterion resultedin a potential northward dispersal of about 500 km. Simulations for a doubling of CO2 from an empiricalanalysis of ®sh distributions in Ontario watersheds produced similar potentials for a northward dispersal forsmallmouth bass and carp, ca. 500±600 km (Minns and Moore, 1995). Thus, warming would be expected toaccelerate greatly the northward dispersal of ®shes following the Wisconsin glaciation.
In open systems like the Great Lakes and in north/south rivers, as successively warmer species werefavoured, changes in species composition, abundance and overall production would occur; other warm-water species would invade through connecting rivers and canals (Mandrak, 1989). Such changes would alsobe expected to extend north of the Laurentian Great Lakes, with the Great Lakes serving as new sources ofcolonists. With an air temperature increase of 4.5±5.58C, simulated increases in species richness ranged from12 to 60 species per tertiary watershed in Ontario using empirical statistical models (Minns and Moore,1995). At an individual lake level, the mean scenario was for three new species per lake, which, whencompared with the present richness of 3±6 species per lake across much of Ontario, is a large increase; thechanges in community structure and dynamics would be dramatic. Dispersal of 33 species already occurringin Ontario but with distributions bounded by temperature, di�er across the province (Figure 19); fewerinvasions would occur to the north owing to temperature limitations even after the warming scenario, andfewer would occur to the south because many of the species already occur there. In more closed aquaticsystems both in Ontario and across the region, such as seepage lakes without inlets or outlets or streamreaches above impassable waterfalls or dams, the arrival of warm-water fauna would also be inhibited. At thesame time, to the south, especially in shallow habitats, cold- and even cool-water species would ®ndthemselves in progressively suboptimal environments and their populations would be expected to declineprogressively from the south. Within the geographical region now inhabited by cold- and cool-water species,local geomorphological, hydrological and anthropogenic factors such as lake depth, groundwater in¯ow andwaste heat loadings would result in populations disappearing in a salt and pepper fashion over broadregions, as simulated by Eaton and Scheller (1996).
IMPLICATIONS OF TERRESTRIAL±AQUATIC LINKAGES
Although the potential e�ects of climate change on terrestrial environments and aquatic systems have beendiscussed extensively in the literature, less is known about the interactions between terrestrial and aquaticenvironments with respect to a changing climate. Interactions among the atmospheric (chemistry andclimate), terrestrial (vegetation and soils) and aquatic (¯owing water, wetlands and lakes) biomes arecomplex (Figure 20). Climate (and thus climate change) a�ects atmospheric chemistry, vegetation, soils,hydrology and aquatic ecosystems; the converse is also true. Included among the terrestrial processes thatwould directly or indirectly a�ect aquatic systems in a warming climate are increased rates of ®re anddrought, changes in the physical and chemical properties of soils and altered hydrology in both space and
# 1997 by John Wiley & Sons, Ltd. HYDROLOGICAL PROCESSES, VOL. 11, 825±871 (1997)
2: LAURENTIAN GREAT LAKES AND PRECAMBRIAN SHIELD 859
time. Increased CO2 concentrations will indirectly a�ect the terrestrial ecosystem through increased ratesof photosynthesis, evapotranspiration, and respiration at higher temperatures. The e�ects of rising tempera-ture on respiration may overwhelm the direct e�ects of rising CO2 on photosynthesis and growth (Drake,1992), although increases in CO2 can reduce plant respiration (Bunce, 1994). Since plant metabolism andstomatal control of water loss depend on other climatic factors such as humidity and wind, an increase inevapotranspiration cannot necessarily be assumed (Rosenberg et al., 1990 as cited by Po�, 1992).Climate-related changes in precipitation, runo� and soil moisture will alter redox potentials and most
likely cause declines in wetland coverage, both spatially and temporally. These changes will in¯uence DOCproduction and export (Hemond, 1990; Sedell and Dahm, 1990) and the cycling of sulfur, phosphorus,nitrogen and metals (Devito and Dillon, 1993a,b), and will a�ect detrimentally the fauna that rely onwetlands for habitat. For example, the storage of sulfate and/or the oxidation of stored reduced sulfurusually occurs during dry seasons (Dillon and LaZerte, 1992), or in dry years when the water table recedes.At the beginning of the next season, or in a wet year, the stored sulfate is released back into the out¯owingwaters. The implication is that sulfur inputs to streams and lakes will be a�ected by climate change long afteranthropogenic reductions in sulfate deposition occur. Decreased export of DOC from terrestrial to aquaticenvironments is expected to occur with climate warming and drying. DOC originates from the forest canopy,the forest ¯oor, the mineral soil, wetlands and groundwater (Cronan, 1990). The quality of the DOC varieswith source material and the chemical composition of the water leaching through it (Hynes, 1975; Wetzel,1992). Higher carbon content in the terrestrial system might lead to higher DOC concentrations in mineralsoils, which could counter, in part, the observed decreases in catchment export. Alternatively, soil warmingcould result in accelerated respiration of soil organic matter, which would otherwise be transported tostreams as DOC, and thus decrease DOC inputs (Meyer and Pulliam, 1992).
Figure 19. Tertiary watersheds in Ontario where 0±8, 9±16 and 17±24 of the 33 freshwater ®sh species with temperature-determinedboundaries are predicted to be able to invade following climate warming of 4.5±5.58C (modi®ed from Minns and Moore, 1995)
HYDROLOGICAL PROCESSES, VOL. 11, 825±871 (1997) # 1997 by John Wiley & Sons, Ltd.
860 J. J. MAGNUSON ET AL.
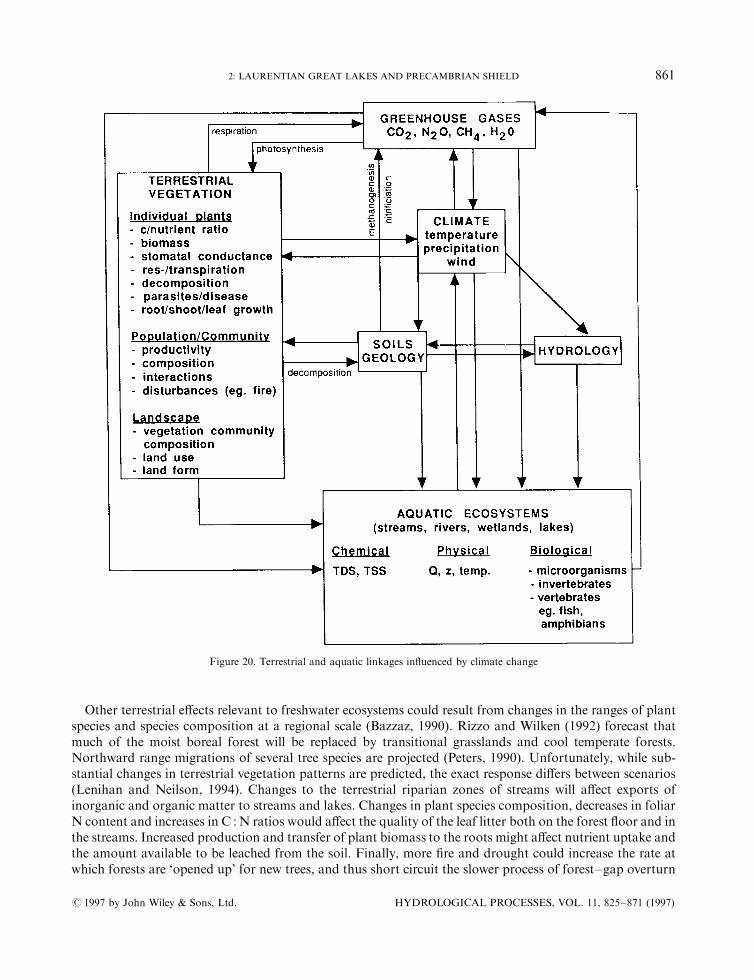
Other terrestrial e�ects relevant to freshwater ecosystems could result from changes in the ranges of plantspecies and species composition at a regional scale (Bazzaz, 1990). Rizzo and Wilken (1992) forecast thatmuch of the moist boreal forest will be replaced by transitional grasslands and cool temperate forests.Northward range migrations of several tree species are projected (Peters, 1990). Unfortunately, while sub-stantial changes in terrestrial vegetation patterns are predicted, the exact response di�ers between scenarios(Lenihan and Neilson, 1994). Changes to the terrestrial riparian zones of streams will a�ect exports ofinorganic and organic matter to streams and lakes. Changes in plant species composition, decreases in foliarN content and increases in C :N ratios would a�ect the quality of the leaf litter both on the forest ¯oor and inthe streams. Increased production and transfer of plant biomass to the roots might a�ect nutrient uptake andthe amount available to be leached from the soil. Finally, more ®re and drought could increase the rate atwhich forests are `opened up' for new trees, and thus short circuit the slower process of forest±gap overturn
Figure 20. Terrestrial and aquatic linkages in¯uenced by climate change
# 1997 by John Wiley & Sons, Ltd. HYDROLOGICAL PROCESSES, VOL. 11, 825±871 (1997)
2: LAURENTIAN GREAT LAKES AND PRECAMBRIAN SHIELD 861
through old age mortality (Overpeck et al., 1990). Inputs of woody debris to streams would increase, gapsleft by fallen trees would undergo succession and the litter contributed by successional species wouldincrease. In small streams, heavy litter accumulation from a longer dry season may cause deoxygenation(Hynes, 1975), which could a�ect transport of nutrients, DOC and metals.The e�ect of climate change on carbon storage in the terrestrial ecosystem depends on plant species
composition, soil water holding capacity and C :N dynamics. While most predict that, at least in the shortterm, carbon storage will increase because of higher productivity and C :N ratios (Post et al., 1992; Rastetteret al., 1992), rising temperatures might increase forest ecosystem respiration su�ciently for terrestrialecosystems to become a source and not a sink for CO2 (Drake, 1992). These predictions are complicated byexpected increases of ca. 40% in the frequency and intensity of ®res in boreal regions with global warming(Flannigan and VanWagner, 1991, cited in Kasischke et al., 1995). In the short term, the combined e�ects ofchanges in climate and ®re regime would in¯uence net carbon storage in the boreal forest through increasesof 20±50% in the area burned, an increase in forest ¯ammability and a decrease in carbon storage in theground layer (Kasischke et al., 1995). Over the long term (150±200 years), shifts in forest speciescomposition to more deciduous trees would result in more carbon storage as living biomass and a decrease inforest ¯ammability (Kasischke et al., 1995).
INTERACTIONS WITH OTHER STRESSES
Lakes integrate the combined e�ects of human activities in their catchments and airsheds. Thus, they can besensitive indicators of the added perturbations from climate warming. Many anthropogenic perturbations,already a�ecting aquatic systems in the Laurentian Great Lakes and Precambrian Shield Region, wouldinteract with the potential e�ects of climate change. Climate change e�ects are not independent of otherhuman stresses on the system, nor are the e�ects of these stresses independent of climate change e�ects.Interacting stresses include atmospheric deposition of acids and toxic organic chemicals; discharges ofagricultural, industrial, and domestic wastes; forest ®res and clear cutting; urbanization; pipeline andreservoir construction; mining; dredging; invasion of exotics; and so on. What most of these stresses have incommon is that they change the ¯uxes of water and dissolved and suspended materials, leading to the genericproblems of eutrophication and contamination. Thus, the stresses that we have been dealing with may beaccentuated, or in some cases countered, by the added e�ects of climate change. Below we discuss some ofthe potential interactions between climate warming and these other human-caused stresses on aquaticsystems, especially lakes.
Eutrophication
Regier et al. (1990a) made the case that the thermal e�ects of climate warming would super®ciallyresemble those of eutrophication. Their empirical relations indicated that annual primary production ofphytoplankton, zooplankton biomass and maximum sustained ®shery yields all increased with temperature.Increased anoxia of the deep hypolimnetic waters, a feature of eutrophication, also increased in climatewarming scenarios for both Lake Erie (Blumberg and DiToro, 1990) and small inland lakes scenarios (Stefanet al., 1993a, 1995; Stefan and Fang, 1994). Faster growth rates for ®shes in the Great Lakes were simulatedin warming scenarios, provided adequate prey were available to fuel higher metabolic rates (Hill andMagnuson, 1990). So, super®cially, the e�ects of eutrophication appear to parallel those of climate warming.
The in¯uence of climate change on nutrient dynamics is less certain and more contradictory. Becauseclimate change models predict lower runo� and, thus, a decline in nutrient export from catchments to lakes,a reduction in eutrophication might result. However, increases in the water residence time of lakes, asobserved for many ELA lakes during warmer conditions (Schindler et al., 1996a), may counteract thedecreased inputs, potentially causing an overall increase in the e�ective loading rate. In addition, theincreased frequency of severe weather events might result in higher pulsed inputs of nutrients during ¯oodingand runo� events in agricultural and urban catchments, or at construction sites. The greater duration and
HYDROLOGICAL PROCESSES, VOL. 11, 825±871 (1997) # 1997 by John Wiley & Sons, Ltd.
862 J. J. MAGNUSON ET AL.
extent of hypolimnetic anoxia would forecast an increase in recycling of nutrients from the sediments to thewater column and increased blooms during spring and autumn mixis during the erosion of the thermocline inlate summer and early autumn, and possibly in the metalimnion and hypolimnion of lakes that became evenclearer owing to the decrease in DOC induced by climate change.
Acid precipitation and toxic substances
Climate warming interacts with acid deposition in complex ways. Alkalization of lakes, related to theincreased importance of in-lake alkalinity-generation processes and decreased sulfate : cation ratios, wasobserved at ELA during the 20-year warming period (Schindler et al., 1996a). In contrast, both episodic andlong-term acidi®cation of lakes and streams have been attributed to drought. Dry conditions expose thelittoral zones of lakes and wetlands and enhance the oxidation of stored sulfur (Bayley et al., 1992b; LaZerte,1993; Yan et al., 1996). Subsequent wet conditions then ¯ush sulfate, cations and acidity into lakes andstreams in pulsed acidi®cation events. The acidity of these pulses is related to the deposition history; sitesreceiving higher acid loads export more acid waters (Bayley et al., 1986; LaZerte, 1993). During drought,inputs of solute-rich groundwater to precipitation-dominated seepage lakes decrease (Anderson and Cheng,1993; Wentz et al., 1995), with the potential for rapid acidi®cation (Webster et al., 1990). A set of headwater,acid-sensitive lakes monitored in northern Minnesota, Wisconsin and Michigan failed to show a consistentincrease in acid-neutralizing capacity (ANC) or pH as acid deposition rates declined in the region from 1983to 1994 (Webster and Brezonik, 1995). General declines of SO2ÿ
4 in the lakes were, instead, often associatedwith a decline in cations linked to decreased loading from deposition and decreased inputs of groundwaterlate in the 1980s.
Acidity, DOC and temperature changes related to climate warming could in¯uence the transport andbiological availability of a variety of toxic substances. The increased acidity of ¯ow from certain landformswould have the potential for higher transport of metals, which become more soluble at lower pH levels.Decreases in DOC concentrations could reduce the chemical binding capacity of waters and cause the biotice�ects of the toxins to increase (Connel and Miller, 1984; Moore et al., 1995, 1997; Schindler et al., 1996a).Increased transparency related to decreases in DOC could also increase the penetration of harmful UV-Bradiation in lakes (Schindler et al., 1996b; Yan et al., 1996). Warming of lakes could increase the accumu-lation of methyl mercury in ®shes; the ratio of methylation to demethylation increases with temperature anda high proportion of the variation in mercury content of ®shes was associated with warmer temperatures(Bodaly et al., 1993). Conversely, hydrological shifts that decrease the export of solutes from wetlands maylikewise reduce the transport of mercury to lakes and streams; methyl mercury concentrations in lakes show apositive relationship with DOC and wetland area in the catchment (Mierle and Ingram, 1991; St. Louis et al.,1994; Watras et al., 1995). Heavy metal and pesticide accumulation increase at warmer water temperatures(Reinert et al., 1974; Wood and McDonald, 1996). Zinc becomes more toxic to bluegill under conditions ofreduced dissolved oxygen concentrations (Pickering, 1968), which are likely to accompany higher lake andstream temperatures. Acute exposure (24 h) of the fathead minnow to a synthetic pyrethyroid pesticidereduced its tolerance to both lethally high and low environmental temperatures (Heath et al., 1994). Thus,toxic substances might be more problematic in some systems in a warmer and drier climate.
Exotic organisms
Climatewarming and drying in¯uence themovement of exotic organisms by: (1) providing warmer habitatsthat could favour invading rather than native organisms (Mandrak, 1989); (2) potential management actionsto augment the communities of isolated lakes and stream sections by moving warmer water organismsnorthwards (Arnell et al., 1996); and (3) reducing the connectivity of headwater lakes that can become moreisolated as connecting streams or wetlands dry up (see Lodge, 1993). The poleward movement of freshwatercommunities in response to climate warming is expected to be just as dramatic as the poleward movement ofterrestrial vegetation (Arnell et al., 1996). Thus, many waters would become host to new species or `exotics'.The northwards dispersal of organisms observed following the retreat of the Wisconsin glaciation would
# 1997 by John Wiley & Sons, Ltd. HYDROLOGICAL PROCESSES, VOL. 11, 825±871 (1997)
2: LAURENTIAN GREAT LAKES AND PRECAMBRIAN SHIELD 863
occur at a much faster rate. Twenty-seven ®sh species residing in the Great Lakes area have the potential toinvade the Laurentian Great Lakes with climate warming, dramatically altering present Great Lakes ®shcommunities (Mandrak, 1989). For isolated lakes and streams with barriers to dispersal from adjacent waters,pressures for the managed northwards dispersal would most likely be high, especially for game ®shes and anythreatened or endangered species. Such movements could have two positive features; increasing theproductivity of a too-warm system occupied by species adapted for cooler waters, and saving a species aboutto be extirpated or become extinct. Alternatively, there are several disadvantages: reductions in the populationviability of native species at a faster rate than that owing to climate change alone owing to species interactionswith exotics, increasing rates of extirpation and increasing rates of species turnover, making species structuremore chaotic and di�cult to manage for human goals (see Magnuson, 1976; Regier et al., 1996).
HETEROGENEITY IN RESPONSE AMONG WATER BODIES
Finally, we believe it is important to repeat what must be obvious from this article. Not only are lakes andother aquatic systems in the Laurentian Great Lakes and Precambrian Shield Region strong responders toclimate change and variability, but also di�erences in response are paramount both across the region andamong adjacent waters. Di�erences in morphometry or hydrology of lakes, streams and ponds can resultin changes that are in opposite directions. Some responses di�er within a lake or a stream, others are onlyapparent in comparisons among di�erent lakes or streams; still others only are apparent in a network oflakes and streams or in analyses of large geographical regions. Changes in the edaphic, climatic, anthro-pogenic and morphological factors that typify the typologies of lakes all in¯uence how the physical, chemicaland biological limnology plays out in a warmer and drier climate. Hydrological considerations are especiallysigni®cant in terms of: (1) solute and nutrient sources; (2) controls relative to the distribution of water ¯owsamong precipitation±groundwater±runo�; (3) in¯uences of lake size on water residence times; and (4) thein¯uence of catchment size relative to lake volume on biogeochemical responses. The dependence of waterbodies on riparian and catchment attributes links lake and stream responses tightly to heterogeneity andchanges in the surrounding landscape, whether these changes are induced vegetational transformations fromclimate change or altered land and water use by humans in the catchments. The altitudinal position of lakesand streams in the local landscape and hydrological ¯ow system introduces heterogeneous responses amongadjacent streams and lakes. Responses di�er among seasons, not only because climate change does not occuruniformly over the year, but also because the array of sensitive ecological processes di�ers among seasons.Likewise, neither lake, stream, or wetland provide homogeneous entities of response to climate change. Avast array of interacting factors contributes to the responses of aquatic ecosystems to climate change, andsuprises should be expected.
RESEARCH NEEDS
Five broad research needs have been identi®ed.
1. Long-term research and monitoring should be maintained and expanded at key locations. Often,responses to climate are complex and unpredictable from ®rst principles (Schindler, 1997).
2. Models of aquatic system behaviour should be improved and tested against long-term data andmanipulative ®eld experiments.
3. Climate models should be improved to include outputs of wind and clouds and at temporal and spatialscales more suitable for subregional analyses.
4. The heterogeneity of potential responses should be recognized and a predictive understanding of thisheterogeneity should be developed.
5. A better understanding of the temperature responses of aquatic organisms and communities is needed,especially for winter.
HYDROLOGICAL PROCESSES, VOL. 11, 825±871 (1997) # 1997 by John Wiley & Sons, Ltd.
864 J. J. MAGNUSON ET AL.
ACKNOWLEDGEMENTS
Co-authors have contributed di�erent sections and provided comments on the entire manuscript. LindaMortsch and Frank Quinn are acknowledged for sections on climate, climate trends and future climatescenarios; Ray Assel for materials on Great Lakes Ice; Peter Dillon, Hayla Evans and Roland Hall forinformation on palaeoclimates and terrestrial ecosystems; Carl Bowser for his emphasis on the importance ofhydrological processes and for helping to coordinate the e�ort; Everett Fee andDavid Schindler for informationfrom ELA and north-western Ontario and biogeochemical and DOC responses; Everett Fee for thephytoplankton information; John Eaton for his contributions on the biological responses; Katherine Websterfor contributions to biogeochemistry, general editing and ®gure development; John Magnuson for contri-butions on ®sh, interacting stresses, physical limnology, and general synthesis; Bill Feeney for drafting ®gures;and Alice Justice for assistance with production. We thank the American Society of Limnology and Ocean-ography and the North American Benthological Society for organizing the symposium from which our paperevolved and the US Environmental Protection Agency and the US Geological Survey for their sponsorship.
REFERENCES
Adams, M. S., Meinke, T. W., and Kratz, T. K. 1990. `Primary productivity in three northern Wisconsin lakes', Verh. Internat. Verein.Limnol., 24, 432±437.
Allen, M. M. and Stanier, R. Y. 1968. `Selective isolation of blue-green algae from water and soil', J. Gen. Microbiol., 51, 203±209.Anderson, J. C. 1987. `On the use of lake ice conditions to monitor climatic change', Canadian Climate Centre Report No. 87-8. AES,
Downsview, p. 53.Anderson, T. W. 1989. `Vegetation changes over 12 000 years: changes in eastern Ontario and adjacent areas gives evidence of global
change', GEOS (Energy, Mines and Resources Canada), 18, 39±47.Anderson, M. P. and Cheng, X. 1993. `Long and short term transience in a groundwater/lake system in Wisconsin, USA', J. Hydrol.,
145, 1±18.Anderson, T. W. and Lewis, C. F. M. 1992. `Climatic in¯uences of deglacial drainage changes in southern Canada at 10 to 8 ka
suggested by pollen evidence', Geogr. Phys. Quat., 46, 255±272.Anderson, W., Robertson, D. M., and Magnuson, J. J. 1996. `Evidence of recent warming and El NinÄ o variations in ice breakup of
Wisconsin lakes', Limnol. Oceanogr., 41, 815±821.Arnell, N., Bates, B., Lang, H., Magnuson, J. J., and Mulholland, P. 1996. `Hydrology and freshwater ecology', in Watson, R. T.,
Zinyowera, M. C., and Moss, R. H. (Eds), Climate Change 1995: Impacts, Adaptations and Mitigation of Climate Change: Scienti®c-Technical Analyses, Contribution of Working Group II to the Second Assessment Report of the Intergovernmental Panel on ClimateChange. Cambridge University Press, New York. 880 pp.
Assel, R. A. 1986. `Fall and winter thermal structure of Lake Superior', J. Great Lakes Res., 12, 251±262.Assel, R. A. 1990. `An ice-cover climatology for Lake Erie and Lake Superior for the winter seasons 1897±98 to 1982±83,
Int. J. Climatol., 10, 731±748.Assel, R. A. 1991. `Implications of CO2 global warming on Great Lakes ice cover', Climate Change 18, 377±395.Assel, R. A. and Robertson, D. M. 1995. `Changes in winter air temperatures near Lake Michigan during 1851±1993, as determined
from regional lake-ice records', Limnol. Oceanogr. 40, 165±176.Assel, R. A., Quinn, F. H., Leshkevich, G. A., and Bolslenga, S. J. 1983. `Great Lakes ice atlas', NOAA Atlas No. 4. Great Lakes
Environmental Research Lab., Ann Arbor, MI.Assel, R. A., Snider, C. R., and Lawrence, R. 1985. `Comparison of 1983 Great Lakes winter weather and ice conditions with previous
years', Monthly Weather Rev., 113, 291±303.Assel, R. A., Robertson, D. M., Ho�, M. H. and Selgeby, J. H. 1995. `Climatic-change implications from long-term (1823±1994)
ice records for the Laurentian Great Lakes', Ann. Glaciol., 21, 383±386.Assel, R. A., Janowiak, J. E., Young, S. and Boyce, D. 1996. `Winter 1994 weather and ice conditions for the Laurentian Great Lakes',
Bull. Am. Meteorol. Soc., 77, 71±88.Atmospheric Environment Service, 1982a. Canadian Climate Normals 1951±80, Temperature and Precipitation Ð Quebec. Supply and
Services Canada, Ottawa.Atmospheric Environment Service, 1982b. Canadian Climate Normals 1951±80, Temperature and Precipitation Ð Atlantic Provinces.
Supply and Services Canada, Ottawa.Atmospheric Environment Service, 1982c. Canadian Climate Normals 1951±80, Temperature and Precipitation Ð Prairie Provinces.
Supply and Services Canada, Ottawa.Atmospheric Environment Service, 1982d. Canadian Climate Normals 1951±80, Temperature and Precipitation Ð Ontario. Supply and
Services Canada, Ottawa.Atmospheric Environment Service, 1982e. Canadian Climate Normals 1951±80, Degree Days, Volume 4. Supply and Services Canada,
Ottawa.Atmospheric Environment Service, 1982f. Canadian Climate Normals 1951±80, Frost, Volume 6. Supply and Services Canada, Ottawa.Atmospheric Environment Service, 1994. `Modelling the global climate system', Climate Change Digest, CCD 94-01. Supply and
Services Canada, Ottawa. p. 20.
# 1997 by John Wiley & Sons, Ltd. HYDROLOGICAL PROCESSES, VOL. 11, 825±871 (1997)
2: LAURENTIAN GREAT LAKES AND PRECAMBRIAN SHIELD 865
Bartlein, P. J. and Webb, III, T. 1985. `Mean July temperature at 6000 yr BP in eastern North America: regression equations forestimates from fossil-pollen data', Syllogeus, 55, 301±342.
Bayley, S. E., Behr, R. S., and Kelly, C. A. 1986. `Retention and release of sulfur from a freshwater wetland', Water Air Soil Pollut.,31, 101±114.
Bayley, S. E., Schindler, D. W., Parker, B. R., Stainton, M. P., and Beaty, K. G. 1992a. `E�ects of forest ®re and drought on acidity ofa base-poor boreal forest stream: similarities between climatic warming and acidic precipitation', Biogeochemistry, 17, 191±204.
Bayley, S. E., Schindler, D. W., Beaty, K. G., Parker, B. R., and Stainton, M. P. 1992b. `E�ects of multiple ®res on nutrient yields fromstreams draining boreal forest and fen watersheds: nitrogen and phosphorus', Can. J. Fish. Aquat. Sci., 49, 584±596.
Bazzaz, F. A. 1990. `The response of natural ecosystems to the rising global CO2 levels', Annu. Rev. Ecol. Syst., 21, 167±196.Blumberg, A. F. and DiToro, D. M. 1990. `E�ects of climate warming on dissolved oxygen concentrations in Lake Erie',
Trans. Am. Fish. Soc., 119, 210±223.Bodaly, R. A., Rudd, J. W. M., Fudge, R. J. P., and Kelly, C. A. 1993. `Mercury concentrations in ®sh related to size of remote
Canadian Shield Lakes', Can. J. Fish. Aquat. Sci., 50, 980±987.Boer, G. J., McFarlane, N. A., and Lazare, M. 1992. `Greenhouse gas-induced climate change simulated with the CCC second-
generation general circulation model', J. Climate, October 1992, 1045±1077.Bolsenga, S. J. and Norton, D. C. 1993. `Great Lakes air temperature trends for land stations, 1901±1987', J. Great Lakes Res., 19,
379±388.Brown, R. W. and Taylor, W. W. 1993. `Factors a�ecting the recruitment of Lake White®sh in two areas of northern Lake Michigan',
J. Great Lakes Res., 19, 418±428.Bunce, J. A. 1994. `Responses of respiration to increasing atmospheric carbon dioxide concentrations', Physiol. Plantarum, 90, 427±430.Calkin, P. E. and Feenstra, B. H. 1985. `Evolution of the Erie Basin Great Lakes', in Karrow, P. F. and Calkin, P. E. Eds, Quaternary
Evolution of the Great Lakes. Geol. Assoc. Can., Spec. Pap., 30, 149±170.Campbell, I. D. and McAndrews, J. H. 1991. `Cluster analysis of late Holocene pollen trends in Ontario', Can. J. Bot., 69, 1719±1730.Campbell, I. D. and McAndrews, J. H., 1993. `Forest disequilibrium caused by Little Ice Age cooling', Nature, 366, 336±338.Canale, R. P. and Vogel, A. H. 1974. `E�ects of temperature on phytoplankton growth', J. Env. Eng. Div., Am. Soc. Civil Eng., 100,
231±241.Carpenter, S. R., Fisher, S. G., Grimm, N. B. and Kitchell, J. F. 1992. `Global change and freshwater ecosystems', Annu. Rev. Ecol.
Syst., 23, 119±139.Changnon, S. A., Jr., Le�er, S. and Shealy, R. 1989. `Impacts of extremes in Lake Michigan levels along Illinois shoreline: low levels,
Report prepared for U.S. Environment Protection Agency, Washington, D.C.' in Smith, J. B. and Tirpak, D. A. (Eds). The PotentialE�ects of Global Climate Change on the United States. Hemisphere Publishing Corp., New York. pp. 3±1 to 3±48.
Chen, C. Y. and Folt, C. L. 1996. `Consequences of fall warming for zooplankton overwintering success', Limnol. Oceanogr., 41,1077±1086.
Christie, G. C. and Regier, H. A. 1988. `Measures of optimal thermal habitat and their relationship to yields of four commercial ®shspecies', Can. J. Fish. Aquat. Sci., 45, 301±314.
Connell, D. W. and Miller, G. J. 1984. Chemistry and Ecotoxicology of Pollution. John Wiley and Sons, Inc., New York. 444 pp.Coutant, C. C. 1981. `Foreseeable e�ects of CO2-induced climate change: freshwater concerns', Environ. Conserv., 8, 285±297.Crissman, R. D. 1989. `Impacts on electricity generation in New York State', in Report of the First U.S.±Canada Symposium on Impacts
of Climate Change on the Great Lake Basin US National Climate Program O�ce and Canadian Climate Centre. pp. 109±118.Croley, T. E., II. 1990. `Laurentian Great Lakes double-CO2 climate change hydrological impacts', Climat. Change, 17, 27±47.Croley, T. E., II. 1993. `CCC GCM 2� CO2 hydrological impacts on the Great Lakes, in Climate, Climate Change, Water Level
Forecasting and Frequency Analysis, Supporting documents, Vol. 1, Water Supply Scenarios. Task Group 2, Working Committee 3,IJC, Levels Reference Study, Phase II.
Croley, T. E., II and Hartmann, H. C. 1985. `Resolving Thiesson polygons', J. Hydrol., 76, 363±379.Croley, T. E., II and Hunter, T. S. 1994. `Great Lakes monthly hydrologic data', NOAA Technical Memorandum ERL GLERL-83,
p. 83.Croley, T. E., II, Quinn, F. H., Kunkel, K., and Changnon, S. J. 1994. `Potential Great Lakes hydrology and lake level impacts resulting
from global warming', GLERL Report No. 931. Great Lakes Environmental Research Laboratory, Ann Arbor, Michigan, p. 6.Croley, T. E., II, Quinn, F. H., Kunkel, K. and Changnon, S. J. 1995. `Potential Great Lakes hydrology and lake level impacts resulting
from global warming', in Preprint Vol: Sixth Conference on Global Change Studies. American Meteorological Society, Boston,Massachusetts. pp. 67±72.
Cronan, C. S. 1990. `Patterns of organic acid transport from forested watersheds to aquatic ecosystems', in Perdue, E. M. and Gjessing,E. T. (Eds), Organic Acids in Aquatic Ecosystems. John Wiley & Sons Ltd., New York. pp. 245±260.
Davison, I. R. 1991. `Environmental e�ects on algal photosynthesis: temperature', J. Phycol., 27, 2±8.DeNoyelles, F. Jr., Reinke, D., Knoechel, R., Treanor, D., and Altenhofen, C. 1980. `Continuous culturing of natural phytoplankton
communities in the Experimental Lakes Area: e�ects of enclosure, in situ incubation, light, phosphorus and cadmium', Can. J. Fish.Aquat. Sci., 37, 424±433.
DeStasio, B. T., Hill, D. K., Kleinhans, J. M., Nibbelink, N. P., and Magnuson, J. J. 1996. `Potential e�ects of global climate change onsmall north temperate lakes: physics, ®shes and plankton', Limnol. Oceanogr., 41, 1136±1149.
Devito, K. J. and Dillon, P. J. 1993a. `The importance of runo� and winter anoxia to the P and N dynamics of a beaver pond',Can. J. Fish. Aquat. Sci., 50, 2222±2234.
Devito, K. J. and Dillon, P. J. 1993b. `The in¯uence of hydrologic conditions and peat oxia on the phosphorus and nitrogen dynamicsof a conifer swamp', Wat. Resour. Res., 29, 2675±2685.
Dillon, P. J. and LaZerte, B. D. 1992. `Response of the Plastic Lake catchment, Ontario to reduced sulfur deposition', Environ. Pollut.,77, 211±217.
HYDROLOGICAL PROCESSES, VOL. 11, 825±871 (1997) # 1997 by John Wiley & Sons, Ltd.
866 J. J. MAGNUSON ET AL.
Drake, B. G. 1992. `The impact of rising CO2 on ecosystem production', Water Air Soil Pollut., 64, 25±44.Dredge, L. A., Mott, R. J., and Grant, D. R. 1992. `Quaternary stratigraphy, paleoecology, and glacial geology, Iles de la Madeleine,
Quebec', Can. J. Earth Sci., 29, 1981±1996.Eaton, J. G. and Scheller, R. M. 1996. `E�ects of climate warming on ®sh thermal habitat in streams of the United States', Limnol.
Oceanogr., 41, 1109±1115.Edwards, T. W. D. and Fritz, P. 1988. `Stable-isotope paleoclimate records for southern Ontario, Canada: comparison of results from
marl and wood', Can. J. Earth Sci., 25, 1397±1406.Engstrom, D. R. and Hansen, B. C. S. 1985. `Postglacial vegetation change and soil development in southeastern Labrador as inferred
from pollen and chemical stratigraphy', Can. J. Bot., 63, 543-561.Eppley, R. W. 1972. `Temperature and phytoplankton growth in the sea', Fish. Bull., 70, 1063±1085.Everett, J. T., Troadec, J.-P., Regier, H. A., Krovnin, A., Okemwa, E., and Lluch Belda, D. 1996. `Fisheries', in The Intergovernmental
Panel on Climate Change Working Group 2, Report on Impact Assessment and Adaptation Strategies. Geneva, Switzerland. Chapter 8.Fee, E. J. 1976. `The vertical and seasonal distribution of chlorophyll in lakes of the Experimental Lakes Area, northwestern Ontario:
implications for primary production estimates', Limnol. Oceanogr., 21, 767±783.Fee, E. J., Hecky, R. E., and Welch, H. E. 1987. `Phytoplankton photosynthesis parameters in central Canadian lakes', J. Plankton
Res., 9, 305±316.Fee, E. J., Shearer, J. A., DeBruyn, E. R., and Schindler, E. U. 1992. `E�ects of lake size on phytoplankton photosynthesis', Can. J.
Fish. Aquat. Sci., 49, 2445±2459.Fee, E. J., Hecky, R. E., Regehr, G. W., Hendzel, L. L., and Wilkinson, P. 1994. `E�ects of lake-size on nutrient availability in the
mixed-layer during summer strati®cation', Can. J. Fish. Aquat. Sci., 51, 2756±2768.Fee, E. J., Hecky, R. E., Kasian, S. E., and Cruikshank, 1996. `E�ects of lake size, water clarity, and climatic variability on mixing
depths in Canadian Shield Lakes', Limnol. Oceanogr., 41, 912±920.Freeberg, M. H., Taylor, W. W., and Brown, R. W. 1990. `E�ect of egg and larval survival on the year-class strength of lake white®sh
I Grand Traverse Bay, Lake Michigan', Trans. Am. Fish. Soc., 119, 92±100.Fry, F. E. J. 1947. `E�ects of the environment on animal activity', Publ. Ontario Fish. Res. Lab., 68, 1±62.Fry, F. E. J. 1971. `The e�ect of environmental factors on the physiology of ®sh', in Hoar, W. S. and Randall, D. J. (Eds),
Fish Physiology: Environmental Factors. Academic Press, New York. pp. 1±98.Giberson, D. J., Rosenberg, D. M., and Wiens, A. P. 1991. `Changes in abundance of burrowing may¯ies in Southern Indian Lake:
lessons for environmental monitoring', Ambio, 20, 139±142.Grimm, E. C. and Jacobson, G. L., Jr. 1992. `Fossil-pollen evidence for abrupt climate changes during the past 18 000 years in eastern
North America', Climate Dynam., 6, 179±184.Guildford, S. J., Hendzel, L. L., Kling, H. J., Fee, E. J., Robinson, G. G. C., Hecky, R. E., and Kasian, S. E. M. 1994. `E�ects of lake
size on phytoplankton nutrient de®ciency status', Can. J. Fish. Aquat. Sci., 51, 2769±2783.Gullett, D., Skinner, W., and Vincent, L. 1992. `Development of an historical Canadian climate database for temperature and other
climate elements', Climatol. Bull., 26, 125±131.Hairston, N. G. 1996. `Zooplankton egg banks as biotic reservoirs in changing environments', Limnol. Oceanogr., 41, 1087±1092.Hall, R. I. 1993. `Paleolimnological analysis of lake-watershed interactions and long term lake trophic status;, PhD Thesis, Biology
Dept., Queen's University, Kingston, Ontario, Canada. p. 323.Hansen, J., Fung, I., Lacis, A., Rind, D., Ruddel, G., Lebede�, S., Ruedy, R., and Stone, P. 1988. `Global climate changes as forecast
by the Goddard Institute for Space Studies three-dimensional model', J. Geophys. Res., 93, 9341±9364.Hartmann, H. C. 1990. `Climate change impacts on Laurentian Great Lakes levels', Climate Change, 17, 49±67.Headrick, M. R. and Carline, R. F. 1993. `Restricted summer habitat and growth of northern pike in two southern Ohio
impoundments', Trans. Am. Fish. Soc., 122, 228±236.Healey, F. P. and Hendzel, L. L. 1980. `Physiological indicators of nutrient de®ciency in lake phytoplankton', Can. J. Fish. Aquat. Sci.,
37, 442±453.Heath, S., Bennett, W. A., Kennedy, J., and Beitinger, T. L. 1994. `Heat and cold tolerance of the fathead minnow, Pimephales
promelas, exposed to the synthetic pyrethroid cy¯uthrin', Can. J. Fish. Aquat. Sci., 51, 437±440.Hecky, R. E. and Hesslein, R. H. 1996. `Contributions of benthic algae to lake food webs as revealed by stable isotope analysis',
J. North Am. Benthol. Soc., 14, 582±598.Hecky, R. E. and Kilham, P. 1988. `Nutrient limitation of phytoplankton in freshwater and marine environments: a review of recent
evidence on the e�ects of enrichment', Limnol. Oceanogr., 33, 796±822.Hemond, H. F. 1990. `Wetlands as the source of dissolved organic carbon to surface waters', in Perdue, E. M. and Gjessing, E. T. (Eds),
Organic Acids in Aquatic Ecosystems. John Wiley & Sons, New York. pp. 301±313.Hill, D. K. and Magnuson, J. J. 1990. `Potential e�ects of global climate warming on the growth and prey consumption of Great Lakes
®sh', Trans. Am. Fish. Soc., 119, 265±275.Hokanson, K. E. F. 1977. `Temperature requirements of some percids and adaptations to the seasonal temperature cycle', J. Fish. Res.
Bd. Can., 34, 1524±1550.Holmes, J. A. 1990. `Sea lamprey as an early responder to climate change in the Great lakes Basin', Trans. Am. Fish. Soc., 119, 292±300.Hondzo, M. and Stefan, H. G. 1991. `Three case studies of lake temperature and strati®cation response to warmer climate',Wat. Resour.
Res., 27, 1837±1846.Hondzo, M. and Stefan, H. G. 1993. `Regional water temperature characteristics of lakes subjected to climate change', Climatic
Change, 24, 187±211.Houghton, J. J., Meiro Filho, L. G., Callander, B. A., Harris, N., Kattenberg, A., and Maskell, K. (Eds) 1996. Climate Change 1995:
The Science of Climate Change, Contribution of Working Group I to the Second Assessment Report of the Intergovernmental Panelon Climate Change. Cambridge University Press, New York. 584 pp.
# 1997 by John Wiley & Sons, Ltd. HYDROLOGICAL PROCESSES, VOL. 11, 825±871 (1997)
2: LAURENTIAN GREAT LAKES AND PRECAMBRIAN SHIELD 867
Hynes, H. B. N. 1975. `The stream and its valley', Int. Verein. Theor. Ang. Limnol., Verhand., 19, 1±15.Johnson, T. B. and Evans, D. O. 1990. `Size dependent winter mortality of young-of-the-year white perch: climate warming and the
invasion of the Laurentian Great Lakes', Trans. Am. Fish. Soc., 119, 779±785.Jones, B. R., Hokanson, K. E. F., and McCormick, J. H. 1972. `Winter temperature requirements for maturation and spawning
of yellow perch, Perca ¯avenscens (Mitchell)', in Marois, M. (Ed.), Proceedings, World Conference Towards a Plan of Action forMankind, Vol. 3, Biological Balance and Thermal Modi®cations. Pergamon Press, New York. pp. 189±192.
Kasian, S. E. M., Findlay, D. L., Regehr, G., Beaty, K. G., Cruikshank, D. R., Shearer, J. A., in press. Natural variability ofphytoplankton composition over decadal time scales in the Experimental Lakes Area. Can. J. Fish. Aguat. Sci.
Kasischke, E. S., Christensen, N. L., Jr., and Stocks, B. J. 1995. `Fire, global warming, and the carbon balance of boreal forests',Ecol. Appl., 5, 437±451.
Keith, V. F., DeAvila, C., and Willis, R. M. 1989. `E�ect of climatic change on shipping within Lake Superior and Lake Erie',in The Potential E�ects of Global Climate Change on the United States. US Environmental Protection Agency, Washington, D.C.App. H, Infrastructure.
Krabbenhoft, D. P. and Webster, K. E. 1995. `Transient hydrogeological controls on the chemistry of a seepage lake', Wat. Resour.Res., 31, 2295±2305.
Kratz, T. K., Webster, K. E., Bowser, C. J., Magnuson, J. J., and Benson, B. J. 1997. The in¯uence of landscape position on northernWisconsin lakes. Freshwat. Biol., 37, 209±217.
Kunkel, K. E., Mortsch, L. D., and Lewis, P. 1993. `The climate of the Great Lakes Ð St. Lawrence Basin', in Lee, D. H. (Ed.),Climate, Climate Change, Water Level Forecasting and Frequency Analysis, Final Report of Task Group 2 Working Committee 3 forthe IJC Levels Reference Study, Phase II, Vol. 1. pp. 5±14.
Lazerte, B. D. 1993. `The impact of drought and acidi®cation on the chemical exports from a minerotrophic conifer swamp',Biogeochemistry, 18, 153±175.
Leino, R. L. and McCormick, J. H. 1993. `Responses of juvenile largemouth bass to di�erent pH and aluminum levels atoverwintering temperatures: e�ects on gill morphology, electrolyte balance, scale calcium, liver glycogen, and depot fat', Can. J.Zool., 71, 531±543.
Lenihan, J. M. and Neilson, R. P. 1994. `A rule-based vegetation formation model for Canada', J. Biogeogr., 20, 615±628.Lewis, C. F. M. and Anderson, T. W. 1989. `Oscillations of levels and cool phases of the Laurentian Great Lakes caused by in¯ows
from glacial lakes Agassiz and Barlow-Ojibway', J. Paleolimnol., 2, 99±146.Lewis, C. F. M. and Anderson, T. W. 1992. `Stable isotope (O and C) and pollen trends in eastern Lake Erie, evidence for a locally
induced climate reversal of Younger Dryas age in the Great Lakes basin', Climate Dynam., 6, 241±250.Lin, P. 1995. `Adaptations to temperature in ®sh: salmonids, centrarchids and percids',PhDThesis, University of Toronto, Canada. p. 170.Liu, K. B. 1990. `Holocene paleoecology of the boreal forest and Great Lakes Ð St. Lawrence forest in Northern Ontario', Ecol.
Monogr., 60, 179±212.Lodge, D. M. 1993. `Species invasions and deletions: community e�ects and responses to climate and habitat change', in Kareiva,
P. M., Kingsolver, J. G., and Huey, R. B. (Eds), Biotic Interactions and Global Change, Sinauer Associates Inc., Sunderland, MA,pp. 367±387.
Magnuson, J. J. 1976. `Managing with exotics Ð a game of chance'. Trans. Am. Fish. Soc., 105, 1±9.Magnuson, J. J. and DeStasio, B. T. 1996. Thermal niche of ®shes and global warming', in Wood, C. M. and McDonald, D. G. (Eds),
Global Warming Ð Implications for Freshwater and Marine Fish, SEB Seminar Series. Cambridge University Press, Cambridge.pp. 377±408.
Magnuson, J. J., Crowder, L. B., and Medvick, P. A. 1979. `Temperature as an ecological resource', Am. Zool., 19, 331±343.Magnuson, J. J., Regier, D. K., Holmes, H. A., Meisner, J. D., and Shuter, B. J. 1989. `Potential responses of Great Lakes ®shes and
their habitat to global climate warming', in Smith, J. B. and Tirpak, D. A. (Eds), The Potential E�ects of Global Climate Change onthe United States. Environmental Protection Agency, EPA-230-05-89-055, Washington, D.C. App. E, Aquatic Resources.
Magnuson, J. J., Meisner, J. D., and Hill, D. K. 1990. `Potential changes in the thermal habitat of Great Lakes ®sh after global climatewarming', Trans. Am. Fish. Soc., 119, 254±264.
Manabe, S. and Stou�er, R. J. 1980. `Sensitivity of a global climate model to an increase of CO2 concentration in the atmosphere',J. Geophys. Res., 85, 5529±5554.
Mandrak, N. E. 1989. `Potential invasion of the Great Lakes by ®sh species associated with climate warming', J. Great Lakes Res., 15,306±316.
Maykut, G. A. and Unterssteiner, N. 1971. `Some results from a time dependent thermodynamic model of sea ice', J. Geophys. Res., 76,1550±1575.
McAndrews, J. H. and Campbell, I. D. 1993. `The mean July temperature in Eastern Canada from Bartlein and Webb's (1985) pollentransfer functions: comments and illustrations', in Tekla, A. (Ed.), Proxy Climate Data and Models of the Six Thousand Years BeforePresent Time Interval: The Canadian Perspective, Canadian Global Climate Change Program Incidental Report Series No. IR93-3.The Royal Society of Canada. pp. 22±25.
McCormick, M. J. 1990. `Potential changes in thermal structure and cycle of Lake Michigan due to global warming', Trans. Am. Fish.Soc., 119, 183±195.
McFadden, J. D. 1965. `The interrelationship of lake ice and climate in central Canada', Technical Report Number 20. Department ofMeteorology, University of Wisconsin±Madison. 115 pp.
McFarlane, N. A. 1991. `The Canadian Climate Centre second-generation global circulation model', in Sanderson, M. (Ed.),Proceedings, Symposium on Climate Scenarios. University of Waterloo, Waterloo. pp. 3±15.
McFarlane, N. A., Boer, G. J., Blanchet, J.-P., and Lazare, M. 1992. `The Canadian Climate Centre second generation generalcirculation model and its equilibrium climate', J. Climate, 5, 1013.
McIver, D. L. and Isaac, J. L. 1989. Bioclimatic pro®les for Canada, 1951±80. Canadian Climate Centre, Environment Canada.
HYDROLOGICAL PROCESSES, VOL. 11, 825±871 (1997) # 1997 by John Wiley & Sons, Ltd.
868 J. J. MAGNUSON ET AL.
McLain, A. S., Magnuson, J. J., and Hill, D. K. 1994. `Latitudinal and longitudinal di�erences in thermal habitat for ®shes in¯uencedby climate warming: expectations from simulations', Verh. Int. Verein. Limnol., 25, 2080±2085.
Meisner, J. D. 1990. `Potential loss of thermal habitat for Brook Trout, due to climatic warming, in two southern Ontario streams',Trans. Am. Fish. Soc., 119, 282±291.
Meisner, J. D., Goodier, J. L., Regier, H. A., Shuter, B. J., and Cristie, W. J. 1987. `Lab assessment of climate warming on Great Lakesbasin ®shes', J. Great Lakes Res., 13, 340±352.
Meisner, J. D., Rosenfeld, J. S., and Regier, H. A. 1988. `The role of groundwater in the impact of climate warming on streamsalmonines', Fisheries, 13, 2±8.
Mekis, E. and Hogg, W. D. 1997. `Rehabilitation and analysis of Canadian daily precipitation time series', J. Climate, in press.Melo, O. T. 1989. `Electric supply and demand in Ontario', in Report of the First U.S.-Canada Symposium on Impacts of Climate
Change on the Great Lakes Basin, Sept. 27±29, 1988. Oak Brook, Illinois. pp. 134±143.Metcalfe, J. R., Ishida, S., and Goodison, B. E. 1994. `A corrected precipitation archive for the Northwest Territories', Environment
Canada±Mackenzie Basin River Study, Interim Report #2. 110±117.Meyer, J. L. and Pulliam, W. M. 1992. `Modi®cation of terrestrial-aquatic interactions by a changing climate', in Firth, P. and Fisher,
S. G. (Eds), Global Climate Change and Freshwater Ecosystems. Springer-Verlag, New York. pp. 177±191.Mierle, B. and Ingram, R. 1991. `The role of humic substances in the mobilization of mercury from watersheds', Water Air Soil Pollut.,
56, 349±357.Minns, C. K. and Moore, J. E. 1995. `Factors limiting the distributions of Ontario's freshwater ®shes: the role of climate and other
variables, and the potential impacts of climate change', in Beamish, R. J. (Ed.), Climate Change and Northern Fish Populations. Can.Spec. Publ. Fish Aquat. Sci., 121, 137±160.
Minns, C. K., Randall, R. G., Chadwick, E. M. P., Moore, J. E., and Green, R. 1995. `Potential impact of climate change on thehabitat and population dynamics of juvenile Atlantic salmon (Salmon salar) in eastern Canada', in Beamish, R. J. (Ed.), ClimateChange and Northern Fish Populations. Can. Spec. Publ. Fish Aguat. Sci., 121, 699±708.
Moore, M. V., Folt, C. L., and Stemberger, R. S. 1995. `Consequences of elevated temperatures for zooplankton assemblages intemperate lakes', Arch. Hydrobiol., 268, 1±31.
Moore, M. V., Pace, M. L., Mather, J. R., Murdoch, P. S., Howarth, R. W., Folt, C. L., Chen, C. Y., Hemond, H. F., Flebbe, P. A., andDriscoll, C. T. 1997. Potential e�ects of climate change on freshwater ecosystems of the New England/Mid Atlantic region', Hydrol.Process., 11, 925±947.
Mortsch, L. D. (Ed.) (1990) Eastern Canadian Boreal and Sub-Arctic Wetlands: A Resource Document. Atmospheric EnvironmentService, Environment Canada, Climatological Studies No. 42. 169 pp.
Mortsch, L. D. and Quinn, F. H. 1996. `Climate change scenarios for the Great Lakes Basin ecosystem studies', Limnol. Oceanogr., 41,903±911.
Mott, R. J., Grant, D. R., Stea, R. R., and Occhietti, S. 1986. `A late glacial climatic oscillation in Atlantic Canada Ð anAllerod/Younger Dryas equivalent', Nature, 323, 247±250.
Overpeck, J. T., Rind, D., and Goldberg, R. 1990. `Climate-induced changes in forest disturbance and vegetation', Nature, 343, 51±53.Parkinson, C. L. and Washington, W. M. 1979. `A large-scale numerical model of sea ice', J. Geophys. Res. 84, 311±337.Pereira, D. L., Anderson, C. S., Radomski, P. J., Sak, T., and Stevens, A. 1995a. `Potential to index climate with growth and
recruitment of temperate ®sh', in Beamish, R. J. (Ed.), Climate Change and Northern Fish Populations. Can. Spec. Publ. Fish. Aquat.Sci., 121, 709±717.
Pereira, D. L., Bingham, C., Spangler, G. R., Cohen, Y., Conner, D. J., and Cunningham, P. K. 1995b. `Growth and recruitment offreshwater drum (Aplodinotus grunniens) as related to long-term temperature patterns', in Beamish, R. J. (Ed.), Climate Change andNorthern Fish Populations. Can. Spec. Publ. Fish. Aquat. Sci., 121, 617±629.
Peters, R. L. 1990. `E�ects of global warming on forests', Forest Ecol. Manage., 35, 13±33.Phillips, D. W. 1990. The Climates of Canada. Supply and Services Canada. Environment Canada 176 pp.Phillips, D. W. and McCulloch, J. A. W. 1972. The Climate of the Great Lakes Basin Climatological Studies No. 20. Atmospheric
Environment Service, Downsview. p. 40.Pickering, Q. H. 1968. `Some e�ects of dissolved oxygen concentrations upon the toxicity of zinc to the bluegill, Lepomis macrochirus
RAF', Water Res., 2, 187±194.Po�, J. L. 1992. `Regional hydrologic response to climate change: an ecological perspective', in Firth, P. and Fisher, S. G. (Eds), Global
Climate Change and Freshwater Ecosystems. Springer-Verlag, New York. pp. 88±115.Post, W. M., Pastor, J., King, A. W., and Emanuel, W. R. 1992. `Aspects of the interaction between vegetation and soil under global
change', Water Air Soil Pollut., 64, 345±363.Quinn, F. H. 1981. `Secular changes in annual and seasonal Great Lakes precipitation, 1854±1979, and their implications for Great
Lakes water resource studies', Wat. Resour. Res., 17, 1619±1624.Quinn, F. H. and Norton, D. C. 1982. `Great Lakes precipitation by months, 1900±1980', NOAA Data Report ERL GLERL-20. p. 29.Rastetter, E. B., McKane, R. B., Shaver, G. R., and Melillo, J. M. 1992. `Changes in C storage by terrestrial ecosystems: how C±N
interactions restrict responses to CO2 and temperature', Water Air Soil Pollut., 64, 327±344.Regier, H. A., Holmes, J. A., and Pauly, D. 1990a. `In¯uence of temperature changes on aquatic ecosystems: an interpretation of
empirical data', Trans. Am. Fish. Soc., 119, 374±389.Regier, H. A., Magnuson, J. J., and Coutant, C. C. (Convenors), 1990b. `Symposium on e�ects of climate change on ®sh, Proceedings',
Trans. Am. Fish. Soc., 119, 173±389.Regier, H. A., Lin, P., Ing, K. K., and Wichert, G. A. 1996. `Likely responses to climate change of ®sh associations in the Laurentian
Great Lakes: concepts, methods and ®ndings', Boreal Env. Res., 1, 1±15.Reinert, R. E., Stone, L. J., and Willford, W. A., 1974. `E�ect of temperature on accumulation of methylmecuric chloride and
p,p' DDT by rainbow trout (Salmo gairdneri)', J. Fish. Res. Bd Can., 31, 1649±1652.
# 1997 by John Wiley & Sons, Ltd. HYDROLOGICAL PROCESSES, VOL. 11, 825±871 (1997)
2: LAURENTIAN GREAT LAKES AND PRECAMBRIAN SHIELD 869
Reycraft, J. and Skinner, W., 1993. `Canadian lake ice conditions: an indicator of climate variability', Climatic Persp., 15, 9±15.Rizzo, B. W. and Wilken, E. 1992. `Assessing the sensitivity of Canada's ecosystems to climatic change', Climatic Change, 21,
37±55.Robertson, D. M., Ragotzkie, R. A., and Magnuson, J. J. 1992. `Lake ice records used to detect historical and future climate changes',
Climatic Change, 21, 407±427.Rosenberg, N. J., Kimball, B. A., Martin, P., and Cooper, C. F. 1990. `From Climate and CO2 enrichment to evapotranspiration',in Waggoner, P. E. (Ed.), Climate Change and U.S. Water Resources. Wiley, New York. pp. 151±175.
Rowe, J. S. 1977. Forest Regions of Canada. Department of Fisheries and the Environment, Canadian Forestry Service, Publication1300. p. 172.
St Louis, V. L., Rudd, J. W. M., Kelley, C. A., Beaty, K. G., Bloom, N. S., and Flett, R. J. 1994. `Importance of wetlands as sources ofmethyl mercury to boreal forest ecosystems', Can. J. Fish. Aquat. Sci., 51, 1065±1076.
Schindler, D. W. 1977. `Evolution of phosphorus limitation in lakes: natural mechanisms compensate for de®ciencies of nitrogen andcarbon in eutrophied lakes', Science, 195, 260±262.
Schindler, D. W. 1997. `Widespread e�ects of climatic warming on freshwater ecosystems', Hydrol. Process., 11, 1043±1067.Schindler, D. W. and Fee, E. J. 1973. `Diurnal variation of dissolved inorganic carbon and its use in estimating primary production and
CO2 invasion in Lake 227', J. Fish. Res. Bd Can., 30, 1501±1510.Schindler, D. W., Frost, V. E., and Schmidt, R. V. 1973. `Production of epilithiphyton in two lakes of the Experimental Lakes Area,
northwestern Ontario.' J. Fish. Res. Bd Can., 30, 1511±1524.Schindler, D. W., Beaty, K. G., Fee, E. J., Cruikshank, D. R., DeBruyn, E. R., Findlay, D. L., Linsey, G. A., Shearer, J. A., Stainton,
M. P., and Turner, M. A. 1990. `E�ects of climatic warming on lakes of the central boreal forest', Science, 250, 967±970.Schindler, D. W., Bayley, S. E., Parker, B. R., Beaty, K. G., Cruikshank, D. R., Fee, E. J., Schindler, E. U., and Stainton, M. P. 1996a.`The e�ects of climatic warming on the properties of boreal lakes and streams at the Experimental Lakes Area, northwesternOntario', Limnol. Oceanogr., 41, 1004±1017.
Schindler, D. W., Curtis, P. J., Parker, B. R., and Stainton, M. P. 1996b. `Consequences of climate warming and lake acidi®cation forUV-B penetration in North American boreal lakes', Nature, 379, 705±708.
Schlesinger, M. and Zhao, Z. 1988. `Seasonal climate changes induced by doubled CO2 as simulated by the OSU atmospheric GCM/mixed-layer ocean model', Climate Research Institute Report. Oregon State University, Corvallis.
Scully, N. M. and Lean, D. R. S. 1994. `The attenuation of ultraviolet radiation in temperate lakes', Arch. Hydrobiol. Beih. Ergebn.Limnol., 43, 135±144.
Sedell, J. R. and Dahm, C. N. 1990. `Spatial and temporal scales of dissolved organic carbon in streams and rivers', in Perdue, E. M.and Gjessing, E. T. (Eds), Organic Acids in Aquatic Ecosystems. John Wiley & Sons, New York. pp. 261±279.
Shearer, J. A., Fee, E. J., DeBruyn, E. R., and DeClercq, D. R. 1987. `Phytoplankton primary production and light attenuationresponse to the experimental acidi®cation of a small Canadian Shield lake', Can. J. Fish. Aquat. Sci., 44 (Suppl. 1), 83±90.
Shuter, B. J. and Post, J. R. 1990. `Climate, population viability, and the zoogeography of temperature ®shes', Trans. Am. Fish. Soc, 119314±336.
Siegel, D. I., Reeve, A. S., Glaser, P. H., and Romanowicz, E. A. 1995. `Climate-driven ¯ushing of pore water in peatlands', Nature,374, 531±533.
Sinokrot, B. A. and Stefan, H. G. 1993. `Stream temperature dynamics: measurements and modeling',Wat. Resour. Res., 29, 2299±2312.Sinokrot, B. A., Stefan, H. G., McCormick, J. H., and Eaton, J. G. 1995. `Modeling of climate change e�ects on stream temperatures
and ®sh habitats below dams and near groundwater inputs', Climatic Change, 30, 181±200.Skinner, W. R. and Gullett, D. W. 1993. `Trends of daily maximum and minimum temperature in Canada during the past century',
Climatol. Bull., 27, 63±77.Slivitsky, M. and Mathier, L. 1993. `Climate changes during the 20th century on the Laurentian Great Lakes and their impacts onhydrologic regime', in Duckstein, L. and Parent, E. (Eds), NATO Advanced Studies Institute Series, Series E-Vol. 275, Kluwer,pp. 235±251.
Smayda, T. J. 1980. `Phytoplankton species succession', in Morris, I. (Ed.), The Physiological Ecology of Phytoplankton. University ofCalifornia Press, Berkeley. pp. 493±570.
Smith, J. B. 1991. `The potential impacts of climate change on the Great Lakes', Bull. Am. Meteorol. Soc., 72, 21±28.Smith, V. H. 1991. `Competition between consumers', Limnol. Oceanogr., 23, 707±712.Smol, J. P. 1982. `Postglacial changes in fossil algal assemblages from three Canadian lakes', PhD Thesis, Queen's University, Kingston,
Ontario, Canada. p. 151.Smol, J. P. and Boucherle, M. M. 1985. `Postglacial changes in algal and cladoceran assemblages in Little Round Lake, Ontario', Arch.
Hydrobiol., 103, 25±49.Sreenivasa, M. R. and Duthie, H. C. 1973, `The postglacial diatom history of Sun®sh Lake, southwestern Ontario', Can. J. Bot., 51,
1599±1609.Stefan, H. G. and Fang, X. 1994. `Model simulations of dissolved oxygen characteristics of Minnesota lakes: past and future', Environ.
Manage., 18, 73±92.Stefan, H. G. and Fang, X. 1995. `A methodology to estimate year-round e�ects of climate change on water temperature, ice and
dissolved oxygen characteristics of temperate zone lakes with application to Minnesota', Project Report 377. St. Anthony Falls Lab,Univ. of Minnesota, Minneapolis.
Stefan, H. G. and Preud'homme, E. B. 1993. `Stream temperature estimation from air temperature', Wat. Res. Bull., 29, 27±45.Stefan, H. G. and Sinokrot, B. A. 1993. `Projected global climate change impact on water temperatures in ®ve north central U.S.
streams', Climatic Change, 24, 353±381.Stefan, H. G., Hondzo, M., and Fang, X. 1993a. `Lake water quality modeling for projected future climate scenarios', J. Environ. Qual.,
22, 417±431.
HYDROLOGICAL PROCESSES, VOL. 11, 825±871 (1997) # 1997 by John Wiley & Sons, Ltd.
870 J. J. MAGNUSON ET AL.
Stefan, H. G., Eaton, J. G., Hondzo, M., Goodno, B. E., Fang, X., Hokanson, K. E. F., and McCormick, J. H. 1993b. `A methodologyto estimate global climate-change impacts on lake waters and ®sheries in Minnesota', in Ballentine, J. M. and Stakhiv, E. Z. (Eds),Proc. First Natl. Conf. on Climate Change and Water Resources Mgt. US Army Corps Eng., IWR Report 93-R-17. p. II.177±192.
Stefan, H. G., Hondzo, M., Eaton, J. G., and McCormick, J. H. 1995. `Predicted e�ects of global climate on ®shes in Minnesota lakes',in Beamish, R. J. (Ed.), Climate Change and Northern Fish Populations. Can. Spec. Publ. Fish. Aquat. Sci., 121, pp. 57±72.
Stefan, H. G., Hondzo, M., Fang, X., Eaton, J. G., and McCormick, J. H. 1996. `Simulated long-term temperature and dissolvedoxygen characteristics of lakes in the north-central U.S. and associated ®sh habitat limits', Limnol. Oceanogr., 41, 1124±1135.
Stemberger, R., Herlihy, A. T., Kugler, D. L. and Paulsen, S. G. 1996. `Climatic forcing on Zooplankton richness in lakes of thenortheastern United States', Limnol. Oceanogr., 41, 1093±1101.
Sterner, R. W., Hagemeier, D. D., Smith, W. L., and Smith, R. F. 1993. `Phytoplankton nutrient limitation and food quality forDaphnia'. Limnol. Oceanogr., 38, 857±871.
Stirling, G. and McQueen, D. J. 1986. `The in¯uence of changing temperature on the life history of Daphniopsis ephemeralis',J. Plankton Res., 8, 583±595.
Swackhamer, D. L. and Skoglund, R. S. 1991. `The role of phytoplankton in the partitioning of hydrophobic organic contaminants inwater', in Baker, R. A. (Ed.), Organic Substances and Sediments in Water. Lewis Publishers, Chelsea, Michigan. pp. 91±105.
Taylor, W. W., Smale, M. A., and Freeberg, M. H. 1987. `Biotic and abiotic determinants of lake white®sh (Coregons clupeaformis)recruitment in northeastern Lake Michigan', Can. J. Fish. Aquat. Sci., 44, 313±323.
Teller, J. T. 1985. `Glacial Lake Agassiz and its in¯uence on the Great Lakes', in Karrow, P. F. and Calkin, P. E. (Eds), QuaternaryEvolution of the Great Lakes. Geological Association of Canada, Special Paper 30, pp. 1±16.
Teller, J. T. and Thorleifson, L. H. 1983. `The Lake Agassiz±Lake Superior connection', in Teller, J. T. and Clayton, L. (Eds), GlacialLake Agassiz. Geological Association of Canada, Special Paper 26, pp. 261±290.
Terasmae, J. 1961. `Notes on late Quarernary climatic changes in Canada', Annales New York Acad. Sci. 95, 658±675.Tonn, W. M. 1990. `Climate change and ®sh communities: a conceptual framework', Trans. Am. Fish. Soc., 119, 337±352.Tonn, W. M., Magnuson, J. J., Rask, M., and Toivonen, J. 1990. `Intercontinental comparison of small-lake ®sh assemblages:
the balance between local and regional processes', Am. Nat., 136, 345±375.Turner, M. A., Howell, E. T., Robinson, G. G. C., Campbell, P., Hecky, R. E., and Schindler, E. U. 1994. `Roles of nutrients in
controlling growth of epilithon in oligotrophic lakes of low alkalinity', Can. J. Fish. Aquat. Sci., 51, 2784±2793.Twiss, M. R. and Nalewajko, C. 1992. `In¯uence of phosphorus nutrition on copper toxicity to three strains of Scenedesmus acutus
(Chlorophyceae)', J. Phycol., 28, 291±298.Vanderploeg, H. A., Bolsenga, S. J., Fahnensteil, G. L., Liebig, R. J., and Gardner, W. S. 1992. `Plankton ecology in an ice-covered bay
of Lake Michigan: utilization of a winter phytoplankton bloom by reproducing copepods', Hydrobiologia, 243/244, 175±183.Vavrus, S. J., Wynne, R. H., and Foley, J. A. 1996. `Measuring the sensitivity of southern Wisconsin lake ice to climate variations and
lake depth using a numerical model', Limnol. Oceanogr., 41, 822±831.Watras, C. J., Morrison, K. A., and Host, J. S. 1995. `Concentration of mercury species in relationship to other site-speci®c factors in
the surface waters of northern Wisconsin lakes', Limnol. Oceanogr., 40, 556±565.Webb, J., III, Bartlein, P. J., and Kutzbach, J. E. 1987. `Climatic change in eastern North America during the past 18,000 years:
comparisons of pollen data with model results', in Ruddiman, W. F. and Wright, H. E., Jr. (Eds), North America and Adjacent Oceansduring the Last Deglaciation. Geology of North America, Vol. K-3. Geological Society of America, Boulder, Colorado. pp. 142±165.
Webster, K. E. and Brezonik, P. L. 1995. `Climate confounds detection of chemical trends related to acid deposition in upper midwestlakes in the U.S.A.', Water Air Pollut., 85, 1575±1580.
Webster, K. E., Newell, A. D., Baker, L. A., and Brezonik, P. L. 1990. `Climatically induced rapid acidi®cation of a softwater seepagelake', Nature, 347, 374±376.
Webster, K. E., Kratz, T. K., Bowser, C. J., Magnuson, J. J., and Rose, W. J. 1996. `The in¯uence of landscape position on lakechemical responses to drought in northern Wisconsin', Limnol. Oceanogr., 41, 977±984.
Wentz, D. A., Rose, W. J., and Webster, K. E. 1995. `Long-term hydrologic and biogeochemical responses of a softwater seepage lakein north central Wisconsin', Wat. Resour. Res. 31, 199±212.
Wetzel, R. G. 1992. `Gradient-dominated ecosystems: sources and regulatory functions of dissolved organic matter in freshwaterecosystems', Hydrobiology, 229, 181±198.
Wilson, S. E., Walker, I. R., Mott, R. J., and Smol, J. P. 1993. `Climatic and limnological changes associated with the Younger Dryas inAtlantic Canada', Climate Dynam., 8, 177±187.
Wisconsin Department of Natural Resources, 1995. `Wisconsin's biodiversity as a management issue', A Report to Department ofNatural Resources Managers May 1995, Madison, Wisconsin. p. 240.
Wong, S. C. 1979. `Elevated atmospheric partial pressure of CO2 and plant growth', Oecologia, 44, 68±74.Wood, C. M. and McDonald, D. G. (Eds.) 1996. Global Warming Ð Implications for Freshwater and Marine Fish. SEB Seminar Series,
Cambridge University Press, Cambridge.Wynne, R. H. and Lillesand, T. M. 1993. `Monitoring phenological changes in lake ice as a robust indicator of regional climate change
using the AVHRR', Bull. Ecol. Soc. Am., Suppl., 74, 495±496.Wynne, R. H., Magnuson, J. J., Clayton, M. K., Lillesand, T. M., and Rodman, D. C. 1996. `Determinants of temporal coherence in
the satellite-derived 1987±1994 ice breakup dates of lakes on the Laurentian Shield', Limnol. Oceangr., 41, 832±838.Yan, N. D., Keller, W., Scully, N. M., Lean, D. R. S., and Dillon, P. J. 1996. `Increased UV-B penetration in a lake owing to drought-
induced acidi®cation', Nature, 381, 141±143.Yu, Z. and McAndrews, J. H. 1994. `Holocene water levels at Rice Lake, Ontario, Canada: sediment, pollen and plant-macrofossil
evidence', The Holocene, 4, 141±152.
# 1997 by John Wiley & Sons, Ltd. HYDROLOGICAL PROCESSES, VOL. 11, 825±871 (1997)
2: LAURENTIAN GREAT LAKES AND PRECAMBRIAN SHIELD 871