Embed Size (px)
Citation preview
POTENTIAL ECONOMIC VALUE OF CARBON SEQUESTRATION IN
KAKAMEGA FOREST AND SURROUNDING FARMS.
By
BUSIENEI VIVIAN JEPKEMEI
KM17/1509/05
A Thesis submitted to graduate school in partial fulfillment of requirements for
Collaborative Masters’ degree in Agricultural and Applied Economics (CMAAE)
EGERTON UNIVERSITY
APRIL, 2010.
ii
DECLARATION
DECLARATION
I hereby declare that this is my original work and has not been presented in this or any other
university for the award of a degree.
Vivian Jepkemei Busienei
SUPERVISORS
1. Dr. Job K. Lagat (Department of Agricultural Economics and Agribusiness
Management, Egerton University)
2. Dr. John Mburu (University of Nairobi, Department of Agricultural Economics)
iii
ABSTRACT
Experts generally agree that increased concentrations of greenhouse gases (GHGs) in the
atmosphere will result in changes in the earth‘s climate. Increased attention by policy
makers to this threat of global climate change has brought with it considerable attention to
the possibility of using forests as a means of sequestering and reducing emissions of carbon
dioxide in the atmosphere. As globally important storehouses of carbon, forests play a
critical role in influencing the Earth's climate. Reducing GHGs can be achieved by
controlling and avoiding land use changes. In many parts of the world, forests are being
rapidly cleared for agriculture or pasture, destructively logged, and degraded by human-set
fires. When forests are degraded or cleared, their stored carbon is released back to the
atmosphere during harvest and through respiration, thus these forests are net contributors of
carbon to the atmosphere. Forestry is an important sector in Kenya. The long term
development of the forestry sector will definitely affect the future amounts of carbon
sequestration and emission of the country. The purpose of this study was to provide an
understanding of the role that Kakamega forest can play in the mitigation of climate change
through carbon sequestration. It evaluates potential economic value of carbon sequestration
of Kakamega forest as well as the potential of the forest to participate in carbon trading. In
addition, the study investigated the status of the carbon stock in the forest, based on the
biomass stock. The study adopted the tobit model to estimate the determinants of the total
amount carbon that can be sequestered by trees in farms. The study confirms the huge
atmospheric CO2 that can be offset by the Kakamega forest, indicating the potential of
Kenya to participate in carbon trading for both its economic and environmental benefit. The
results further indicate that the major determinants of the amount of carbon that can be
sequestered by trees in farms are the sex of the respondent, position of the respondent in the
household, source of income, tenure status of the farm, and perception on whether trees can
reduce global warming. The results of the study can expedite policy decisions regarding
Kenya‘s participation in carbon trading through the Clean Development Mechanism (CDM)
as well as providing benefits to the national forestry sector, as well as the private owners
and participants in the community forestry, in terms of an overall increase in income, and
achieving self-sufficiency.
iv
TABLE OF CONTENTS
DECLARATION ................................................................................................................. ii
ABSTRACT......................................................................................................................... iii
TABLE OF CONTENTS ................................................................................................... iv
LIST OF ACRONYMS AND ABBREVIATIONS .......................................................... vi
LIST OF TABLES AND FIGURES ................................................................................. vii
CHAPTER ONE .................................................................................................................. 1
INTRODUCTION ................................................................................................................. 1
1.1 Introduction .............................................................................................................. 1
1.2 Problem Statement ................................................................................................... 3 1.3 Objectives ................................................................................................................ 4
1.4 Research Questions .................................................................................................. 4
1.5 Justification of the study .......................................................................................... 4
1.6 Scope and Limitations of the study .......................................................................... 6
1.7 Definition of terms ................................................................................................... 7
CHAPTER TWO ................................................................................................................. 8
LITERATURE REVIEW ...................................................................................................... 8
2.1 Forests and Climate Change .................................................................................... 8
2.2 The Kyoto Protocol and Climate Change .............................................................. 10
2.3 Climate Change Mitigation Options ...................................................................... 11
2.4 Theoretical Framework .......................................................................................... 13
CHAPTER THREE ........................................................................................................... 17
RESEARCH METHODOLOGY ........................................................................................ 17
3.1 Study Area ............................................................................................................. 17
3.2 Sampling ................................................................................................................ 19
3.3 Estimation of Carbon Sequestered ......................................................................... 20
3.4 Approximation of economic value Carbon under CDM trading ............................ 21 3.5 Empirical Model .................................................................................................... 22
3.6 Data analysis .......................................................................................................... 23
CHAPTER FOUR.............................................................................................................. 24
RESULTS AND DISCUSSION .......................................................................................... 24
4.1 Potential and Economic Value of Carbon Sequestration in Kakamega Forest and
Surrounding Farms ...................................................................................................... 24
4.2 Descriptive Results................................................................................................. 27
4.3 Estimated Econometric Results .............................................................................. 30
4.9 Descriptive Statistics of Explanatory Variables ..................................................... 33
CHAPTER FIVE ............................................................................................................... 34
v
CONCLUSION AND RECOMMENDATIONS ................................................................ 34
5.1 Summary ................................................................................................................ 34
5.2 Policy Implications ................................................................................................ 34 5.3 Recommendations .................................................................................................. 35
REFERENCES .................................................................................................................. 36
APPENDICES .................................................................................................................... 42
APPENDIX I: Survey Questionnairre ............................................................................. 42
APPENDIX II: Estimation Results of Tobit model for the determinants of amount of
carbon sequestered by trees in farms. .............................................................................. 46
APPENDIX III: Descriptive Statistics of the determinants of amount of carbon
sequestered by trees in farms. ........................................................................................... 48
APPENDIX III: Photographs of Kakamega Forest and Farms……………………….49

vi
LIST OF ACRONYMS AND ABBREVIATIONS
CDM Clean Development Mechanism
CER Certified Emissions Reduction
CFCs Chlorofluorocarbons
CH4 Methane
CO2 Carbon Dioxide
GHGs Greenhouse gases
IPCC Intergovernmental Panel on Climate Change
N2O Nitrous Oxide
UNFCCC United Nations Framework Convention on Climate Change
vii
LIST OF TABLES AND FIGURES
Table 2.1: Estimation of Biomass of Tropical Forests Using Regression Equations…....... 14
Figure 3.0: Map of Kakamega Forest………………………………………………………18
Table 3.1: Variables Description, Measurement and Expected signs……………………...23
Table 4.1: Carbon density (Mg C/ha)………………………………………………………24
Table 4.2: Comparing Carbon Density Estimates of Kakamega Forest and Neotropical
Forests……………................................................................................................................25
Table 4.3: Household Head Summary Statistics…………………………………………...27
Table 4.4: Household Head Characteristics………………………………………………..27
Table 4.5: Socio-economic Characteristics………………………………………………...28
Table 4.6: Awareness of Climate Change Issues…………………………………………..29
Table 4.7: Perception on Reduction of Global Warming Using Trees……………………..30
Table 4.8: Estimated Tobit Model for the Determinants of Amount of Carbon Sequestered
by Trees in Farms…………………………………………………………………………..31
Table 4.9: Descriptive Statistics of Explanatory Variables………… ……………………..33
1
CHAPTER ONE
INTRODUCTION
1.1 Introduction
Understanding the economic value of carbon sequestered in forests is important in
addressing the risk of global climate change that has presented a profound challenge to
the international community. Climate change refers to the variation in the earth‘s global
climate or in regional climates over time scales ranging from decades to millions of
years. In recent usage, it may often refer only to the ongoing changes in modern climate,
including the rise in average surface temperature or global warming. These changes may
come from processes internal to the Earth, be driven by external forces (such as
variations in sunlight intensity) or, most recently, be caused by human activities. The
major cause of climate change is excessive greenhouse gases (GHGs) in the atmosphere
and is predicted to increase by 75-350% by 2100 (IPCC, 2001). The GHGs include:
Carbon dioxide (CO2) from burning fossil fuels – coal, oil, and gas, CO2 from
deforestation, Methane (CH4), and Nitrous Oxide (N2O). Carbon dioxide is the highest
emitted greenhouse gas in the world today, mostly due to fossil fuel based energy
industries and deforestation (Fung, 1994).
Forest and forest products have an essential role to play in the carbon cycle mitigation
process. Reducing greenhouse gas emissions can be achieved by controlling and avoiding
land use changes. Deforestation in the tropics alone accounts for about 20% of total
greenhouse emissions (Chomitz, 2000). The role of forestry and land use change in
climate change has been controversial throughout the Kyoto Protocol international
negotiation process. There are different opinions around the globe on whether forestry
activities should be counted or not. A country‘s position depends on factors such as
whether their forests are currently or prospectively a net source or sink for carbon
dioxide; whether carbon (C) stock changes in forests can be measured and verified; and
the relative emphasis that should be placed on reducing emissions versus increasing
sequestration.

2
Since early 1990‘s governmental and non governmental organizations across the globe
have been discussing strategies to mitigate atmospheric concentrations of greenhouse
gases (Hedger, 1998). Several studies have found that growing trees to sequester carbon
could provide relatively low-cost net emission reductions for a number of countries
(Adams, et al., 1993; Bruce et al., 1996; Callaway and McCarl, 1996; Parks and Hardie,
1995; Richards et al., 1993; Stavins, 1999).
It is widely recognized that forests play an important role in the global carbon cycle by
sequestering and storing carbon, enabling the switch from more energy-intensive
materials such as steel to forest products, and facilitating substitution of biomass fuels for
fossil fuels (Brand, 1998). It is the role of forests in climate change that has influenced
participants of the Kyoto Protocol to allow countries to count carbon sequestered in forest
to be counted toward a country‘s emissions requirements. Preliminary research indicates
that carbon through forestry practices can be cost effective. For example, Dixon (1997)
estimated that sequestration of carbon through silvicultural practices could cost between
$2-56 per metric ton.
Kakamega Forest is the only tropical rainforest in Kenya, left over from past millennia
when dense rain forest stretched from West Africa, across Central Africa and into the
highland areas on the west and eastern walls of the Great Rift Valley. The forest has been
a protected area of Kenya since its vital role in the eco-system was first recognized in
1933. In addition to its richness in biodiversity, it could also play an important role in
mitigation of GHGs and help in fighting the impacts of global warming. Hence there is
need to assess the role of the forest in carbon sequestration. Kakamega forest is located in
one of the most densely populated rural areas in the world. It is estimated that areas
surrounding the forest have about 600 people per km2
(Tattersfield et al. 2001). This
implies that the farms surrounding the forest also help in mitigation of climate change by
sequestering some carbon if planted with trees. The farmers practice agroforestry in their
farms hence sequester carbon thereby becoming a positive externality. There is need for a
comparison of carbon sequestered by the forest as well as the surrounding farms.
3
1.2 Problem Statement
The risk of global climate change as a result of rising greenhouse gas emissions presents
a profound challenge to the international community. There is increasing concern about
climate change and variability, which has led to a rapidly growing body of research on
impacts of warming on the economy, which may have adverse effects on agriculture.
Changes in land use of the forest ecosystem have occurred as a result of climate changes
and these have been documented by various researchers (Kifcon, 994). It is therefore
important to undertake the role of forests in mitigation of climate change. The
establishment of the potential economic value of forests is critical for substantial and
productive agriculture and therefore to food security.
Sub-Saharan Africa which includes Kenya is hard hit by climate change. This regions
experience high temperatures and low (and highly variable) precipitation. Interestingly,
the economies of this region are highly dependent on agriculture (Kurukulasuriya and
Rosenthal, 2003). The levels and trends of forest changes have also been aggravated by
the increase in human population around the forest ecosystem. Parts of the forest have
been converted to agricultural activities and settlement leading to a net loss of the natural
forest area. Nonetheless, the farms surrounding the forest have the potential to sequester a
certain amount of carbon that is economic value. However, the amount of carbon that can
be sequestered by these farms as well as the determinants of the amount sequestered are
not known. The study therefore seeks to establish and compare the amount of carbon
sequestered by the forest as well as the surrounding farms.
4
1.3 Objectives
The overall objective of the study is to assess the potential economic value of Kakamega
forest and the surrounding farms in carbon sequestration as a way of mitigating climate
change through reduction of carbon dioxide in the atmosphere.
Specific Objectives
Specifically, the study aims:
1. To determine the per unit amount of carbon that can be sequestered by Kakamega
forest and its surrounding farms.
2. To determine potential economic value of carbon sequestration of Kakamega
forest as well as the surrounding farms.
3. To identify the determinants of carbon sequestered by trees in farms.
1.4 Research Questions
1. What is the per unit amount of carbon that can be sequestered by Kakamega forest
and the surrounding farms?
2. What is the potential economic value of carbon sequestration of Kakamega forest
as well as that of the surrounding farms?
3. What are the determinants of carbon sequestered by trees in farms?
1.5 Justification of the study
The world's forests provide many important benefits: The population surrounding the
forests depends on it for their livelihood from which they obtain a variety of products
such as food, herbal medicines, wood fuel and building materials. Froests help regulate
local and regional rainfall. Forests also help slow global warming by storing or
sequestering carbon. Consequently, they impact global atmospheric carbon levels and, in
turn, are influenced by atmospheric carbon levels and related climate change.
Understanding the role that Kakamega forest can play in the mitigation of climate change
via carbon sequestration can help in the proper management of the forest with positive
implications for agriculture in Kenya. But there are very few studies on the role of forests
in mitigating climate change, especially in Kenya. This study will provide a crucial step

5
in efforts aimed at assessing and understanding the role Kakamega forest will play in
mitigating climate change in Kenya. The knowledge will form the basis for achieving the
country‘s responsibility to the Kyoto Protocol in meeting the country‘s net emissions
targets for CO2 and other GHGs. On the other hand, the households surrounding the
forest may plant trees for other purposes other than to sequester carbon. This in turn
becomes a positive externality because when farmers plant trees, for example for
conservation purposes, the trees also serves the purpose of sequestering carbon. The
comparison between the amount of carbon sequestered by the forest and the farms may
provide a better understanding of forest conservation and/or tree planting in the
surrounding farms.
Due to increase pressure on forest resources, there has been destruction on biological
diversity. The 1991 Survey showed the forest had lost 50 per cent of its volume and it
would take about 60 years to establish complete protection of the forest and restore it to
its 1965 condition (Kifcon, 1994). There is a real danger in the next decade. One
approach to conserve the forest is to examine the potential economic value of the forest to
sequester carbon, disseminate this knowledge and involve local communities and other
stakeholders to realise this benefit.
6
1.6 Scope and Limitations of the study
The study was carried out in Kakamega forest which is located in Kakamega District in
the Western Province of Kenya. It is part of a larger research program Biota
(BIOdiversity monitoring Transect Analysis) East Africa project which is an
interdisciplinary project on biodiversity research in East African rainforests. The general
objective of the project is to conduct economic analyses of strategies for conserving
biodiversity and forest ecosystem functions and reconciling conflicting interests of
different stakeholders of Kakamega forest.
The study area was purposively selected as it is the only tropical rainforest in Kenya rich
in biodiversity and also because of the recognized vital role it plays in the ecosystem. In
considering the carbon content in trees, the study only focuses on mature trees and the
above ground biomass trees.
Time limit variable and resources scheduled for this research could not exhaust all
aspects of interest in the study site. Unavoidable errors from respondents and those
arising from sampling design may have affected the precision of the results. In real world
situation and experience in the economic phenomena, most variables may be interrelated
in one way or another which may not be easily understood or captured.
7
1.7 Definition of terms
Afforestation - Planting of trees on agricultural or other non-forest land
Biomass is the total amount of live and inert organic matter above and below ground
expressed in tons of dry matter per unit area.
Climate Change- Climate change refers to the variation in the earth‘s global climate or
in regional climates over time scales ranging from decades to millions of years.
Deforestation - Permanent land use change from forests to other uses
Greenhouse gases – This include carbon dioxide, methane, nitrous oxide, and other
gases that modify the heat retention capacity of the Earth's atmosphere
GtC - 1 billion metric tons of carbon, equivalent to 3.7 billion tonnes of CO2
Intergovernmental Panel on Climate Change (IPCC): It was established in 1988 by
the World Meteorological Organization and the UN Environment Program. The IPCC is
responsible for providing the scientific and technical foundation for the United Nations
Framework Convention on Climate Change (UNFCCC); primarily through the
publication of periodic assessment reports.
Kyoto Protocol: An international agreement adopted in December 1997 in Kyoto, Japan.
The Protocol sets binding emission targets for countries to reduce their carbon emissions.
Reforestation - Planting or natural regeneration of forests after harvesting, fire, or other
type of forest disturbance (perturbation)
Sequestration - The removal of carbon from the atmosphere. It is the process of
increasing the carbon content of a carbon reservoir other than the atmosphere. Biological
approaches to sequestration include direct removal of carbon dioxide from the
atmosphere through land-use change, afforestation, reforestation, and practices that
enhance carbon in agriculture. Physical approaches include separation and disposal of
carbon dioxide from fuel gases or from fossil fuels.
Sink - Any process, activity, or mechanism that removes greenhouse gases
Source - Any process, activity, or mechanism that emits greenhouse gases
United Nations Framework Convention on Climate Change (UNFCCC): A treaty
signed at the 1992 Earth Summit in Rio de Janeiro that calls for the "stabilization of
greenhouse gas concentrations in the atmosphere at a level that would prevent dangerous
anthropogenic interference with the climate system.
8
CHAPTER TWO
LITERATURE REVIEW
A growing body of literature suggests that the Earth‘s surface temperature this century is
as warm as or warmer than any century since at least 1400 AD (Nicholls et al., 1996). By
the year 2100, the average surface temperature is projected to increase by 1.4° to 5.8°
while sea level is expected to rise by 9 to 88 cm (IPCC, 2001). Greenhouse gases (GHGs)
such as (CO2), methane (NH4), nitrous oxides (N2O) and chlorofluorocarbons (CFCs)
absorb thermal radiation emitted by the earth‘s surface. If more GHGs are emitted into
the atmosphere they absorb more heat, which, in turn, could lead to a change in the
world‘s climate. Among the GHGs, CO2 is the most abundant and is responsible for more
than half the radiative forces associated with the greenhouse effect (Watson et al., 2000;
Schimell et al., 1995).
2.1 Forests and Climate Change
Forest ecosystems play an important role in the climate change problem because they can
both be sources and sinks of atmospheric CO2. Carbon stored in the trees is most directly
affected by forest management. Forests can be managed to assimilate CO2 via
photosynthesis, and store carbon in biomass and in soil (Watson et al., 2000; Brown,
1998; Brown et al., 1996). Available estimates suggest that forests may mitigate
additionally from 1 to 2 GtC (1 billion metric tons of carbon) per year between 1995 and
2050 (Brown et al., 1996; Kauppi et al., 2001). Trees and plants are essential for a stable
climate. They help remove carbon dioxide (a heat-trapping gas) from the air by storing it
in their leaves, wood, roots and soils. But when trees and plants are destroyed, this stored
carbon dioxide is released into the atmosphere, where it contributes to climate change. In
fact, deforestation and land use change contributes approximately 20 to 25 percent of the
carbon emissions that cause climate change. Because the trees absorb carbon dioxide as
they mature, reducing deforestation provides an important ecosystem service — carbon
sequestration. The benefits of this are twofold: Forests not only contribute to a solution to
9
climate change, but also create valuable habitat that sustains and protects the area's
unique plants and animals.
Great attention is focused on tropical forestry to offset carbon emission due to its cost-
effectiveness, high potential rates of carbon uptake, and associated environmental and
social benefits (Brown et al., 2000; Moura-Costa, 1996; Myers 1996). Tropical forests
have the biggest long-term potential to sequester atmospheric carbon by protecting
forested lands, reforestation, slowing down deforestation, and agroforestry (Brown et al.,
1996). However, at present, tropical forests are estimated to be a net source of 1.8 GtC
per year primarily because of deforestation, harvesting and forest degradation (Watson et
al., 2000). Kakamega Forest is the only tropical rainforest in Kenya, left over from past
millennia when dense rain forest stretched from West Africa, across Central Africa and
into the highland areas on the west and eastern walls of the Great Rift Valley.
Understanding how forest sequestration integrates with other climate change options is
challenging. For the most part, climate policy is assessed with national or global
economic models that capture important economic linkages in the world economy
(Manne and Richels, 2001; Nordhaus and Boyer, 2000; IPCC, 2000). Methods for
integrating energy models and forestry models have been used in several studies. A
recent example by Sohngen and Mendelsohn (2003) linked a dynamic timber model to
the DICE model (Nordhaus and Boyer, 2000), and showed that forests could account for
approximately a third of total abatement over the next century. That study, however,
looked at only two potential policy responses. More stringent policy targets, or policies
that include additional abatement options, such as methane abatement, could lead to
different greenhouse gas price paths, and different implications for the ―where‖ and
―when‖ of accomplishing carbon sequestration in forests.
Believed to be the easternmost relic of the Guineo-Congolian rainforest belt that once
spanned the breadth of Africa (Kendall, 1969; Kokwaro, 1988; Wass, 1995), the
Kakamega National Forest is Kenya‘s only remaining rainforest fragment larger than a
few hundred hectares. Bio-physical conditions and historical accounts indicate that much
10
of western Kenya was once forested and could still support closed canopy forest
(Kendall, 1969; Kokwaro, 1988; Lovett and Wasser, 1993), however Kakamega Forest is
now set in a landscape dominated by small scale agriculture and high population densities
of 10 people/ha (Kendall, 1969; Kokwaro, 1988; Wass, 1995). Regional trends of forest
loss have continued even within the national forest boundaries: more than 50% of
Kakamega‘s indigenous forest cover was cleared in a span of 30 years (Wass, 1995).
Despite its reduced size, the remaining 140 km2 of indigenous forest is the headwaters
for the district‘s rivers (Kokwaro, 1988), retains a globally significant level of
biodiversity (Wass, 1995), and provides essential goods and services (fuelwood charcoal,
water, grazing areas, medicinal, and edible plants) to a heavily reliant local population
(Kokwaro, 1988; Emerton, 1994; Wass, 1995).
2.2 The Kyoto Protocol and Climate Change
The Kyoto Protocol to the United Nations Framework Convention on Climate Change
(UNFCC, 1997) establishes the principle that carbon sequestration can be used by
participating nations to help meet their respective net emission reduction targets for
carbon dioxide and other greenhouse gases. After fossil-fuel combustion, deforestation is
the second largest source of carbon dioxide emissions to the atmosphere. Estimates of
annual global emissions from deforestation range from 0.6 to 2.8 billion tons, compared
with slightly less than 6.0 billion tons annually from fossil-fuel combustion, cement
manufacturing, and natural gas flaring, combined (Bruce et. al., 1996 & Houghton,
1991). There are three pathways along which carbon sequestration is of relevance for
atmospheric concentrations of carbon dioxide: carbon storage in biological ecosystems,
carbon storage in durable wood products, and substitution of biomass fuels for fossil fuels
(Richards and Stocks, 1995).
The Protocol attempted to reconcile the diversity of viewpoints on land use change and
forestry. According to article 3.3 of the Protocol, land-use change and forestry activities
that can be counted toward the emissions reduction target include afforestation,
reforestation, and deforestation. A variety of ways in which emissions can be abated,
11
include the Clean Development Mechanism (CDM) (IPCC, 2000). In the CDM, emission
reduction projects implemented in developing countries sell certificates of emissions
reductions to parties with emission reduction targets within the Kyoto Protocol.
Additionally, the CDM promotes synergism, both in the energy sector and the forestry
sector, such as combined energy production or fuel switching, industrial applications and
land-use change, including tree plantations and forest regeneration.
The emergence of a global market for carbon credits, earned through investments in
activities that quantifiably offset or reduce carbon emissions, offers a powerful, but not
yet fully refined, tool to finance improved forest management and sustainable
development. By 2000, well before the 2005 ratification of the Kyoto Protocol and its
Clean Development Mechanism, over 150 bilateral carbon-trading projects had been
developed (Bass et al., 2000), yet few have been in Africa. Model-based assessments of
carbon storage in Africa‘s forests indicate that much of the areas that are biophysically
capable of supporting carbon rich tropical forests are currently degraded and deforested
(Brown and Gaston, 1995; Zhang and Justice, 2001) and that Kenya specifically could
almost double its current aboveground biomass. Kenya lost 930 km2 of closed forest from
1990 to 2000 (FAO, 2003). The Kakamega National Forest of western Kenya – a
protected area with a long history of deforestation, a high use value for surrounding
residents, and a constant threat of further degradation – provides a promising and
important site for initiating carbon offset activities in Kenya.
2.3 Climate Change Mitigation Options
Most forest sector actions that promote carbon conservation and sequestration make
good social, economic, and ecological sense even in the absence of climate change
considerations. Major objectives for managing forests generally include sustainable
forest development, industrial wood and fuel production, traditional forest uses,
protection of natural resources, recreation, rehabilitation of damaged lands, and the like.
The carbon conserved and sequestered from managing for these objectives will be an
added benefit. For example, although the establishment of plantations on non-forested
12
land provide for economic development, provide new wood resources, replace
diminishing or less productive natural forests, generate wood exports, substitute for
imports, or rehabilitate degraded lands (Evans, 1990; Kanowski et al., 1992), they are
also an important means for sequestering carbon.
Forest management practices that meet the objectives given above can be grouped into
three categories based on how they are viewed to curb the rate of increase in atmospheric
CO2. These categories are: (1) management for carbon emission avoidance or
conservation, (2) management for carbon storage or sequestration, and (3) management
for carbon substitution (Brown et al., 1996).
2.3.1 Emission avoidance: The main goal of management for carbon emission
avoidance is to conserve existing carbon pools in forest vegetation and soil through
options such as controlling deforestation or logging, protecting forest in reserves,
changing harvesting regimes (reduced impact logging), and controlling other
anthropogenic disturbances such as fire and pest outbreaks. Reducing tropical
deforestation and forest degradation rates would require action to reduce the pressures for
land and commodities while increasing the protection of remaining forests for the
purposes of conservation and timber production. Global action to mitigate carbon
emissions by conserving carbon pools may lead to more interest and success in
controlling deforestation and making agriculture more sustainable.
2.3.2 Sequestration: Management for carbon sequestration means increasing the amount
of carbon stored in vegetation (living above and below ground biomass), dead organic
matter and soil (litter, dead wood, and mineral soil), and durable wood products.
Increasing the carbon pool in existing forests can be accomplished by silvicultural
treatments, protecting secondary forests and other degraded forests whose biomass and
soil carbon densities are less than their maximum value and allowing them to sequester
carbon by natural or artificial regeneration, and to establish plantations on non-forested
lands or increase the tree cover on agricultural or pasture lands (agroforestry) for
environmental protection and local needs (Lugo et al,. 1993; Allen et al., 1995). There is
13
need to asses the total amount of carbon that can be can be conserved in trees planted in
farms.
2.3.3 Substitution: Management for carbon substitution aims at increasing the transfer
of forest biomass carbon into products (e.g., construction materials and biofuels) rather
than using fossil-fuel-based energy and products and cement-based products.
Substitution management has the greatest mitigation potential in the long term (Marland
and Marland, 1992). It views forests as renewable resources and focuses on the transfer
of biomass carbon into products that substitute for, or lessen the use of, fossil fuels rather
than on increasing the carbon pool itself. Fossil fuel substitution with biomass derived
from sustainably managed renewable resources such as forests, will:
i) delay the release of carbon from fossil fuel until it is needed sometime in the future;
ii) increase standing stock of forests; and
iii) maintain their carbon sink
2.4 Theoretical Framework
2.4.1 Regression Analysis of biomass estimation method
The biomass estimation method used in the study is based on linear regression analysis
approach. The linear regression equation approach requires the selection of the regression
equation that is best adapted to the conditions in the study area. Linear regression models
have been fitted to data in various situations of variable site and ecological conditions
globally. The work done by Brown, Gillespie and Lugo (1989) and FAO (1997) on
estimation of biomass of tropical forests using regression equations of biomass as a
function of diameter at breast height is central to the use of this approach. Some of the
equations reported by Brown, Gillespie and Lugo (1989) have become standard practice
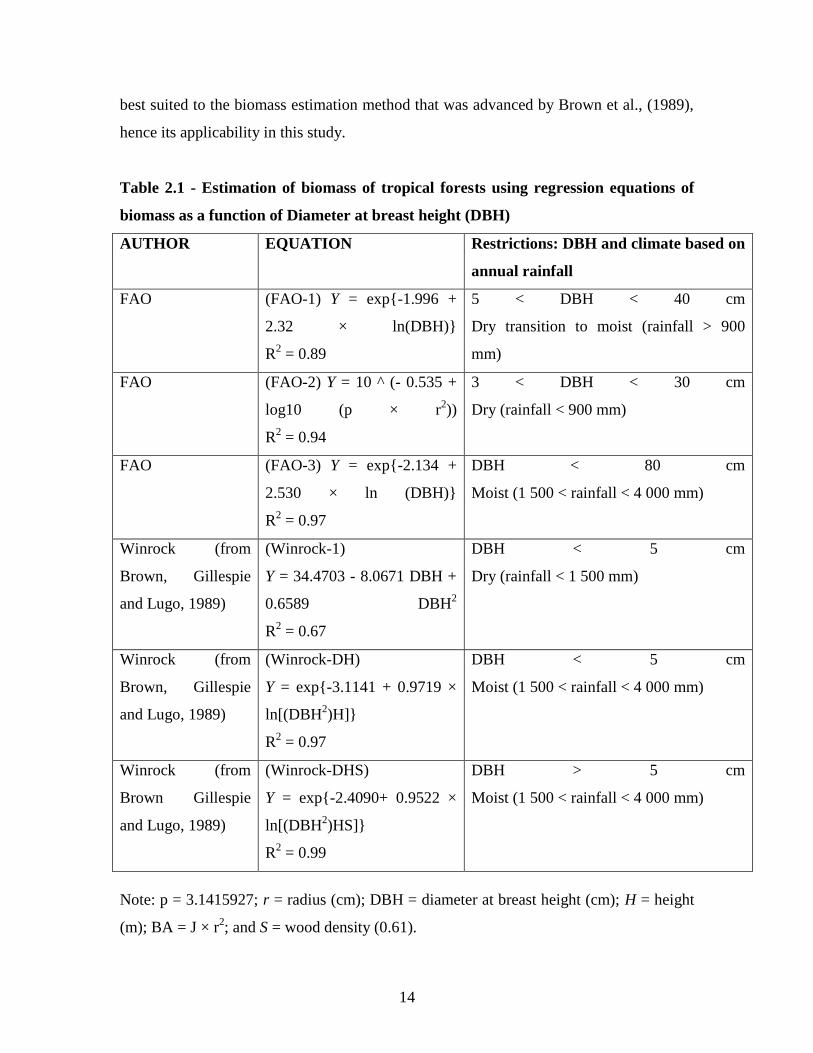
because of their wide applicability. Table 2.1 presents a summary of the equations, as
found in the specialized literature, including the restrictions placed on each method.
Kakamega forest and its surrounding farms has trees with diameter at breast height being
greater than 5cm and having average rainfall ranging from between 1500 and 4000mm, is
14
best suited to the biomass estimation method that was advanced by Brown et al., (1989),
hence its applicability in this study.
Table 2.1 - Estimation of biomass of tropical forests using regression equations of
biomass as a function of Diameter at breast height (DBH)
AUTHOR EQUATION Restrictions: DBH and climate based on
annual rainfall
FAO (FAO-1) Y = exp{-1.996 +
2.32 × ln(DBH)}
R2 = 0.89
5 < DBH < 40 cm
Dry transition to moist (rainfall > 900
mm)
FAO (FAO-2) Y = 10 ^ (- 0.535 +
log10 (p × r2))
R2 = 0.94
3 < DBH < 30 cm
Dry (rainfall < 900 mm)
FAO (FAO-3) Y = exp{-2.134 +
2.530 × ln (DBH)}
R2 = 0.97
DBH < 80 cm
Moist (1 500 < rainfall < 4 000 mm)
Winrock (from
Brown, Gillespie
and Lugo, 1989)
(Winrock-1)
Y = 34.4703 - 8.0671 DBH +
0.6589 DBH2
R2 = 0.67
DBH < 5 cm
Dry (rainfall < 1 500 mm)
Winrock (from
Brown, Gillespie
and Lugo, 1989)
(Winrock-DH)
Y = exp{-3.1141 + 0.9719 ×
ln[(DBH2)H]}
R2 = 0.97
DBH < 5 cm
Moist (1 500 < rainfall < 4 000 mm)
Winrock (from
Brown Gillespie
and Lugo, 1989)
(Winrock-DHS)
Y = exp{-2.4090+ 0.9522 ×
ln[(DBH2)HS]}
R2 = 0.99
DBH > 5 cm
Moist (1 500 < rainfall < 4 000 mm)
Note: p = 3.1415927; r = radius (cm); DBH = diameter at breast height (cm); H = height
(m); BA = J × r2; and S = wood density (0.61).

15
2.4.2 The Tobit Model
A tobit model is an econometric model in which the dependent variable is censored; in
the original model of Tobin (1958), for example, the dependent variable was expenditures
on durables, and the censoring occurs because values below zero are not observed.
The tobit model is also called the censored regression model or the limited dependent
variable regression model because of the restriction put on the values taken by the
regressand. It is used in a censored sample in which information on the regressand is
available only for some observations.
Statistically, it is expressed as follows, where the relationship between the observed
outcome variable, Yi , and the latent outcome variable of interest is:
Yi = 1 if y*i>0
0 Otherwise
Where,
iii Xy 10*
The regression model to be estimated is then expressed as follows:
ijjii XXY ........10 if RHS>0
Where Xi…Xj represents a set of independent variables; β0 is the constant term, β1… βj.are
the vector coefficients to be estimated and i is the error term being independent and
normally distributed, i ~N 2,0 . The unobservable variable y*i (also known as a latent
variable) is related to the total amount of carbon that can be sequestered by farm i. We
assume that the unobservable variable y*i is normally distributed with the same mean µ
and variance σ2.
The tobit model estimates the parameters by regressing Yi on Xi for all observations, with
the censored data included as zeros. It uses all of the information obtained, including
information about censoring, and provides consistent estimates of the parameters.
Since all we know for censored cases is that y*i ≤0, we use the probability of being
censored as the likelihood.

16
In the study, it is assumed that there might be some farms which do not have mature trees
hence have no capacity to sequester carbon. This necessitates the use of the tobit model
so as to cater for the unobserved variables.
17
CHAPTER THREE
RESEARCH METHODOLOGY
This chapter presents a description of the methods employed in this study and the study
area. It further presents the methods employed in sampling, data collection and analytical
methods used as well as a description of the study area.
3.1 Study Area
Kakamega Forest is situated mainly in Kakamega District in the Western Province of
Kenya, between latitudes of 0o.101 and 0o 211N and longitudes 34.471 and 340 580E. Its
altitude varies between 1520m and 1680m above sea level. It is a mid-altitudinal tropical
rainforest and considered to be the eastern most remnant tropical rainforest of the
Guinea-Congolean type (Kokwaro, 1988). Thus, it is the only remnant in Kenya of rain
forest dwelling animals and plants, but due to its elevation it also contains montane
elements of flora and fauna (Althof et al., 2003). It is located amidst the densest
populated agricultural centre in the world with about 600 people per km2 (Tattersfield et
al., 2001) and with a population growth rate in 1990 of 3.8% (Rodgers, 1992), an increase
of population density in the next decades is most likely (Cincotta et al., 2000).
Annual rainfall in Kakamega Forest ranges from 2147mm per year (as averaged from FD
records at Isecheno Forest Station from 1982 to 2001) and highly seasonal with a rainy
season from April to November and a short dry season from December to March. The
average monthly Temperatures are between 11.4˚C-25˚C per year. (Tsingalia 1990).
The main forest block gazetted in 1933 for forest and game reserves occupies
approximately 23,777 ha (Kokwaro, 1988). Kakamega forest ecosystem is an important
catchment traversed by two major rivers each having numerous tributaries. The Isiuku
River, which rises from the Nandi escarpment, drains the northern section of the forest
while Yala River whose source is situated in Tinderet and Southern Nandi forests drains
the southern section of the forest. The main agents of forest degradation have been
mostly logging and extraction of commercially valuable timber, followed by charcoal
18
burning, cattle grazing, shamba system farming, hunting for bush-meat, tree debarking
and removal of dead trees for firewood (Oyugi, 1996; Mitchell, 2004). In the early 1980s
a presidential decree banned all indigenous tree species exploitation, leading to a halt of
commercial logging, however, tree poaching and other illegal activities still exist.
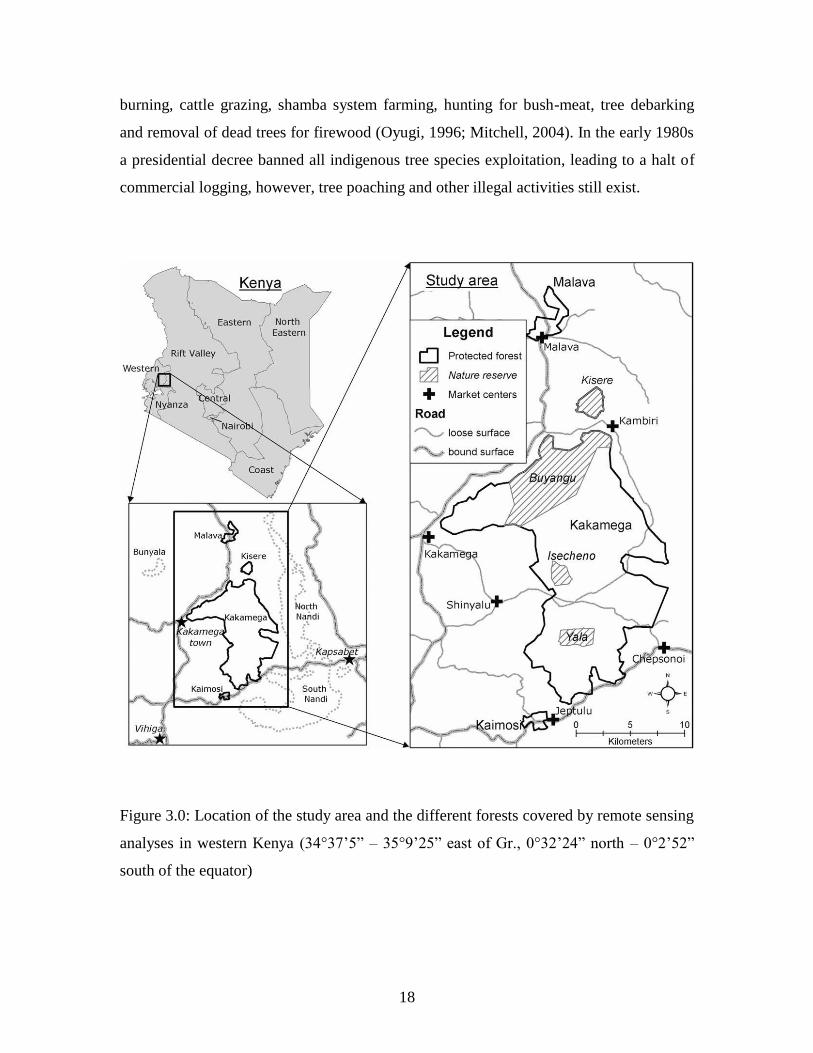
Figure 3.0: Location of the study area and the different forests covered by remote sensing
analyses in western Kenya (34°37‘5‖ – 35°9‘25‖ east of Gr., 0°32‘24‖ north – 0°2‘52‖
south of the equator)
19
3.2 Sampling
To determine the carbon sequestration potential of Kakamega forest, information on
biomass density was obtained from secondary sources from sub-projects of BIOTA East
Africa. These data was used to achieve the first objective of the study. Primary data was
used from the farms surrounding the forest. The sampling unit for this study is the farms
surrounding Kakamega forest.
The study was undertaken within approximately 10 Km radius around the Kakamega
Forest. A reconnaissance survey in the study area indicated that there are progressively
fewer people that extract beyond 5km stretch from the forest (Mburu and Guthiga, 2006).
The sampling frame (the list of households) of 34,000 household used was generated with
the help of administrative heads of the villages and other local leaders. Given its large
household population (34,000), drawing a representative sample there from will be
inevitable. A representative sample size of 120 households was randomly selected
stratified random sampling. The strata were the administrative zones. Each zonal sample
was proportional to its population and was drawn using simple random probability
sampling technique to give each sampling unit the same chance of being sampled. The
formula for determining a sample from a large population was used to select a sample of
120 households. However, for a large population as is the case in this study, statistically,
it is advisable that we can reliably assume that the proportion of the population
containing the estimate is 50 per cent. For such a large population again we set the
confidence interval at 5 percent and set the confidence level at 95 per cent (Nachmias and
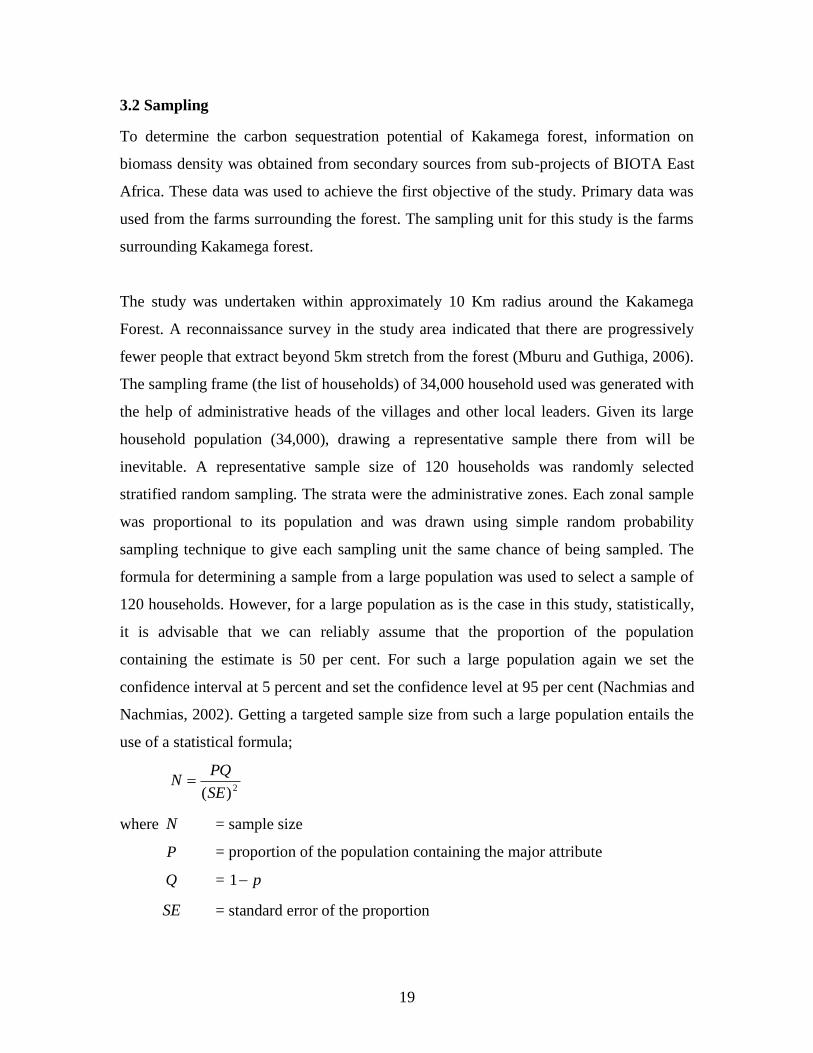
Nachmias, 2002). Getting a targeted sample size from such a large population entails the
use of a statistical formula;
2)(SE
PQN
where N = sample size
P = proportion of the population containing the major attribute
Q = p1
SE = standard error of the proportion

20
A household in this study is defined as a farm family. It is composed of all the individuals
or family in a farm. Structured questionnaires were administered to the sampled farms by
trained enumerators. The questionnaires elicited information on household socio-
economic, farms, and demographic characteristics.
3.3 Estimation of Carbon Sequestered
Biomass estimation method was used to calculate the per unit amount of Carbon that can
be sequestered by Kakamega forest as well as the surrounding farms. Objective one will
be achieved using this method.
The above-ground biomass of trees in general was measured by the following regression
equation of biomass as a function of diameter at breast height (Brown et al., 1989):
)}(9522.04090.2exp{ 2HSDInY
Where: Y is the above-ground biomass in tdm/ha
H is the height of the trees in meters (average height)
D is the diameter at breast height (1.3 in cm)
S is the wood density per hectare
Underground biomass is calculated as 15% of the above-ground biomass (MacDicken,
1997). The above-and under-ground biomass was added to get the total biomass of the
stand.
The carbon content of trees was measured based on the biomass of trees with the
following formula adapted from World Bank (1998):
Biomass carbon content (tdm/ha) = Biomass weight (tdm/ha) * 0.5 tC/tdm,
Where: tC stands for tons of carbon and tdm for tons of dm.
21
3.4 Approximation of economic value Carbon under CDM trading
This method helped in achieving objective two of the study.
The CDM was established by Article 12 of the Kyoto Protocol to create Certified
Emissions Reduction (CERs), generated by projects in developing countries. It does not
explicitly mention forest or land use but allows any project that has ‗real, measurable and
long-term benefits related to the mitigation of climate change‘ and that is ‗additional to
any that would occur in the absence of the certified project activity‘. This is according to
Kyoto Protocol. The CDM allows the possibility of trading carbon offsets from forestry
or land-use projects (at least from reforestation and afforestation activities) through the
Article 12 (the CDM or ‗CERs‘ from developing countries), (Kyoto Protocol, 1997).The
cost of carbon sequestration varies from region to region, and also from country to
country, based on different economic analyses. Phat et al. (2004) estimated the cost of
carbon at around US$ 19.7 per Mg C in Southeast Asian countries. Kirschbaum (2001)
assumed a cost of US$ 10 per Mg C for indefinite carbon savings in different arbitrary
accounting periods. Missfeldt and Haites (2002) used a 1995 cost of US$ 15 per Mg C
for a sink enhancement scenario, and Tschakert (2002) used a cost of US$ 15 per Mg C
for her study in Senegal. In other studies, it ranged from US$ 1 to 100 (Healey et al.,
2000; CIDA, 2001; Niles et al., 2002).There is no study on prices of carbon credits from
forests in Kenya but it can be assumed from the above findings that the price would range
from US$ 15 per Mg C based on the scenarios in Southeast Asian countries and Senegal,
assuming the same socio-economic conditions.
22
3.5 Empirical Model
An empirical model was used to achieve objective three of the study. This implies that
the determinants of the total amount of carbon sequestered per hectare such as socio-
economic characteristics, demographic characteristics, farm characteristics, number of
trees, and age of trees were estimated using a tobit model. The dependent variable in the
regression was the total amount carbon sequestered by farms per hectare. The
independent variables used were:
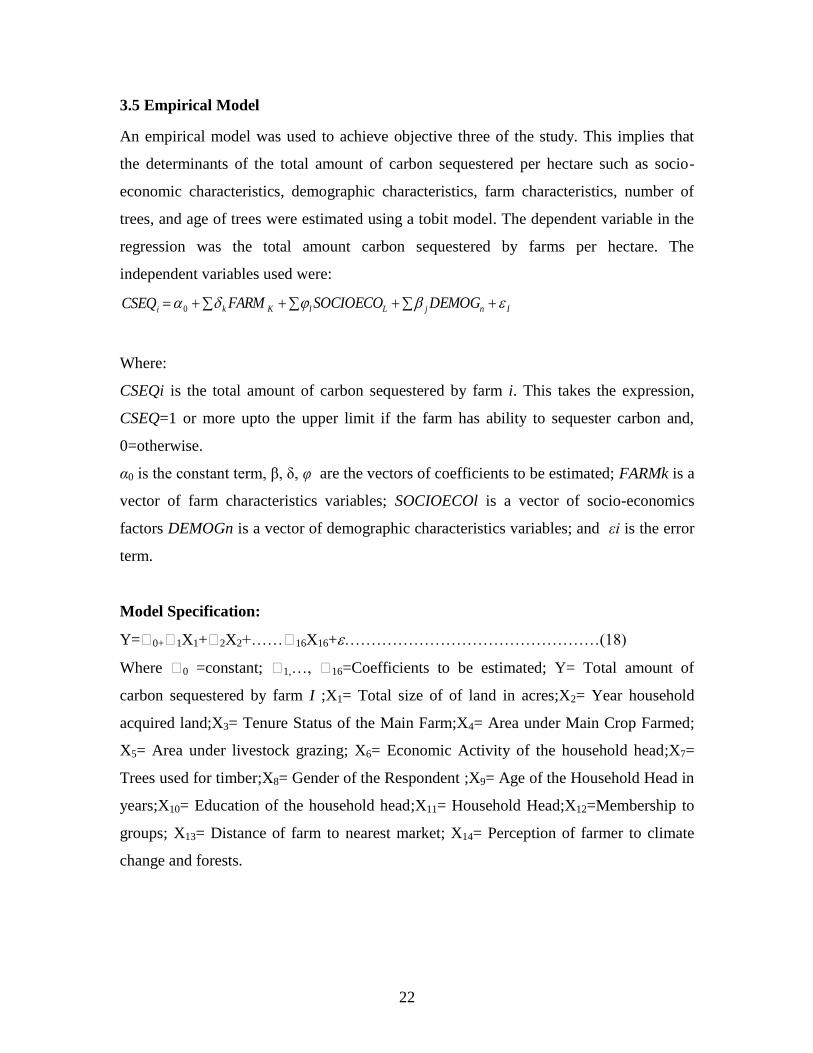
InjLlKkiDEMOGSOCIOECOFARMCSEQ 0
Where:
CSEQi is the total amount of carbon sequestered by farm i. This takes the expression,
CSEQ=1 or more upto the upper limit if the farm has ability to sequester carbon and,
0=otherwise.
α0 is the constant term, β, δ, φ are the vectors of coefficients to be estimated; FARMk is a
vector of farm characteristics variables; SOCIOECOl is a vector of socio-economics
factors DEMOGn is a vector of demographic characteristics variables; and εi is the error
term.
Model Specification:
Y=0+1X1+2X2+……16X16+…………………………………………(18)
Where 0 =constant; 1,…, 16=Coefficients to be estimated; Y= Total amount of
carbon sequestered by farm I ;X1= Total size of of land in acres;X2= Year household
acquired land;X3= Tenure Status of the Main Farm;X4= Area under Main Crop Farmed;
X5= Area under livestock grazing; X6= Economic Activity of the household head;X7=
Trees used for timber;X8= Gender of the Respondent ;X9= Age of the Household Head in
years;X10= Education of the household head;X11= Household Head;X12=Membership to
groups; X13= Distance of farm to nearest market; X14= Perception of farmer to climate
change and forests.
23
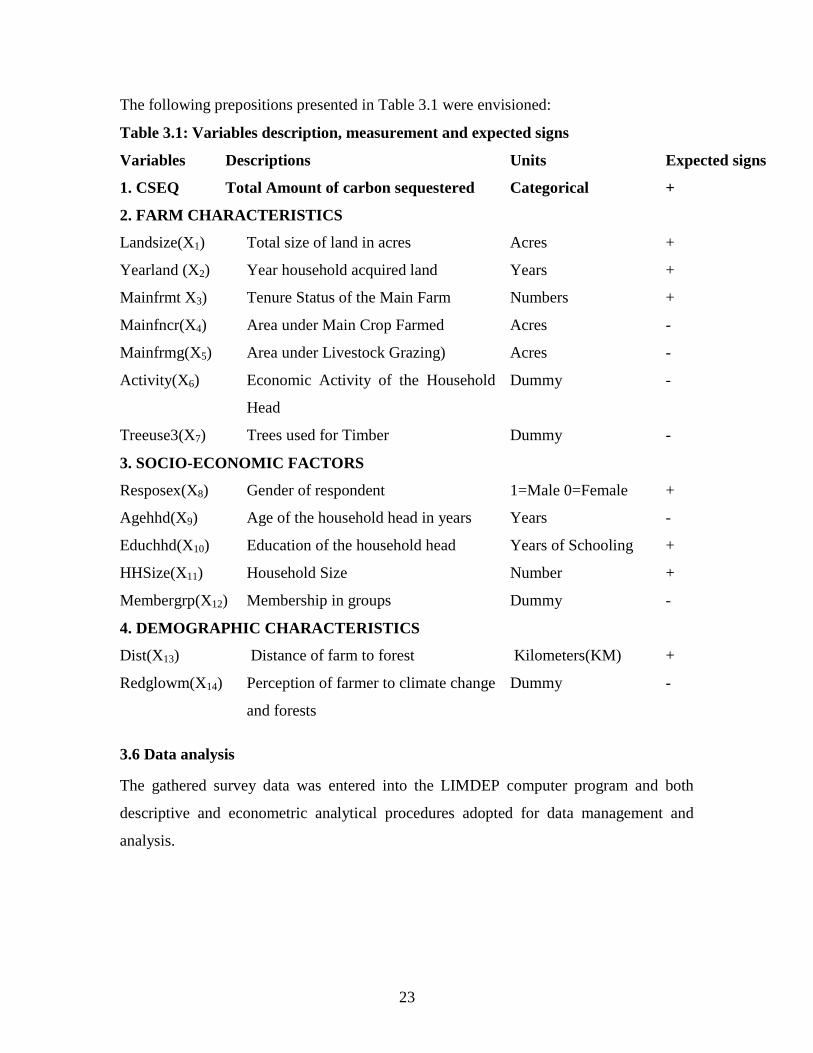
The following prepositions presented in Table 3.1 were envisioned:
Table 3.1: Variables description, measurement and expected signs
Variables Descriptions Units Expected signs
1. CSEQ Total Amount of carbon sequestered Categorical +
2. FARM CHARACTERISTICS
Landsize(X1) Total size of land in acres Acres +
Yearland (X2) Year household acquired land Years +
Mainfrmt X3) Tenure Status of the Main Farm Numbers +
Mainfncr(X4) Area under Main Crop Farmed Acres -
Mainfrmg(X5) Area under Livestock Grazing) Acres -
Activity(X6) Economic Activity of the Household
Head
Dummy -
Treeuse3(X7) Trees used for Timber Dummy -
3. SOCIO-ECONOMIC FACTORS
Resposex(X8) Gender of respondent 1=Male 0=Female +
Agehhd(X9) Age of the household head in years Years -
Educhhd(X10) Education of the household head Years of Schooling +
HHSize(X11) Household Size Number +
Membergrp(X12) Membership in groups Dummy -
4. DEMOGRAPHIC CHARACTERISTICS
Dist(X13) Distance of farm to forest Kilometers(KM) +
Redglowm(X14) Perception of farmer to climate change
and forests
Dummy -
3.6 Data analysis
The gathered survey data was entered into the LIMDEP computer program and both
descriptive and econometric analytical procedures adopted for data management and
analysis.
24
CHAPTER FOUR
RESULTS AND DISCUSSION
This chapter is divided into three sections. The first section discusses the results of the
potential and economic value of carbon sequestration for Kakamega forest as well as the
surrounding farms. The second section discusses the results of the descriptive analysis,
which includes an overview of the socio-economic characteristics of the farm households
surrounding Kakamega forest, household characteristics, and trees and climate change
issues. Section three discusses the results of the econometric estimation of determinants
of total amount of carbon sequestered per hectare.
4.1 Potential and Economic Value of Carbon Sequestration in Kakamega Forest and
Surrounding Farms
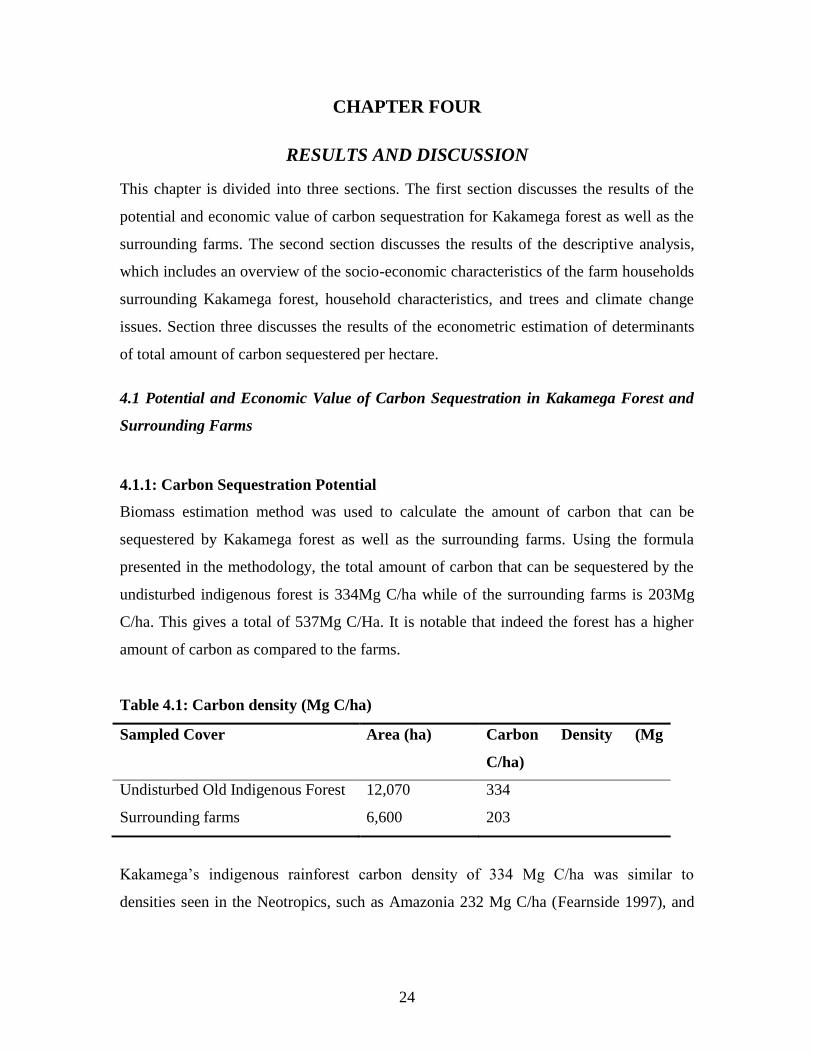
4.1.1: Carbon Sequestration Potential
Biomass estimation method was used to calculate the amount of carbon that can be
sequestered by Kakamega forest as well as the surrounding farms. Using the formula
presented in the methodology, the total amount of carbon that can be sequestered by the
undisturbed indigenous forest is 334Mg C/ha while of the surrounding farms is 203Mg
C/ha. This gives a total of 537Mg C/Ha. It is notable that indeed the forest has a higher
amount of carbon as compared to the farms.
Table 4.1: Carbon density (Mg C/ha)
Sampled Cover Area (ha) Carbon Density (Mg
C/ha)
Undisturbed Old Indigenous Forest 12,070 334
Surrounding farms 6,600 203
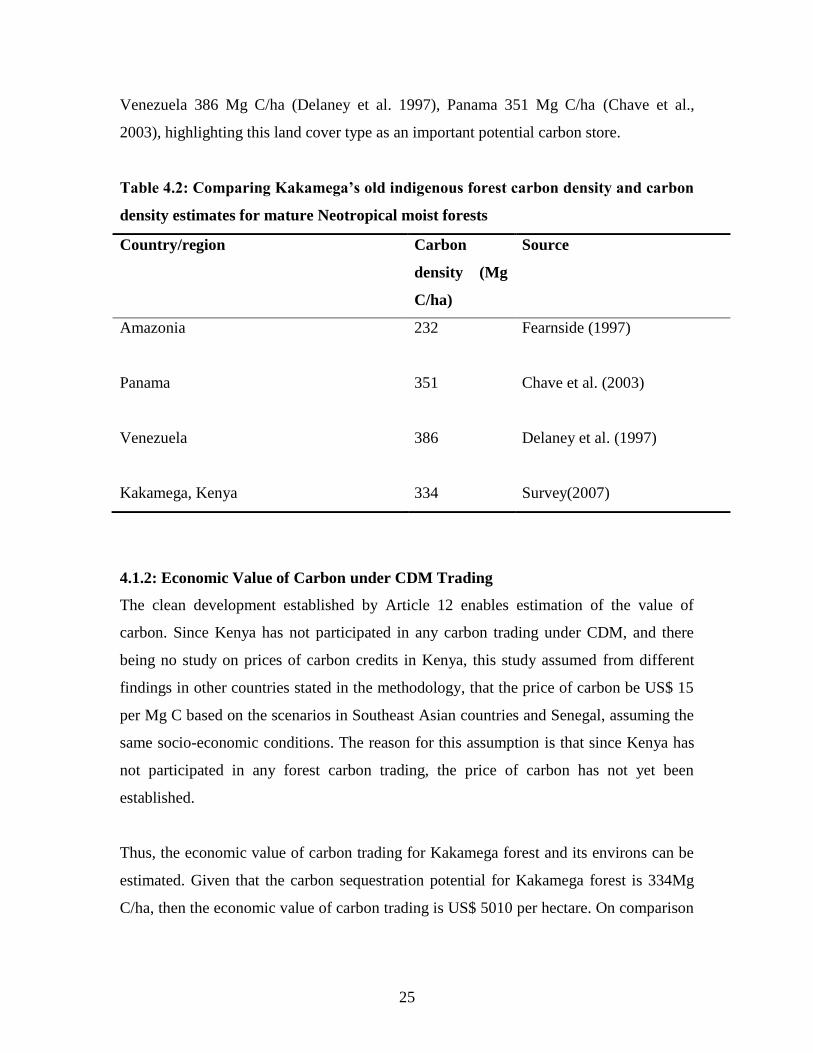
Kakamega‘s indigenous rainforest carbon density of 334 Mg C/ha was similar to
densities seen in the Neotropics, such as Amazonia 232 Mg C/ha (Fearnside 1997), and
25
Venezuela 386 Mg C/ha (Delaney et al. 1997), Panama 351 Mg C/ha (Chave et al.,
2003), highlighting this land cover type as an important potential carbon store.
Table 4.2: Comparing Kakamega’s old indigenous forest carbon density and carbon
density estimates for mature Neotropical moist forests
Country/region
Carbon
density (Mg
C/ha)
Source
Amazonia 232 Fearnside (1997)
Panama 351 Chave et al. (2003)
Venezuela 386 Delaney et al. (1997)
Kakamega, Kenya 334 Survey(2007)
4.1.2: Economic Value of Carbon under CDM Trading
The clean development established by Article 12 enables estimation of the value of
carbon. Since Kenya has not participated in any carbon trading under CDM, and there
being no study on prices of carbon credits in Kenya, this study assumed from different
findings in other countries stated in the methodology, that the price of carbon be US$ 15
per Mg C based on the scenarios in Southeast Asian countries and Senegal, assuming the
same socio-economic conditions. The reason for this assumption is that since Kenya has
not participated in any forest carbon trading, the price of carbon has not yet been
established.
Thus, the economic value of carbon trading for Kakamega forest and its environs can be
estimated. Given that the carbon sequestration potential for Kakamega forest is 334Mg
C/ha, then the economic value of carbon trading is US$ 5010 per hectare. On comparison
26
to that of the farms which is US$ 3045 per hectare, it implies that the forest has a higher
capacity to generate revenue to the country if it participated in carbon trading.
It is good to note that KENGEN is already in negotiation to participate in carbon trading
with World Bank from the carbon it emits from industrial processes. The bank will
purchase one Certified Emission Reduction (CER) at price of US$ 10.5 for Olkaria II
geothermal expansion, 13.9 US $ for Kiambere Optimisation, Redevelopment of Tana
Power station and Eburru geothermal and 12.9 US $ Kipevu Combined Cycle and Sondu
Miriu. This means that the projects will generate annual cash flow revenue to KenGen in
the range of Kshs million 500 per annum up to the year 2012. But currently there is no
price for carbon from forests.
Nevertheless, Carbon Manna Unlimited is pushing forward an ingenious pilot project that
rewards small scale farmers in Mbeere and Bungoma districts for planting trees and using
more energy efficient stoves, known locally as jikos, for cooking. To start of with, it is
giving each family involved Sh 2,200 per month. A personal carbon emission trading
offers a financial carrot to individuals or families to get them to clean up their act. The
farmers involved in the project will be allowed to emit only a specified amount of carbon
dioxide measured according to pre-agreed scale. If they cut their emissions below this
limit, the balance is calculated in monetary terms and they are paid for it. The carbon
credits payment is now in its trial stage. Carbon Manna will subsidise the purchase of the
jikos in Kenya. This project falls under CDM executed in developing countries that
cannot afford the technology required to lower carbon emissions
27
4.2 Descriptive Results
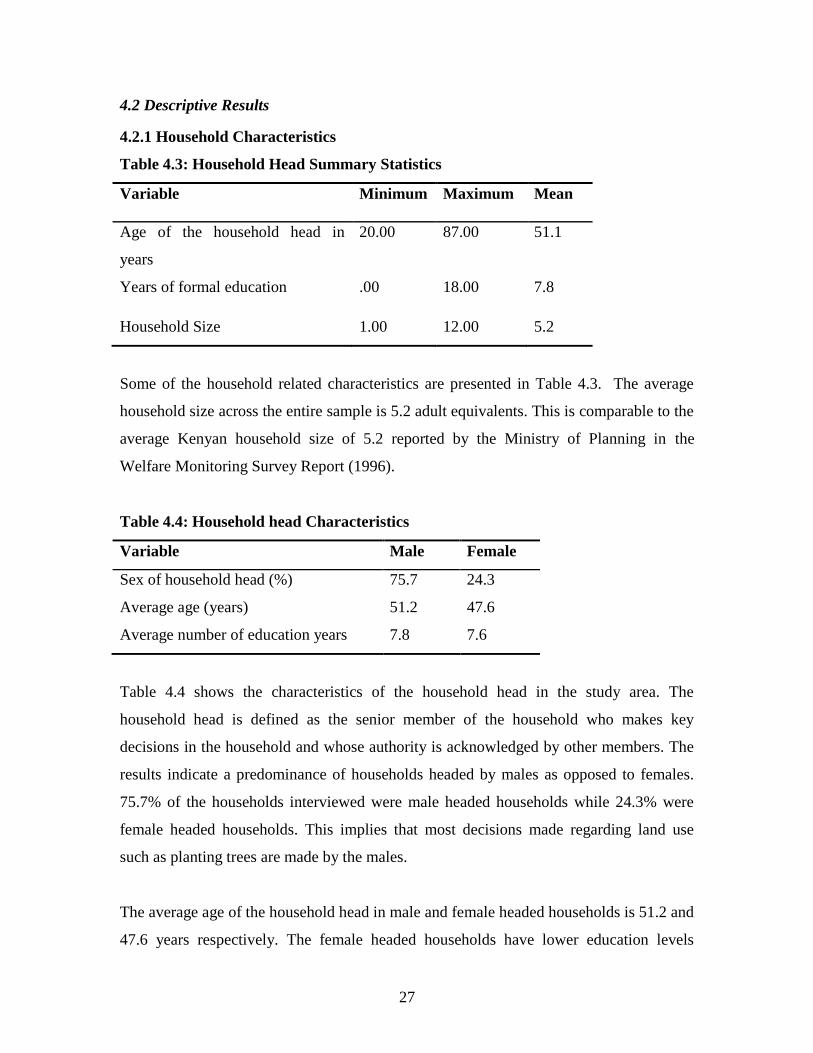
4.2.1 Household Characteristics
Table 4.3: Household Head Summary Statistics
Variable Minimum Maximum Mean
Age of the household head in
years
20.00 87.00 51.1
Years of formal education .00 18.00 7.8
Household Size 1.00 12.00 5.2
Some of the household related characteristics are presented in Table 4.3. The average
household size across the entire sample is 5.2 adult equivalents. This is comparable to the
average Kenyan household size of 5.2 reported by the Ministry of Planning in the
Welfare Monitoring Survey Report (1996).
Table 4.4: Household head Characteristics
Variable Male Female
Sex of household head (%) 75.7 24.3
Average age (years) 51.2 47.6
Average number of education years 7.8 7.6
Table 4.4 shows the characteristics of the household head in the study area. The
household head is defined as the senior member of the household who makes key
decisions in the household and whose authority is acknowledged by other members. The
results indicate a predominance of households headed by males as opposed to females.
75.7% of the households interviewed were male headed households while 24.3% were
female headed households. This implies that most decisions made regarding land use
such as planting trees are made by the males.
The average age of the household head in male and female headed households is 51.2 and
47.6 years respectively. The female headed households have lower education levels
28
compared to their male headed counterparts. Generally, women are less educated and
handle fewer employment opportunities as compared to their male counterparts. They
therefore have fewer alternative avenues for off-farm income, to meet household needs.
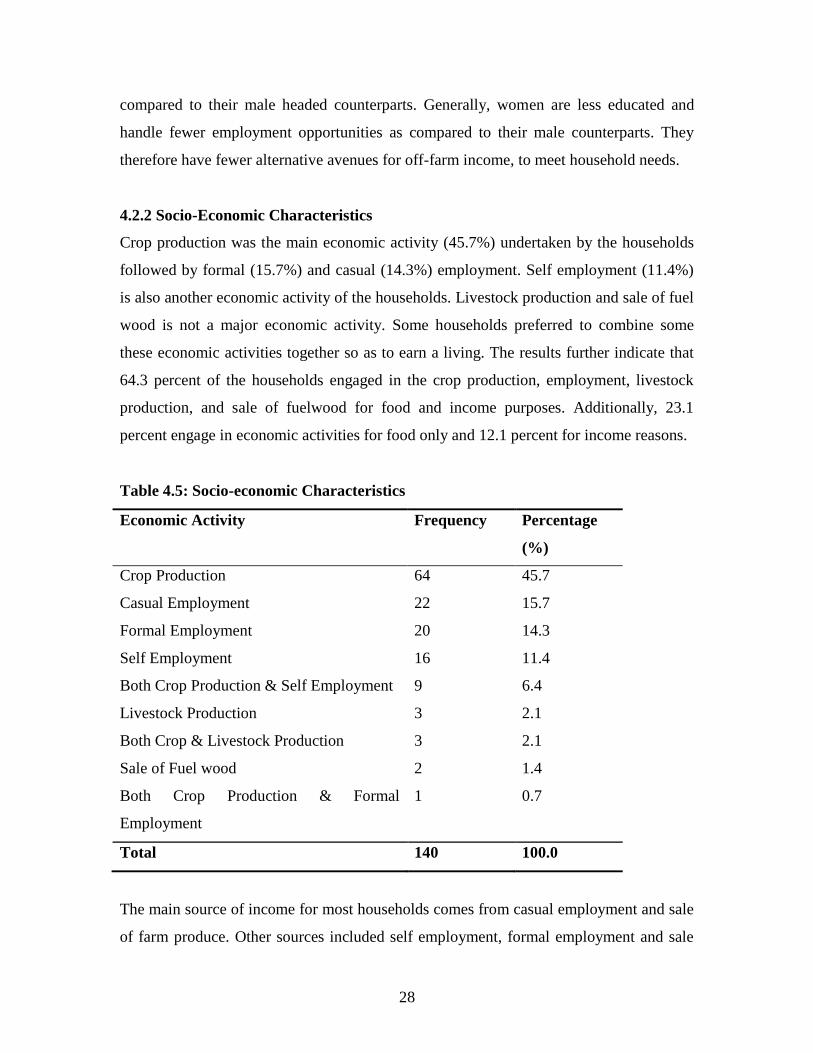
4.2.2 Socio-Economic Characteristics
Crop production was the main economic activity (45.7%) undertaken by the households
followed by formal (15.7%) and casual (14.3%) employment. Self employment (11.4%)
is also another economic activity of the households. Livestock production and sale of fuel
wood is not a major economic activity. Some households preferred to combine some
these economic activities together so as to earn a living. The results further indicate that
64.3 percent of the households engaged in the crop production, employment, livestock
production, and sale of fuelwood for food and income purposes. Additionally, 23.1
percent engage in economic activities for food only and 12.1 percent for income reasons.
Table 4.5: Socio-economic Characteristics
Economic Activity Frequency Percentage
(%)
Crop Production 64 45.7
Casual Employment 22 15.7
Formal Employment 20 14.3
Self Employment 16 11.4
Both Crop Production & Self Employment 9 6.4
Livestock Production 3 2.1
Both Crop & Livestock Production 3 2.1
Sale of Fuel wood 2 1.4
Both Crop Production & Formal
Employment
1 0.7
Total 140 100.0
The main source of income for most households comes from casual employment and sale
of farm produce. Other sources included self employment, formal employment and sale
29
of fuel wood. Further 50 percent of the land owned by the households was titled, 47.9
percent was not titled, while 2.1 percent was rented. The method of acquisition of the
land was that 86.4 percent was inherited, 12.9 percent bought and 0.7 percent was given
as gifts. This provides an overview of the type of decisions made on the farms. A person
with a piece of land that is not titled may be hesitant in doing major investments and
improvements on the farm such as tree planting as they do not have the title yet.
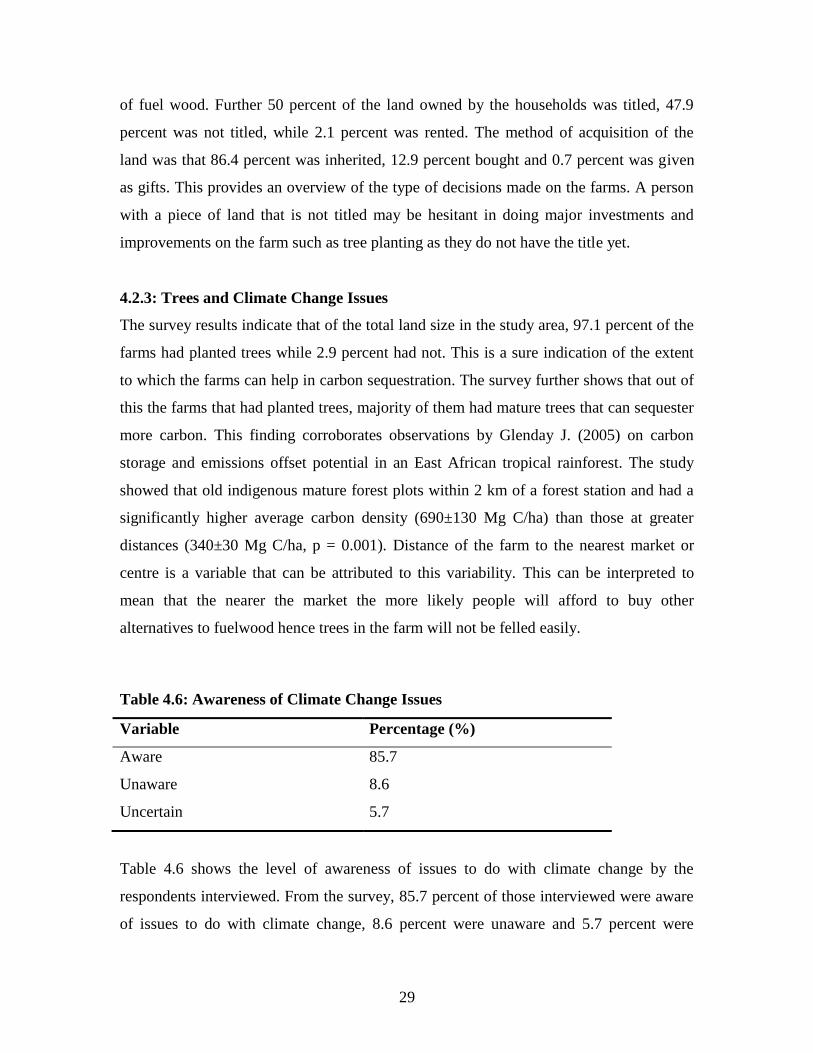
4.2.3: Trees and Climate Change Issues
The survey results indicate that of the total land size in the study area, 97.1 percent of the
farms had planted trees while 2.9 percent had not. This is a sure indication of the extent
to which the farms can help in carbon sequestration. The survey further shows that out of
this the farms that had planted trees, majority of them had mature trees that can sequester
more carbon. This finding corroborates observations by Glenday J. (2005) on carbon
storage and emissions offset potential in an East African tropical rainforest. The study
showed that old indigenous mature forest plots within 2 km of a forest station and had a
significantly higher average carbon density (690±130 Mg C/ha) than those at greater
distances (340±30 Mg C/ha, p = 0.001). Distance of the farm to the nearest market or
centre is a variable that can be attributed to this variability. This can be interpreted to
mean that the nearer the market the more likely people will afford to buy other
alternatives to fuelwood hence trees in the farm will not be felled easily.
Table 4.6: Awareness of Climate Change Issues
Variable Percentage (%)
Aware 85.7
Unaware 8.6
Uncertain 5.7
Table 4.6 shows the level of awareness of issues to do with climate change by the
respondents interviewed. From the survey, 85.7 percent of those interviewed were aware
of issues to do with climate change, 8.6 percent were unaware and 5.7 percent were
30
uncertain. This is a good indication that efforts to intensify own farm tree planting may
be successful.
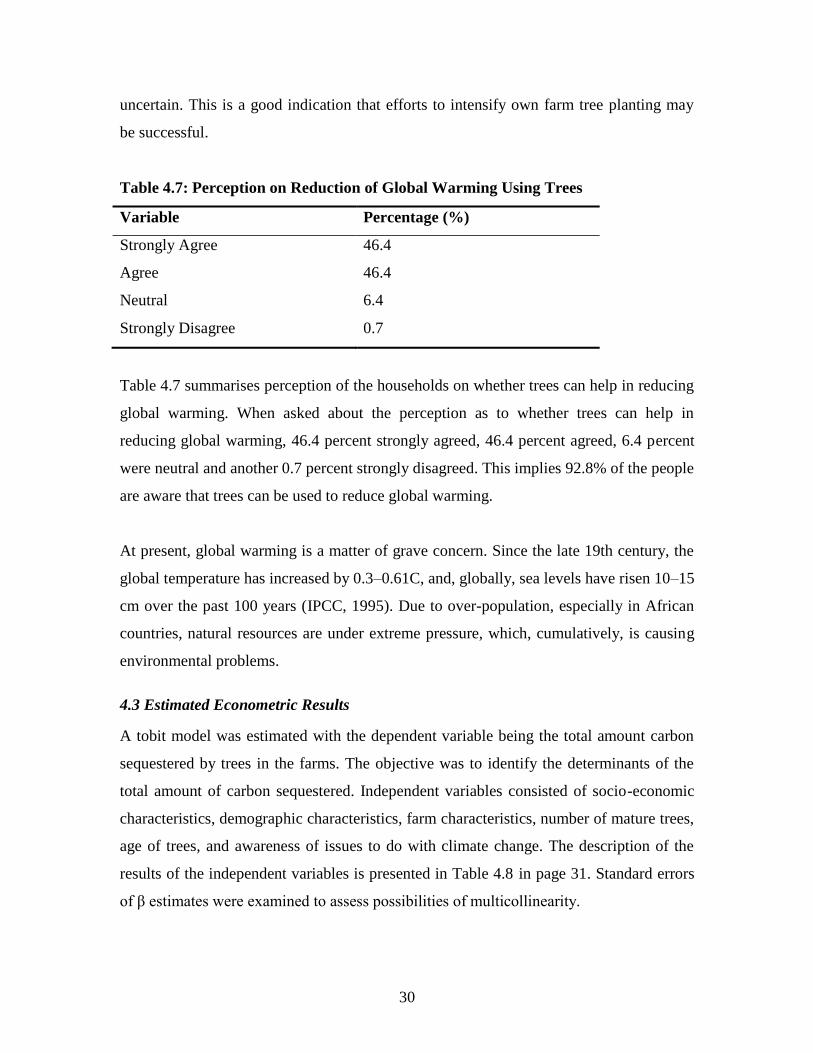
Table 4.7: Perception on Reduction of Global Warming Using Trees
Variable Percentage (%)
Strongly Agree 46.4
Agree 46.4
Neutral 6.4
Strongly Disagree 0.7
Table 4.7 summarises perception of the households on whether trees can help in reducing
global warming. When asked about the perception as to whether trees can help in
reducing global warming, 46.4 percent strongly agreed, 46.4 percent agreed, 6.4 percent
were neutral and another 0.7 percent strongly disagreed. This implies 92.8% of the people
are aware that trees can be used to reduce global warming.
At present, global warming is a matter of grave concern. Since the late 19th century, the
global temperature has increased by 0.3–0.61C, and, globally, sea levels have risen 10–15
cm over the past 100 years (IPCC, 1995). Due to over-population, especially in African
countries, natural resources are under extreme pressure, which, cumulatively, is causing
environmental problems.
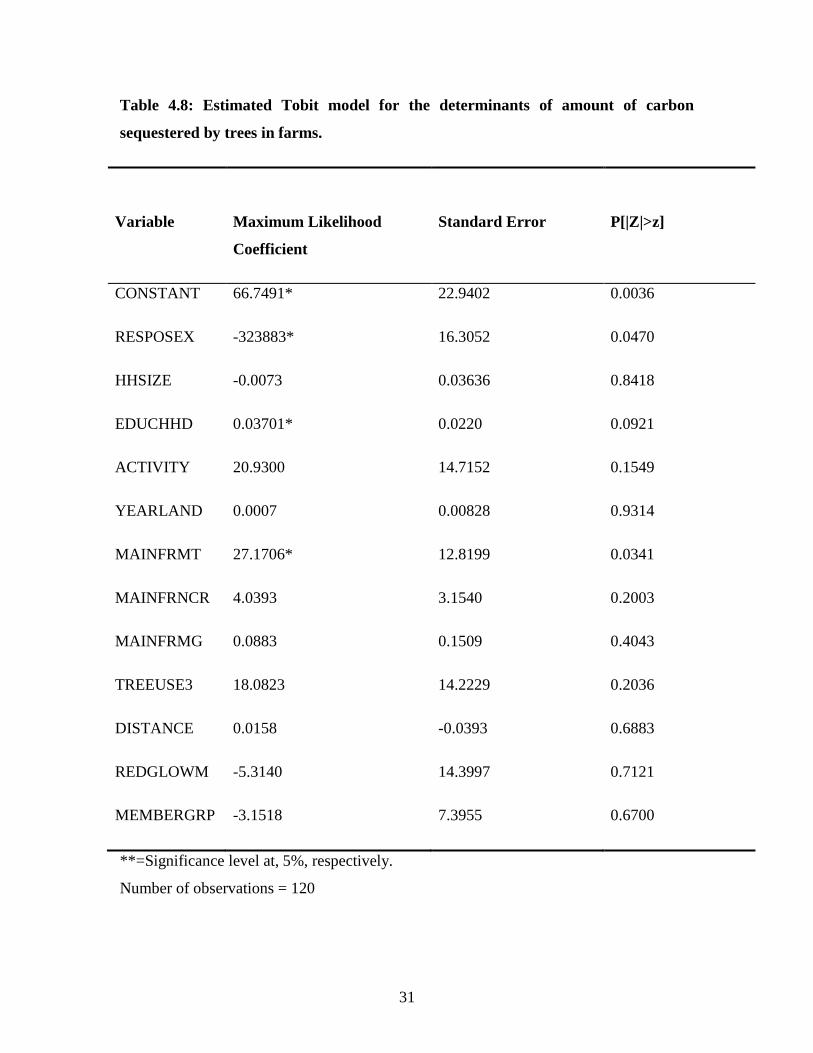
4.3 Estimated Econometric Results
A tobit model was estimated with the dependent variable being the total amount carbon
sequestered by trees in the farms. The objective was to identify the determinants of the
total amount of carbon sequestered. Independent variables consisted of socio-economic
characteristics, demographic characteristics, farm characteristics, number of mature trees,
age of trees, and awareness of issues to do with climate change. The description of the
results of the independent variables is presented in Table 4.8 in page 31. Standard errors
of β estimates were examined to assess possibilities of multicollinearity.
31
Table 4.8: Estimated Tobit model for the determinants of amount of carbon
sequestered by trees in farms.
Variable
Maximum Likelihood
Coefficient
Standard Error
P[|Z|>z]
CONSTANT 66.7491* 22.9402 0.0036
RESPOSEX -323883* 16.3052 0.0470
HHSIZE -0.0073 0.03636 0.8418
EDUCHHD 0.03701* 0.0220 0.0921
ACTIVITY 20.9300 14.7152 0.1549
YEARLAND 0.0007 0.00828 0.9314
MAINFRMT 27.1706* 12.8199 0.0341
MAINFRNCR 4.0393 3.1540 0.2003
MAINFRMG 0.0883 0.1509 0.4043
TREEUSE3 18.0823 14.2229 0.2036
DISTANCE 0.0158 -0.0393 0.6883
REDGLOWM -5.3140 14.3997 0.7121
MEMBERGRP -3.1518 7.3955 0.6700
**=Significance level at, 5%, respectively.
Number of observations = 120

32
The maximum likelihood coefficients indicate that sex of the respondent (RESPOSEX,
0.0470), education of the household head (EDUCHHD, 0.0921), and tenure status of the
farm (MAINFRMT, 0.0341), have a significant influence in determining the probability
of the amount of carbon that can be sequestered by trees in the farms. This implies that a
farm that is titled is more likely to have more trees than one which is not titled. So policy
makers should put in place measures to ensure that most farms are titled so as to
encourage people to plant more trees. Education level of the household head is also a key
determinant of the amount of carbon that can be stored by farms. Therefore people need
to be educated more on the importance of planting trees with emphasis on the ability to
sequester carbon thereby reducing global warming which in turn will help in agricultural
sector because of less impact of global warming.
The coefficient of household size (HHSIZE, -0.0053) has a negative influence on the
probability of the amount of carbon sequestered. This implies that as the household size
increases, the amount of carbon that can be sequestered by trees decreases. People tend
plant less tress as the household size increases as there are more pressures on the land
such that planting trees does not become a priority. Instead, people opt to grow crops and
keep livestock on the farms so that they can be able to cater for the needs of the large
household size. There is also the tendency to fell the trees for wood fuel by large
households.
On the other hand, the coefficients on education of the household head (EDUCHHD
0.03701), economic activity for the household (ACTIVITY, 20.9300), year household
acquired land (YEARLAND 0.0007), tenure status of the farm (MAINFRMT, 27.1706),
area under crops (MAINFNCR, 4.0393), area under livestock (MAINFRMGR, 0.0883),
trees used for timber (TREEUSE3, 18.0823) and distance to the forest (DISTANCE
0.0158) were strongly positively significant (p<0.05) in determining probability of the
amount of carbon sequestered. This positive signs were a priori expected. This implies
that trees were perceived to be of greater value by household heads that were educated.
This can be attributed to the fact that they are more knowledgeable compared to their
counterparts who are not educated. In addition, trees were perceived to be of greater
value by household heads as their age increases. Similarly, the older the land is in terms
33
of acquisition, the older the trees; hence they have matured and therefore have higher
ability to sequester more carbon. A study by Shin et al (2004) in Bangaldesh corroborates
to these findings. The study revealed a difference in carbon storage between indigenous
forest and hardwood plantation due to the age distribution within the different forest
classes: the hardwood plantation area was 70% young with low carbon, while the
indigenous forest was 89% old.
The study also indicates that households engaged in economic activities earn income and
hence plant trees in their lands because their sources of income are diverse and not only
from land use. Distance of the farm to the nearest market or centre also influences the
amount of carbon sequestered positively. This can be interpreted to mean that the nearer
the market the more likely people will afford to buy other alternatives to fuelwood hence
trees in the farm will not be felled easily.
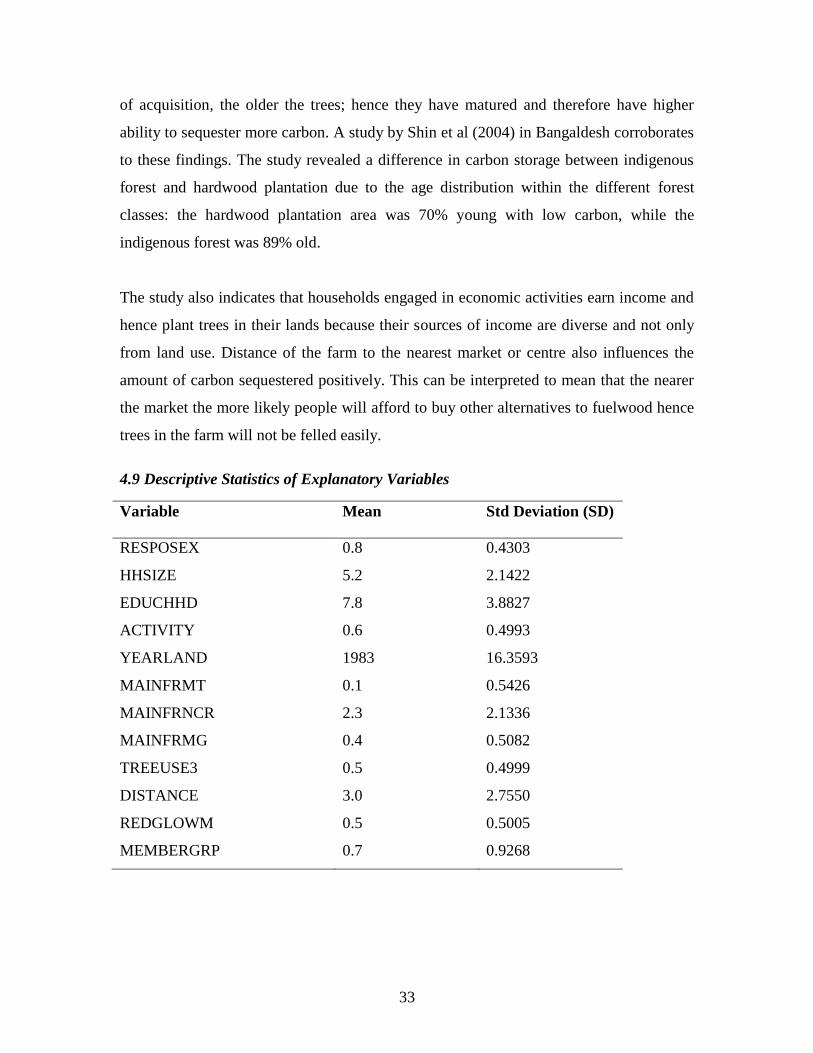
4.9 Descriptive Statistics of Explanatory Variables
Variable Mean Std Deviation (SD)
RESPOSEX 0.8 0.4303
HHSIZE 5.2 2.1422
EDUCHHD 7.8 3.8827
ACTIVITY 0.6 0.4993
YEARLAND 1983 16.3593
MAINFRMT 0.1 0.5426
MAINFRNCR 2.3 2.1336
MAINFRMG 0.4 0.5082
TREEUSE3 0.5 0.4999
DISTANCE 3.0 2.7550
REDGLOWM 0.5 0.5005
MEMBERGRP 0.7 0.9268
34
CHAPTER FIVE
CONCLUSION AND RECOMMENDATIONS
5.1 Summary
The East African indigenous rainforest found in Kakamega supports high levels of
biodiversity and provides sundry ecosystem services to Western Kenya. In addition, as a
high carbon density land cover type, it can provide a global service as carbon store
helping to mitigate climate change. While past human disturbances have reduced forest
areas and depressed forest carbon densities, the results of this study illustrate the potential
economic value of carbon storage in the Kakamega National Forest economically.
The study shows that Kakamega forest makes a significant contribution to carbon
sequestration and therefore can generate carbon credits in Kenya. It is also expected that
much revenue can be earned by selling carbon credits in the carbon market through CDM
projects. Forestry lands, used under the CDM, would provide benefits to the national
forestry sector, as well as the private owners and participants in the community forestry,
in terms of an overall increase in income, and self-sufficiency.
5.2 Policy Implications
Appropriate economic institutions and mechanisms need to be established for the CDM
to result in equity and sustainable development. The effects of global warming in Kenya,
show serious consequences on the economy. The quantification of carbon sequestration,
by this study, can direct policymakers, researchers, and administrators in bargaining for
the price of international greenhouse gas reduction, which can advance the economic,
social and environmental development of Kenya. The study may also be useful to
possible investors in CDM projects in Kenya. Another important aspect of this study is
that it also possible to use the farms to sequester carbon from the atmosphere by
practicing agroforestry, as this has proved to be a vital way carbon sequestration. Policy
makers should put in place measures to ensure that most farms are titled so as to
encourage people to plant more trees. Education level of the household head is also a key
35
determinant of the amount of carbon that can be stored by farms. Therefore people need
to be educated more on the importance of planting trees with emphasis on the ability to
sequester carbon thereby reducing global warming which in turn will help in agricultural
sector because of less impact of global warming.
5.3 Recommendations
Based on the results of the work carried out, several recommendations have been made.
1) Research should be undertaken to collect data on the quantity, distribution and
partitioning of carbon, and any changes taking place over time in the different
sections of the forest such as indigenous and the disturbed forest, as well as the
planted trees by farmers.
2) Community involvement and analysis of other options such as agroforestry by
farms to help increase carbon storage by trees and other plants needs to be
researched on extensively.
3) A strong long-term political commitment by the government to prevent logging,
deforestation, to manage and protect the remaining natural forests (natural
production forests and protected areas) is required as a high priority.
4) The problem of market for carbon and finding a buyer should be addressed
extensively.
5) Research on how to develop formulae for the cost of Mg of Carbon in Kenya.
6) The local community should be discouraged from destroying the natural
indigenous Tropical forests.
36
REFERENCES
Adams, M. R; Adams D. M; Callaway J. M; Chang C; and McCarl B. A; (1993):
―Sequestering carbon on agricultural land: Social cost and impacts on timber
markets, Contemporary Policy Issues 11, 76-87.‖
Allen, R.B; Plat, K.H; and Wiser S.K; (1995): ―Biodiversity in New Zealand plantations.
New Zealand Forestry 39(4): 26-29.‖
Althof, A; Fischer, E; Killmann, D; and Mwachala, G; (2003): ―Influence of natural
and anthropogenic fragmentation on diversity of flora and vegetation in upland
and montane rainforests of East Africa.‖ In Sustainable use and conservation of
biological diversity -Symposium Report: Part A, pp. 108−109, Berlin.
Bass, S; Dubois, O; Moura Costa, P; Pinard, M; Tipper, R; and Wilson, C; (2000): ―Rural
livelihoods and carbon management.‖ International Institute for Environment and
Development Natural Resource Issues, Paper No. 1, IIED, London.
Brand D; (1998): ―Opportunities generated by the Kyoto Protocol in the forest sector.‖
Commonwealth Forestry Review 77:164-169.
Brown S; and Burnham M; (2000): ―Issues and challenges for forest-based carbon-offset
projects: A case study of the Noel Kempff climate action project in Bolivia.
Mitigation and Adaptation Strategies for Climate Change‖ 5:99-121.
Brown, S; (1998): ―Present and Future Role of Forests in Global Climate Change.‖
Ecology Today: An Anthology of Contemporary Ecological Research. B. Goapl,
P.S. Pathak, and K.G. Saxena, eds., pp. 59-74. New Delhi.
Brown, S; Sathaye J; Cannell M; and Kauppi P; (1996): ―Management of Forests For
Mitigation of Greenhouse Gas Emissions. In R. T.Watson, M.C. Zinyowera, and
R.H. Moss (eds.)‖, Climate Change 1995: Impacts, Adaptations and Mitigation of
Climate Change: Scientific-Technical Analyses. ―Contribution of Working Group
II to the Second Assessment Report of the IPCC, Cambridge University Press,
Cambridge and New York, Chapter 24.‖
Brown, S; and Gaston G; (1995): ―Use of forest inventories and geographic information
systems to estimate biomass density of tropical forests: Application to tropical
Africa. Environmental Monitoring Assessment‖ 38, 157–168.
Brown, S; Gillespie, A. J. R; and Lugo, A. E; (1989): ―Biomass Estimation Methods For
37
Tropical Forests With Applications To Forest Inventory Data.‖ Forest Science 35,
881–902.
Bruce J. P; Lee H; and Haites E. F; (1996): ‗‗Climate Change 1995: Economic and
Social Dimensions of Climate Change,‘‘ Contribution of Working Group III to
the Second Assessment Report of the Intergovernmental Panel on Climate
Change, Cambridge Univ. Press, New York.
Callaway J. M; and McCarl B; (1996): ―The economic consequences of substituting
carbon payments for crop subsidies in U.S. agriculture.‖ Environmental Resource
Economics 7, 15-43.
Cincotta, R. P; Wisnewski, J; & Engelman, R; (2001): ―Human population in the
biodiversity hotspots.‖ Nature 404, 990−992.
CIDA (Canadian Institute of Development Agency); (2001): ―Tropical Forests and
Climate Change. CIDA, Quebec.‖ Online publication: http://www.rcfacfan.org
Chomitz, K.M; (2000): ―The Performance and Duration Issue in Carbon Offsets Based on
Sequestration.‖ World Bank Development Research Group 20.
Dixon R.K; (1997): ―Silvicultural Options to Conserve and Sequester Carbon in Forest
Systems: Preliminary Economic Assessment.‖ Critical Reviews in Environmental
Science and Technology 27 (Special): 139-149.
Evans, J; (1990): Plantation Forestry in the Tropics. Clarendon Press, Oxford.
(IPCC). 2000. Special Report on Emissions Scenarios. Cambridge: Cambridge
University Press. 570.
Fung, H.J; and Kling, C.L; (1994): Carbon: ―The Next Big Cash Crop?‖ Choices Second
Quarter: 16-19.
Glenday J; (2005): ―Carbon Storage and Emissions Offset Potential in an East African
Tropical Rainforest.‖ Forest Ecology and Management 235.
Gurajarati.D.N; (2004): ―Basic Econometrics, 4th Edition.” McGraw-Hill.
Guthiga, P; and Mburu, J; (2006): ―Local Communities Incentives for Forest
Conservation: Case of Kakamega Forest in Kenya. Paper presented at 11th
Biannual Conference of International Association for the Study of Common
Property (IASCP).‖
Healey, J.R; Price, C; Tay, J; (2000): ―The Cost of Carbon Retention by Reduced Impact
38
Logging.‖ Forest Ecology and Management 139, 237–255.
Hedger, M.M; (998): ―Making Kyoto work-the complex agenda on forestry.‖
Commonwealth Forestry Review 77:172-180.
Houghton, A; (1991): ―Tropical Deforestation and Atmospheric Carbon Dioxide‖
Climatic Change 19, 99-118 1991.
IPCC (2001): ―Climate Change‖ Impacts, Adaptation, and Vulnerability.
Cambridge University Press. Climate Change (2001)
IPCC (2000): ―IPCC Special Report- Methodological and Technological Issues in
Technology Transfer: Summary for Policy Makers, WMO and UNEP.‖
Kanowski, P. J; Savill P.S; Adlard P. G; Burley, J; Evans, J. R; Palmer R; and
Wood, P. J; (1992): ―Plantation Forestry. In: N. P. Sharma‖ Managing the
World's Forests. Kendall/Hunt, pp. 375-402.
Kauppi, P; and Sedjo, R; (2001): ―Technological and Economic Potential of Options to
Enhance, Maintain, and Manage Biological Carbon Reservoirs and Geo-
engineering. In: Metz, B; (Eds.‖ Climate Change 2001: Mitigation. IPCC,
Cambridge University Press, New York, Chapter 4, pp. 303–353.
KIFCON (1994): ―Kakamega Forest – The offical guide.” Kenya Indigenous Forest
Conservation Programme, Nairobi, Kenya.
Kirschbaum, M.U.F; (2001): ―The Role of Forests in the Global Carbon Cycle.‖ In:
Raison, R. J; Brown, A. G; and Flinn, D. W; (2001), Criteria and Indicators for
Sustainable Forest Management, 19. CAB International, Wallingford, pp. 311–
339.
Kokwaro J.O; (1988): ―Conservation Status of the Kakamega Forest in Kenya: The
Easternmost Relic of the Equatorial Rain Forests of Africa. Monogram System
Botany Missouri‘ Botanical Garden 25: 471–489.
Kurukulasuriya, P; and S. Rosenthal; (2003): ‗‗Climate Change and Agriculture: A
Review of Impacts and Adaptations.‘‘ Climate Change Series 91. Environment
Department Papers, World Bank, Washington, D.C.
Kyoto Protocol; (1997): ‗Potential relevance for US forests.‘ Journal of Forestry 98:6-11
Lugo, A. E; Parrotta, J. A; and Brown, S; (1993): ―Loss in Species Caused by Tropical
Deforestation and Their Recovery Through Management.‖ Ambio 22: 106-109.
39
MacDicken, K.G; (1997): ―A Guide to Monitoring Carbon Storage in Forestry and
Agroforestry Projects.‖ Winrock International Institute for Agricultural
Development, Arlington.
Manne, A; and Richels, R; (2001): ―An Alternative Approach to Establishing Trade-offs
Among Greenhouse Gases.‖ Nature. 410: 675-677.
Marland, G; and Marland, S; (1992): ―Should We Store Carbon in Trees?‖ Water, Air
and Soil Pollution 64: 181-195.
Mendelsohn, R; and Williams, L; (2004): ‗‗Comparing Forecasts of the Global Impacts
of Climate Change.‘‘ Mitigation and Adaptation Strategies for Global Change
9(4):315–33.
Missfeldt, F; Haites, E; (2002): ―The Potential Contribution of sinks to meeting Kyoto
Protocol commitments.‖ Environmental Science and Policy 4: 269–292.
Ministry of Planning and National Development; (1996): ―Welfare Monitoring Survey II,
1994 Basic Report,‖ pp. 1-341. Government Printers, Nairobi.
Mitchell N; (2004): ―The Exploitation and Disturbance History of Kakamega Forest,
Western Kenya.‖ In: Bleher B. and Dalitz H. (eds), BIOTA Report No. 1.
Bielefelder O¨ kologische Beitra¨ ge 20.
Myers, N; (1996): ―Deforestation Rates in Tropical Forest and their Climatic
Implications, Friends of the Earth, London.‖
Nachmias, C.F; and Nachmias, D; (2002): Research Methods in the Social Sciences
(5th Ed.). Arnold, London.
Niles, J. O; Brown, S; Pretty, J; Ball, A. S; Fay, J; (2002): ―Potential Carbon Mitigation
and Income in Developing Countries From Changes in Use and Management of
Agricultural and Forest Lands.‖ Philosophical Transactions of the Royal Society
of London A 10 (1098).
Nordhaus, W; and Boyer J; (2000): ―Warming the World: Economic Models of Global
Warming.” Cambridge, MA: MIT Press.
Oyugi J.O; (1996): ―Kakamega Forest is Dying.‖ East African National Historical
Society Bullettin, 26: 47–49.
Parks J. P and Hardie I. W, (1995): ―Least-Cost Forest Carbon Reserves: Cost-effective
40
Subsidies to Convert Marginal Agricultural Land to Forests,‖ Land Economics.
71, 122-136.
Phat, N. K; Knorr, W; and Kim, S; (2004): ―Appropriate Measures for Conservation of
Terrestrial Carbon Stocks—Analysis of Trends of Forest Management in
Southeast Asia.‖ Forest Ecology and Management 191, 283–299.
Richards K. R; and Stokes C; (1995): ‗‗Regional Studies of Carbon Sequestration: A
Review and Critique,‘ Mimeo, Pacific Northwest Laboratory, Washington, DC.
Richards K. R, Moulton J. R, and Birdsey R. A (1993): ―Costs of Creating Carbon Sinks
in the U.S.‖ Energy Conservation Management 34, 905-912.
Schimmel, D; and Enting I.G; (1995): ―Carbon Dioxide and the Carbon cycle.‖ In
Houghton, J. T; Meira, S; Filho L.G; (eds) Climate Change 1994: Radiative
Forcing of Climate Change and an Evaluation of the IPCC IS92 Emission
Scenarios, Published for the IPCC, Cambridge University Press, pp. 35-71
Shin M.Y; Miah, D; and Kyeong H. K; (2004): ―Potential Contribution of the Forestry
Sector in Bangladesh to Carbon Sequestration.‖ Environmental Management 82
(2007) 260–276
Smith, J; (2002): ―Afforestation and Reforestation in the Clean Development Mechanism
of the Kyoto Protocol: Implications for Forests and Forest People.‖ International
Journal of Global Environmental Issues 2, 3, & 4, 322–343.
Sohngen, B; and Mendelsohn, R; (2003): ―An Optimal Control Model of Forest Carbon
Sequestration‖ American Journal of Agricultural Economics. 85(2): 448-457.
Stavins, N. R; (1999): The Costs of Carbon Sequestration: A Revealed-Preference
Approach, American Economic Review 89.
Tattersfield, P; Seddon, M. B; and Lange, C. N; (2001): ―Land-Snail Faunas in
Indigenous Rainforest and Commercial Forestry Plantations in Kakamega Forest,
Western Kenya.‖ Biodiversity and Conservation 10, 1809−1829.
Tol, R; (2002): ‗‗Estimates of the Damage Costs of Climate Change. Part 1: Benchmark
Estimates.‘‘ Environmental and Resource Economics 21: 47–73.
Tschakert, P; (2002): ―Linking Global Climate Change with Local Fertility Management:
41
Results From a Carbon Sequestration Pilot Project in Senegal.‖ In: Paper
Presented at the International Workshop on Quantifying Terrestrial Carbon Sinks:
Science, Technology, and Policy, Wengen, Switzerland, 25–27 September 2002.
Tsingalia, M. H; (1990): ―Animals and the Regeneration of an African Rainforest Tree.
Ph.D. Thesis, University of California, Berkely.‖
Watson, R. T; Noble I. R; Bolin, B; Ravindranath, N. H; Verardo, D. J; and Dokken, D.
J; (2000): Land Use, Land-Use Change, and Forestry. Cambridge, UK:
Cambridge University Press.
WB (The World Bank); (1998): ―Greenhouse Gas Assessment Handbook—a Practical
Guidance Document for the Assessment of Project-level Greenhouse Gas
Emissions. Paper No. 064.‖ World Bank (168).
Zhang, Q; and Justice, C.O; (2001): ―Carbon Emissions and Sequestration Potential of
Central African Ecosystems.‖ Ambio 30 (6), 351–355.
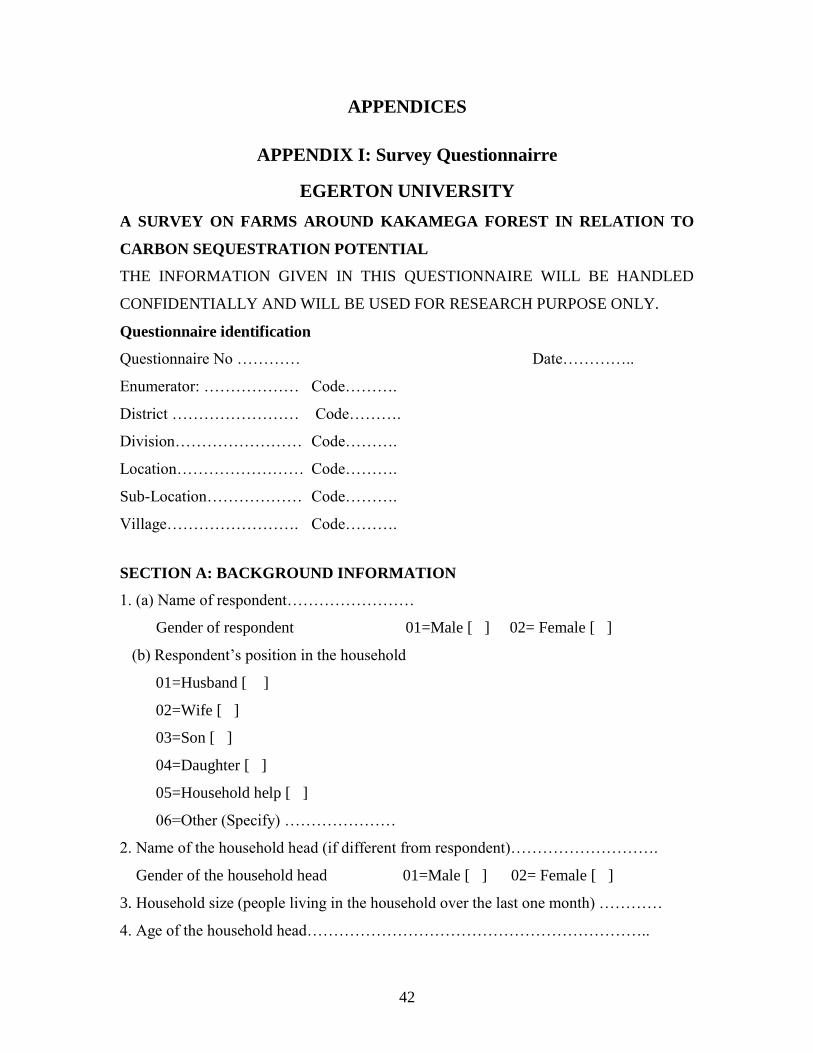
42
APPENDICES
APPENDIX I: Survey Questionnairre
EGERTON UNIVERSITY
A SURVEY ON FARMS AROUND KAKAMEGA FOREST IN RELATION TO
CARBON SEQUESTRATION POTENTIAL
THE INFORMATION GIVEN IN THIS QUESTIONNAIRE WILL BE HANDLED
CONFIDENTIALLY AND WILL BE USED FOR RESEARCH PURPOSE ONLY.
Questionnaire identification
Questionnaire No ………… Date…………..
Enumerator: ……………… Code……….
District …………………… Code……….
Division…………………… Code……….
Location…………………… Code……….
Sub-Location……………… Code……….
Village……………………. Code……….
SECTION A: BACKGROUND INFORMATION
1. (a) Name of respondent……………………
Gender of respondent 01=Male [ ] 02= Female [ ]
(b) Respondent‘s position in the household
01=Husband [ ]
02=Wife [ ]
03=Son [ ]
04=Daughter [ ]
05=Household help [ ]
06=Other (Specify) …………………
2. Name of the household head (if different from respondent)……………………….
Gender of the household head 01=Male [ ] 02= Female [ ]
3. Household size (people living in the household over the last one month) …………
4. Age of the household head………………………………………………………..
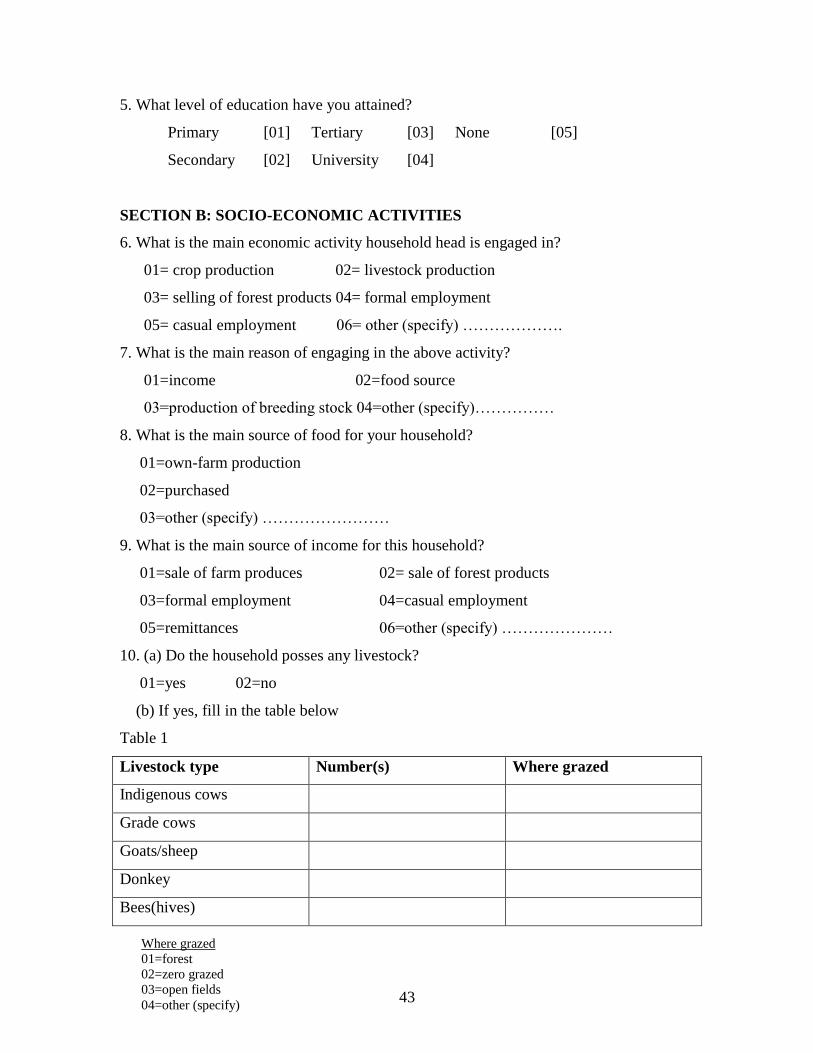
43
5. What level of education have you attained?
Primary [01] Tertiary [03] None [05]
Secondary [02] University [04]
SECTION B: SOCIO-ECONOMIC ACTIVITIES
6. What is the main economic activity household head is engaged in?
01= crop production 02= livestock production
03= selling of forest products 04= formal employment
05= casual employment 06= other (specify) ……………….
7. What is the main reason of engaging in the above activity?
01=income 02=food source
03=production of breeding stock 04=other (specify)……………
8. What is the main source of food for your household?
01=own-farm production
02=purchased
03=other (specify) ……………………
9. What is the main source of income for this household?
01=sale of farm produces 02= sale of forest products
03=formal employment 04=casual employment
05=remittances 06=other (specify) …………………
10. (a) Do the household posses any livestock?
01=yes 02=no
(b) If yes, fill in the table below
Table 1
Livestock type Number(s) Where grazed
Indigenous cows
Grade cows
Goats/sheep
Donkey
Bees(hives)
Where grazed
01=forest
02=zero grazed
03=open fields
04=other (specify)
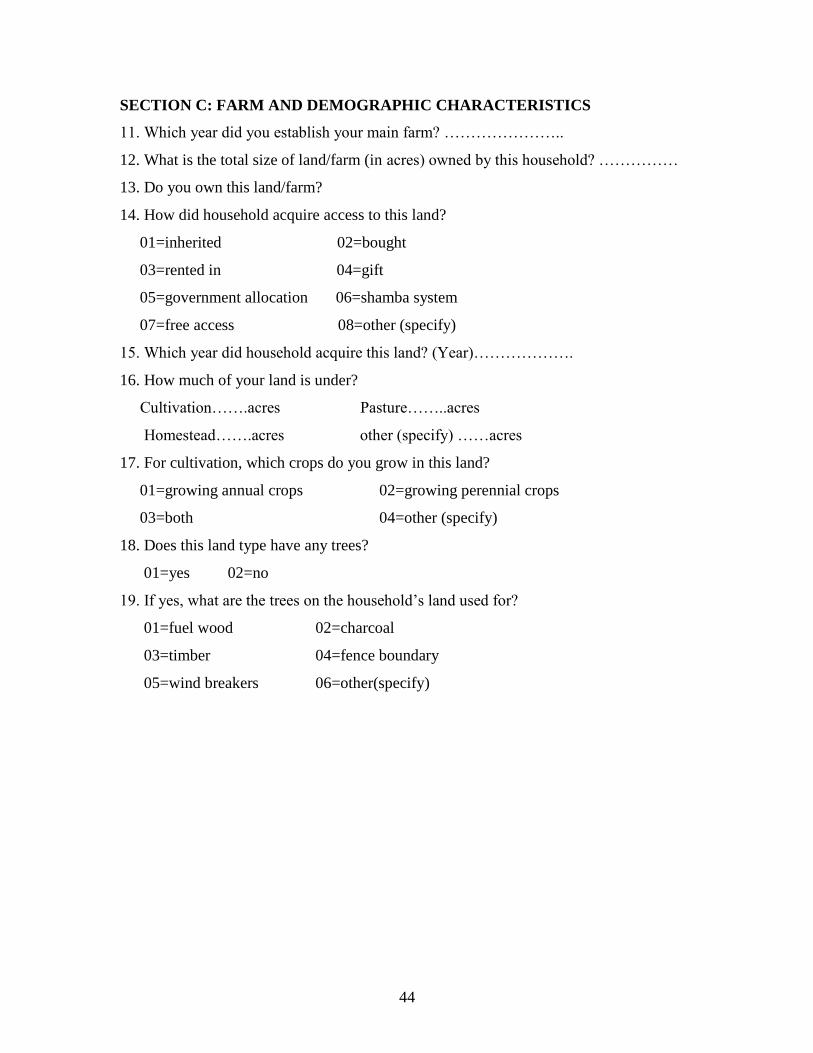
44
SECTION C: FARM AND DEMOGRAPHIC CHARACTERISTICS
11. Which year did you establish your main farm? …………………..
12. What is the total size of land/farm (in acres) owned by this household? ……………
13. Do you own this land/farm?
14. How did household acquire access to this land?
01=inherited 02=bought
03=rented in 04=gift
05=government allocation 06=shamba system
07=free access 08=other (specify)
15. Which year did household acquire this land? (Year)……………….
16. How much of your land is under?
Cultivation…….acres Pasture……..acres
Homestead…….acres other (specify) ……acres
17. For cultivation, which crops do you grow in this land?
01=growing annual crops 02=growing perennial crops
03=both 04=other (specify)
18. Does this land type have any trees?
01=yes 02=no
19. If yes, what are the trees on the household‘s land used for?
01=fuel wood 02=charcoal
03=timber 04=fence boundary
05=wind breakers 06=other(specify)
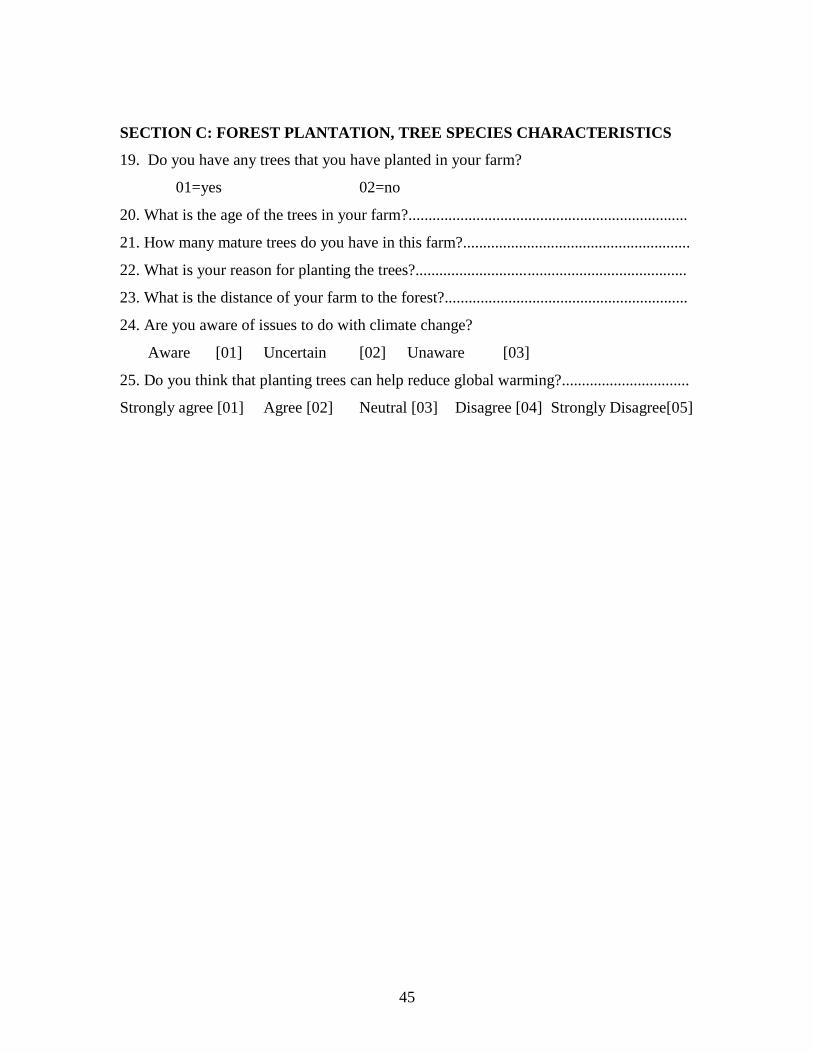
45
SECTION C: FOREST PLANTATION, TREE SPECIES CHARACTERISTICS
19. Do you have any trees that you have planted in your farm?
01=yes 02=no
20. What is the age of the trees in your farm?......................................................................
21. How many mature trees do you have in this farm?.........................................................
22. What is your reason for planting the trees?....................................................................
23. What is the distance of your farm to the forest?.............................................................
24. Are you aware of issues to do with climate change?
Aware [01] Uncertain [02] Unaware [03]
25. Do you think that planting trees can help reduce global warming?................................
Strongly agree [01] Agree [02] Neutral [03] Disagree [04] Strongly Disagree[05]
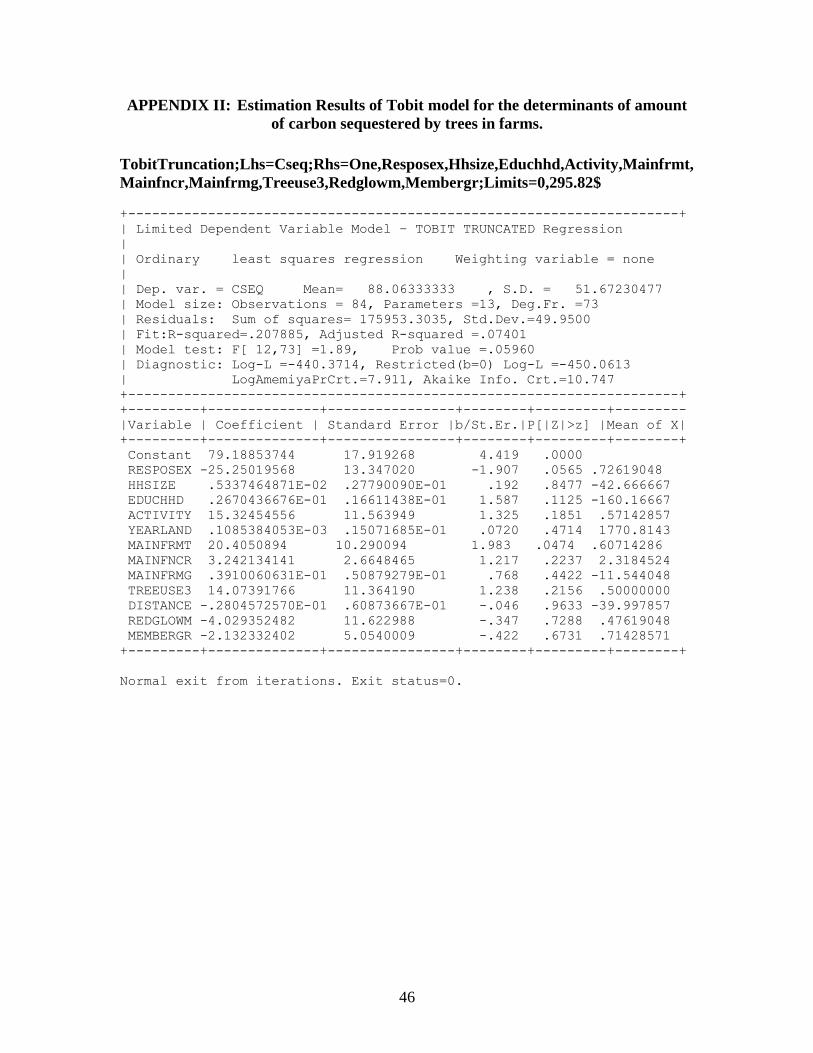
46
APPENDIX II: Estimation Results of Tobit model for the determinants of amount
of carbon sequestered by trees in farms.
TobitTruncation;Lhs=Cseq;Rhs=One,Resposex,Hhsize,Educhhd,Activity,Mainfrmt,
Mainfncr,Mainfrmg,Treeuse3,Redglowm,Membergr;Limits=0,295.82$
+---------------------------------------------------------------------+
| Limited Dependent Variable Model – TOBIT TRUNCATED Regression
|
| Ordinary least squares regression Weighting variable = none
|
| Dep. var. = CSEQ Mean= 88.06333333 , S.D. = 51.67230477
| Model size: Observations = 84, Parameters =13, Deg.Fr. =73
| Residuals: Sum of squares= 175953.3035, Std.Dev.=49.9500
| Fit:R-squared=.207885, Adjusted R-squared =.07401
| Model test: F[ 12,73] =1.89, Prob value =.05960
| Diagnostic: Log-L =-440.3714, Restricted(b=0) Log-L =-450.0613
| LogAmemiyaPrCrt.=7.911, Akaike Info. Crt.=10.747
+---------------------------------------------------------------------+
+---------+--------------+----------------+--------+---------+---------
|Variable | Coefficient | Standard Error |b/St.Er.|P[|Z|>z] |Mean of X|
+---------+--------------+----------------+--------+---------+--------+
Constant 79.18853744 17.919268 4.419 .0000
RESPOSEX -25.25019568 13.347020 -1.907 .0565 .72619048
HHSIZE .5337464871E-02 .27790090E-01 .192 .8477 -42.666667
EDUCHHD .2670436676E-01 .16611438E-01 1.587 .1125 -160.16667
ACTIVITY 15.32454556 11.563949 1.325 .1851 .57142857
YEARLAND .1085384053E-03 .15071685E-01 .0720 .4714 1770.8143
MAINFRMT 20.4050894 10.290094 1.983 .0474 .60714286
MAINFNCR 3.242134141 2.6648465 1.217 .2237 2.3184524
MAINFRMG .3910060631E-01 .50879279E-01 .768 .4422 -11.544048
TREEUSE3 14.07391766 11.364190 1.238 .2156 .50000000
DISTANCE -.2804572570E-01 .60873667E-01 -.046 .9633 -39.997857
REDGLOWM -4.029352482 11.622988 -.347 .7288 .47619048
MEMBERGR -2.132332402 5.0540009 -.422 .6731 .71428571
+---------+--------------+----------------+--------+---------+--------+
Normal exit from iterations. Exit status=0.

47
+---------------------------------------------+
| Limited Dependent Variable Model - TRUNCATE |
| Maximum Likelihood Estimates |
| Dependent variable CSEQ |
| Weighting variable ONE |
| Number of observations 120 |
| Iterations completed 5 |
| Log likelihood function -434.6539 |
| Threshold values for the model: |
| Lower= .0000 Upper=295.8200 |
| Observations after truncation 84 |
+---------------------------------------------+
+---------+--------------+----------------+--------+---------+--------+
|Variable | Coefficient | Standard Error |b/St.Er.|P[|Z|>z] |Mean of X|
+---------+--------------+----------------+--------+---------+--------+
Primary Index Equation for Model
Constant 66.74911280 22.940202 2.910 .0036
RESPOSEX -32.38835336 16.305214 -1.986 .0470 .72619048
HHSIZE .7256284082E-01 .36362867E-01 .200 .8418 -42.666667
EDUCHHD .3700647640E-01 .21967643E-01 1.685 .0921 -160.16667
ACTIVITY 20.93004839 14.715297 1.422 .1549 .57142857
YEARLAND .7133255329E-03 .82850116E-01 .086 .9314 1767.8571
MAINFRMT 27.17064018 12.819895 2.119 .0341 .60714286
MAINFNCR 4.039368811 3.1539802 1.281 .2003 2.3184524
MAINFRMG .8834710451E-01 .10593786 .834 .4043 -11.544048
TREEUSE3 18.08229930 14.222882 1.271 .2036 .50000000
DISTANCE .1578274058E-01 .39336114E-01 -.401 .6883 -44.828571
REDGLOWM -5.314041769 14.399737 -.369 .7121 .47619048
MEMBERGR -3.151854522 7.3955291 -.426 .6700 .71428571
Disturbance standard deviation
Sigma 52.80031939 5.8298546 9.057 .0000
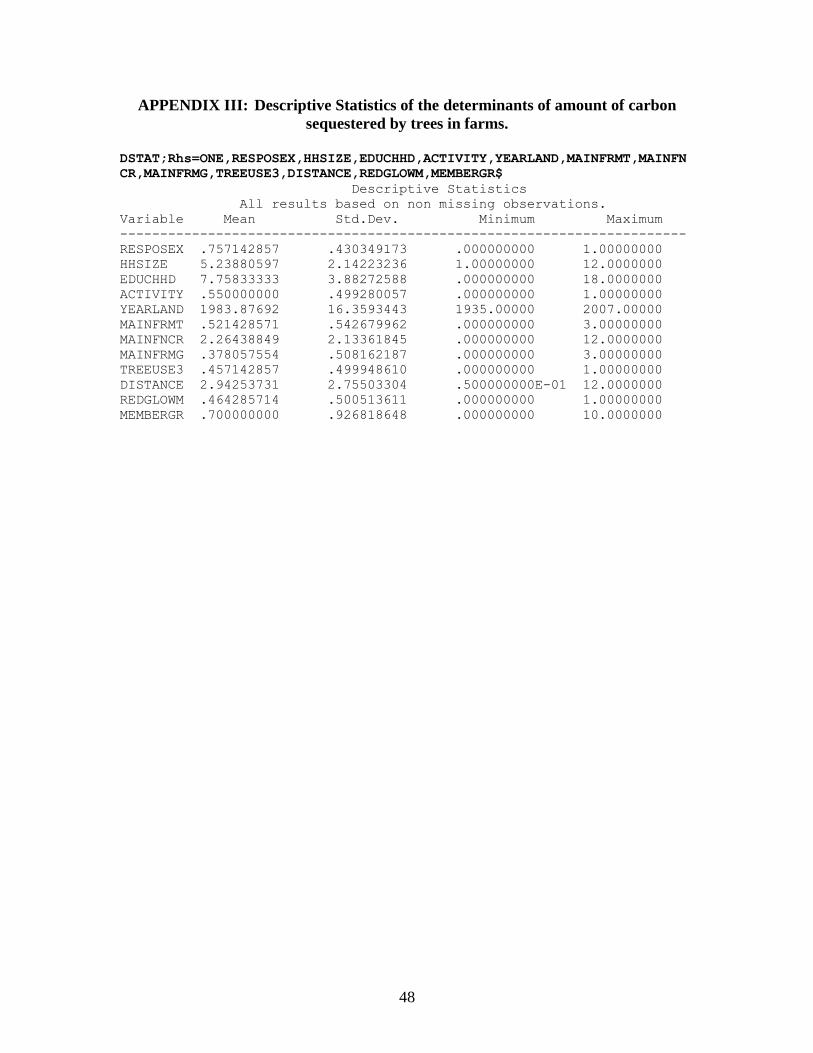
48
APPENDIX III: Descriptive Statistics of the determinants of amount of carbon
sequestered by trees in farms.
DSTAT;Rhs=ONE,RESPOSEX,HHSIZE,EDUCHHD,ACTIVITY,YEARLAND,MAINFRMT,MAINFN
CR,MAINFRMG,TREEUSE3,DISTANCE,REDGLOWM,MEMBERGR$
Descriptive Statistics
All results based on non missing observations.
Variable Mean Std.Dev. Minimum Maximum
-----------------------------------------------------------------------
RESPOSEX .757142857 .430349173 .000000000 1.00000000
HHSIZE 5.23880597 2.14223236 1.00000000 12.0000000
EDUCHHD 7.75833333 3.88272588 .000000000 18.0000000
ACTIVITY .550000000 .499280057 .000000000 1.00000000
YEARLAND 1983.87692 16.3593443 1935.00000 2007.00000
MAINFRMT .521428571 .542679962 .000000000 3.00000000
MAINFNCR 2.26438849 2.13361845 .000000000 12.0000000
MAINFRMG .378057554 .508162187 .000000000 3.00000000
TREEUSE3 .457142857 .499948610 .000000000 1.00000000
DISTANCE 2.94253731 2.75503304 .500000000E-01 12.0000000
REDGLOWM .464285714 .500513611 .000000000 1.00000000
MEMBERGR .700000000 .926818648 .000000000 10.0000000
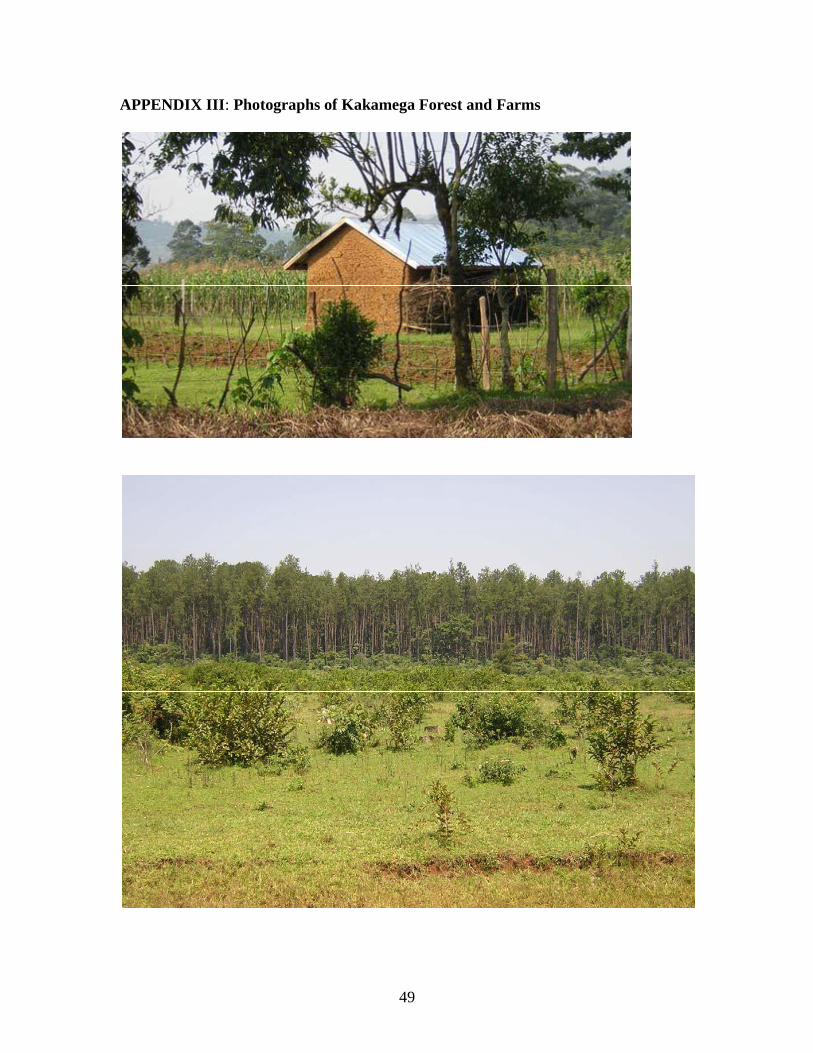
49
APPENDIX III: Photographs of Kakamega Forest and Farms
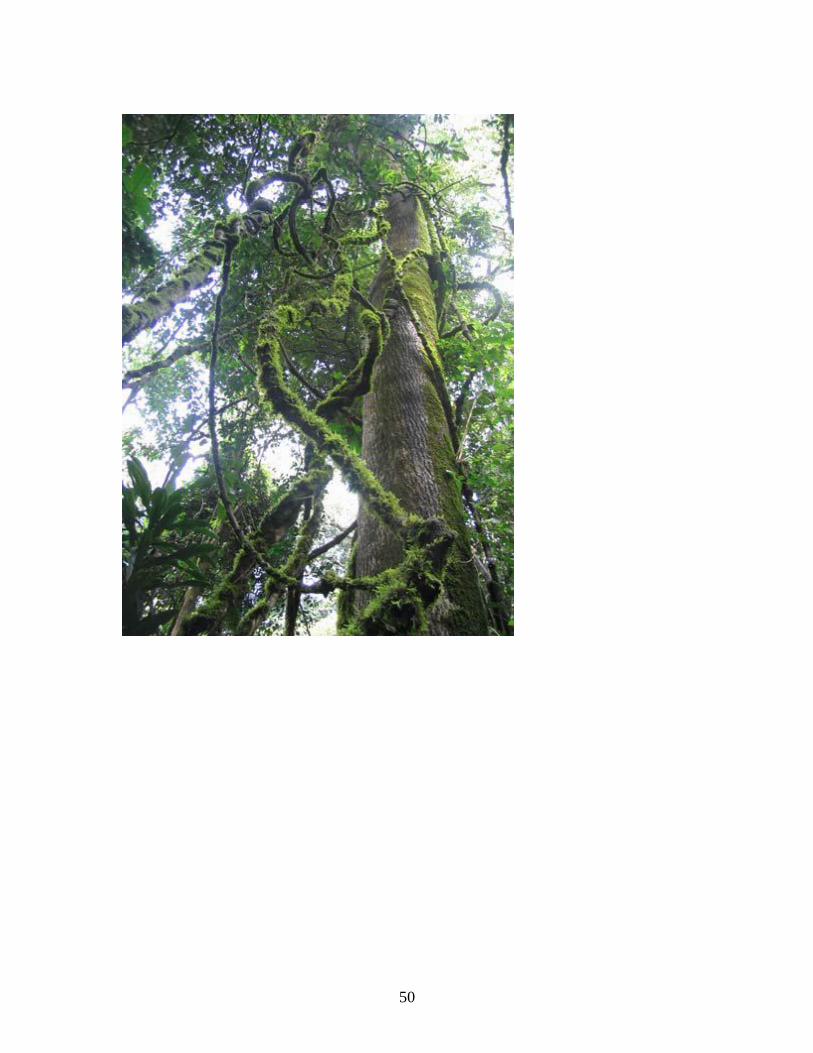
50
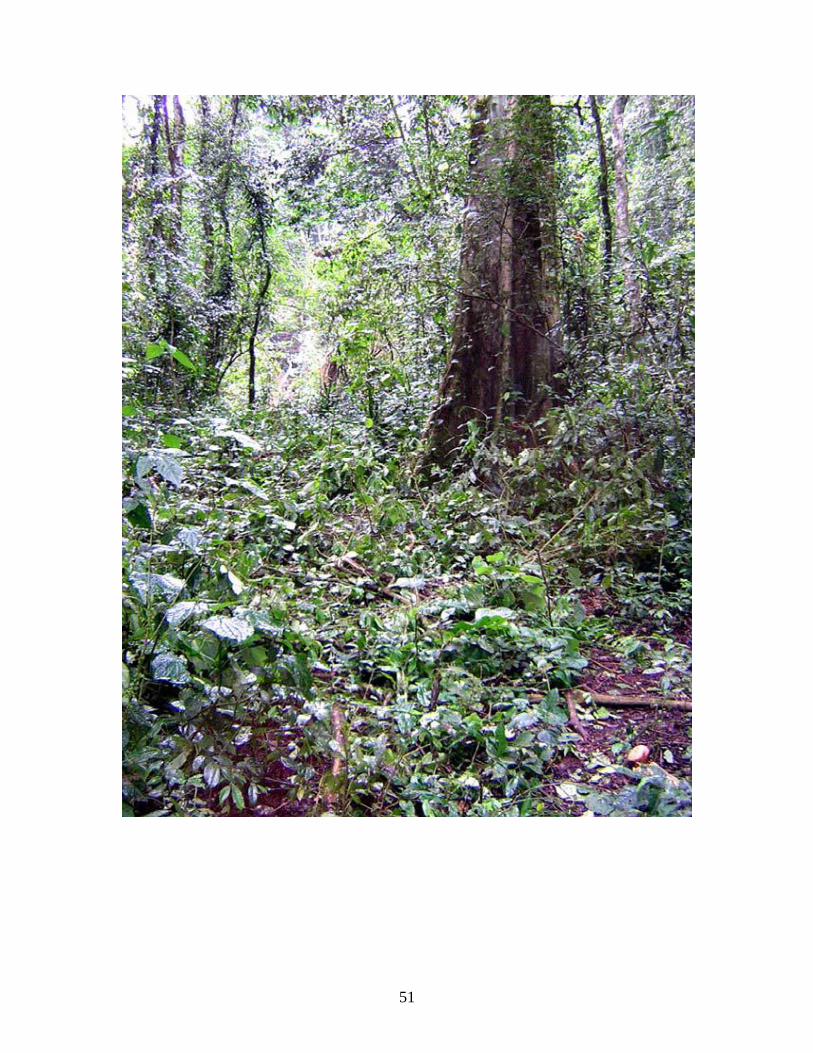
51