Embed Size (px)
Citation preview

Proceedings of the 2018 Winter Simulation Conference
M. Rabe, A.A. Juan, N. Mustafee, A. Skoogh, S. Jain, and B. Johansson, eds.
POTENTIAL COST-BENEFIT ANALYSIS FOR THE ASSESSMENT OF AIR CORRIDOR
INSTALLATION INTO JAPANESE AIRSPACE
Noboru Takeichi Akinori Harada
Satoshi Yamamoto Yasuo Morooka
Department of Aeronautics and Astronautics Department of Aerospace Engineering
Tokyo Metropolitan University Kochi University of Technology 6-6 Asahigaoka, Hino 185 Miyanokuchi, Tosayamada,
Tokyo, 191-0065, JAPAN Kami Kochi, JAPAN
ABSTRACT
The air corridor is an airspace concept to optimize operational efficiency of flights inside it. However, it inevitably becomes a huge obstacle for aircraft flying outside it. In this study, the cost-benefit analysis is performed in order to clarify the feasibility and the conditions at which the air corridor installation becomes beneficial. The increases of the operational cost of the flights outside the air corridor is analyzed through the comparison between the actual trajectories and numerical simulations of the trajectories to avoid the air corridor. The reduction of the operational cost by flying along the optimum trajectories inside the air
corridor is also analyzed through comparison with actual trajectories. It has been clarified that even a small number of flights operated inside the air corridor achieves total operational cost reduction. It is further concluded that the air corridor should be installed as early as onboard self-separation capability becomes available.
1 INTRODUCTION
1.1 Air Corridor Concept
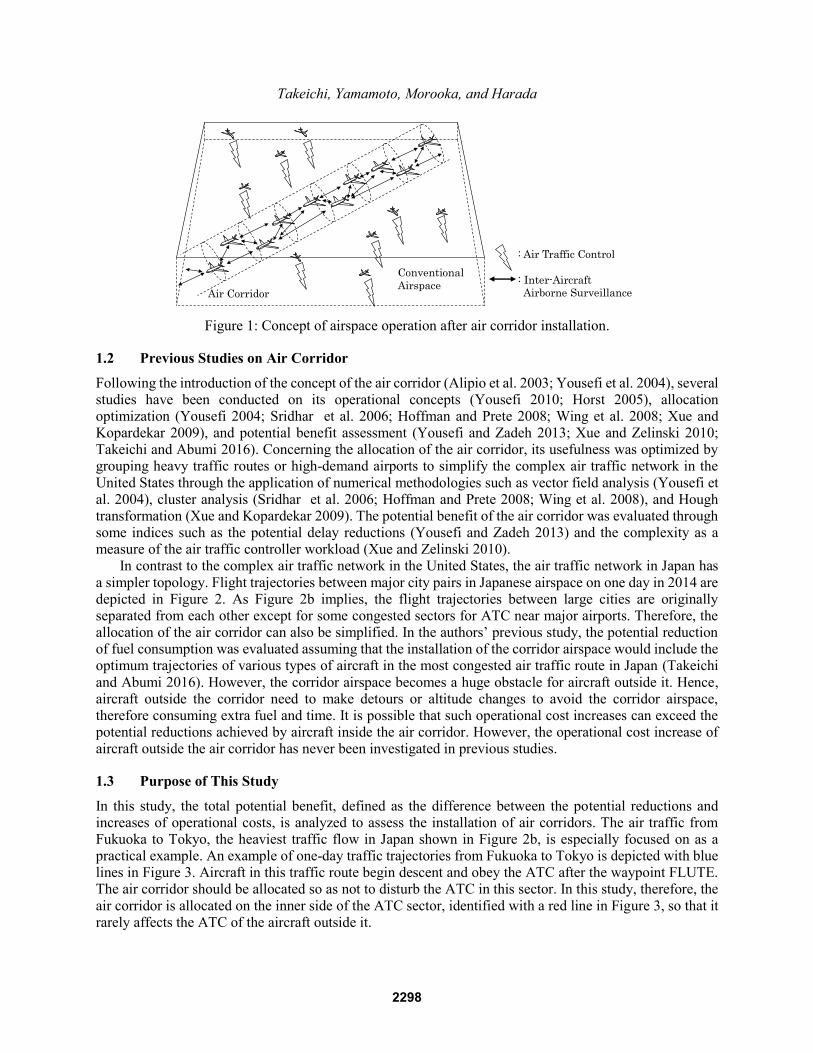
Recently, the introduction of air corridors is being investigated as one of the long-term plans to cope with increasing air traffic demand (Japan Civil Aviation Bureau 2010; NextGen Joint Planning and Development Office 2011). Sometimes referred to as flow corridors, they are projected to become long and narrow airspaces connecting high demand cities and areas. Aircraft will be required to be capable of self-separation using airborne separation assurance systems (Wing and Cotton 2011) to fly within the air corridors following their optimum trajectories punctually. They do not need to obey air traffic control (ATC)
instructions to reach the destination. The airspace outside the air corridor will be operated in the same way as current ATC. In this way, the air corridor concept is expected to enhance both traffic throughput and efficiency in the whole airspace without degrading safety. The basic concept of the airspace operation after the air corridor installation is depicted in Figure 1. In addition, the air corridor is one of the concepts that enable the appropriate treatment of the air traffic where the self-separation capable and non-capable aircraft are mixed. The ratio of air traffic volume
between some specific airports and cities in Japan has currently increased significantly (Takeichi et al. 2012). As more than 20% of all domestic flights are between Tokyo and only four other airports, it is expected that the installation of air corridors into such flight routes is suitable.
2297978-1-5386-6572-5/18/$31.00 ©2018 IEEE
Takeichi, Yamamoto, Morooka, and Harada
Air Corridor
: Air Traffic Control
: Inter-Aircraft
Airborne Surveillance
Conventional
Airspace
Figure 1: Concept of airspace operation after air corridor installation.
1.2 Previous Studies on Air Corridor
Following the introduction of the concept of the air corridor (Alipio et al. 2003; Yousefi et al. 2004), several studies have been conducted on its operational concepts (Yousefi 2010; Horst 2005), allocation optimization (Yousefi 2004; Sridhar et al. 2006; Hoffman and Prete 2008; Wing et al. 2008; Xue and Kopardekar 2009), and potential benefit assessment (Yousefi and Zadeh 2013; Xue and Zelinski 2010; Takeichi and Abumi 2016). Concerning the allocation of the air corridor, its usefulness was optimized by grouping heavy traffic routes or high-demand airports to simplify the complex air traffic network in the
United States through the application of numerical methodologies such as vector field analysis (Yousefi et al. 2004), cluster analysis (Sridhar et al. 2006; Hoffman and Prete 2008; Wing et al. 2008), and Hough transformation (Xue and Kopardekar 2009). The potential benefit of the air corridor was evaluated through some indices such as the potential delay reductions (Yousefi and Zadeh 2013) and the complexity as a measure of the air traffic controller workload (Xue and Zelinski 2010). In contrast to the complex air traffic network in the United States, the air traffic network in Japan has
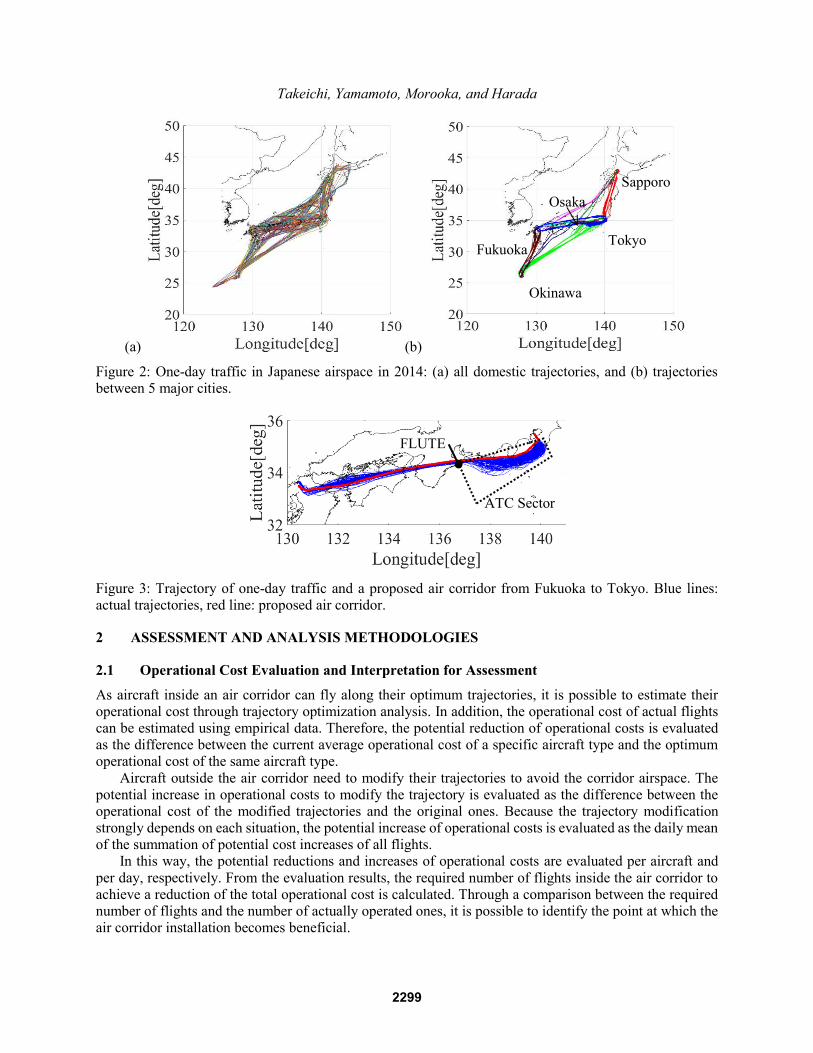
a simpler topology. Flight trajectories between major city pairs in Japanese airspace on one day in 2014 are depicted in Figure 2. As Figure 2b implies, the flight trajectories between large cities are originally separated from each other except for some congested sectors for ATC near major airports. Therefore, the allocation of the air corridor can also be simplified. In the authors’ previous study, the potential reduction of fuel consumption was evaluated assuming that the installation of the corridor airspace would include the optimum trajectories of various types of aircraft in the most congested air traffic route in Japan (Takeichi
and Abumi 2016). However, the corridor airspace becomes a huge obstacle for aircraft outside it. Hence, aircraft outside the corridor need to make detours or altitude changes to avoid the corridor airspace, therefore consuming extra fuel and time. It is possible that such operational cost increases can exceed the potential reductions achieved by aircraft inside the air corridor. However, the operational cost increase of aircraft outside the air corridor has never been investigated in previous studies.
1.3 Purpose of This Study
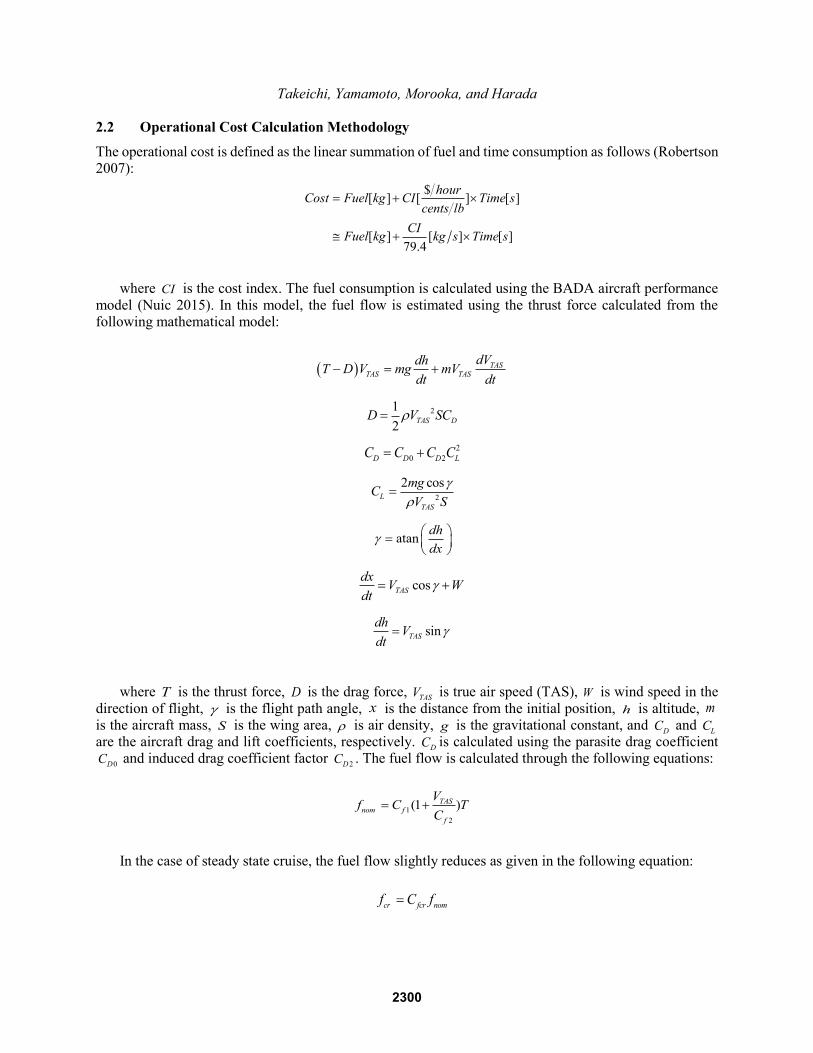
In this study, the total potential benefit, defined as the difference between the potential reductions and increases of operational costs, is analyzed to assess the installation of air corridors. The air traffic from Fukuoka to Tokyo, the heaviest traffic flow in Japan shown in Figure 2b, is especially focused on as a practical example. An example of one-day traffic trajectories from Fukuoka to Tokyo is depicted with blue lines in Figure 3. Aircraft in this traffic route begin descent and obey the ATC after the waypoint FLUTE. The air corridor should be allocated so as not to disturb the ATC in this sector. In this study, therefore, the
air corridor is allocated on the inner side of the ATC sector, identified with a red line in Figure 3, so that it rarely affects the ATC of the aircraft outside it.
2298
Takeichi, Yamamoto, Morooka, and Harada
(a) (b)
Figure 2: One-day traffic in Japanese airspace in 2014: (a) all domestic trajectories, and (b) trajectories between 5 major cities.
Figure 3: Trajectory of one-day traffic and a proposed air corridor from Fukuoka to Tokyo. Blue lines: actual trajectories, red line: proposed air corridor.
2 ASSESSMENT AND ANALYSIS METHODOLOGIES
2.1 Operational Cost Evaluation and Interpretation for Assessment
As aircraft inside an air corridor can fly along their optimum trajectories, it is possible to estimate their operational cost through trajectory optimization analysis. In addition, the operational cost of actual flights can be estimated using empirical data. Therefore, the potential reduction of operational costs is evaluated as the difference between the current average operational cost of a specific aircraft type and the optimum operational cost of the same aircraft type.
Aircraft outside the air corridor need to modify their trajectories to avoid the corridor airspace. The potential increase in operational costs to modify the trajectory is evaluated as the difference between the operational cost of the modified trajectories and the original ones. Because the trajectory modification strongly depends on each situation, the potential increase of operational costs is evaluated as the daily mean of the summation of potential cost increases of all flights. In this way, the potential reductions and increases of operational costs are evaluated per aircraft and
per day, respectively. From the evaluation results, the required number of flights inside the air corridor to achieve a reduction of the total operational cost is calculated. Through a comparison between the required number of flights and the number of actually operated ones, it is possible to identify the point at which the air corridor installation becomes beneficial.
Tokyo Fukuoka
Okinawa
Sapporo
Osaka
FLUTE
ATC Sector
2299
Takeichi, Yamamoto, Morooka, and Harada
2.2 Operational Cost Calculation Methodology
The operational cost is defined as the linear summation of fuel and time consumption as follows (Robertson 2007):
$[ ] [ ] [ ]
[ ] [ ] [ ]79.4
hourCost Fuel kg CI Time s
cents lb
CIFuel kg kg s Time s
where CI is the cost index. The fuel consumption is calculated using the BADA aircraft performance
model (Nuic 2015). In this model, the fuel flow is estimated using the thrust force calculated from the following mathematical model:
TAS
TAS TAS
dVdhT D V mg mV
dt dt
21
2TAS DD V SC
2
0 2D D D LC C C C
2
2 cosL
TAS
mgC
V S
atandh
dx
cosTAS
dxV W
dt
sinTAS
dhV
dt
where T is the thrust force, D is the drag force, TASV is true air speed (TAS), W is wind speed in the
direction of flight, is the flight path angle, x is the distance from the initial position, h is altitude, m is the aircraft mass, S is the wing area, is air density, g is the gravitational constant, and
DC and LC
are the aircraft drag and lift coefficients, respectively. DC is calculated using the parasite drag coefficient
0DC and induced drag coefficient factor 2DC . The fuel flow is calculated through the following equations:
1
2
(1 )TAS
nom f
f
Vf C T
C
In the case of steady state cruise, the fuel flow slightly reduces as given in the following equation:
cr fcr nomf C f
2300
Takeichi, Yamamoto, Morooka, and Harada
In addition, when idle thrust is applied, the fuel flow is given as a function of the altitude as follows:
3
4
(1 )min f
f
f Ch
C
The rate of mass reduction is given as
con
dmf
dt
where conf is
nomf , crf , or
minf . The drag and fuel flow coefficients 1fC ~
4fC and fcrC of each aircraft
type are provided in the BADA data set.
2.3 Optimum Trajectory Analysis Methodology
The optimum trajectories are analyzed in order to evaluate the minimum operational cost and to determine the corridor airspace in this study. The objective function is defined as the summation of the fuel and time consumptions of the whole trajectory given as follows:
0
cos co
79.
s
4
1
79.4
fin
fin fin
ini iniTAS TAS
t
con fin
x xcon
x x
CICost f dt t
f CIdx
V W Vdx
W
where inix and finx are the initial and terminal flight distances along the air corridor. In addition, the
upper and lower limits of the indicated air speed (IAS) IASV and thrust force, and the upper limits of the
altitude are considered for the optimization constraints. In the optimization analysis, the IAS and the altitude are treated as the state variables to be optimized. The optimization problem is described as follows:
1
min79.cos cos4
fin fin
ini iniTAS
x xcon
TASx x
f CICos
V W V Wt dx dx
where
1
21
20 0
0
21 1 1 1
2T S AA I S
ppV
p pV
subject to the following constraints:
,min ,maxIAS IAS IASV V V
min maxT T T
maxh h
2301

Takeichi, Yamamoto, Morooka, and Harada
The maximum and minimum values are provided in the BADA data set. Because the fuel consumption
is described as a nonlinear function, this optimization problem becomes a nonlinear programming subject
to inequality constraints. In this study, the sequential quadratic programming provided in the MATLAB
Optimization Toolbox (Mathworks 2018) is applied for numerical optimization using the multi-start method
to avoid local-minimum solutions.
3 POTENTIAL COST REDUCTION EVALUATION
3.1 Actual Data Analysis
In this chapter, the potential reduction of the operational cost is analyzed by comparing the operational performances of actual and optimized trajectories. The actual operational performance is analyzed in this section. For the analysis, the operational track data from 42 days in 2014 provided by the Japan Civil Aviation Bureau (Japan Civil Aviation Bureau 2015) and numerical weather forecast data provided by the
Japan Meteorological Agency (Honda et al. 2005) are applied. According to the operational data, about 50 flights are operated from Fukuoka to Tokyo per day on average. About 50%, 20%, and 30% of them are operated, respectively, by large-sized aircraft such as the B772 and B773, middle-sized aircraft such as the B763 and A330, and small-sized aircraft such as the B738 and A320. In this study, the B772, B763, and B738 are especially focused on as representative types of aircraft for each class. Because mass information is not included in the track data, the initial aircraft mass
is given as 90%, 80%, and 90%, respectively, of the standard mass values provided in BADA for the B772, B763, and B738 in all analyses in this study, according to the average of the actual operational mass in Japanese domestic flight (Nakamura and Kageyama 2013). As the cost index information is neither provided, 80, 60, and 40 are applied for the large, middle, and small aircraft classes, respectively, according to Japanese airline captains. The average operational costs of each aircraft type per flight on the actual trajectories above 5000 ft are summarized in Table 1.
3.2 Analysis on Optimum Trajectories
To clarify the potential cost reduction, trajectories with minimum operational cost of the representative aircraft types, B772, B763, and B738, are analyzed. As the lateral trajectory of the air corridor shown in Figure 3 is fixed, the profiles of the pressure altitude and IAS are optimized. The optimum trajectories are analyzed so as to connect the points at 5000 ft on the standard departure and arrival routes. The initial and terminal flight speeds are determined according to the BADA reference profiles. For weather data, the 1-
year average of the forecast wind and temperature are applied. The trajectory optimization is performed by discretizing the whole trajectory of 917.6 km into 100 segments. The computational time for one trajectory optimization with for 20 cases of initial conditions was about 10000s on average using a PC with Intel Core i7-7700. The operational costs of the optimum trajectories for B772, B763, and B738 are also summarized in Table 1.
Table 1: Potential Reduction of Operational Cost per Flight.
Large Size (B772) Middle Size (B763) Small Size (B738)
Operational cost per aircraft on
actual trajectories 10749.6 8111.9 4815.5
Operational cost per aircraft on
optimum trajectories 9363.0 6951.4 4277.3
Potential cost reduction 1386.6 1160.5 538.2
2302
Takeichi, Yamamoto, Morooka, and Harada
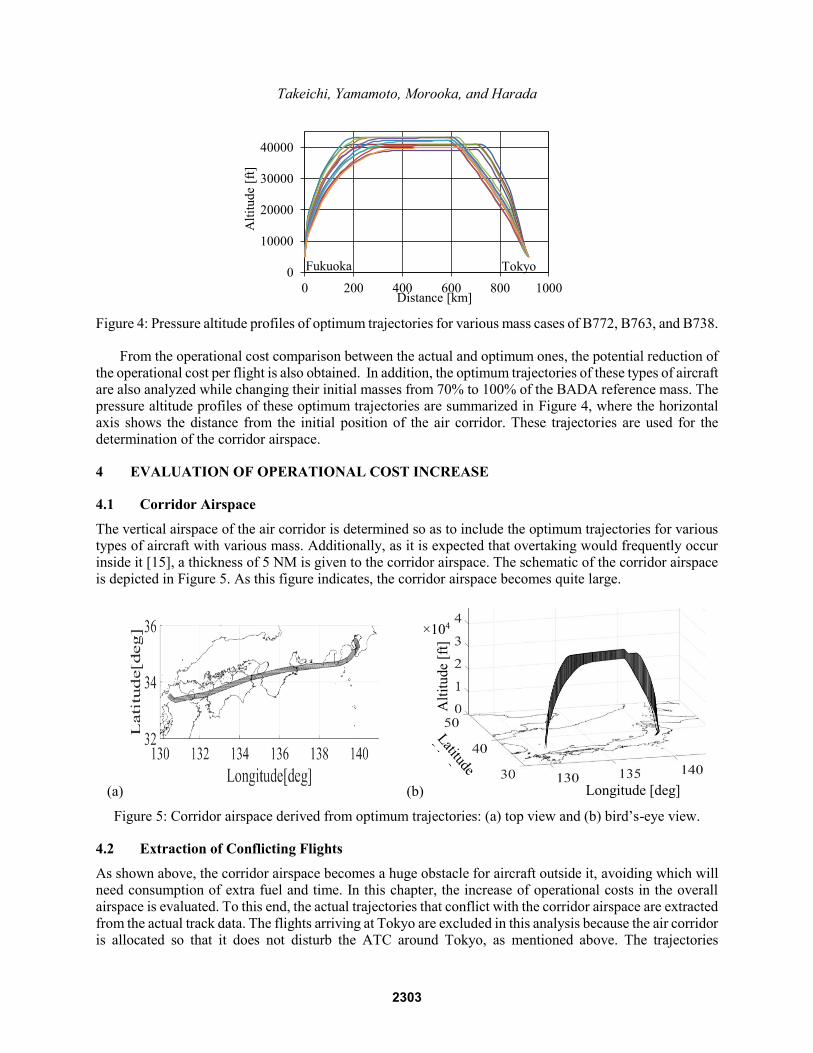
Figure 4: Pressure altitude profiles of optimum trajectories for various mass cases of B772, B763, and B738.
From the operational cost comparison between the actual and optimum ones, the potential reduction of the operational cost per flight is also obtained. In addition, the optimum trajectories of these types of aircraft are also analyzed while changing their initial masses from 70% to 100% of the BADA reference mass. The pressure altitude profiles of these optimum trajectories are summarized in Figure 4, where the horizontal axis shows the distance from the initial position of the air corridor. These trajectories are used for the determination of the corridor airspace.
4 EVALUATION OF OPERATIONAL COST INCREASE
4.1 Corridor Airspace
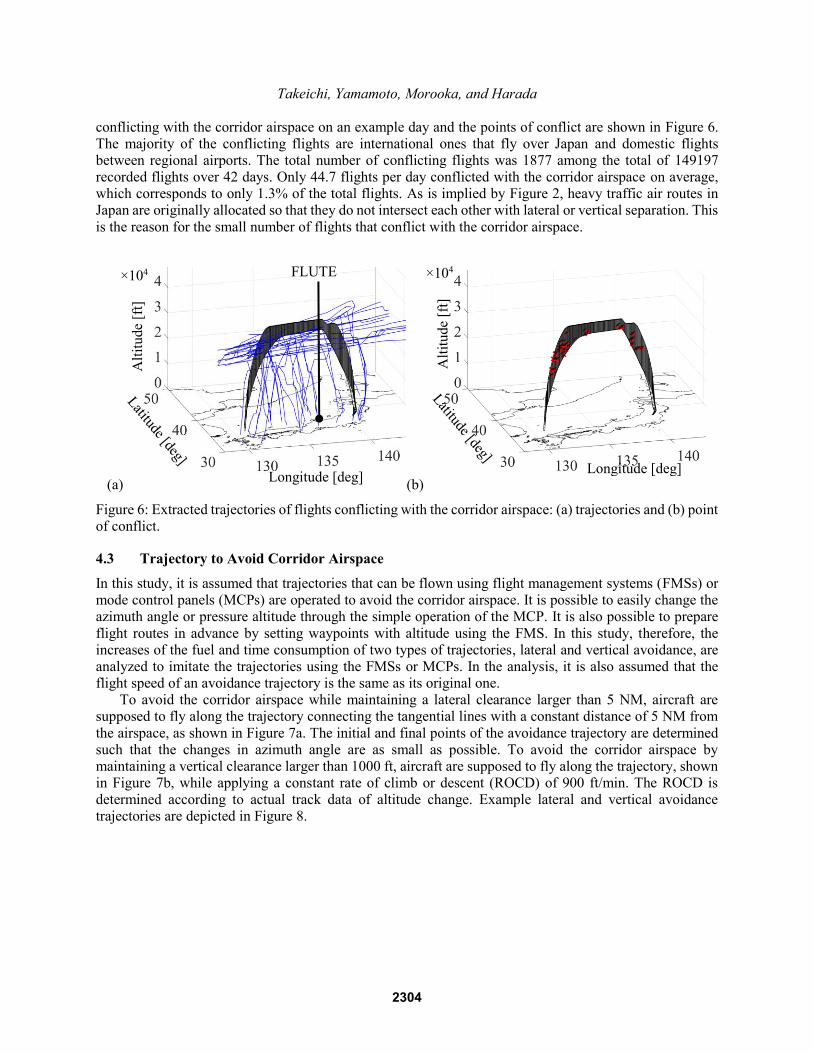
The vertical airspace of the air corridor is determined so as to include the optimum trajectories for various types of aircraft with various mass. Additionally, as it is expected that overtaking would frequently occur inside it [15], a thickness of 5 NM is given to the corridor airspace. The schematic of the corridor airspace is depicted in Figure 5. As this figure indicates, the corridor airspace becomes quite large.
(a) (b)
Figure 5: Corridor airspace derived from optimum trajectories: (a) top view and (b) bird’s-eye view.
4.2 Extraction of Conflicting Flights
As shown above, the corridor airspace becomes a huge obstacle for aircraft outside it, avoiding which will need consumption of extra fuel and time. In this chapter, the increase of operational costs in the overall airspace is evaluated. To this end, the actual trajectories that conflict with the corridor airspace are extracted
from the actual track data. The flights arriving at Tokyo are excluded in this analysis because the air corridor is allocated so that it does not disturb the ATC around Tokyo, as mentioned above. The trajectories
0
10000
20000
30000
40000
0 200 400 600 800 1000
Alt
itud
e [f
t]
Distance [km]
TokyoFukuoka
Longitude [deg]
Alt
itude
[ft]
×104
2303
Takeichi, Yamamoto, Morooka, and Harada
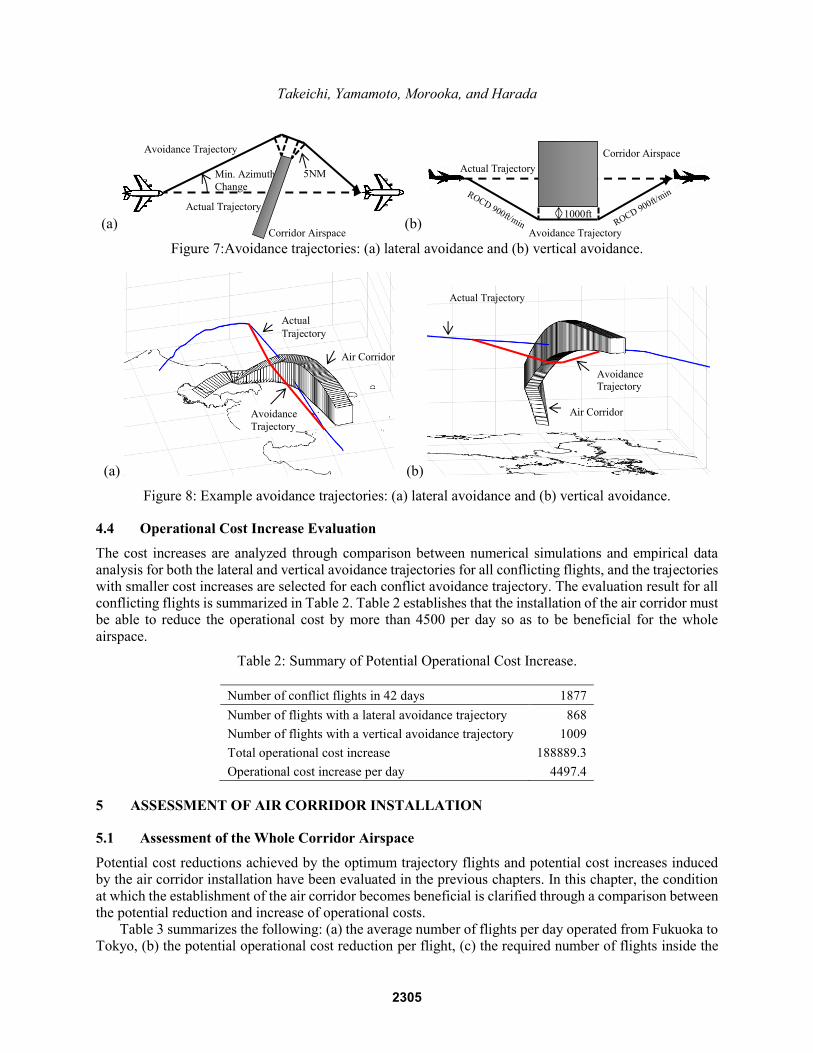
conflicting with the corridor airspace on an example day and the points of conflict are shown in Figure 6. The majority of the conflicting flights are international ones that fly over Japan and domestic flights between regional airports. The total number of conflicting flights was 1877 among the total of 149197 recorded flights over 42 days. Only 44.7 flights per day conflicted with the corridor airspace on average, which corresponds to only 1.3% of the total flights. As is implied by Figure 2, heavy traffic air routes in Japan are originally allocated so that they do not intersect each other with lateral or vertical separation. This
is the reason for the small number of flights that conflict with the corridor airspace.
(a) (b)
Figure 6: Extracted trajectories of flights conflicting with the corridor airspace: (a) trajectories and (b) point of conflict.
4.3 Trajectory to Avoid Corridor Airspace
In this study, it is assumed that trajectories that can be flown using flight management systems (FMSs) or mode control panels (MCPs) are operated to avoid the corridor airspace. It is possible to easily change the azimuth angle or pressure altitude through the simple operation of the MCP. It is also possible to prepare
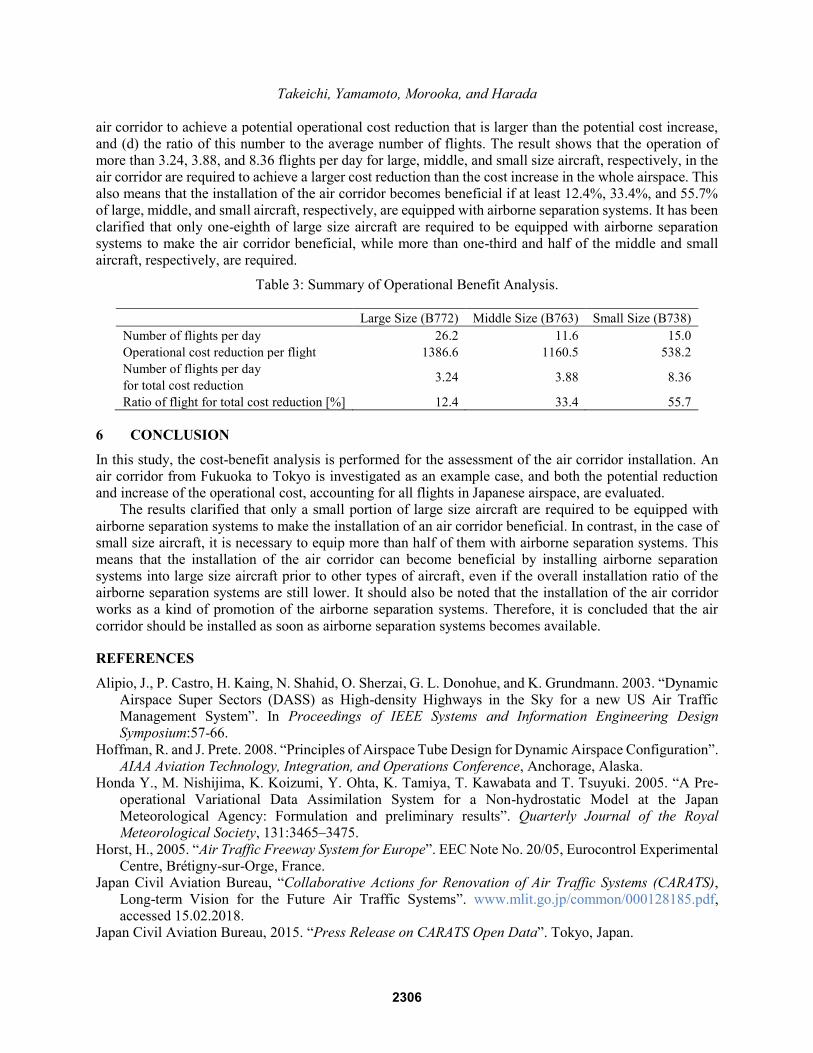
flight routes in advance by setting waypoints with altitude using the FMS. In this study, therefore, the increases of the fuel and time consumption of two types of trajectories, lateral and vertical avoidance, are analyzed to imitate the trajectories using the FMSs or MCPs. In the analysis, it is also assumed that the flight speed of an avoidance trajectory is the same as its original one. To avoid the corridor airspace while maintaining a lateral clearance larger than 5 NM, aircraft are supposed to fly along the trajectory connecting the tangential lines with a constant distance of 5 NM from
the airspace, as shown in Figure 7a. The initial and final points of the avoidance trajectory are determined such that the changes in azimuth angle are as small as possible. To avoid the corridor airspace by maintaining a vertical clearance larger than 1000 ft, aircraft are supposed to fly along the trajectory, shown in Figure 7b, while applying a constant rate of climb or descent (ROCD) of 900 ft/min. The ROCD is determined according to actual track data of altitude change. Example lateral and vertical avoidance trajectories are depicted in Figure 8.
Longitude [deg]
Alt
itu
de
[ft]
×104
Longitude [deg]
Alt
itu
de
[ft]
×104 FLUTE
2304
Takeichi, Yamamoto, Morooka, and Harada
(a) (b)
Figure 7:Avoidance trajectories: (a) lateral avoidance and (b) vertical avoidance.
(a) (b)
Figure 8: Example avoidance trajectories: (a) lateral avoidance and (b) vertical avoidance.
4.4 Operational Cost Increase Evaluation
The cost increases are analyzed through comparison between numerical simulations and empirical data analysis for both the lateral and vertical avoidance trajectories for all conflicting flights, and the trajectories with smaller cost increases are selected for each conflict avoidance trajectory. The evaluation result for all conflicting flights is summarized in Table 2. Table 2 establishes that the installation of the air corridor must be able to reduce the operational cost by more than 4500 per day so as to be beneficial for the whole
airspace.
Table 2: Summary of Potential Operational Cost Increase.
Number of conflict flights in 42 days 1877
Number of flights with a lateral avoidance trajectory 868
Number of flights with a vertical avoidance trajectory 1009
Total operational cost increase 188889.3
Operational cost increase per day 4497.4
5 ASSESSMENT OF AIR CORRIDOR INSTALLATION
5.1 Assessment of the Whole Corridor Airspace
Potential cost reductions achieved by the optimum trajectory flights and potential cost increases induced by the air corridor installation have been evaluated in the previous chapters. In this chapter, the condition
at which the establishment of the air corridor becomes beneficial is clarified through a comparison between the potential reduction and increase of operational costs. Table 3 summarizes the following: (a) the average number of flights per day operated from Fukuoka to Tokyo, (b) the potential operational cost reduction per flight, (c) the required number of flights inside the
Corridor Airspace
Actual Trajectory
Min. Azimuth
Change
Avoidance Trajectory
5NM
Corridor Airspace
Actual Trajectory
Avoidance Trajectory
1000ft
Actual
Trajectory
Avoidance
Trajectory
Air Corridor
Actual Trajectory
Avoidance
Trajectory
Air Corridor
2305
Takeichi, Yamamoto, Morooka, and Harada
air corridor to achieve a potential operational cost reduction that is larger than the potential cost increase, and (d) the ratio of this number to the average number of flights. The result shows that the operation of more than 3.24, 3.88, and 8.36 flights per day for large, middle, and small size aircraft, respectively, in the air corridor are required to achieve a larger cost reduction than the cost increase in the whole airspace. This also means that the installation of the air corridor becomes beneficial if at least 12.4%, 33.4%, and 55.7% of large, middle, and small aircraft, respectively, are equipped with airborne separation systems. It has been
clarified that only one-eighth of large size aircraft are required to be equipped with airborne separation systems to make the air corridor beneficial, while more than one-third and half of the middle and small aircraft, respectively, are required.
Table 3: Summary of Operational Benefit Analysis.
Large Size (B772) Middle Size (B763) Small Size (B738)
Number of flights per day 26.2 11.6 15.0
Operational cost reduction per flight 1386.6 1160.5 538.2
Number of flights per day
for total cost reduction 3.24 3.88 8.36
Ratio of flight for total cost reduction [%] 12.4 33.4 55.7
6 CONCLUSION
In this study, the cost-benefit analysis is performed for the assessment of the air corridor installation. An air corridor from Fukuoka to Tokyo is investigated as an example case, and both the potential reduction and increase of the operational cost, accounting for all flights in Japanese airspace, are evaluated. The results clarified that only a small portion of large size aircraft are required to be equipped with
airborne separation systems to make the installation of an air corridor beneficial. In contrast, in the case of small size aircraft, it is necessary to equip more than half of them with airborne separation systems. This means that the installation of the air corridor can become beneficial by installing airborne separation systems into large size aircraft prior to other types of aircraft, even if the overall installation ratio of the airborne separation systems are still lower. It should also be noted that the installation of the air corridor works as a kind of promotion of the airborne separation systems. Therefore, it is concluded that the air
corridor should be installed as soon as airborne separation systems becomes available.
REFERENCES
Alipio, J., P. Castro, H. Kaing, N. Shahid, O. Sherzai, G. L. Donohue, and K. Grundmann. 2003. “Dynamic Airspace Super Sectors (DASS) as High-density Highways in the Sky for a new US Air Traffic Management System”. In Proceedings of IEEE Systems and Information Engineering Design Symposium:57-66.
Hoffman, R. and J. Prete. 2008. “Principles of Airspace Tube Design for Dynamic Airspace Configuration”. AIAA Aviation Technology, Integration, and Operations Conference, Anchorage, Alaska.
Honda Y., M. Nishijima, K. Koizumi, Y. Ohta, K. Tamiya, T. Kawabata and T. Tsuyuki. 2005. “A Pre-operational Variational Data Assimilation System for a Non-hydrostatic Model at the Japan Meteorological Agency: Formulation and preliminary results”. Quarterly Journal of the Royal Meteorological Society, 131:3465–3475.
Horst, H., 2005. “Air Traffic Freeway System for Europe”. EEC Note No. 20/05, Eurocontrol Experimental Centre, Brétigny-sur-Orge, France.
Japan Civil Aviation Bureau, “Collaborative Actions for Renovation of Air Traffic Systems (CARATS), Long-term Vision for the Future Air Traffic Systems”. www.mlit.go.jp/common/000128185.pdf, accessed 15.02.2018.
Japan Civil Aviation Bureau, 2015. “Press Release on CARATS Open Data”. Tokyo, Japan.
2306

Takeichi, Yamamoto, Morooka, and Harada
NextGen Joint Planning and Development Office, 2011. “Concept of Operations for the Next Generation Air Transportation System, Version 3.2”. Washington, D.C.
Nakamura, Y. and K. Kageyama, 2013. “Validation Study of a Fuel-Burn Estimation Model”. In Proceedings of the 2013 Asia-Pacific International Symposium on Aerospace Technology, Takamatsu, Japan.
Nuic, A., 2015. "User Manual for the Base of Aircraft Data (BADA) Revision 3.13". EEC
Technical/Scientific Report No. 15/04/02-43, Eurocontrol Experimental Center, Brétigny-sur-Orge, France.
Robertson, B., 2007. “Fuel Conservation Strategies, Cost Index Explained”. Boeing Aero Quarterly 02(07): 26-29.
Sridhar, B., S. Grabbe, K. Sheth and K. Bilimoria, 2006. “Initial Study of Tube Networks for Flexible Airspace Utilization”. AIAA Guidance, Navigation, and Control Conference and Exhibit, Keystone,
Colorado. Takeichi, N. and Y. Abumi, 2016. “Benefit Optimization and Operational Requirement of Flow Corridor
in Japanese Airspace”. Journal of Aerospace Engineering, Proceedings of the Institution of Mechanical Engineers Part G, 230:1780-1787.
Takeichi, N., Y. Nakamura and K. Kageyama, 2012. “High Density Air Corridor: Benefit, Allocation and Self-Separation”. Aeronautical and Space Sciences Japan, 60(12):449-454. (in Japanese)
The MathWorks 2018, https://mathworks.com/help/optim/ug/fmincon.html, accessed May 1, 2018. Yousefi, A., G. L. Donohue and L. Sherry, 2004. “High Volume Tube Shaped Sectors (HTS): A Network
Of High-Capacity Ribbons Connecting Congested City Pairs”. IEEE/AIAA 23rd Digital Avionics Systems Conference, Salt Lake City, UT.
Yousefi, A., J. Lard and J. Timmerman, 2010. “Nextgen Flow Corridors Initial Design, Procedures, and Display Functionalities”. IEEE/AIAA 29th Digital Avionics Systems Conference, Salt Lake City, UT.
Yousefi, A. and A. N., 2013. “Dynamic Allocation and Benefit Assessment Of Nextgen Flow Corridors”. Transportation Research Part C: Emerging Technologies, 33:297-310.
Wing, D. J. and W. B. Cotton, 2011. “Autonomous Flight Rules: A Concept for Self-Separation in U.S. Domestic Airspace”. NASA TP-2011-217174, NASA Langley Research Center, Hampton, VA.
Wing, D., J. C. Smith and M. G. Ballin, 2008. “Analysis of a Dynamic Multi-Track Airway Concept for Air Traffic Management”. NASA/tp-2008-215323, NASA Langley Research Center, Hampton, VA.
Xue, M. and P. Kopardekar, 2009. “High-Capacity Tube Network Design using the Hough Transform”. Journal of Guidance, Control, and Dynamics, 32(3):788–795.
Xue, M. and S. Zelinski, 2010. “Complexity Analysis of Traffic in Corridors-in-the-sky,” 10th AIAA Aviation Technology, Integration, and Operations Conference, Fort Worth, TX.
AUTHOR BIOGRAPHIES
NOBORU TAKEICHI is associate professor of Department of Aeronautics and Astronautics at Tokyo
Metropolitan University. He received B.E., M.E. and Ph.D in Engineering from The University of Tokyo in 1997, 1999 and 2002, respectively. After working for Japan Aerospace Exploration Agency and Electronic Navagation Research Institute as a researcher, he joined Department of Aerospace Engineering at Nagoya University as an associate professor in 2008, and moved to Tokyo Metropolitan University in 2015. His research interests include air traffic management and the future space systems, such as tethered systems, orbital elevator, etc. His e-mail address is [email protected].
SATOSHI YAMAMOTO is graduate scholl student of Department of Aeronautics and Astronautics at Tokyo Metropolitan University. He received B.E. in Engineering from Tokyo Metropolitan University in 2017. His e-mail address is [email protected].
2307

Takeichi, Yamamoto, Morooka, and Harada
YASUO MOROOKA is a captain of B737 aircraft at a Japanese airline company since 1994. He is now a Ph.D. candidate of Department of Aeronautics and Astronautics at Tokyo Metropolitan University. He received M.E. in Engineering from Osaka Prefectural University in 2000. His e-mail address is [email protected].
AKINORI HARADA is associate professor of Department of Aerospace Engineering at Kochi University of Technology. He received B.E., M.E. and Ph.D in Engineering from Kyushu University Tokyo in 2011, 2012 and 2016, respectively. His research interests include trajectory optimization and its application to air traffic management study. His e-mail address is [email protected].
2308


![Principles and Standards for Benefit–Cost Analysis] Introduction- Professionalizing Benefit–Cost Analysis](https://img.pdfslide.us/doc/110x75/56d6beb21a28ab30169333bb/principles-and-standards-for-benefitcost-analysis-introduction-professionalizing.jpg)