Embed Size (px)
Citation preview
Potential benefits of delaying the second mRNA COVID-19 vaccine dose
B. F. Maier,1, ∗ A. Burdinski,1 A. H. Rose,1 F. Schlosser,1 D. Hinrichs,1 C. Betsch,2 L. Korn,2
P. Sprengholz,2 M. Meyer-Hermann,3, 4 T. Mitra,3 K. Lauterbach,5, 6 and D. Brockmann1
1Institute for Theoretical Biology and Integrated Research Institute for the Life-Sciences, Humboldt University of Berlin, Germany2University of Erfurt, Germany
3Department of Systems Immunology and Braunschweig Integrated Centre of Systems Biology (BRICS),Helmholtz Centre for Infection Research, Braunschweig, Germany
4Institute for Biochemistry, Biotechnology and Bioinformatics,Technische Universität Braunschweig, Braunschweig, Germany
5Institute of Health Economics and Clinical Epidemiology, University of Cologne6Department of Health Policy and Management, Harvard School of Public Health, Boston
(Dated: March 1, 2021)
Vaccination against COVID-19 with the recently approved mRNA vaccines BNT162b2 (BioNTech/Pfizer)and mRNA-1273 (Moderna) is currently underway in a large number of countries. However, high incidencerates and rapidly spreading SARS-CoV-2 variants are concerning. In combination with acute supply deficitsin Europe in early 2021, the question arises of whether stretching the vaccine, for instance by delaying thesecond dose, can make a significant contribution to preventing deaths, despite associated risks such as lowervaccine efficacy, the potential emergence of escape mutants, enhancement, waning immunity, reduced socialacceptance of off-label vaccination, and liability shifts. A quantitative epidemiological assessment of risksand benefits of non-standard vaccination protocols remains elusive. To clarify the situation and to provide aquantitative epidemiological foundation we develop a stochastic epidemiological model that integrates specificvaccine rollout protocols into a risk-group structured infectious disease dynamical model. Using the situationand conditions in Germany as a reference system, we show that delaying the second vaccine dose is expected toprevent COVID-19 deaths in the four to five digit range, should the incidence resurge in the first six months of2021. We show that this considerable public health benefit relies on the fact that both mRNA vaccines providesubstantial protection against severe COVID-19 and death beginning 12 to 14 days after the first dose. The modelpredicts that the benefits of protocol change are attenuated should vaccine compliance decrease substantially.To quantify the impact of protocol change on vaccination adherence we performed a large-scale online survey.We find that, in Germany, changing vaccination protocols may lead only to small reductions in vaccinationintention depending on liability issues associated with postponing the second dose. In sum, we therefore expectthe benefits of a strategy change to remain substantial and stable.
I. INTRODUCTION
Large-scale vaccine rollouts against coronavirus disease2019 (COVID-19) began on a world-wide scale at the endof 2020. Because of variable vaccine supplies, distribu-tion and delivery protocols, national policies and vaccinationstrategies, the rate at which vaccines are administered variessubstantially in different countries. For instance, Israel hadreached a national vaccine coverage of more than 28% in thegeneral population by Feb 16, 2021 and started vaccinatingadolescents on Jan 23, 2021 [1]. By the same date, many Eu-ropean countries had only vaccinated a fraction of the popu-lation in the single digit percent range [2–5]. In Germany, forexample, by Feb 15, 2021 only 3% of the population had re-ceived the first dose and at the time of writing the vaccinationprogresses at approximately 120,000-150,000 persons per day[5]. Currently approved mRNA vaccines BNT162b2 (BioN-Tech/Pfizer) and mRNA-1273 (Moderna) are reported to beapproximately 95% efficacious against COVID-19 disease af-ter receiving two doses [6, 7]. Efficacy against severe COVID-19 and death is projected to be close to 100%, whereas over-all risk reduction of infection by the causing agent severe
∗ Correspondence email address: [email protected]
acute respiratory syndrome coronavirus type 2 (SARS-CoV-2) is found to be less considerable [6–8]. Therefore, and be-cause vaccination rates are limited by supply and infrastruc-tural challenges, vaccination strategies typically prioritize thepopulation at risk, i.e. the elderly, people with comorbidities,and people with high risk of exposure [9, 10]. The publichealth priority during this early phase is therefore the directand effective reduction of severe COVID-19 cases and deathsin the high-risk groups as opposed to reducing transmissionfrequency in the general population.
According to the World Health Organization’s StrategicAdvisory Group of Experts on Immunization (SAGE) as wellas manufacturers’ recommendations, individuals that receivethe first dose of the respective vaccine should receive the sec-ond dose after approximately 21 or 28 days, but no later than42 days after the first dose [11, 12]. To comply with theserecommendations, the current standard vaccine administrationprotocol that is applied in the majority of European countriesprovides the first dose immediately, and the second dose iswithheld and stored appropriately to be used on the same in-dividual 21 to 28 days later (see Fig. 1a). Reserving the sec-ond dose, however, implies that the stock of available dosesis depleted twice as fast as the number of people with firstdose protection increases. Studies indicate that a substantialamount of protection is already delivered by the first dose [6–8]. After 12-14 days of receiving the initial dose, efficacy
arX
iv:2
102.
1360
0v1
[q-
bio.
PE]
26
Feb
2021

2
was approximately 89% and 92% for BNT162b2 and mRNA-1273, respectively [6, 7, 11, 12]. Supported by additional epi-demiological data from Israel, this implies that the first doseprovides almost complete protection against severe COVID-19 and death [6–8, 13–16]. Consequently, a situation of severevaccine scarcity could potentially be improved by instead ofreserving the second dose on an individual basis, administer-ing it to a second person on the same date, thereby doublingthe initial vaccination rate and substantially reducing the timerequired to protect the high-risk population (see Fig. 1a). Nat-urally, this would delay the administration of the second doseif vaccine supply is limited. Such a protocol is being followedin the UK, for instance, where the Joint Committee on Vacci-nation explicitly recommends to prioritize the first-dose vac-cination of as many high-risk individuals as possible over atimely administration of the second dose [17].
In light of the current situation including concerns about thespread of new virus variants with substantially higher trans-mission probabilities, discussions of whether the benefits ofthese alternative vaccination protocols outweigh their risks arehighly disputed and controversial [17–20].
Many European countries face a shortage of availablemRNA vaccine doses within the first quarter of 2021, a sit-uation that is likely to improve in the second quarter whenthe number of delivered doses is expected to be significantlygreater. Therefore, a systematic delay of the second dose ad-ministration could potentially save many lives by maximiz-ing vaccination speed and scope. However, so far only fewsystematic analyses have been performed that compare poten-tial epidemiological outcomes of alternative strategies to thestandard protocol [21]. In what way and under which condi-tions alternative protocols affect the expected number of se-vere COVID-19 cases and deaths remains yet unknown butcould significantly guide policy makers to make informed de-cisions.
Given this and the substantial protection against severeCOVID-19 and death provided by a single dose, it might bebeneficial to delay the second dose by 12 weeks, reachingtwice as many people in the first quarter of 2021 compared tothe standard protocol. However, exceeding the recommendedinterval between the first and second doses comes with the hy-pothetical risk of decreased vaccine efficacy, as well as the po-tential loss of manufacturer liability when administering vac-cines by an off-label procedure. A further risk is a potential re-duction in the population’s willingness to get vaccinated whenthe vaccines are used on off-label protocols.
Alternatively, and in order to comply with the manufactur-ers’ recommendations, the second dose can be delayed up to42 days in an extended in-label protocol [11, 12, 22]. As con-tracts over vaccine dose deliveries are usually signed per quar-ter (three months), the same number of individuals can be vac-cinated per quarter for both the standard and extended in-labelprotocol. In the extended in-label protocol, however, all high-risk individuals will have received the second dose after aboutsix weeks which is within the originally approved time frame.
Here we employ a stochastic computational model to cap-ture the epidemiological impact of changing the standard pro-tocol and implementing in- and off-label extended protocols
instead. A particular emphasis is placed on quantifying thepublic health benefits or drawbacks of these alternative strate-gies in terms of the expected number of saved lives andavoided COVID-19 cases in the high-risk population. Themodel is designed to shed light onto the factors that may yieldbenefits of alternative protocols and identify conditions forwhich benefits become drawbacks. In particular, we investi-gate how a potentially negative impact of an alternative vacci-nation protocol, especially off-label use, on vaccination adher-ence may neutralize the benefits expected by faster coverage.The model compares three categorically different pandemicscenarios for the first 6 months in 2021.
We find that due to the high efficacy of the vaccines with re-spect to death from COVID-19, a substantial reduction in fataloutcomes is expected for all extended protocols and all pan-demic scenarios. However, should a change in protocol im-pact vaccine adherence substantially, our model indicates thatthese benefits are neutralized and become disadvantageous.
II. MODEL AND METHODS
In order to assess the impact and potential benefits of differ-ent vaccination protocols, the model requires detailed data onvaccine supplies which can vary between countries. We there-fore investigate two different supply timelines and scenarios.Both scenarios are derived from the particular situation in Ger-many (population of the order of 80 million).
In both scenarios we assume that in the first quarter of 2021,14 million doses of mRNA vaccine are available and are de-livered at a constant rate over the whole quarter. A parsimo-nious “extreme scarcity” scenario focuses on the general ef-fects expected for different vaccination protocols and assumesthe same number of doses for each quarter in 2021, so after 6months a total of 14 million individuals can be vaccinated withtwo doses. The results obtained for these values can be usedas a guide for the expected effects in other countries and as areference scenario.
The second scenario is based on actual estimations onmRNA vaccine availability in Germany [23]. Here, 46 mil-lion doses are expected to be available in the second quarterof 2021. This would amount to a total of 30 million peoplethat could receive two doses of the discussed vaccines in thefirst half of 2021. We explicitly ignore the influence of Ade-novirus vaccines that might become available additionally, inorder to solely focus on the impact made by delaying the sec-ond mRNA vaccine dose.
Analyzing both scenarios enables us to compare the bene-fits of protocol changes for both extreme scarcity as well asmoderate scarcity of vaccine supply.
We developed and implemented a risk-group-structuredstochastic susceptible-exposed-infectious-removed (SEIR)model to capture the combined dynamics of the time-courseof the pandemic and the impact of vaccination (see Fig. 1b)[24, 25] with a uniform average latent period of 3.2 days andan infectious period of 6.7 days [26]. Using a coarse-grain ap-proximation, we divide the population into two groups: high-risk (which we define as having increased risk of death from
3
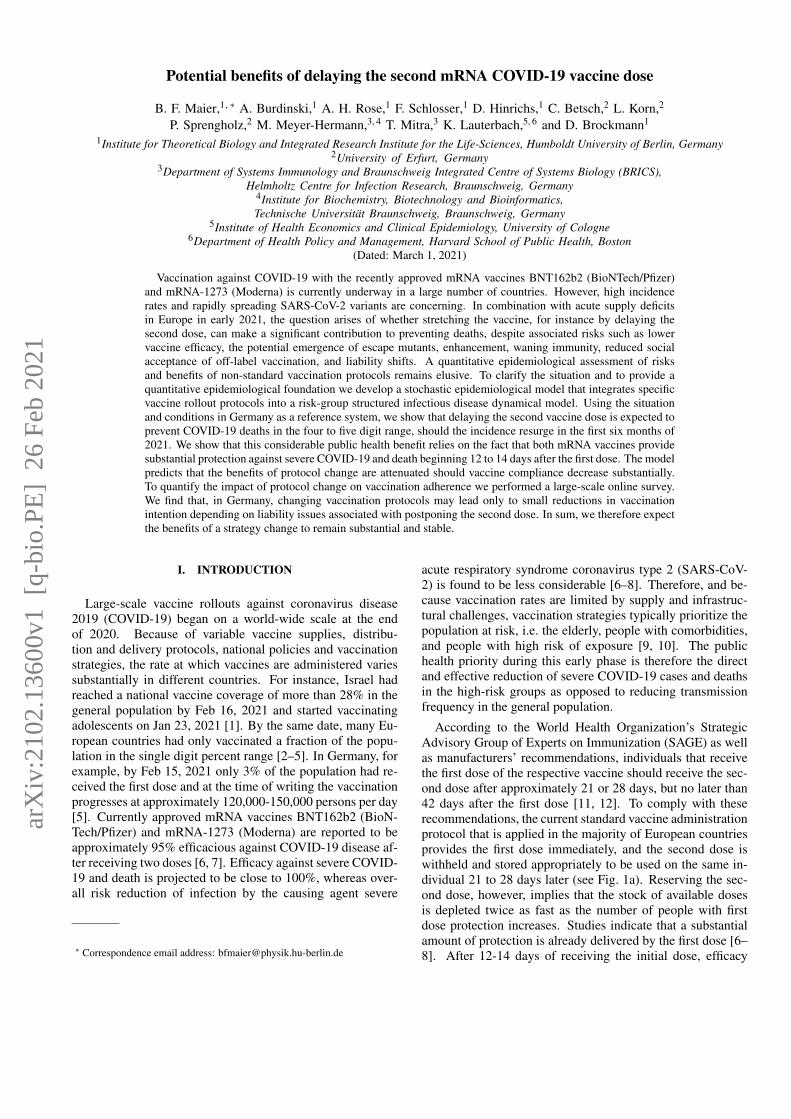
FIG. 1. Vaccine administration protocols and simplified epidemiological model architecture. (a) In the standard protocol, every individual thatreceives a first dose is registered to receive a second dose 21 days later. The first dose is administered immediately, the second dose is reservedand appropriately stored for 21 days. In the extended in-label protocol, the second dose is not stored, but administered to a second individualinstead. Both individuals will receive a second dose 42 days later (to stay within the time specifications of the manufacturers). In the extendedoff-label protocol, both individuals receive the second dose about 12 weeks (84 days) later, i.e. in the consecutive quarter (or earlier, if supplyis sufficient). (b) We employ a modified susceptible-exposed-infectious-removed model with a latency period of 3.2 days and an infectiousperiod of 6.7 days. The population consists of two risk groups with varying infection fatality rate—shown here is one layer for a single riskgroup. Risk group layers are coupled by infection terms that are proportional to the average number of contacts between individuals of therespective groups. Because the mRNA vaccines do not primarily protect against infection with SARS-CoV-2 but rather against COVID-19,all vaccinated individuals are classified as susceptible, associated with decreased susceptibility for protection levels 1 and 2, respectively. Forincreasing vaccine protection level, we assume increased efficacy against COVID-19 and COVID-19-related death. After receiving the firstdose, individuals remain unprotected for approximately 14 days. We conservatively assume that initial protection remains constant and is notboosted for individuals that receive the second dose after 12 weeks (84 days). Note that we compute the number of deaths and symptomaticcases as the respective fractions of the “removed” compartment.
infection) and low-risk (low risk of death from infection). Weassume that the high-risk group comprises approx. 20% of thepopulation, requiring swift and high-priority vaccination (see[9] and Supplementary Information (SI)). We model the av-erage number of epidemiologically relevant contacts betweenindividuals of one risk group to another risk group based onresults by the POLYMOD study, using the 65+ age group asa proxy for the “high-risk” group and the <65 age group for“low-risk” [27, 28]. While the official definition for “high-risk” begins at age 70, individuals with co-morbidities areclassified as “high-risk” as well, many of which belong to theage group 65-70 [29]. Based on empirical results, we expectthat approx. 75%-80% (i.e. 12 million people) of the high-riskgroup are willing to get vaccinated (see Fig. 4a). Additionally,we assume that 7 million individuals of the low-risk group areworkers in the health care sector and consequently are vac-cinated with high priority in concurrence with the high-riskpopulation [9].
We calibrate the model based on the reported daily inci-dence and COVID-19-related deaths in Germany in 2020,yielding plausible values of infection fatality rates (IFRs) of6.25% for the high-risk and 0.028% for the low-risk group[30], further details are provided in the SI. We find an in-groupbase reproduction number of 𝑅0 = 2.2 for the low-risk groupwhich we use to scale cross-group transmission rates accord-ingly (see SI). Additionally, we set an 83% probability of in-fected individuals to display symptoms of COVID-19 [31].
Vaccination protection is primarily aimed at preventing dis-ease and reducing COVID-19 deaths. Vaccines are expectedto be less effective with respect to preventing SARS-CoV-2infection [6–8, 15, 16]. A vaccinated person is almost fullyprotected against COVID-19 related death approx. 14 days af-ter receiving the first dose [8]. In the model we therefore setefficacy against death to be 99.9% after the first dose and in-crease it to 99.99% after two doses. We further expect that theefficacy against COVID-19 is 90% after the first dose as com-

4
pared to 95% after receiving the second dose [6, 7]. We im-plement values of a 50% reduction in susceptibility approx. 14days after receiving the first dose [8], and assume an increaseof susceptibility reduction to 60% after the second dose if ad-ministered according to the standard protocol, i.e. 21 days plus14 days after the first dose. We assume that vaccination fol-lowing the extended off-label protocol provides overall lessprotection against the disease compared to the standard andextended in-label protocols, respectively. These assumptionsare conservative and deliberately underestimate the effective-ness of the second dose when administered with a 12 weekdelay. Fixed at a lower level, we additionally assume thatvaccination protection does not decrease significantly in thefirst 12 weeks after receiving the first dose, and that, after 12weeks, the second dose only maintains this protection ratherthan increasing it.
The course of the pandemic over the next six months cannotbe predicted due to the complexity of the process and feed-back effects between pandemic dynamics, population behav-ioral changes, and policy measures [32, 33]. An importantempirical finding of the analysis of the pandemic in Germanyand other countries, however, is that while the epidemic un-folds, a dynamic equilibrium is achieved in which the natu-ral force of infection and response measures balance, caus-ing the effective reproduction number 𝑅(𝑡) to continuouslyfluctuate around the system-critical value 𝑅(𝑡) ≈ 1, a phe-nomenon known as self-organized criticality that has beenobserved in disease dynamical systems [34] and other com-plex dynamical systems [35, 36]. The statistical properties of𝑅(𝑡) fluctuations can therefore be used to generate long-termforecasts from quasi-stationary and temporally homogeneousdriven stochastic processes that resemble empirical incidencecurves.
With regard to the development of the pandemic in 2021,we therefore address three different basic scenarios based ontransmission rates that follow a stochastic process (see Fig. 2band SI). In the “improving” scenario, the expected incidencecontinues to decrease over the first and second quarter of2021, reaching a low, approximately constant level. In the“slow resurgence” scenario, the expected incidence ceases todecrease in the first quarter and increases again in the secondquarter. In the “fast resurgence” scenario, expected incidenceincreases again on a shorter time-scale, typically causing alarge epidemic wave in the second quarter or soon after. Notethat for each scenario, individual trajectories of the base re-production number 𝑅0 are stochastically simulated and there-fore individual incidence curves can substantially differ for afixed scenario (see SI for details). For each such realization,the model is analyzed with respect to different assumptions ofvaccine efficacy and vaccine distribution/administration pro-tocols. This approach permits a direct comparison of differentstrategies with respect to the same epidemic course in orderto clearly evaluate all possible dynamic effects of a change inprotocol. As an outcome, we measure the cumulative numberof deaths and cumulative number of symptomatic COVID-19cases in the high-risk group caused within the first 24 weeks(6 months) of the vaccine rollout.
III. RESULTS
We first investigated the extreme scarcity situation wherethe number of delivered doses in Q2 equals the low num-ber of delivered doses in Q1 (see Fig. 2). The course of thepandemic in the near future (Fig. 2b) has the most substan-tial impact on the success of a change in strategy in termsof the absolute number of high-risk-group deaths prevented(Fig. 2c). If the expected incidence decreases in the near fu-ture, vaccination according to the extended off-label proto-col (Fig. 2c.ii) will prevent an average of 3,700 deaths. Ifthe incidence resurges within the first six months of vaccineroll-out, an average of 14,600 deaths may be prevented byswitching to the extended off-label protocol, reaching a valueof 28,400 prevented deaths for a fast resurgence. These val-ues are reduced by 43% to 49% when the vaccination proto-col is changed to the extended in-label protocol instead (seeFig. 2c.i and Tab. I), resulting in 2,100-14,600 deaths pre-vented. The advantage of changing to extended protocols de-creases by ≤ 25% if more doses are available in the secondquarter (see Fig. 3 and Tab. II) but remain of similar order.Overall, we observe a highly correlated relationship betweenthe intensity of the epidemic and the success of a change inprotocol: the more intense the epidemic, the more deaths willbe prevented by delaying the second dose.
With respect to the number of symptomatic COVID-19cases in the high-risk group, a greater reduction can be ex-pected within the first six months of vaccine rollout shouldany of the extended protocols be implemented (Figs. 2c and3b), which is caused by the dramatic increase in the numberof people protected by the initial vaccine dose in spite of lowerefficacy. Note that the number of prevented COVID-19 casesis directly proportional to the fraction of infected individualsthat will display symptoms, which is an additional model pa-rameter (here chosen as 83%).
In general, the number of prevented symptomatic COVID-19 cases varies between simulations and scenarios. Never-theless, the model suggests the general rule: the worse thepandemic progresses in the near future, the more worthwhilea change in protocol. However, if the first half of 2021 is fol-lowed by another epidemic wave in the second half of the year,a higher number of symptomatic cases in the high-risk groupcan be expected under the off-label extended protocol com-pared to the standard protocol, because of assumed reducedvaccine efficacy. However, because protection against deathis nearly 100%, a substantial number of deaths will still beprevented.
A potential drawback of extended protocols is a negativeimpact on the population’s attitude towards COVID-19 vacci-nation. We therefore also examined the potential negative ef-fect that a publicly announced change in strategy may have onthe confidence of the population and, consequently, the will-ingness to vaccinate.
A survey experiment within the German COVID-19 Snap-shot Monitoring (wave 34, [37–39]) compared the standardprotocol to both extended in-label and off-label strategies(𝑁 = 1001; methods and data see ref. [40]). In a forced-choicesetting, 59.9% opted for the standard protocol, 30.3% for the

5
FIG. 2. Model results for extreme scarcity of vaccine supply (14 million doses in the first quarter (Q1) and 14 million doses in the secondquarter (Q2)). (a) Schematic of vaccine dose distribution to high priority individuals (12 million individuals in high-risk group and 7 millionindividuals in low-risk group). Note that for the standard protocol (a.i) and extended in-label protocol (a.ii) the same number of people canreceive the first dose in Q1 (7 million people). However, for the extended in-label protocol, all individuals received their first dose within6 weeks instead of 12 weeks. For the extended off-label protocol, the number of people that received the first dose in Q1 doubles. (b) Wesimulate three possible scenarios of the epidemic situation in the first months during the vaccine rollout. For each scenario, 1000 independentrealizations were computed. Details of the model are provided in the SI. Shown here are respective incidences for a scenario in which novaccines would be distributed, each lightly colored line represents a single simulation, grey lines are illustrative examples of single simulationsand black lines represent the mean over all simulations. Insets show the respective effective reproduction number. (b.i) “Improving” scenario:incidence decreases and remains on a low level during rollout. (b.ii) “Slow resurgence”: incidence rises after an initial decrease to cause alow third wave in the second quarter. (b.iii) “Fast resurgence”: incidence quickly resurges to cause large incidences in the second quarter. (c)Prevented high-risk group deaths and symptomatic cases when switching from baseline to extended protocols (refer to Tab. I)). (c.i) Followingthe extended in-label protocol instead of the standard protocol will save lives in the four- to low five-digit range. (c.ii) The number of savedlives and prevented symptomatic cases almost doubles when changing to the extended off-label protocol instead.
Epidemic Situation Improving Slow resurgence Fast resurgence
Prevented High-Risk... ...Deaths[in 1000]
...Symp.cases[in 1000]
...Deaths[in 1000]
...Symp.cases[in 1000]
...Deaths[in 1000]
...Symp.cases[in 1000]
Switch toextendedin-labelprotocol
mean 2.1 26 7.9 97 14.6 180
percentiles[2.5%, 97.5%]
[0.8, 5.2] [9, 64] [2.9, 15.5] [36, 191] [7.3, 22.2] [90, 272]
Switch toextendedoff-labelprotocol
mean 3.7 44 14.6 171 28.4 328
percentiles[2.5%, 97.5%]
[1.1, 9.7] [14, 114] [5.0, 30.4] [60, 351] [12.6, 47.0] [147, 539]
Tab. 1) Prevented deaths and prevented symptomatic cases in the high-risk group by switchingto any of the extended vaccination protocols, depending on how the epidemic unfolds withinthe first 6 months of the vaccine rollout. The numbers displayed here represent modelresults for a situation where in both the first and second quarter, 14 million vaccine dosesare available.
17
TABLE I. Additionally prevented deaths and prevented symptomatic cases in the high-risk group resulting from a switch to any of the extendedvaccination protocols (as compared to the standard protocol), depending on how the epidemic unfolds within the first 6 months of the vaccinerollout. The numbers displayed here represent model results for a situation where in both the first and second quarter, 14 million vaccine dosesare available.

6
FIG. 3. Model results for moderate scarcity of vaccine supply (14 million doses in the first quarter (Q1) and 46 million doses in the secondquarter (Q2)). (a) Detailed schematic of vaccine dose distribution. In Q1, doses are distributed in an equal manner to the “extreme scarcity”scenario displayed in Fig. 2a. In Q2, administering first doses to remaining high-priority individuals is prioritized while ensuring that individ-uals vaccinated with a first dose will receive a second dose within the defined time frames. After all eligible high-priority individuals havereceived their first and second doses, the remaining doses are administered to low-priority individuals. Note that in the extended protocols,the time at which all eligible high-priority individuals received their first dose is earlier in the extended protocols as for the baseline protocol.(b) Prevented high-risk group deaths and symptomatic cases when switching from standard to extended protocols (refer to Tab. II for exactnumerical values). (b.i) Following the extended in-label protocol instead of the standard protocol will save a number of lives in the four- to lowfive-digit range. (b.ii) The number of saved lives and prevented symptomatic cases almost doubles when changing to the extended off-labelprotocol instead.
extended in-label, and 8.6% extended off-label protocol (rest:missing). However, the decrease in the mean willingness toget vaccinated after learning about the delay of doses wasminimal and non-significant: of those willing to be vaccinatedbefore the change in strategies, the average willingness to getvaccinated decreased by 1.5% in the extended in-label, and3.1% in the extended off-label condition). In the relevant 65+age group, the change to the extended off-label protocol ledto a reduction of 5%. For the extended in-label protocol, wefound a small increase in the number of people willing to getvaccinated (Fig. 4a). However, the sample size in the higherage groups was rather small, so that the values reported abovemight be attributed to noise. Confidence in vaccine safety de-creased slightly in the off-label condition [41]. This change,however, did not explain the small decrease in the intention toget vaccinated in the off-label condition. Pre-existing vaccinehesitancy also did not affect the evaluation of the strategies. Insum, detrimental effects of the willingness to vaccinate wouldlikely be minimal.
Nevertheless, we compare the number of deaths preventedin the high-risk group by a protocol change, assuming thatsuch a change reduces the number of those willing to vac-cinate in the high-risk group by 5% and 10% (i.e. from 12million to 11.4 million and to 10.8 million, respectively), see
Fig. 4b. We find that even with a 5- to 10-percent reductionin those willing to get vaccinated, there is still a positive im-pact of a protocol change on the number of deaths as wellas prevented symptomatic cases. For a 10% reduction in theextended off-label protocol, the order of deaths prevented issimilar to that of deaths prevented switching to the extendedin-label protocol with a 0% reduction. Approximately, a 30%reduction in vaccination willingness is required to observenegative effects of the extended off-label protocol comparedto the standard protocol regarding the number of preventedCOVID-19 cases in the high-risk group (see SI).
If we assume that vaccine efficacy against disease after thefirst dose is only 80% and that this value is maintained, but notincreased, by administering the second dose after 12 weeks(which corresponds to a 100% increase in the assumed proba-bility of showing symptoms after infection), the absolute num-ber of symptomatic cases prevented by the change in strategydecreases by approximately 26-42%. Even if we increase thepost-vaccination IFR drastically by a factor of 50 (equivalentto reducing efficacy against death to 95%), the number of pre-vented deaths decreases only by 11–18% (see SI).
Conservatively, and because exact values are unknown atthe time of writing, we assumed a zero transmission reductionfor vaccinated, yet infected individuals. If we assumed large

7
Tab. 2) Prevented deaths and prevented symptomatic cases in the high-risk group resulting
from a switch to any of the extended vaccination protocols, depending on how the epidemic unfolds within the first 6 months of the vaccine rollout. The numbers displayed here represent model results for a situation where in the first quarter, 14 million vaccine doses are available, and in the second quarter, 46 million vaccine doses are available.
18
Epidemic Situation Improving Slow resurgence Fast resurgence
Prevented High-Risk... ...Deaths [in 1000]
...Symp. cases [in 1000]
...Deaths [in 1000]
...Symp. cases [in 1000]
...Deaths [in 1000]
...Symp. cases [in 1000]
Switch to extended in-label protocol
mean 2.0 25 6.7 85 12.5 160
percentiles [2.5%, 97.5%]
[0.7, 4.3] [8, 55] [2.4, 13.9] [31, 177] [5.9, 21.7] [74, 276]
Switch to extended off-label protocol
mean 3.2 38 11.6 134 22.3 255
percentiles [2.5%, 97.5%]
[0.9, 7.6] [11, 88] [4.0, 24.8] [46, 286] [9.7, 40.9] [113, 465]
TABLE II. Additionally prevented deaths and prevented symptomatic cases in the high-risk group resulting from a switch to any of theextended vaccination protocols (as compared to the standard protocol), depending on how the epidemic unfolds within the first 6 months ofvaccine rollout. The numbers displayed here represent model results for a situation where in the first quarter, 14 million vaccine doses areavailable, and in the second quarter, 46 million vaccine doses are available.
FIG. 4. (a) Results of the online survey. Participants’ intention to get vaccinated was collected pre and post manipulation (on a 7 point scale, 1= not at all vaccinate, 7 = definitely vaccinate; the figure shows the fraction of participants scoring ≥ 5). They were randomly allocated to threeconditions, describing the standard protocol, the extended in-label and extended off-label protocol with preliminary values of their expectedconsequences (shifting the second dose to 6 vs. 12 weeks after the first dose and preventing 1,000-8,000 or 2,000-13,000 deaths in the next sixmonths, respectively). It was stated that it was still unclear whether the delay of the second dose makes the vaccination less effective overall,but that it is considered unlikely. It was also added whether the delay was in accordance with the licensure. The intention to get vaccinatedafter learning about the extended protocols did not change substantially and at a maximum of 5% (participants 65+ in the off-label group).Materials and data at [40]. (b) Model results assuming that switching protocols to the extended off-label protocol decreases the number ofhigh-risk individuals willing to vaccinate by 5% and 10%, respectively. Even with a 10% reduction in adherence, the number of lives savedand symptomatic cases prevented would still exceed those resulting from a switch to the extended in-label protocol (Fig. 3b.i).
transmission reductions (90% for both doses), the number ofprevented deaths and prevented symptomatic cases would in-crease by a low percentage for both extended in-label and off-label protocols. If, instead, we analyzed an extreme and un-balanced scenario where the first dose does not reduce trans-mission probability for such individuals but the second dose
reduces transmission by 90%, a switch to extended proto-cols would still be beneficial, but would reduce the preventeddeaths and cases by 13–30% as compared to results obtainedusing the original assumptions.
These analyses suggest that earlier protection of a largergroup of high-risk individuals has a greater systemic protec-

8
tive effect in a hypothetical off-label vaccination protocol,even if switching protocols might lead to a reduction in vac-cine adherence or vaccine efficacy.
IV. DISCUSSION AND CONCLUSION
The results suggest that switching to an alternative vac-cination strategy (12-week delay of the second dose) of thecurrently available mRNA vaccines against COVID-19 couldprevent an additional number of deaths in the four to five digitrange for hypothetical vaccine rollout scenarios in Germany.Such benefits are reached should incidence resurge, for in-stance in the case of the spread of one of the recently discov-ered more contagious viral variants—given that the existingvaccines are effective against these variants. This is true evenfor a low reduction in willingness to vaccinate induced by achange in protocol. A switch to extended protocols is evenmore beneficial when supply of vaccines remains limited. Ifnonpharmaceutical interventions show effect in the first halfof 2021 and the incidence remains low over the first half of2021, however, the number of deaths prevented by a changein protocol drops to lower values in the three- to four-digitrange. The respective values are likewise reduced if vaccineefficacy is lower than anticipated but remain of similar magni-tude nonetheless. If a change in strategy were adopted, dam-age to vaccine confidence and willingness to get vaccinatedneeds to be prevented. Results of the online survey in Ger-many showed that protocol changes would likely have onlyminimal detrimental effects on the willingness to get vacci-nated. However, a shift in protocols would increase the needfor communication measures as the survey also showed thatdeviating from the standard protocol was not the best pre-ferred solution despite a high number of deaths prevented. Inthe course of a feasibility study it could be determined, for ex-ample, to what extent a voluntary three-month waiver of thesecond dose allows additional vaccinations without reducingthe willingness to vaccinate, and whether the higher vaccina-tion rate achieved in this way justifies potential other risks.
Risks related to delaying the second dose of vaccinationwhich are not considered here include (i) the possibility ofinfection enhancing antibodies (antibody dependent enhance-ment, ADE), (ii) the increased likelihood of the developmentof escape mutations of the virus, and (iii) that the high efficacyof the first dose does not persist.
ADE has not been shown after vaccination so far, neitherafter first nor second dose. Given the large number of peo-ple immunized so far and that ADE is likely to occur earlyin the course of vaccination, the risk appears to be small. Anincreased mutation pressure through the combination of im-perfect immunity and high case loads (peak risk) cannot beruled out. However, it is unclear if the delay of the seconddose increases or decreases mutation pressure, since an earlyfirst dose reduces case load but may at the same time increaseselection pressure, the net effect being unclear. Loss of pro-tection of neutralizing antibody titers between first and sec-ond dose in extended second dose protocols is possible butunlikely given high titers following first dose mRNA vaccina-tion.
Despite the benefits and advantages of changing the stan-dard protocol and delaying the second dose that persist evenif vaccination adherence should drop in response to chang-ing protocols, the results must be viewed as part of a widercontext and must be carefully weighed against a number ofrisks that are difficult to quantify and beyond the scope of thecurrent analysis. In fact, the model does not account for sev-eral of the widely discussed and difficult-to-calculate risks ofpostponing the second vaccination that must be taken into ac-count when viewed as part of a practical public health guideline. The current model is limited and intentionally designedto estimate the epidemiological consequences in terms of theexpected change in the number of deaths and COVID-19 casesonly, and helps with the assessment of how benefits or disad-vantages may depend on parameters of the system.
ACKNOWLEDGMENTS
BFM is financially supported as an Add-On Fellow for In-terdisciplinary Life Science by the Joachim Herz Stiftung.MMH was supported by the European Union’s Horizon 2020research and innovation programme under grant agreementNo 101003480 and by German Federal Ministry of Educationand Research within the project CoViDec (FKZ: 01KI20102).We express our gratitude to C. Drosten for helpful com-ments during the research process. BFM would like to thankW. Wu for productive discussions. DB would like to thankI. Mortimer and V. Hardapple for valuable comments on themanuscript.
[1] Israel Ministry of Health. Corona virus in Israel - general situ-ation, 2021. URL embedded in PDF.
[2] Commissario straordinario per l’emergenza Covid-19 Presi-denza del Consiglio dei Ministri. Covid-19 Opendata Vaccines,January 2021. URL embedded in PDF.
[3] Pflege und Konsumentenschutz Bundesministerium fürSoziales, Gesundheit. Corona-Schutzimpfung in österreich,2021. URL embedded in PDF.
[4] Santé publique France. Données relatives aux personnes vac-cinées contre la Covid-19 (VAC-SI), January 2021. URL em-
bedded in PDF.[5] Robert Koch Institute. Digitales Impfquotenmonitoring zur
COVID-19-Impfung, 2021. URL embedded in PDF.[6] Fernando P. Polack, Stephen J. Thomas, Nicholas Kitchin, Ju-
dith Absalon, Alejandra Gurtman, Stephen Lockhart, John L.Perez, Gonzalo Pérez Marc, Edson D. Moreira, CristianoZerbini, Ruth Bailey, Kena A. Swanson, Satrajit Roychoud-hury, Kenneth Koury, Ping Li, Warren V. Kalina, David Cooper,Robert W. Frenck, Laura L. Hammitt, Özlem Türeci, Hay-lene Nell, Axel Schaefer, Serhat Ünal, Dina B. Tresnan, Su-
9
san Mather, Philip R. Dormitzer, Ugur Sahin, Kathrin U.Jansen, and William C. Gruber. Safety and Efficacy of theBNT162b2 mRNA Covid-19 Vaccine. New England Jour-nal of Medicine, 383(27):2603–2615, December 2020. doi:10.1056/NEJMoa2034577. URL embedded in PDF.
[7] Merryn Voysey, et al. Safety and efficacy of the ChAdOx1nCoV-19 vaccine (AZD1222) against SARS-CoV-2: an interimanalysis of four randomised controlled trials in Brazil, SouthAfrica, and the UK. The Lancet, 397(10269):99–111, January2021. doi:10.1016/S0140-6736(20)32661-1. URL embeddedin PDF.
[8] Gabriel Chodcik, Lilac Tene, Tal Patalon, Sivan Gazit, AmirBen-Tov, Dani Cohen, and Khitam Muhsen. The effective-ness of the first dose of BNT162b2 vaccine in reducing SARS-CoV-2 infection 13-24 days after immunization: real-world ev-idence. medRxiv, Infectious Diseases (except HIV/AIDS), Jan-uary 2021. URL embedded in PDF.
[9] Sabine Vygen-Bonnet, Judith Koch, Christian Bogdan, ThomasHarder, Ulrich Heininger, Kerstin Kling, Martina Littmann, Jo-erg Meerpohl, Heidi Meyer, Thomas Mertens, Nora Schmid-Küpke, Stefan Scholz, Martin Terhardt, Marina Treskova-Schwarzbach, Klaus Überla, Marianne Van Der Sande, OleWichmann, Sabine Wicker, Ursula Wiedermann, Verina Wild,and Rüdiger Von Kries. Beschluss und WissenschaftlicheBegründung der Ständigen Impfkommission (STIKO) fürdie COVID-19-Impfempfehlung. December 2020. doi:10.25646/7755. URL embedded in PDF.
[10] Jared Bullard, Kerry Dust, Duane Funk, James E Strong,David Alexander, Lauren Garnett, Carl Boodman, Alexan-der Bello, Adam Hedley, Zachary Schiffman, Kaylie Doan,Nathalie Bastien, Yan Li, Paul G Van Caeseele, and GuillaumePoliquin. Predicting Infectious Severe Acute Respiratory Syn-drome Coronavirus 2 From Diagnostic Samples. Clinical In-fectious Diseases, 71(10):2663–2666, December 2020. ISSN1058-4838, 1537-6591. doi:10.1093/cid/ciaa638. URL embed-ded in PDF.
[11] Interim recommendations for use of the Moderna mRNA-1273vaccine against COVID-19, January 2021. URL embedded inPDF.
[12] Interim recommendations for use of the Pfizer– BioNTechCOVID-19 vaccine, BNT162b2, under Emergency Use Listing,January 2021. URL embedded in PDF.
[13] Kamal Abu Jabal, Hila Ben-Amram, Karine Beiruti, Yu-nis Batheesh, Christian Sussan, Salman Zarka, and MichaelEdelstein. Impact of age, ethnicity, sex and prior infec-tion status on immunogenicity following a single dose of theBNT162b2 mRNA COVID-19 vaccine: real-world evidencefrom healthcare workers, Israel, December 2020 to January2021. Eurosurveillance, 26(6):2100096, February 2021. doi:10.2807/1560-7917.ES.2021.26.6.2100096. European Centrefor Disease Prevention and Control. URL embedded in PDF.
[14] Jon Cohen. One-dose COVID-19 vaccine offers solid protec-tion against severe disease, Science, January 2021. URL em-bedded in PDF.
[15] Sharon Amit, Gili Regev-Yochay, Arnon Afek, Yitshak Kreiss,and Eyal Leshem. Early rate reductions of SARS-CoV-2 in-fection and COVID-19 in BNT162b2 vaccine recipients. TheLancet, February 2021. ISSN 0140-6736, 1474-547X. doi:10.1016/S0140-6736(21)00448-7. URL embedded in PDF.
[16] Public Health England. Annex A: Report to JCVI on esti-mated efficacy of a single dose of Pfizer BioNTech (BNT162b2mRNA) vaccine and of a single dose of ChAdOx1 vaccine(AZD1222), 2021.
[17] Department of Health and Social Care. Priority groups for coro-navirus (COVID-19) vaccination: advice from the JCVI, 30 De-cember 2020, December 2020. URL embedded in PDF.
[18] Science advisers: publish evidence behind COVID vaccine dos-ing strategy. Nature, 589(7841):169–170, January 2021. doi:10.1038/d41586-021-00045-8. URL embedded in PDF. Num-ber: 7841 Publisher: Nature Publishing Group.
[19] Gareth Iacobucci and Elisabeth Mahase. Covid-19 vacci-nation: What’s the evidence for extending the dosing inter-val? BMJ, 372:n18, January 2021. ISSN 1756-1833. doi:10.1136/bmj.n18. URL embedded in PDF. Publisher: BritishMedical Journal Publishing Group Section: News.
[20] Herb F Sewell, John F R Robertson, Marcia Stewart, DeniseKendrick, and Sheila M Bird. Revisiting the UK’s strategy fordelaying the second dose of the Pfizer covid-19 vaccine. TheBMJ Opinion. January 2021. URL embedded in PDF.
[21] Xutong Wang, Zhanwei Du, Kaitlyn E. Johnson, Spencer J.Fox, Michael Lachmann, Jason S. McLellan, and Lauren An-cel Meyers. The impacts of COVID-19 vaccine timing, num-ber of doses, and risk prioritization on mortality in the US.medRxiv, page 2021.01.18.21250071, January 2021. doi:10.1101/2021.01.18.21250071. URL embedded in PDF.
[22] European Medicines Agency. Clarification of Comirnatydosage interval, January 2021. URL embedded in PDF.
[23] Federal Ministry of Health of Germany. Informationen zurImpfstoffbeschaffung gegen COVID-19. Technical report,February 2021.
[24] Roy M. Anderson and Robert M. May. Infectious diseases ofhumans: dynamics and control. Oxford Univ. Press, Oxford,reprinted edition, 2010. ISBN 978-0-19-854040-3.
[25] Matt J Keeling and Pejman Rohani. Modeling infectious dis-eases in humans and animals. Princeton University Press,Princeton, 2011. ISBN 978-1-4008-4103-5. URL embeddedin PDF.
[26] Sahamoddin Khailaie, Tanmay Mitra, Arnab Bandyopadhyay,Marta Schips, Pietro Mascheroni, Patrizio Vanella, Berit Lange,Sebastian C. Binder, and Michael Meyer-Hermann. Devel-opment of the reproduction number from coronavirus SARS-CoV-2 case data in Germany and implications for politicalmeasures. BMC Medicine, 19(1):32, January 2021. doi:10.1186/s12916-020-01884-4. URL embedded in PDF.
[27] Joël Mossong, Niel Hens, Mark Jit, Philippe Beutels,Kari Auranen, Rafael Mikolajczyk, Marco Massari, StefaniaSalmaso, Gianpaolo Scalia Tomba, Jacco Wallinga, JannekeHeijne, Malgorzata Sadkowska-Todys, Magdalena Rosinska,and W. John Edmunds. Social Contacts and Mixing Pat-terns Relevant to the Spread of Infectious Diseases. PLOSMedicine, 5(3):e74, March 2008. ISSN 1549-1676. doi:10.1371/journal.pmed.0050074. URL embedded in PDF.
[28] Sebastian Funk. socialmixr: R package for deriving social mix-ing matrices from survey data, November 2020. URL embed-ded in PDF.
[29] Amber L. Mueller, Maeve S. McNamara, and David A. Sinclair.Why does COVID-19 disproportionately affect older people?Aging, 12(10):9959–9981, May 2020. ISSN 1945-4589. doi:10.18632/aging.103344. URL embedded in PDF.
[30] Andrew T. Levin, William P. Hanage, Nana Owusu-Boaitey,Kensington B. Cochran, Seamus P. Walsh, and GideonMeyerowitz-Katz. Assessing the age specificity of infection fa-tality rates for COVID-19: systematic review, meta-analysis,and public policy implications. European Journal of Epidemi-ology, 35(12):1123–1138, December 2020. ISSN 0393-2990,1573-7284. doi:10.1007/s10654-020-00698-1. URL embeddedin PDF.

10
[31] Oyungerel Byambasuren, Magnolia Cardona, Katy Bell, JustinClark, Mary-Louise McLaws, and Paul Glasziou. Estimatingthe extent of asymptomatic COVID-19 and its potential forcommunity transmission: Systematic review and meta-analysis.Official Journal of the Association of Medical Microbiology andInfectious Disease Canada, 5(4):223–234, December 2020.ISSN 2371-0888. doi:10.3138/jammi-2020-0030. URL em-bedded in PDF.
[32] John P.A. Ioannidis, Sally Cripps, and Martin A. Tanner. Fore-casting for COVID-19 has failed. International Journal ofForecasting, page S0169207020301199, August 2020. ISSN01692070. doi:10.1016/j.ijforecast.2020.08.004. URL embed-ded in PDF.
[33] Bastian Prasse, Massimo A Achterberg, and Piet Van Mieghem.Fundamental Limits of Predicting Epidemic Outbreaks. Tech-nical Report report2020410, Delft University of Technology,April 2020. URL embedded in PDF.
[34] S. Funk, E. Gilad, C. Watkins, and V. A. A. Jansen. Thespread of awareness and its impact on epidemic outbreaks.Proceedings of the National Academy of Sciences, 106(16):6872–6877, April 2009. ISSN 0027-8424, 1091-6490. doi:10.1073/pnas.0810762106. URL embedded in PDF.
[35] Per Bak, Chao Tang, and Kurt Wiesenfeld. Self-organized criti-cality: An explanation of the 1/f noise. Physical Review Letters,59(4):381–384, July 1987. doi:10.1103/PhysRevLett.59.381.URL embedded in PDF.
[36] Per Bak and Kim Sneppen. Punctuated equilibrium andcriticality in a simple model of evolution. Physical Re-view Letters, 71(24):4083–4086, December 1993. doi:10.1103/PhysRevLett.71.4083. URL embedded in PDF.
[37] Cornelia Betsch, Lothar H Wieler, and Katrine Habersaat. Mon-itoring behavioural insights related to COVID-19. The Lancet,395(10232):1255–1256, April 2020. ISSN 01406736. doi:10.1016/S0140-6736(20)30729-7. URL embedded in PDF.
[38] Cornelia Betsch, Lothar Wieler, Michael Bosnjak, MichaelRamharter, Volker Stollorz, Saad Omer, Lars Korn, PhilippSprengholz, Lisa Felgendreff, Sarah Eitze, and Philipp Schmid.Germany COVID-19 Snapshot Monitoring (COSMO Ger-many): Monitoring knowledge, risk perceptions, preventive be-haviours, and public trust in the current coronavirus outbreakin Germany. March 2020. doi:10.23668/psycharchives.2776.URL embedded in PDF. Accepted: 2020-03-03T13:41:21ZPublisher: PsychArchives.
[39] Cornelia Betsch. Ergebnisse aus dem COVID-19 SnapshotMOnitoring COSMO: Die psychologische Lage. TechnicalReport 34 Wellen KW 04, Universität Erfurt - PhilosophischeFakultät. URL embedded in PDF.
[40] Cornelia Betsch, Lars Korn, Philipp Sprengholz, Dirk Brock-mann, Benjamin F. Maier, Angelique Burdinski, and AnnikaRose. Consequences of postponing the second vaccine dose: amodel analysis. January 2021. doi:None. URL embedded inPDF.
[41] Cornelia Betsch, Philipp Schmid, Dorothee Heinemeier, LarsKorn, Cindy Holtmann, and Robert Böhm. Beyond con-fidence: Development of a measure assessing the 5C psy-chological antecedents of vaccination. PLOS ONE, 13(12):e0208601, December 2018. ISSN 1932-6203. doi:10.1371/journal.pone.0208601. URL embedded in PDF.
[42] Kevin Heng and Christian L. Althaus. The approximatelyuniversal shapes of epidemic curves in the Susceptible-Exposed-Infectious-Recovered (SEIR) model. Scientific Re-ports, 10(1):19365, November 2020. ISSN 2045-2322. doi:10.1038/s41598-020-76563-8. URL embedded in PDF.
[43] J Wallinga and M Lipsitch. How generation intervals shape therelationship between growth rates and reproductive numbers.Proceedings of the Royal Society B: Biological Sciences, 274(1609):599–604, February 2007. doi:10.1098/rspb.2006.3754.URL embedded in PDF.
[44] “Fallzahlen in Deutschland,” Robert Koch Institute.[45] H. Streeck et al., “Infection fatality rate of SARS-CoV-2 in-
fection in a German community with a super-spreading event,”medRxiv, Infectious Diseases (except HIV/AIDS), May 2020.
[46] C. Santos-Hövener et al., “Seroepidemiologische Studie zurVerbreitung von SARS-CoV-2 in der Bevölkerung an beson-ders betroffenen Orten in Deutschland – Studienprotokoll vonCORONA-MONITORING lokal,” Sept. 2020.
[47] Robert Koch Institute. Fallzahlen in Deutschland. Data, RobertKoch Institute (RKI). URL embedded in PDF.
[48] Hendrik Streeck, Bianca Schulte, Beate M. Kümmerer, EnricoRichter, Tobias Höller, Christine Fuhrmann, Eva Bartok, Ra-mona Dolscheid, Moritz Berger, Lukas Wessendorf, MonikaEschbach-Bludau, Angelika Kellings, Astrid Schwaiger, Mar-tin Coenen, Per Hoffmann, Birgit Stoffel-Wagner, Markus M.Nöthen, Anna-Maria Eis-Hübinger, Martin Exner, Ri-carda Maria Schmithausen, Matthias Schmid, and GuntherHartmann. Infection fatality rate of SARS-CoV-2 infection ina German community with a super-spreading event. medRxiv,Infectious Diseases (except HIV/AIDS), May 2020. URL em-bedded in PDF.
[49] Claudia Santos-Hövener, Markus A. Busch, CarmenKoschollek, Martin Schlaud, Jens Hoebel, Robert Hoff-mann, Hendrik Wilking, Sebastian Haller, Jennifer Allen,Jörg Wernitz, Hans Butschalowsky, Tim Kuttig, SilkeStahlberg, Julia Strandmark, Angelika Schaffrath-Rosario,Antje Gößwald, Andreas Nitsche, Victor Cormann, OsamahHamouda, Lothar H. Wieler, Christian H. M. Drosten, LarsSchaade, and Thomas Lampert. Seroepidemiologische Studiezur Verbreitung von SARS-CoV-2 in der Bevölkerung anbesonders betroffenen Orten in Deutschland – Studienprotokollvon CORONA-MONITORING lokal. September 2020.doi:10.25646/7052.4. URL embedded in PDF.
[50] S. Funk and V. A. A. Jansen, “The Talk of the Town: Modellingthe Spread of Information and Changes in Behaviour,” in Mod-eling the Interplay Between Human Behavior and the Spreadof Infectious Diseases (P. Manfredi and A. D’Onofrio, eds.),pp. 93–102, New York, NY: Springer, 2013.
[51] N. G. Davies et al., “Effects of non-pharmaceutical interven-tions on COVID-19 cases, deaths, and demand for hospital ser-vices in the UK: a modelling study,” The Lancet Public Health,vol. 5, pp. e375–e385, July 2020.
[52] Sebastian Funk and Vincent A. A. Jansen. The Talk of theTown: Modelling the Spread of Information and Changes inBehaviour. In Piero Manfredi and Alberto D’Onofrio, edi-tors, Modeling the Interplay Between Human Behavior and theSpread of Infectious Diseases, pages 93–102. Springer, NewYork, NY, 2013. ISBN 978-1-4614-5474-8. doi:10.1007/978-1-4614-5474-8_6. URL embedded in PDF.
[53] Nicholas G. Davies, Adam J. Kucharski, Rosalind M. Eggo,Amy Gimma, W. John Edmunds, Thibaut Jombart, KathleenO’Reilly, Akira Endo, Joel Hellewell, Emily S. Nightingale,Billy J. Quilty, Christopher I. Jarvis, Timothy W. Russell,Petra Klepac, Nikos I. Bosse, Sebastian Funk, Sam Abbott,Graham F. Medley, Hamish Gibbs, Carl A. B. Pearson, Ste-fan Flasche, Mark Jit, Samuel Clifford, Kiesha Prem, Char-lie Diamond, Jon Emery, Arminder K. Deol, Simon R. Proc-ter, Kevin van Zandvoort, Yueqian Fiona Sun, James D. Mun-day, Alicia Rosello, Megan Auzenbergs, Gwen Knight, Rein

11
M. G. J. Houben, and Yang Liu. Effects of non-pharmaceuticalinterventions on COVID-19 cases, deaths, and demand for hos-pital services in the UK: a modelling study. The Lancet Pub-lic Health, 5(7):e375–e385, July 2020. ISSN 2468-2667. doi:10.1016/S2468-2667(20)30133-X. URL embedded in PDF.
[54] Frank Schlosser, Benjamin F. Maier, Olivia Jack, David Hin-richs, Adrian Zachariae, and Dirk Brockmann. COVID-19lockdown induces disease-mitigating structural changes in mo-bility networks. Proceedings of the National Academy of Sci-ences, 117(52):32883–32890, December 2020. ISSN 0027-8424, 1091-6490. doi:10.1073/pnas.2012326117. URL embed-ded in PDF. Publisher: National Academy of Sciences Section:Physical Sciences.
[55] Colin J. Carlson, Ana C. R. Gomez, Shweta Bansal, and Sadie J.Ryan. Misconceptions about weather and seasonality must notmisguide COVID-19 response. Nature Communications, 11(1):4312, August 2020. ISSN 2041-1723. doi:10.1038/s41467-020-18150-z. URL embedded in PDF.
[56] Benjamin F. Maier. epipack: Fast prototyping of epidemiologi-cal models, January 2021. URL embedded in PDF.
[57] Benjamin F. Maier and Angelique Burdinski. devacc: A modelto evaluate the potential benefits of delaying the second mRNACOVID-19 vaccine dose, February 2021. URL embedded inPDF.
SUPPLEMENTARY INFORMATION
Appendix A: Model
We first define a deterministic compartmental infectionmodel based on a susceptible-exposed-infected-recovered(SEIR) model with additional compartments for vaccinationstatus and parallel counting of symptomatic cases, confirmedcases, and fatalities. We further consider the population to bestructured according to risk-group affiliation. Such models arewell-established and -studied [24, 25].
In this model, individuals are part of either low-risk (𝑌 ) orhigh-risk (𝐴) groups of sizes 𝑁𝑌 = const. and 𝑁𝐴 = const.,respectively, such that the total population size is given asN = 𝑁𝑌 + 𝑁𝐴. An affiliation with group 𝑎 will be denotedby a superscript (·)𝑎 in the following but will rarely be usedexplicitly because individuals cannot change status betweenthese population groups by any means.
Initially, all individuals of group 𝑎 are “susceptible” withprotection level zero (received zero vaccine doses), i.e. arepart of compartment 𝑆𝑎0 ≡ 𝑆0 (note that we also denote theprobability of any person of group 𝑎 to be susceptible as0 ≤ 𝑆𝑎0 ≤ 1 and similarly for other compartments). Individ-uals may be vaccinated according to three protocols. In thestandard protocol, people are vaccinated with a single dose,while the second dose is given out immediately but held backfor approximately three weeks to be given to the same person.This dose therefore cannot be used on other individuals dur-ing this time. In the “extended in-label protocol”, a person isvaccinated with a single dose, but the second dose will not beheld back. Instead, the remaining dose is administered to asecond person. After 42 days, a second dose will be given toboth individuals, which represents the maximal time betweenthe administration of two doses by the BNT162b2 vaccine for
the vaccination to be considered “in-label”, i.e. administeredas recommended by the manufacturer. The third, “extendedoff-label protocol” postpones the second dose for 12 weeks,i.e. 84 days, which is considered an “off-label” vaccinationbut allows one to give twice as many individuals a first pro-tection in the first quarter when vaccine doses are scarce. Notethat throughout this paper, we define a quarter to have a dura-tion of 84 days and 6 months to comprise 168 days.
Model equations will be defined in separate but consecutivephases that are defined for time intervals [𝑡0, 𝑡0 +𝑇). The totalamount of remaining vaccine doses at time 𝑡 will be denotedas 𝑀𝑎
1 (𝑡) for the first shot in the extended protocols, 𝑀𝑎2 (𝑡)
for all doses administered according to the standard protocol,and 𝑀𝑎
3 (𝑡) denoting the number of doses reserved for secondshots in the extended protocols. We assume a constant vaccinesupply rate and therefore a linear depletion of both vaccinedoses and susceptibles with rates
a𝑎1 =𝑛𝑎1𝑇
`𝑎2 =𝑛𝑎2𝑇
a𝑎2 =𝑛𝑎3𝑇
such that
𝑑
𝑑𝑡𝑀𝑎
1 = −a𝑎1𝑑
𝑑𝑡𝑀𝑎
2 = −`𝑎2𝑑
𝑑𝑡𝑀𝑎
3 = −a𝑎2
where
𝑀𝑎1 (𝑡0) = 𝑛
𝑎1
𝑀𝑎2 (𝑡0) = 𝑛
𝑎2
𝑀𝑎3 (𝑡0) = 𝑛
𝑎3 .
Here, 𝑛𝑎𝑖
refers to the total number of vaccine doses avail-able to population group 𝑎 following shot 𝑖. Upon receivinga vaccine dose, a susceptible individual transitions to either𝐺0 (extended protocols) or 𝑍0 (standard protocol). In manycountries, the employed vaccine roll-out strategies do not re-quire individuals to prove that they have not yet been infectedwith SARS-CoV-2. Therefore, we consider two parallel vac-cine rollouts and divide the population in “never had a SARS-CoV-2 infection” (denoted by default compartment symbolssuch as 𝑆0) and “currently are infected with SARS-CoV-2 orhave been infected in the past” (denoted by overlined com-partment symbols 𝑆0). When picking a non-vaccinated in-dividual to be vaccinated at random, the probability to picka truly susceptible person is 𝑆0/(𝑆0 + 𝑆0), which means thatthe vaccine-related depletion of individuals with vaccine sta-tus zero is given as
𝑑
𝑑𝑡𝑆0 = −
( a1𝑁
+ `22𝑁
) 𝑆0
𝑆0 + 𝑆0−𝜙0𝑆0.

12
FIG. 5. Schematic figure of the parallel infection/vaccination dynamics. Initially, an individual is fully susceptible to infection (𝑆𝑎0 ). A personmight become infected with rate 𝜙𝑎0 , at which point it transitions to the infection dynamics that are run in parallel to the vaccination dynamics.Parallel counting is introduced here because in Germany, infection status is not checked when administering vaccines, i. e. vaccines will bedistributed equally to people that already went through the infection process. In order to simplify notation, we count infected individualsdouble, once to be regarded in the infection process and once to be regarded for the vaccination process. Individuals that received the firstdose obtain a first protection level about 14 days after. Following the standard protocol (doses depleted from 𝑀𝑎
2 , right arm of the schema),first-level protected individuals will receive the second, reserved dose 7 days after and reach the second protection level after an additional14 days. Note that while 𝑀𝑎
2 is linearly depleted with rate `𝑎2 , the number of corresponding individuals with first-level protection increasesonly with rate `𝑎2 /2 which reflects that per first-dose individual, two doses are depleted from the available vaccine stock. In the extendedprotocols (left arm of the schema), the second dose is administered according to a phase- and risk-specific reservoir for second doses (𝑀𝑎
3 ).Depending on phase-specific definitions, individuals receive a first- or second-level protection by the second dose. An individual’s infectionstatus is determined by its risk group affiliation 𝑎 and protection level 𝜎. For each 𝜎 and 𝑎, susceptibility is reduced by a specific value 𝑟𝑎𝜎 . Ifinfected, an individual first reaches the “exposed” status 𝐸𝑎
𝜎 . From there, it progresses to the “infectious” status 𝐼𝑎𝜎 after an average durationof 1/𝛼, from which they will be “removed” after an average duration of 1/𝛽. A fraction 𝑝𝑎𝜎 of removed individuals will have had symptoms(classified as 𝐶𝑎
𝜎) and a fraction 𝑑𝑎𝜎 of removed individuals will have had fatal outcomes. In parallel, individuals that become infectious willbe counted after an average reporting delay of 𝜏𝑅 by entering the 𝑋𝑎
𝜎 compartment.
Note that following the standard protocol, only half the num-ber of people can be vaccinated per day initially as comparedto the extended protocol (as explained above), hence a factor1/2 is introduced. The transitional term 𝜙0𝑆0 accounts for in-fections that happen in parallel to the vaccination process. Wewill define the force of infection 𝜙𝑎𝜎 ≡ 𝜙𝜎 further below. Note
that the depletion of already infected individuals is given as
𝑑
𝑑𝑡𝑆0 = −
( a1𝑁
+ `22𝑁
) 𝑆0
𝑆0 + 𝑆0+𝜙0𝑆0.
In the following we will omit the explicit definitions ofchanges in infectious/infected counterparts (·), as their equa-tions of motion are equal to their respective non-infected
13
counterparts bar an opposite sign in the infection terms.Individuals that received the first dose (i.e. are part of 𝑍0,
𝐺0, or their respective overlined counterparts) are reachingprotection with protection level 1 after an average duration of𝜏𝑀 = 14d such that
𝑑
𝑑𝑡𝐺0 =
a1𝑁
𝑆0
𝑆0 + 𝑆0− 1𝜏𝑀
𝐺0 −𝜙0𝐺0,
𝑑
𝑑𝑡𝑍0 =
`22𝑁
𝑆0
𝑆0 + 𝑆0− 1𝜏𝑀
𝑍0 −𝜙0𝑍0.
A person that was vaccinated according to the standard pro-tocol will receive the second dose approximately 𝜏𝐷 = 21d−𝜏𝑀 = 7d after reaching the first protection level. Afterwards, ittakes another 𝜏𝑀 days to reach protection level 2. The remain-ing equations of motion for all standard-protocol individualstherefore read
𝑑
𝑑𝑡𝑉1 =
1𝜏𝑀
𝑍0 −1𝜏𝐷𝑉1 −𝜙1𝑉1
𝑑
𝑑𝑡𝑍1 = − 1
𝜏𝑀𝑍1 +
1𝜏𝐷𝑉1 −𝜙1𝑍1
𝑑
𝑑𝑡𝑉2 =
1𝜏𝑀
𝑍1 −𝜙2𝑉2.
Regarding the extended protocols, individuals that receivedthe first dose and obtained the first protection level remain incompartment 𝑊1 until they are vaccinated again with rate a2in a consecutive phase. The equations of motion read
𝑑
𝑑𝑡𝑊1 =
1𝜏𝑀
𝐺0 −a2𝑁
𝑊1
𝑊1 +𝑊1−𝜙1𝑊1,
𝑑
𝑑𝑡𝐺1 =
a2𝑁
𝑊1
𝑊1 +𝑊1−𝜙1𝐺1 −
1𝜏𝑀
𝐺1
𝑑
𝑑𝑡𝐾1 =
{1𝜏𝑀𝐺1 −𝜙1𝐾1 > 6 weeks postponed,
−𝜙1𝐾1 ≤ 6 weeks postponed,
𝑑
𝑑𝑡𝐾2 =
{−𝜙2𝐾2 > 6 weeks postponed,
1𝜏𝑀𝐺1 −𝜙2𝐾2 ≤ 6 weeks postponed.
Even though individuals of compartment 𝑊1 receive a sec-ond dose after 12 weeks, we will conservatively assume thatpostponing the second dose merely upholds the protectionachieved by the first dose and does not enhance it when ad-ministered after a duration longer than 6 weeks (as such aprocedure is an off-label vaccination). For vaccinations by thein-label extended protocol, we instead assume that the secondprotection level is reached.
In total, we have
𝑑
𝑑𝑡
(𝑆0 +𝐺0 + 𝑍0 +𝐺1 +𝑊1 + 𝑍1 +𝐾1 +𝑉1 +𝑉2 +𝐾2 + i.c.
)= 0,
such that the total number of people in each population groupremains constant (here, “i.c.” refers to “infectious counter-parts”, i.e. the respective overlined compartments). Note thatwe define the sum in the equation above to be equal to 1.
In parallel to the vaccination process, individuals can be-come infected and infectious. We categorize susceptible indi-viduals of group 𝑎 and protection level 𝜎 ∈ {0,1,2} as
S𝑎0 =
{𝑆𝑎0 ,𝐺
𝑎0 , 𝑍
𝑎0}
S𝑎1 =
{𝐺𝑎
1 , 𝑍𝑎1 ,𝑊
𝑎1 ,𝑉
𝑎1 ,𝐾
𝑎1}
S𝑎2 =
{𝑉𝑎
2 ,𝐾𝑎2}.
Then, for each group 𝑎 and protection level 𝜎, the infectionprocess is defined by the equations
𝑑
𝑑𝑡𝐸 = 𝜙
∑𝐻 ∈S
𝐻 −𝛼𝐸
𝑑
𝑑𝑡𝐼 = 𝛼𝐸 − 𝛽𝐼
𝑑
𝑑𝑡𝑅 = 𝛽𝐼
𝑑
𝑑𝑡𝐷 = 𝑑𝛽𝐼
𝑑
𝑑𝑡𝐶 = 𝑝𝛽𝐼.
Here, all quantities except 𝑡, 𝛼, and 𝛽 should be read as ex-plicitly depending on group affiliation 𝑎 and protection level 𝜎(sub- and superscripts are omitted for readability). We assumea universal average latency time of 𝛼−1 = 3.2d after which ex-posed individuals 𝐸 transition to compartment 𝐼. We furtherassume a universal infectious period of 𝛽−1 = 6.7d after whichindividuals become non-infectious and immune or otherwiseremoved from the process (𝑅). We count individuals who passaway in compartment 𝐷 as the proportion 𝑑𝑎𝜎 ≡ 𝑑 of 𝑅. Addi-tionally, we track the cumulative amount of people who willbecome symptomatic (show symptoms of COVID-19) in com-partment 𝐶 as the ratio 𝑝𝑎𝜎 ≡ 𝑝 of 𝑅. Note that
𝑑
𝑑𝑡
2∑𝜎=0
(𝐸𝑎𝜎 + 𝐼𝑎𝜎 +𝑅𝑎
𝜎 +∑
𝐻 ∈S𝑎𝜎
𝐻
)= 0,
i.e. the total population size in group 𝑎 remains constant at alltimes (we require the sum in the equation above to be equal tounity). Since infected individuals are counted twice in sepa-rate parts of the model, we have
𝑑
𝑑𝑡
2∑𝜎=0
( ∑�� ∈S𝑎
𝜎
�� +∑
𝐻 ∈S𝑎𝜎
𝐻
)= 0,
as well. The total force of infection on any susceptible indi-vidual 𝐻𝑎
𝜎 ∈ (S𝑎0 +S𝑎
1 +S𝑎2 ) is given as
𝜙𝑎𝜎 (𝑡) =R𝑌𝑌 (𝑡)𝛽𝐶𝑌𝑌
(1− 𝑟𝑎𝜎)∑
𝑎′∈{𝑌 ,𝐴}
2∑𝜎′=1
(1− 𝑘𝑎′𝜎′)𝐶𝑎𝑎′ 𝐼𝑎′
𝜎′ (𝑡).
(A1)Here, 𝐶𝑎𝑎′ is the average number of contacts a person ofgroup 𝑎 has with a person of group 𝑎′ (temporal and ensem-ble average). We scale the force of infection globally by the

14
in-group temporal reproduction number R𝑌𝑌 (𝑡) of the low-risk group. We further decrease an individual’s susceptibilitybased on group affiliation 𝑎 and protection level 𝜎 using anassumed susceptibility reduction 𝑟𝑎𝜎 . Similarly, the infectivityof an infectious person of group 𝑎′ and protection level 𝜎′ isreduced based on a transmissibility reduction 𝑘𝑎
′𝜎′ .
In addition to the default infection process, we count the cu-mulative number of all infected people 𝑋 with reporting delay𝜏𝑅 as
𝑑
𝑑𝑡𝐹 = 𝛼𝐸 − 1
𝜏𝑅𝐹
𝑑
𝑑𝑡𝑋 =
1𝜏𝑅𝐹.
The full set of equations is given in Eqs. (H1-H88).In addition to the model equations, we find the daily inci-
dence of cases in age group 𝑎 to be
𝐽𝑎 = 𝑁𝑎
2∑𝜎=0
𝑑
𝑑𝑡𝑋𝑎𝜎 =
𝑁𝑎
𝜏𝑅
2∑𝜎=0
𝐹𝑎𝜎 . (A2)
As argued below, we assume that only a fraction 𝛿𝑎 of allinfected individuals of risk group 𝑎 are reported. This impliesthat the total reported daily incidence is given as
𝐽 = 𝛿𝐴𝐽𝐴+ 𝛿𝑌 𝐽𝑌 . (A3)
Furthermore, following the derivation in [42, 43] for SEIRmodels, we define the temporal effective reproduction numberas
Reff = (1+Λ/𝛼) (1+Λ/𝛽)
where we evaluate the growth rate Λ as based on the incidenceas
Λ =𝑑log𝐽𝑑𝑡
.
In this study, we are interested in how different vaccine dis-tribution protocols influence the cumulative number of deathsin the high-risk group and the cumulative number of symp-tomatic cases in the high-risk group. Hence, we evaluate theobservables
Δ𝐷𝐴 = 𝑁𝐴
2∑𝜎=0
[𝐷𝐴
𝜎,standard (168d) −𝐷𝐴𝜎,extended (168d)
]Δ𝐶𝐴 = 𝑁𝐴
2∑𝜎=0
[𝐶𝐴
𝜎,standard (168d) −𝐶𝐴𝜎,extended (168d)
].
to compare the impact of any of the extended protocols. Here,(·)𝐴
𝜎,protocol (168d) represents the value of compartment (·) atthe end of the respective 6-month vaccine distribution proto-col, i. e. their respective cumulative count.
Appendix B: Population structure and parameter choices
The German national vaccine rollout strategy entails a tier-based provision of vaccines to people of different risk groups[9]. Here, we consider the first three tiers that comprise mostof the individuals at high risk regarding death by COVID-19.Tier 1 contains individuals of age >80 and inhabitants of nurs-ing homes (≈ 6.4 million) as well as high-risk-of-exposurehealthcare workers. Tier 2 entails individuals aged 75–79,individuals with diagnosed dementia, people with mental dis-abilities (all mentioned in total ≈ 5.7 million), and other healthcare workers. Tier 3 contains, besides others, individuals aged70–74 (≈ 3.6 million). In total, the high-risk group containsabout 15.7 million people. This group will be referred to bythe superscript 𝐴 in the following. Tier 1 and tier 2 alone totalabout > 15.6 million individuals of which 12.1 million are inthe high-risk group (the rest being medical workers).
In order to structure the population in a way that reflectsboth the size of the high risk group as well as the higher ageof people within the risk group, we choose
𝐶𝑌𝑌 = 7.781659𝐶𝑌 𝐴 = 0.65415356𝐶𝐴𝐴 = 1.6846154𝐶𝐴𝑌 = 2.821114
with 𝑁𝐴 = 15,293,178, and 𝑁𝑌 = 65,953,623, which is thecontact structure one obtains when distributing the populationinto age strata [0,65) and 65+ using data from the POLYMODstudy with the open source R software “socialmixr” [27, 28].We find that the contact matrix does not change substantiallywhen choosing age strata [0,70) and 70+ which is closer toour high-risk group criteria but yields a much smaller high-risk group population size (due to the data being from 2005).
We calibrate the infection fatality ratio (IFR) for both riskgroups based on the course of the pandemic in Germany in2020 using data for age strata [0,59) (an approximation togroup 𝑌 ) and 60+ (approximation to group 𝐴) due to the lackof more fine-grained data and find that by choosing IFRs of
𝑑𝑌0 = 0.028%𝑑𝐴0 = 6.250%
the progression of the pandemic in Germany in 2020 is re-flected reasonably well by the model (see Sec. C). We cali-brate the model by comparing the 7-day running average ofdaily new reported cases and daily new deaths of official casecounts [47]. These IFR values are within the reported boundsof a meta-review study on IFR by age [30] and correspond to apopulation-wide IFR of 1.15%. The exact value of the IFR is,however, of less importance for our analysis. In order to accu-rately model the situation, we have to calibrate the model casefatality rate (CFR) to be equal to the reported CFR. Varyingthe IFR will have to be compensated by varying the respec-tive dark factors accordingly to match the empirical CFR. If,then, reported incidence curves remain constant, the numberof deaths will approximately remain constant, as well.
15
Based on the phase 3 studies for the Biontech/Pfizer andModerna vaccines, we assume that the IFR decreases to di-minishingly small values beginning 14 days after receivingone or two doses. In neither study, any participant that re-ceived the vaccine passed away by COVID-19 and only oneperson developed a severe case of COVID-19 as compared to4 severe cases in the placebo group [9]. We therefore assumevaccine efficacies of
𝑒𝑎death,1 = 99.9%,𝑒𝑎death,2 = 99.99%,
and set
𝑑𝑎1 = 𝑑𝑎0 × (1− 𝑒𝑎death,1)/(1− 𝑟𝑎1 )
𝑑𝑎2 = 𝑑𝑎0 × (1− 𝑒𝑎death,2)/(1− 𝑟𝑎2 ).
We assume a uniform transmissibility reduction of 𝑘𝑎𝜎 = 0%for all groups and protection levels. Vaccine studies showed areduction in the rate of viral shedding following SARS-CoV-2 infection in various animal models, yet vaccinated humanswill manifest few if any symptoms—consequently, these indi-viduals would not change their behavior (a typical cause for aneffective transmission reduction in symptomatic cases), whichwe assume results in a diminishing net transmission reduction.
Regarding a susceptibility reduction of vaccinated individ-uals, preliminary results from Israel suggest a 51% efficacyagainst infection with SARS-CoV-2 12 days after receivingthe first dose [8] which we assume translates to a ≈ 50% re-duction in susceptibility for those with protection level 1, i.e.𝑟𝑎1 = 0.5. We further assume that this protection increases to𝑟𝑎2 = 0.6 for the second protection level.
While irrelevant for the dynamics of the system, we aimto estimate the number of prevented symptomatic COVID-19cases, as well. Following ref. [31], we set a population-wideprobability for symptomatic infection of
𝑝𝑎0 = 0.83.
We further implement a vaccine efficacy 14 days after receiv-ing a second dose in-label as
𝑒𝑎COVID,2 = 0.95.
Data from the BNT162b2 phase 3 study further suggests anefficacy of
𝑒𝑎COVID,1 = 0.9
12-14 days after receiving the first dose [6]. We implementthese values as
𝑝𝑎1 = 𝑝𝑎0 × (1− 𝑒𝑎COVID,1)/(1− 𝑟𝑎1 ),
𝑝𝑎2 = 𝑝𝑎0 × (1− 𝑒𝑎COVID,2)/(1− 𝑟𝑎2 ).
Appendix C: Calibration simulation
As initial conditions we choose 𝐼𝑌0 (𝑡0) = 5,000/𝑁𝑌 ,𝑆𝑌0 (𝑡0) = 1−5,000/𝑁𝑌 , 𝑆𝐴0 (𝑡0) = 1, and 𝑡0 = 45d (correspond-ing to Mar 4, 2020 when Jan 1, 2020 corresponds to 𝑡 = 0).
We find that the temporal shape of the low-risk in-group re-production number
R𝑌𝑌 (𝑡) =
2.25 𝑡 < 90d,0.4 90d ≤ 𝑡 < 195d,1.7 195d ≤ 𝑡 < 307d,1.37 307d ≤ 𝑡 < 350d,0.8 350d ≤ 𝑡
(C1)
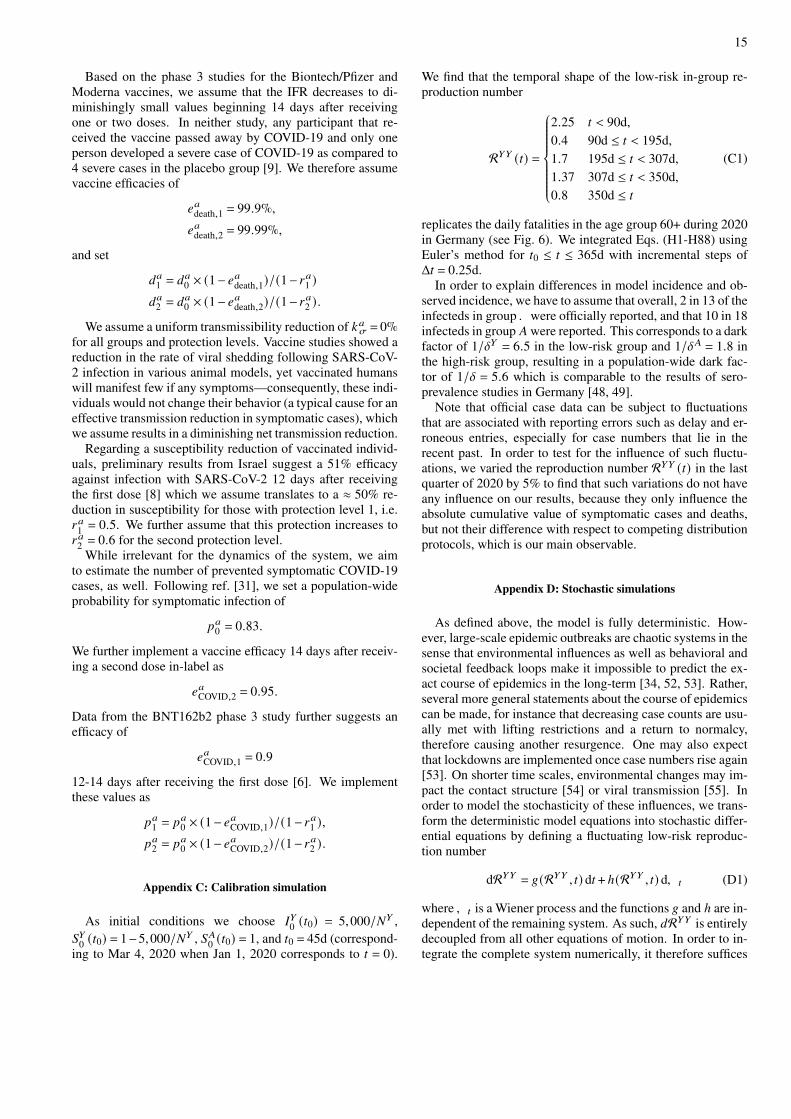
replicates the daily fatalities in the age group 60+ during 2020in Germany (see Fig. 6). We integrated Eqs. (H1-H88) usingEuler’s method for 𝑡0 ≤ 𝑡 ≤ 365d with incremental steps ofΔ𝑡 = 0.25d.
In order to explain differences in model incidence and ob-served incidence, we have to assume that overall, 2 in 13 of theinfecteds in group 𝑌 were officially reported, and that 10 in 18infecteds in group 𝐴were reported. This corresponds to a darkfactor of 1/𝛿𝑌 = 6.5 in the low-risk group and 1/𝛿𝐴 = 1.8 inthe high-risk group, resulting in a population-wide dark fac-tor of 1/𝛿 = 5.6 which is comparable to the results of sero-prevalence studies in Germany [48, 49].
Note that official case data can be subject to fluctuationsthat are associated with reporting errors such as delay and er-roneous entries, especially for case numbers that lie in therecent past. In order to test for the influence of such fluctu-ations, we varied the reproduction number R𝑌𝑌 (𝑡) in the lastquarter of 2020 by 5% to find that such variations do not haveany influence on our results, because they only influence theabsolute cumulative value of symptomatic cases and deaths,but not their difference with respect to competing distributionprotocols, which is our main observable.
Appendix D: Stochastic simulations
As defined above, the model is fully deterministic. How-ever, large-scale epidemic outbreaks are chaotic systems in thesense that environmental influences as well as behavioral andsocietal feedback loops make it impossible to predict the ex-act course of epidemics in the long-term [34, 52, 53]. Rather,several more general statements about the course of epidemicscan be made, for instance that decreasing case counts are usu-ally met with lifting restrictions and a return to normalcy,therefore causing another resurgence. One may also expectthat lockdowns are implemented once case numbers rise again[53]. On shorter time scales, environmental changes may im-pact the contact structure [54] or viral transmission [55]. Inorder to model the stochasticity of these influences, we trans-form the deterministic model equations into stochastic differ-ential equations by defining a fluctuating low-risk reproduc-tion number
dR𝑌𝑌 = 𝑔(R𝑌𝑌 , 𝑡) d𝑡 + ℎ(R𝑌𝑌 , 𝑡) d𝑊𝑡 (D1)
where𝑊𝑡 is a Wiener process and the functions 𝑔 and ℎ are in-dependent of the remaining system. As such, 𝑑R𝑌𝑌 is entirelydecoupled from all other equations of motion. In order to in-tegrate the complete system numerically, it therefore suffices
16
FIG. 6. Calibration simulation. We initiate the model as described in Sec. C and use the temporally varying low-risk temporal basic reproduc-tion number as given in Eq. (C1) to scale the force of infection as defined in Eq. (A1). The basic reproduction number Eq. (C1) was chosensuch that daily high-risk group model fatalities match the 7-day running average of daily fatalities in the 60+ age group in Germany during2020. Model incidence (thick blue curves) overestimates the empirical incidence by a factor of 1/𝛿𝐴 = 1.8 and 1/𝛿𝑌 = 6.5, respectively, whichis in line with reported dark factors obtained via sero-prevalence studies in Germany [48, 49]. In order to closely match fatalities in the low-riskgroup in the model to the age group of < 60 in the data, we chose an infection fatality rate of 𝑑𝑌0 = 0.028%.
to integrate Eq. (D1) once using the Euler–Maruyama methodwith Δ𝑡 = 0.25d. Afterwards, we can integrate the model equa-tions using Euler’s method with the same Δ𝑡. This is numer-ically equivalent to evaluating the whole system with the Eu-ler–Maruyama method and enables us to evaluate the outcomeof different vaccination strategies with the same time seriesR𝑌𝑌 (𝑡). This means that even though we model a stochasticsystem, the consequences of different vaccine rollout strate-gies can be compared directly.
As initial condition, we choose the final value of Eq. (C1)R𝑌𝑌 (𝑡0) = 0.8 and redefine 𝑡0 = 0 corresponding to Jan 1,2021. Furthermore we define
𝑔(R𝑌𝑌 , 𝑡) = − 𝑓[R𝑌𝑌 −
(R + (𝑡 − 𝑡0)𝜚
) ]ℎ(R𝑌𝑌 , 𝑡) =
√2Z,
i.e. an Ornstein-Uhlenbeck process with drift. For all simula-tions, we set Z = 𝑠
√2 𝑓 and fix 𝑠 = 0.002d−1/2 and 𝑓 = 1/30,
which generates model incidence curves that roughly repli-cate the autocorrelation time and standard deviation of thepopulation-wide 7-day running average incidence curve inGermany in 2020. We also employ reflective boundary condi-tions at R𝑌𝑌 = 0 and R𝑌𝑌 = 3.
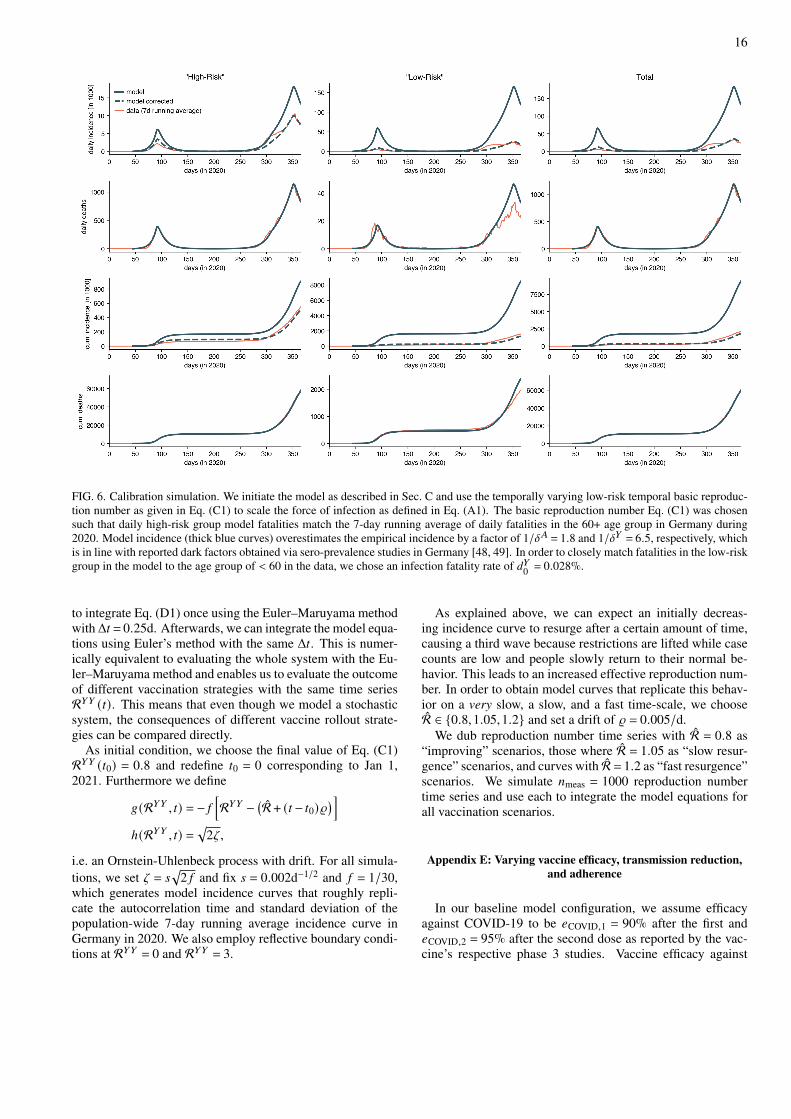
As explained above, we can expect an initially decreas-ing incidence curve to resurge after a certain amount of time,causing a third wave because restrictions are lifted while casecounts are low and people slowly return to their normal be-havior. This leads to an increased effective reproduction num-ber. In order to obtain model curves that replicate this behav-ior on a very slow, a slow, and a fast time-scale, we chooseR ∈ {0.8,1.05,1.2} and set a drift of 𝜚 = 0.005/d.
We dub reproduction number time series with R = 0.8 as“improving” scenarios, those where R = 1.05 as “slow resur-gence” scenarios, and curves with R = 1.2 as “fast resurgence”scenarios. We simulate 𝑛meas = 1000 reproduction numbertime series and use each to integrate the model equations forall vaccination scenarios.
Appendix E: Varying vaccine efficacy, transmission reduction,and adherence
In our baseline model configuration, we assume efficacyagainst COVID-19 to be 𝑒COVID,1 = 90% after the first and𝑒COVID,2 = 95% after the second dose as reported by the vac-cine’s respective phase 3 studies. Vaccine efficacy against

17
FIG. 7. Varying vaccine efficacy against COVID-19 and COVID-19 related deaths for the vaccination protocols shown in Fig. 3a of the maintext. (a) Prevented symptomatic COVID-19 cases with reduced efficacy against COVID-19 after the first dose, i.e. 80% after the first and 95% efficacy after the second dose, respectively. (b) Prevented COVID-19-related deaths considering a reduced efficacy against death of 95%(first protection level) and 99.5 % (second protection level), respectively. Structure and color choice are analogous to Figs. 2-4 in the maintext. Adjacent violins of the same color represent reductions in the adherence as described in the main text (see Fig. 4).
death is assumed to be 𝑒COVID,1 = 99.9% and 𝑒COVID,2 =
99.99% after reaching first and second protection levels, re-spectively. In order to test the robustness of our results re-garding this baseline configuration, we performed additionalsensitivity analyses where the efficacy of the first dose is sub-stantially smaller than that provided by the second dose. Inthe following, we report the resulting relative changes of pre-vented deaths and COVID-19 cases with respect to the resultsobtained using the baseline configuration. Here, we only doanalyses for vaccination distribution protocols shown in Fig. 3of the main text.
First, we reduce first-dose efficacy against COVID-19 to𝑒COVID,1 = 80% while we keep the efficacy of the second dosefixed, therefore deliberately weakening the off-label protocol.A reduction from 90% to 80% efficacy implies an increaseof 100% in the probability to show symptoms after infection,hence representing a strong change. As expected, we find thatsuch a strong reduction in first-dose efficacy leads to a reduc-
tion in the number of prevented “high-risk” COVID-19 casesΔ𝐶𝐴 while the positive net effect remains (i.e. the number ofprevented COVID-19 cases remains positive and large), seeFig. 7a). We find a 17% reduction in Δ𝐶𝐴 for the extendedin-label protocol. Regarding the extended off-label protocol,Δ𝐶𝐴 is reduced by 26% for the “improved” and 35% for the“fast resurgence” scenario, respectively. Additionally reduc-ing the adherence by 10% yields a reduction of 28% (“im-proved”) and 42% (“fast resurgence”) in Δ𝐶𝐴, respectively. Insummary, doubling the assumed probability of showing symp-toms despite having received the first dose leads to a ≤ 50%reduction in Δ𝐶𝐴, showing that even in this case, switching tothe extended in-label or even to the extended off-label proto-col would be beneficial.
Second, we decrease the efficacy against death to values of𝑒death,1 = 95% for protection level 1 and 𝑒COVID,2 = 99.5% forprotection level 2. This is a 50-fold increase in the probabilityof death after infection as compared to the baseline configura-
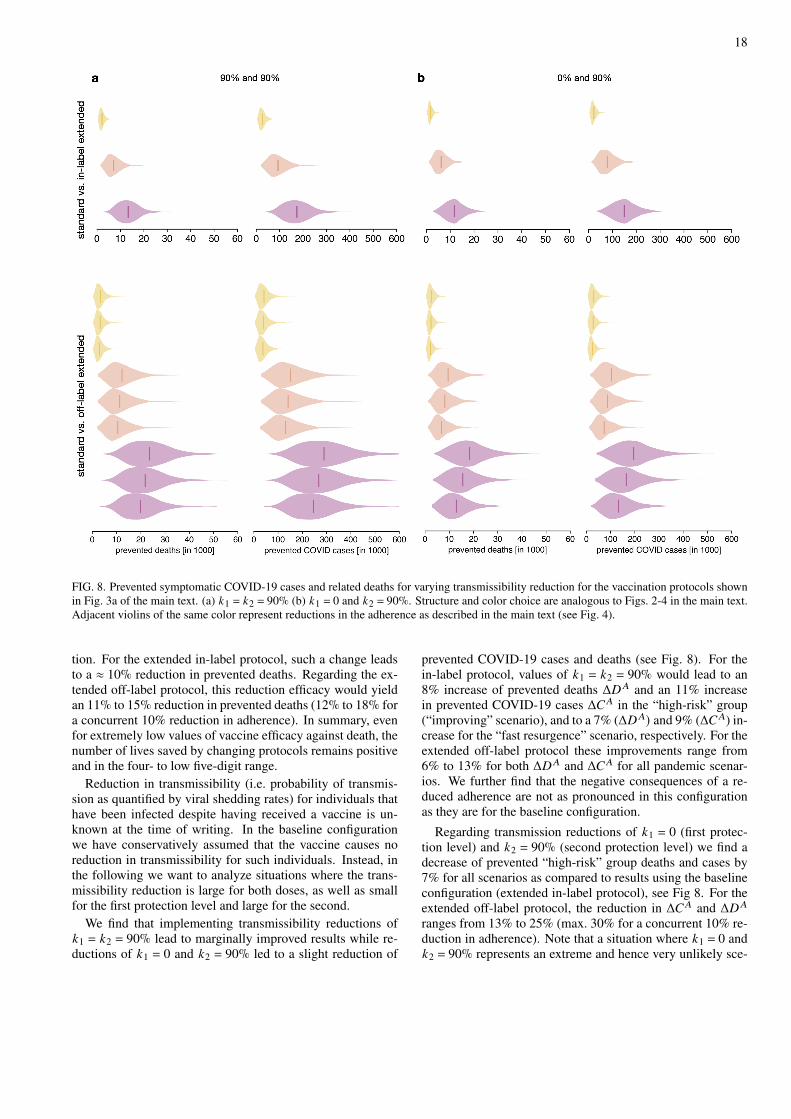
18
FIG. 8. Prevented symptomatic COVID-19 cases and related deaths for varying transmissibility reduction for the vaccination protocols shownin Fig. 3a of the main text. (a) 𝑘1 = 𝑘2 = 90% (b) 𝑘1 = 0 and 𝑘2 = 90%. Structure and color choice are analogous to Figs. 2-4 in the main text.Adjacent violins of the same color represent reductions in the adherence as described in the main text (see Fig. 4).
tion. For the extended in-label protocol, such a change leadsto a ≈ 10% reduction in prevented deaths. Regarding the ex-tended off-label protocol, this reduction efficacy would yieldan 11% to 15% reduction in prevented deaths (12% to 18% fora concurrent 10% reduction in adherence). In summary, evenfor extremely low values of vaccine efficacy against death, thenumber of lives saved by changing protocols remains positiveand in the four- to low five-digit range.
Reduction in transmissibility (i.e. probability of transmis-sion as quantified by viral shedding rates) for individuals thathave been infected despite having received a vaccine is un-known at the time of writing. In the baseline configurationwe have conservatively assumed that the vaccine causes noreduction in transmissibility for such individuals. Instead, inthe following we want to analyze situations where the trans-missibility reduction is large for both doses, as well as smallfor the first protection level and large for the second.
We find that implementing transmissibility reductions of𝑘1 = 𝑘2 = 90% lead to marginally improved results while re-ductions of 𝑘1 = 0 and 𝑘2 = 90% led to a slight reduction of
prevented COVID-19 cases and deaths (see Fig. 8). For thein-label protocol, values of 𝑘1 = 𝑘2 = 90% would lead to an8% increase of prevented deaths Δ𝐷𝐴 and an 11% increasein prevented COVID-19 cases Δ𝐶𝐴 in the “high-risk” group(“improving” scenario), and to a 7% (Δ𝐷𝐴) and 9% (Δ𝐶𝐴) in-crease for the “fast resurgence” scenario, respectively. For theextended off-label protocol these improvements range from6% to 13% for both Δ𝐷𝐴 and Δ𝐶𝐴 for all pandemic scenar-ios. We further find that the negative consequences of a re-duced adherence are not as pronounced in this configurationas they are for the baseline configuration.
Regarding transmission reductions of 𝑘1 = 0 (first protec-tion level) and 𝑘2 = 90% (second protection level) we find adecrease of prevented “high-risk” group deaths and cases by7% for all scenarios as compared to results using the baselineconfiguration (extended in-label protocol), see Fig 8. For theextended off-label protocol, the reduction in Δ𝐶𝐴 and Δ𝐷𝐴
ranges from 13% to 25% (max. 30% for a concurrent 10% re-duction in adherence). Note that a situation where 𝑘1 = 0 and𝑘2 = 90% represents an extreme and hence very unlikely sce-

19
FIG. 9. Prevented high-risk group deaths and symptomatic cases with decreasing adherence. (Top row) 30% reduction (8.4 million high-riskindividuals willing to get vaccinated, corresponds to a total of 55% adherence). (Middle row) 35% reduction (7.8 million high-risk individualswilling to get vaccinated, corresponds to a total of 51% adherence). (Bottom row) 40% reduction (7.2 million high-risk individuals willing toget vaccinated, corresponds to a total of 47% adherence).
nario. Nevertheless, the number of saved lives and preventedcases in the “high-risk” group remains positive and in the four-to low five-digit range even in this extreme situation.
With decreased vaccine adherence in the high-risk popu-lation, the benefits of the extended off-label protocol are ex-pected to vanish. For the baseline configuration, beginningat a 30% relative adherence reduction, switching to the ex-tended off-label protocol causes negative net effects, i.e. neg-ative numbers in the prevented deaths and cases (see Fig. 9).This corresponds to a willingness to get vaccinated of 55%in the high-risk group (from 78.4% pre-switch, i.e. a 23.4%reduction in the total willingness).
Appendix F: Simulation code
The model has been implemented based on the “epipack”modeling package [56]. Implementation and analysis code is
available online [57].
Appendix G: Dose distribution scenarios
We auto-generate distribution scenarios according to thefollowing rules. We define the total number of high-risk indi-viduals that will be vaccinated according to a chosen base ad-herence. We also define the number of high-priority low-riskindividuals to be 7 million. Available doses are split betweenrisk groups proportionally to the number of high-priority indi-viduals in each group. Once all high-priority individuals havereceived two doses, all remaining doses are distributed to thelow-risk group.
We further define one month to be 28 days long, in orderto simplify distribution definitions in line with vaccine licen-sures. This implies that we integrate the model for 168 days,which according to our definitions amounts to 6 months.

20
Note that we round times to the nearest quarter of a day andin the tables, doses are rounded to the nearest integer.
All distribution scenarios that were generated according tothese rules are displayed in Tabs. III-X.
Appendix H: Full set of model equations
In the following, we show all model equations for a sin-gle phase in which the second, delayed dose only upholds thevaccine protection of the first dose, rather than increasing it.
𝑑
𝑑𝑡𝑆𝐴0 = −
𝑆𝐴0(2𝑁𝐴𝜙𝐴
0(𝑆𝐴0 + 𝑆𝐴0
)+ `𝐴
2 +2a𝐴1)
2𝑁𝐴
(𝑆𝐴0 + 𝑆𝐴0
) (H1)
𝑑
𝑑𝑡𝐺𝐴
0 = −𝐺𝐴0 𝜙
𝐴0 −
𝐺𝐴0
𝜏𝑀+
𝑆𝐴0 a𝐴1
𝑁𝐴
(𝑆𝐴0 + 𝑆𝐴0
) (H2)
𝑑
𝑑𝑡𝑍𝐴
0 = −𝑍𝐴0 𝜙
𝐴0 −
𝑍𝐴0𝜏𝑀
+𝑆𝐴0 `
𝐴2
2𝑁𝐴
(𝑆𝐴0 + 𝑆𝐴0
) (H3)
𝑑
𝑑𝑡𝐺𝐴
1 = −𝐺𝐴1 𝜙
𝐴1 −
𝐺𝐴1
𝜏𝑀+
𝑊 𝐴1 a
𝐴2
𝑁𝐴(𝑊 𝐴
1 +�� 𝐴1) (H4)
𝑑
𝑑𝑡𝑊 𝐴
1 =𝐺𝐴
0𝜏𝑀
−𝑊 𝐴1 𝜙
𝐴1 −
𝑊 𝐴1 a
𝐴2
𝑁𝐴(𝑊 𝐴
1 +�� 𝐴1) (H5)
𝑑
𝑑𝑡𝑍𝐴
1 =𝑉 𝐴
1 − 𝑍𝐴1 𝜙
𝐴1 𝜏𝑀 − 𝑍𝐴
1𝜏𝑀
(H6)
𝑑
𝑑𝑡𝑉 𝐴
1 =−𝑉 𝐴
1 𝜙𝐴1 𝜏𝑀 −𝑉 𝐴
1 + 𝑍𝐴0
𝜏𝑀(H7)
𝑑
𝑑𝑡𝐾𝐴
1 =𝐺𝐴
1𝜏𝑀
−𝐾𝐴1 𝜙
𝐴1 (H8)
𝑑
𝑑𝑡𝑉 𝐴
2 = −𝑉 𝐴2 𝜙
𝐴2 +
𝑍𝐴1𝜏𝑀
(H9)
𝑑
𝑑𝑡𝐾𝐴
2 = −𝐾𝐴2 𝜙
𝐴2 (H10)
𝑑
𝑑𝑡𝑆𝐴0 =
𝑁𝐴𝑆𝐴0 𝜙𝐴0(𝑆𝐴0 + 𝑆𝐴0
)− ��𝐴
0 `𝐴2
2 − 𝑆𝐴0 a𝐴1
𝑁𝐴
(𝑆𝐴0 + 𝑆𝐴0
) (H11)
𝑑
𝑑𝑡��𝐴
0 = 𝐺𝐴0 𝜙
𝐴0 −
��𝐴0
𝜏𝑀+
𝑆𝐴0 a𝐴1
𝑁𝐴
(𝑆𝐴0 + 𝑆𝐴0
) (H12)
𝑑
𝑑𝑡��𝐴
0 = 𝑍𝐴0 𝜙
𝐴0 −
��𝐴0𝜏𝑀
+𝑆𝐴0 `
𝐴2
2𝑁𝐴
(𝑆𝐴0 + 𝑆𝐴0
) (H13)
𝑑
𝑑𝑡��𝐴
1 = 𝐺𝐴1 𝜙
𝐴1 −
��𝐴1
𝜏𝑀+
�� 𝐴1 a
𝐴2
𝑁𝐴(𝑊 𝐴
1 +�� 𝐴1) (H14)
𝑑
𝑑𝑡�� 𝐴
1 =��𝐴
0𝜏𝑀
+𝑊 𝐴1 𝜙
𝐴1 −
�� 𝐴1 a
𝐴2
𝑁𝐴(𝑊 𝐴
1 +�� 𝐴1) (H15)
𝑑
𝑑𝑡��𝐴
1 =�� 𝐴
1 + 𝑍𝐴1 𝜙
𝐴1 𝜏𝑀 − ��𝐴
1𝜏𝑀
(H16)
𝑑
𝑑𝑡�� 𝐴
1 =𝑉 𝐴
1 𝜙𝐴1 𝜏𝑀 − �� 𝐴
1 + ��𝐴0
𝜏𝑀(H17)
𝑑
𝑑𝑡��𝐴
1 =��𝐴
1𝜏𝑀
+𝐾𝐴1 𝜙
𝐴1 (H18)
𝑑
𝑑𝑡�� 𝐴
2 =𝑉 𝐴2 𝜙
𝐴2 +
��𝐴1𝜏𝑀
(H19)
𝑑
𝑑𝑡��𝐴
2 = 𝐾𝐴2 𝜙
𝐴2 (H20)
𝑑
𝑑𝑡𝑆𝑌0 = −
𝑆𝑌0(2𝑁𝑌 𝜙𝑌0
(𝑆𝑌0 + 𝑆𝑌0
)+ `𝑌2 +2a𝑌1
)2𝑁𝑌
(𝑆𝑌0 + 𝑆𝑌0
) (H21)
𝑑
𝑑𝑡𝐺𝑌
0 = −𝐺𝑌0 𝜙
𝑌0 −
𝐺𝑌0
𝜏𝑀+
𝑆𝑌0 a𝑌1
𝑁𝑌
(𝑆𝑌0 + 𝑆𝑌0
) (H22)
𝑑
𝑑𝑡𝑍𝑌0 = −𝑍𝑌0 𝜙
𝑌0 −
𝑍𝑌0𝜏𝑀
+𝑆𝑌0 `
𝑌2
2𝑁𝑌
(𝑆𝑌0 + 𝑆𝑌0
) (H23)
𝑑
𝑑𝑡𝐺𝑌
1 = −𝐺𝑌1 𝜙
𝑌1 −
𝐺𝑌1
𝜏𝑀+
𝑊𝑌1 a
𝑌2
𝑁𝑌(𝑊𝑌
1 +��𝑌1) (H24)
𝑑
𝑑𝑡𝑊𝑌
1 =𝐺𝑌
0𝜏𝑀
−𝑊𝑌1 𝜙
𝑌1 −
𝑊𝑌1 a
𝑌2
𝑁𝑌(𝑊𝑌
1 +��𝑌1) (H25)
𝑑
𝑑𝑡𝑍𝑌1 =
𝑉𝑌1 − 𝑍𝑌1 𝜙
𝑌1 𝜏𝑀 − 𝑍𝑌1𝜏𝑀
(H26)
𝑑
𝑑𝑡𝑉𝑌
1 =−𝑉𝑌
1 𝜙𝑌1 𝜏𝑀 −𝑉𝑌
1 + 𝑍𝑌0𝜏𝑀
(H27)
𝑑
𝑑𝑡𝐾𝑌
1 =𝐺𝑌
1𝜏𝑀
−𝐾𝑌1 𝜙
𝑌1 (H28)

21
𝑡0 [d] 𝑡0 +𝑇 [d] 𝑛𝐴2 𝑛𝐴1 𝑛𝐴3 𝑛𝑌2 𝑛𝑌1 𝑛𝑌3 prot. lev. 2nd dose
0 84 8842105 0 0 5157894 0 0 284 168 8842105 0 0 5157894 0 0 2
TABLE III. Dose distribution according to the standard protocol for a supply situation of extreme scarcity (14 million doses in Q2), c.f. Fig. 2of the main text.
𝑡0 [d] 𝑡0 +𝑇 [d] 𝑛𝐴2 𝑛𝐴1 𝑛𝐴3 𝑛𝑌2 𝑛𝑌1 𝑛𝑌3 prot. lev. 2nd dose
0 42 0 4421052 0 0 2578947 0 242 84 0 0 4421052 0 0 2578947 284 126 0 4421052 0 0 2578947 0 2
126 168 0 0 4421052 0 0 2578947 2
TABLE IV. Dose distribution according to the extended in-label protocol for a supply situation of extreme scarcity (14 million doses in Q2),c.f. Fig. 2 of the main text.
𝑡0 [d] 𝑡0 +𝑇 [d] 𝑛𝐴2 𝑛𝐴1 𝑛𝐴3 𝑛𝑌2 𝑛𝑌1 𝑛𝑌3 prot. lev. 2nd dose
0 84 0 8842105 0 0 5157894 0 184 168 0 0 8842105 0 0 5157894 1
TABLE V. Dose distribution according to the extended off-label protocol for a supply situation of extreme scarcity (14 million doses in Q2),c.f. Fig. 2 of the main text.
𝑡0 [d] 𝑡0 +𝑇 [d] 𝑛𝐴2 𝑛𝐴1 𝑛𝐴3 𝑛𝑌2 𝑛𝑌1 𝑛𝑌3 prot. lev. 2nd dose
0 84 8842105 0 0 5157894 0 0 284 127.75 15131578 0 0 8826754 0 0 2
127.75 168 26315 0 0 22015350 0 0 2
TABLE VI. Dose distribution according to the standard protocol for a supply situation of moderate scarcity (46 million doses in Q2), c.f. Fig. 3of the main text.
𝑡0 [d] 𝑡0 +𝑇 [d] 𝑛𝐴2 𝑛𝐴1 𝑛𝐴3 𝑛𝑌2 𝑛𝑌1 𝑛𝑌3 prot. lev. 2nd dose
0 42 0 4421052 0 0 2578947 0 242 84 0 0 4421052 0 0 2578947 284 105.75 0 7522556 0 0 4388157 0 2
105.75 127.5 0 0 7522556 0 0 4388157 2127.5 147.75 0 28195 0 0 11061090 0 2
147.75 168 0 0 28195 0 0 11061090 2
TABLE VII. Dose distribution according to the extended in-label protocol for a supply situation of moderate scarcity (46 million doses in Q2),c.f. Fig. 3 of the main text.
𝑡0 [d] 𝑡0 +𝑇 [d] 𝑛𝐴2 𝑛𝐴1 𝑛𝐴3 𝑛𝑌2 𝑛𝑌1 𝑛𝑌3 prot. lev. 2nd dose
0 84 0 8842105 0 0 5157894 0 184 97 0 3127819 1368421 0 1824561 798245 197 127.5 0 0 10548872 0 0 6153508 1
127.5 147.75 0 30075 0 0 11059210 0 2147.75 168 0 0 30075 0 0 11059210 2
TABLE VIII. Dose distribution according to the extended off-label protocol for a supply situation of moderate scarcity (46 million doses inQ2), c.f. Fig. 3 of the main text.
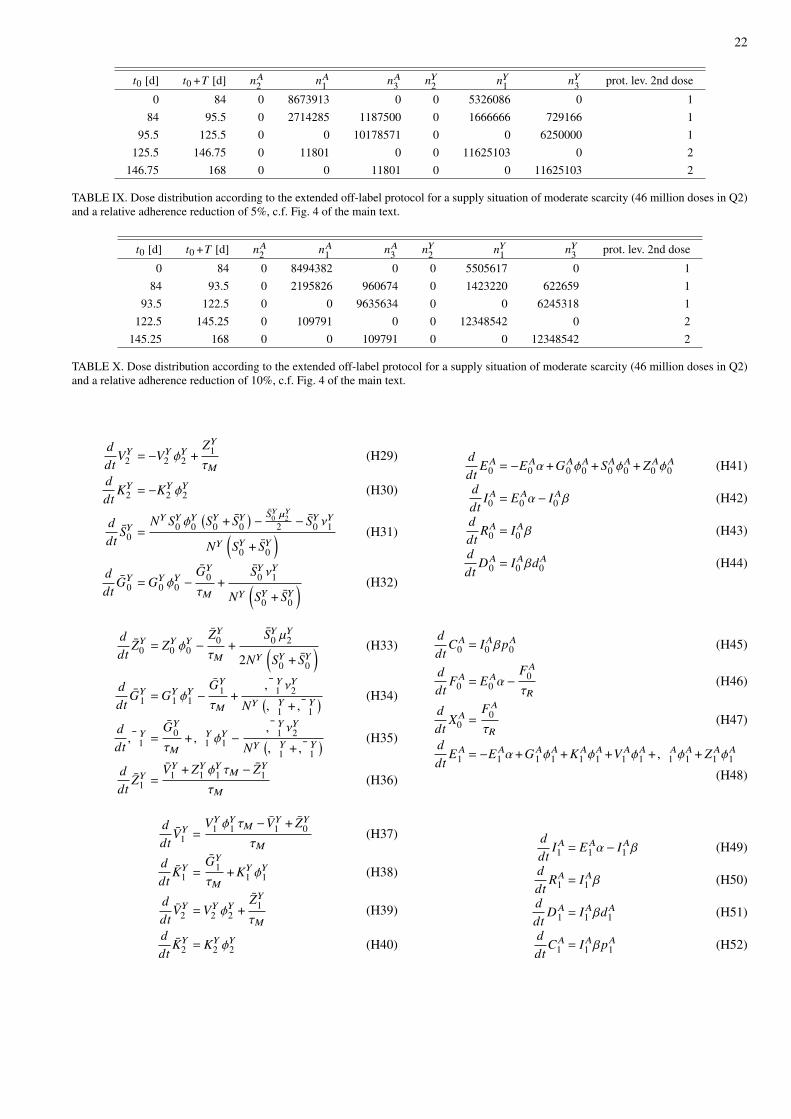
22
𝑡0 [d] 𝑡0 +𝑇 [d] 𝑛𝐴2 𝑛𝐴1 𝑛𝐴3 𝑛𝑌2 𝑛𝑌1 𝑛𝑌3 prot. lev. 2nd dose
0 84 0 8673913 0 0 5326086 0 184 95.5 0 2714285 1187500 0 1666666 729166 1
95.5 125.5 0 0 10178571 0 0 6250000 1125.5 146.75 0 11801 0 0 11625103 0 2
146.75 168 0 0 11801 0 0 11625103 2
TABLE IX. Dose distribution according to the extended off-label protocol for a supply situation of moderate scarcity (46 million doses in Q2)and a relative adherence reduction of 5%, c.f. Fig. 4 of the main text.
𝑡0 [d] 𝑡0 +𝑇 [d] 𝑛𝐴2 𝑛𝐴1 𝑛𝐴3 𝑛𝑌2 𝑛𝑌1 𝑛𝑌3 prot. lev. 2nd dose
0 84 0 8494382 0 0 5505617 0 184 93.5 0 2195826 960674 0 1423220 622659 1
93.5 122.5 0 0 9635634 0 0 6245318 1122.5 145.25 0 109791 0 0 12348542 0 2
145.25 168 0 0 109791 0 0 12348542 2
TABLE X. Dose distribution according to the extended off-label protocol for a supply situation of moderate scarcity (46 million doses in Q2)and a relative adherence reduction of 10%, c.f. Fig. 4 of the main text.
𝑑
𝑑𝑡𝑉𝑌
2 = −𝑉𝑌2 𝜙
𝑌2 +
𝑍𝑌1𝜏𝑀
(H29)
𝑑
𝑑𝑡𝐾𝑌
2 = −𝐾𝑌2 𝜙
𝑌2 (H30)
𝑑
𝑑𝑡𝑆𝑌0 =
𝑁𝑌 𝑆𝑌0 𝜙𝑌0(𝑆𝑌0 + 𝑆𝑌0
)− ��𝑌0 `𝑌2
2 − 𝑆𝑌0 a𝑌1
𝑁𝑌
(𝑆𝑌0 + 𝑆𝑌0
) (H31)
𝑑
𝑑𝑡��𝑌
0 = 𝐺𝑌0 𝜙
𝑌0 −
��𝑌0
𝜏𝑀+
𝑆𝑌0 a𝑌1
𝑁𝑌
(𝑆𝑌0 + 𝑆𝑌0
) (H32)
𝑑
𝑑𝑡��𝑌0 = 𝑍𝑌0 𝜙
𝑌0 −
��𝑌0𝜏𝑀
+𝑆𝑌0 `
𝑌2
2𝑁𝑌
(𝑆𝑌0 + 𝑆𝑌0
) (H33)
𝑑
𝑑𝑡��𝑌
1 = 𝐺𝑌1 𝜙
𝑌1 −
��𝑌1
𝜏𝑀+
��𝑌1 a
𝑌2
𝑁𝑌(𝑊𝑌
1 +��𝑌1) (H34)
𝑑
𝑑𝑡��𝑌
1 =��𝑌
0𝜏𝑀
+𝑊𝑌1 𝜙
𝑌1 −
��𝑌1 a
𝑌2
𝑁𝑌(𝑊𝑌
1 +��𝑌1) (H35)
𝑑
𝑑𝑡��𝑌1 =
��𝑌1 + 𝑍𝑌1 𝜙
𝑌1 𝜏𝑀 − ��𝑌1𝜏𝑀
(H36)
𝑑
𝑑𝑡��𝑌
1 =𝑉𝑌
1 𝜙𝑌1 𝜏𝑀 − ��𝑌
1 + ��𝑌0𝜏𝑀
(H37)
𝑑
𝑑𝑡��𝑌
1 =��𝑌
1𝜏𝑀
+𝐾𝑌1 𝜙
𝑌1 (H38)
𝑑
𝑑𝑡��𝑌
2 =𝑉𝑌2 𝜙
𝑌2 +
��𝑌1𝜏𝑀
(H39)
𝑑
𝑑𝑡��𝑌
2 = 𝐾𝑌2 𝜙
𝑌2 (H40)
𝑑
𝑑𝑡𝐸𝐴
0 = −𝐸𝐴0 𝛼+𝐺
𝐴0 𝜙
𝐴0 + 𝑆𝐴0 𝜙
𝐴0 + 𝑍𝐴
0 𝜙𝐴0 (H41)
𝑑
𝑑𝑡𝐼𝐴0 = 𝐸𝐴
0 𝛼− 𝐼𝐴0 𝛽 (H42)
𝑑
𝑑𝑡𝑅𝐴
0 = 𝐼𝐴0 𝛽 (H43)
𝑑
𝑑𝑡𝐷𝐴
0 = 𝐼𝐴0 𝛽𝑑𝐴0 (H44)
𝑑
𝑑𝑡𝐶𝐴
0 = 𝐼𝐴0 𝛽𝑝𝐴0 (H45)
𝑑
𝑑𝑡𝐹𝐴
0 = 𝐸𝐴0 𝛼−
𝐹𝐴0𝜏𝑅
(H46)
𝑑
𝑑𝑡𝑋𝐴
0 =𝐹𝐴
0𝜏𝑅
(H47)
𝑑
𝑑𝑡𝐸𝐴
1 = −𝐸𝐴1 𝛼+𝐺
𝐴1 𝜙
𝐴1 +𝐾𝐴
1 𝜙𝐴1 +𝑉 𝐴
1 𝜙𝐴1 +𝑊 𝐴
1 𝜙𝐴1 + 𝑍𝐴
1 𝜙𝐴1
(H48)
𝑑
𝑑𝑡𝐼𝐴1 = 𝐸𝐴
1 𝛼− 𝐼𝐴1 𝛽 (H49)
𝑑
𝑑𝑡𝑅𝐴
1 = 𝐼𝐴1 𝛽 (H50)
𝑑
𝑑𝑡𝐷𝐴
1 = 𝐼𝐴1 𝛽𝑑𝐴1 (H51)
𝑑
𝑑𝑡𝐶𝐴
1 = 𝐼𝐴1 𝛽𝑝𝐴1 (H52)
23
𝑑
𝑑𝑡𝐹𝐴
1 = 𝐸𝐴1 𝛼−
𝐹𝐴1𝜏𝑅
(H53)
𝑑
𝑑𝑡𝑋𝐴
1 =𝐹𝐴
1𝜏𝑅
(H54)
𝑑
𝑑𝑡𝐸𝐴
2 = −𝐸𝐴2 𝛼+𝐾
𝐴2 𝜙
𝐴2 +𝑉 𝐴
2 𝜙𝐴2 (H55)
𝑑
𝑑𝑡𝐼𝐴2 = 𝐸𝐴
2 𝛼− 𝐼𝐴2 𝛽 (H56)
𝑑
𝑑𝑡𝑅𝐴
2 = 𝐼𝐴2 𝛽 (H57)
𝑑
𝑑𝑡𝐷𝐴
2 = 𝐼𝐴2 𝛽𝑑𝐴2 (H58)
𝑑
𝑑𝑡𝐶𝐴
2 = 𝐼𝐴2 𝛽𝑝𝐴2 (H59)
𝑑
𝑑𝑡𝐹𝐴
2 = 𝐸𝐴2 𝛼−
𝐹𝐴2𝜏𝑅
(H60)
𝑑
𝑑𝑡𝑋𝐴
2 =𝐹𝐴
2𝜏𝑅
(H61)
𝑑
𝑑𝑡𝑀𝐴
1 = −a𝐴1 (H62)
𝑑
𝑑𝑡𝑀𝐴
2 = −`𝐴2 (H63)
𝑑
𝑑𝑡𝑀𝐴
3 = −a𝐴2 (H64)
𝑑
𝑑𝑡𝐸𝑌
0 = −𝐸𝑌0 𝛼+𝐺
𝑌0 𝜙
𝑌0 + 𝑆𝑌0 𝜙
𝑌0 + 𝑍𝑌0 𝜙
𝑌0 (H65)
𝑑
𝑑𝑡𝐼𝑌0 = 𝐸𝑌
0 𝛼− 𝐼𝑌0 𝛽 (H66)
𝑑
𝑑𝑡𝑅𝑌0 = 𝐼𝑌0 𝛽 (H67)
𝑑
𝑑𝑡𝐷𝑌
0 = 𝐼𝑌0 𝛽𝑑𝑌0 (H68)
𝑑
𝑑𝑡𝐶𝑌
0 = 𝐼𝑌0 𝛽𝑝𝑌0 (H69)
𝑑
𝑑𝑡𝐹𝑌
0 = 𝐸𝑌0 𝛼−
𝐹𝑌0𝜏𝑅
(H70)
𝑑
𝑑𝑡𝑋𝑌
0 =𝐹𝑌
0𝜏𝑅
(H71)
𝑑
𝑑𝑡𝐸𝑌
1 = −𝐸𝑌1 𝛼+𝐺
𝑌1 𝜙
𝑌1 +𝐾𝑌
1 𝜙𝑌1 +𝑉𝑌
1 𝜙𝑌1 +𝑊𝑌
1 𝜙𝑌1 + 𝑍𝑌1 𝜙
𝑌1
(H72)
𝑑
𝑑𝑡𝐼𝑌1 = 𝐸𝑌
1 𝛼− 𝐼𝑌1 𝛽 (H73)
𝑑
𝑑𝑡𝑅𝑌1 = 𝐼𝑌1 𝛽 (H74)
𝑑
𝑑𝑡𝐷𝑌
1 = 𝐼𝑌1 𝛽𝑑𝑌1 (H75)
𝑑
𝑑𝑡𝐶𝑌
1 = 𝐼𝑌1 𝛽𝑝𝑌1 (H76)
𝑑
𝑑𝑡𝐹𝑌
1 = 𝐸𝑌1 𝛼−
𝐹𝑌1𝜏𝑅
(H77)
𝑑
𝑑𝑡𝑋𝑌
1 =𝐹𝑌
1𝜏𝑅
(H78)
𝑑
𝑑𝑡𝐸𝑌
2 = −𝐸𝑌2 𝛼+𝐾
𝑌2 𝜙
𝑌2 +𝑉𝑌
2 𝜙𝑌2 (H79)
𝑑
𝑑𝑡𝐼𝑌2 = 𝐸𝑌
2 𝛼− 𝐼𝑌2 𝛽 (H80)
𝑑
𝑑𝑡𝑅𝑌2 = 𝐼𝑌2 𝛽 (H81)
𝑑
𝑑𝑡𝐷𝑌
2 = 𝐼𝑌2 𝛽𝑑𝑌2 (H82)
𝑑
𝑑𝑡𝐶𝑌
2 = 𝐼𝑌2 𝛽𝑝𝑌2 (H83)
𝑑
𝑑𝑡𝐹𝑌
2 = 𝐸𝑌2 𝛼−
𝐹𝑌2𝜏𝑅
(H84)
𝑑
𝑑𝑡𝑋𝑌
2 =𝐹𝑌
2𝜏𝑅
(H85)
𝑑
𝑑𝑡𝑀𝑌
1 = −a𝑌1 (H86)
𝑑
𝑑𝑡𝑀𝑌
2 = −`𝑌2 (H87)
𝑑
𝑑𝑡𝑀𝑌
3 = −a𝑌2 (H88)