Embed Size (px)
Citation preview
Postponement and Childlessness – Evidence from two British cohorts
Abstract
This paper starts by reviewing existing projections of childlessness among British men and
women. Low current fertility implies high eventual childlessness unless the postponement of
parenthood is taken into account. Such re-timing of first births appears to be occurring differentially
across social groups. Exploiting the disaggregated evidence of two British cohort studies, the 1958
National Child Development Study and the 1970 British Cohort Survey, this paper investigates the
extent of postponement across cohorts and projects its impact on eventual levels of childlessness. Men
and women are considered separately in our models of a population stratified by educational attainment.
We find the most striking postponement occurring among graduate men. Among graduate women, after
taking family building intentions into account, we estimate that about a quarter of 1970 born graduate
women will remain childless, rather than something nearer 40 per cent as had been conjectured
elsewhere.
1
Background
Increasing numbers of people in Britain are either postponing parenthood, or not experiencing
it at all. Since the 1960s, decreases in Total Fertility Rates have been accompanied by rises in the
median age of women at first birth, as fewer women have first births in their teens and early twenties.
This partly involves a re-timing of the initiation of parenthood to the late ‘twenties and ‘thirties, but it
also involves a gradual rise in rates of eventual childlessness, not necessarily intended. Graduate
women have been a focus of scholarly and popular attention as being in the vanguard of this trend.
Male fertility histories, on the other hand, have largely been overlooked. In this paper, we examine the
pattern of postponement and childlessness in Britain across the range of social groups in two cohorts for
both genders. We use the (near) complete, observed fertility schedule of the earlier 1958 cohort
(NCDS) to estimate a full fertility schedule for the later 1970 (BCS70) cohort, observed only up to age
34.
Existing Estimates of Childlessness
The past four decades have witnessed low and late fertility over much of the developed world.
Discussion of the Second Demographic Transition includes both the outcomes of these changes and
their determinants (Lesthaeghe and Neels, 2002, van de Kaa, 1987). The outcome has been below
replacement level fertility and rising age at first birth. Social changes in patterns of female labour
market and educational participation and changes in marital and cohabitation patterns have been offered
as drivers, and explanations for low and late fertility may account for postponement, voluntary
childlessness and involuntary childlessness. While these are not stable or mutually exclusive ‘states’, -
one may lead to another, and they may respond to different stimuli - each has very different
implications for the level of childlessness that could be predicted, and the extent to which it may be a
cause for concern for policy, society and individual couples.
Recent trends in births in Britain are visible through the period Total Fertility Rate (TFR),
which (in England and Wales) dropped from a peak in 1964 of 2.95 children per woman, and remained
below 1.80 into the twenty-first century, rebounding somewhat to 1.86 in 2006 (Office for National
Statistics, 2007) 1. At the same time, mean age at first birth in England and Wales rose from 26.7 to 27.6
1 .Office for National Statistics estimates refer to England and Wales alone. However, given that England and Wales account for nearly 90% of the UK population, and that Scottish fertility trends have mirrored those of England and Wales in terms of rising age at birth, it is suggested that these estimates do reflect national trends.
2

between 1996 and 2006 (Office for National Statistics, 2007). While not being directly indicative of
rising levels of childlessness, these period indicators do demonstrate that fertility is becoming lower and
later among British women. In a similar way, lower and later rates of entry to first birth cannot directly
illuminate trends in completed family size; but it is easy to speculate that higher levels of childlessness
and late entry to first parenthood will have a negative impact on higher order births. Withdrawal from
parenthood during the twenties may be a postponement or permanent. While entry to parenthood is
irreversible, its deferring it increases the risk of it never happening, due to biological and other
constraints. Indicators of cohort fertility show that the proportion of eventually childless2 women
doubled from 9% for those born in 1946 to 18% for those born in 1958 (Office for National Statistics,
2007). Projections for women born in 1970 suggest that 18% will also be childless by the age of 45
years (Bray, 2008). These latest projections for the 1970 cohort represent a downward revision of
projected childlessness for this cohort, compared with previous estimates (Bray, 2006, Office for
National Statistics, 2004), and in fact the 1970 cohort represents a small dip in projected childlessness
compared to adjacent cohorts (Bray, 2008). These projections are also lower than projections from other
sources that placed childlessness for the 1970 cohort around 21.5%-22% (Sobotka, 2004)3. In fact, the
1970 cohort appears to be experiencing something of a rapid recuperation of first births in the mid
thirties so that rates of parenthood become comparable with the 1958 cohort (Office for National
Statistics, 2007). This belies some commentators who consider recent estimates to be optimistically low
(Dixon and Margo, 2006). Although there may not be much of a difference in the proportion of the
1970 and 1958 cohorts who are childless at 45, at age 34 there was a 4 percentage point lead in
motherhood for the 1958 cohort. In short, recent cohorts of women have been postponing first births,
although the pace of this postponement, and consequences as reflected in levels of childlessness,
appears to be slowing, and most women are still eventually becoming mothers.
Despite the widespread interest in childlessness, few studies project ultimate childlessness for
relatively young cohorts of women. There is little sound evidence (or questioning) as to whether the
retreat from parenthood in the twenties is a delay or a cancellation. Therefore, what has been termed
postponement thus far could turn out to be permanent avoidance; and furthermore, it is unclear whether
‘postponement’ implies a full or a partial recuperation of rates of parenthood (Lesthaeghe and Willems,
1999). Postponement can be used to describe the state where the proportion of parents in a later cohort
is lower than in an earlier one, at the same age (e.g Simpson, 2006). However, comparisons are often
made of full with partially observed fertility schedules. Without additional evidence, there is no basis
2 Childlessness in this instance refers to childlessness at the end of reproductive capacity – typically between ages 45-50 years.3 Sobotka’s estimates are based upon the LS (Longitudinal Study) survey for England and Wales.
3
for assuming that parenthood is either postponed or is never going to happen. However, as we have
seen, the ONS projections for later cohorts (including the 1970) do assume some recuperation. This
paper looks within social groups to document retreat from parenthood during the twenties, and offer
some basis for the notion of recuperation.
Childlessness and Educational Class in the Literature
Increases in childlessness among post-war cohorts have been associated with changes in the
composition of the female population in terms of educational attainment and labour market
participation, and an exodus of women from ‘traditional’ confines as housewives (Joshi, 2002, Sobotka,
2004, Simpson, 2006). Given the relationship between educational attainment and labour force
attachment, graduate women have found themselves at the forefront of these rises, both in real terms
and as a focus of popular interest. Even among graduate women, abandonment of the ‘traditional’ and
the embrace of male academic subjects involves additional difficulties in balancing careers and
motherhood (Blackwell and Glover, 2007, Hoem et al., 2006), which constitute a particular incentive to
defer childbearing or avoid it altogether. Low and late fertility among recent cohorts of graduate
women reflects these difficulties. One estimate in circulation in the media suggested as many as 40% of
British graduate women born in 1970 might expected to enter their forties remaining childless (Wolf,
2006a). Other estimates (including our own preliminary) placed the level at approximately thirty
percent for graduate women born in 1965 (Ratcliffe and Smith, 2006) and 1970 (Joshi, 2007). A
weakness of our own preliminary estimates was the failure to fully account for postponement,
something which is addressed in this paper. In fact, once we do examine the notion of postponement,
the ‘Monstrous Regiment’ of child-free career women (Wolf, 2006b) also turns out to be something of a
myth.
The transition to parenthood is one of several which mark the onset of adulthood; others include
completing education, finding a stable partner and a permanent place to live. These events do not
necessarily occur in an orderly sequence, but the passage into becoming the mother or father tends to be
more prolonged for those who have prolonged their education. Graduate women have particular reasons
to postpone. Firstly there is a delay while accumulating educational capital, and then there is reason to
delay while accumulating career experience and avoiding the loss of earnings (and/or childcare costs)
associated with motherhood (Joshi, 2002). They also have more knowledge of how to avoid
childbearing before they are ready for it. However the arguments for delay do not apply only to
graduate women. Asset accumulation prior to embarking upon parenthood may be of greatest concern
4

to those who are able to acquire the most assets (usually the tertiary qualified), and may also operate
entirely differently between groups. Housing is one example, where delaying parenthood is of benefit to
those who are to become owner occupiers (especially graduates), but delay may be of little benefit to
those who will enter social housing. Given that these benefits are shared with the partner, these factors
are replicated among graduate men especially if they have graduate partners. Partnership operates more
consistently, and all groups will benefit from delaying entering parenthood until the right partner has
been found. In this paper, we analyse three groups for both genders – those in a high, medium and low
educational class, where economic reasons to postpone parenthood will tend to be aligned within
groups. We use education to proxy for a complement of socioeconomic factors influential in transition
to parenthood. We also allow for transition to parenthood depending on partnership (and partner’s
characteristics), as well as family forming expectations, which are tempered by fecundity. These are
incorporated into our study and outlined in Figure 1
Figure 1: Model of factors leading to childlessness at end of reproductive years
In addition to examining the anticipated level of childlessness among graduate women, this
paper will compare the situation for graduate women with graduate men, and also with other education
groups. In many cases, the fact that these populations differ in their characteristics over time has not
been incorporated into projections4. In particular, differences that occur according to their family 4 This has usually been due to data constraints. The breadth of the British Birth cohort studies allow for exploration of a number of determinants of transition.
Parenthood Status in early-mid adulthood
(NCDS Age 33)
Parenthood Status at end of reproductive
years (NCDS Age 46)
Educat-ional Class
Family Forming Expect-ations
Partner-ship
Factors
Parenthood Status in early-mid adulthood
(BCS Age 34)
Family Forming Expect-ations
Educat-ional Class
Partner-ship
Factors
Parenthood Status at end of reproductive
years (BCS70 Age 46)
? ? ?
5
forming intentions – a very potent measure of ‘postponement’ – have been neglected. Conceptually,
family formation intentions may be one of a variety of interrelated factors that determine the transition
to parenthood from the early thirties onwards. Few of the estimates of childlessness discussed earlier
had used any predictors of transition to parenthood beyond educational class to refine projection
estimates. This paper introduces a range of projections of levels of childlessness for the 1970 born
BCS70 cohort using an observed partial fertility schedule for the 1970 cohort and a complete fertility
schedule from the earlier 1958 born NCDS cohort.
The inclusion of male accounts of fertility, as mentioned, is uncommon in the literature. Much
of the reason for this lack of analysis of male fertility histories has rested on the inaccuracy associated
with male fertility information (Rendall et al., 1999, Greene and Biddlecom, 2000). Usually the bias is
assumed to be negative, with underreporting of the fathering children, and it is unknown whether
underreporting varies by educational group. While this underreporting is a potential consideration of all
the information presented in this paper, and specifically any estimate of childlessness we create may be
too high; this bias can be assumed to be equal among both our datasets, and our findings will still reflect
changes between cohorts as well as being a close approximation of the actual level. Given that
parenthood is usually a joint decision between couples, our conceptual chart in Figure 1 reflects factors
that apply equally to both genders.
After introducing our data sources and methods, the paper:
• describes entry to parenthood in both cohorts at observed ages
• projects childlessness for BCS70 assuming that transition to parenthood follows the age
specific transition after observed in NCDS with and without a downward shift based upon its
lower rates up to 34
• incorporates reported family building intentions to project rather more recuperation of
parenthood.
Data
The British Birth Cohort studies comprise of four prospective longitudinal studies following the
lives of individuals born during periods in 1946, 1958, 1970 and more recently in 2000. Ferri and
colleagues and Bynner and Joshi outline the history of these studies and some of their most prominent
findings (Ferri et al., 2003, Bynner and Joshi, 2007) Two of them are used in this research – the
National Child Development Study (NCDS) that followed individuals born in 1958 and the British
Cohort Survey (BCS70) which began in 1970. Both studies prospectively followed individuals and
6
were essentially a census of all born in one week in 1958 and 19705. For the NCDS, further periods of
data collection have occurred at ages 7, 11, 16, 23, 33, 41-42 and 46 years. While this last sweep may
represent the end of female reproductive capacity, men may still continue to father children. Data from
BCS70 cohort members were collected at ages 5, 10, 16, 26, 29-30 and 34 years. This paper examines
live births, excluding stillbirths and other fertility outcomes. It excludes those still pregnant or those
who have fathered a pregnancy not carried to full term6.
Data Considerations: Attrition among the cohort studies
As is the case for all longitudinal studies, both cohorts have witnessed a decline in the size of
samples under observation, either through death, emigration, non-response or untraceable cohort
members (Plewis et al., 2004, Young et al., 2006). Cohort members who attrit from studies are thought
to differ systematically from those who continue to participate (Young et al., 2006, Niccoletti and
Peracchi, 2005), and studies are more likely to lose men and those of low socioeconomic status. This
could affect estimates of entry into parenthood. In addition, not only are men more likely to lose contact
with the survey, but they are also more likely to underreport births they have previously fathered
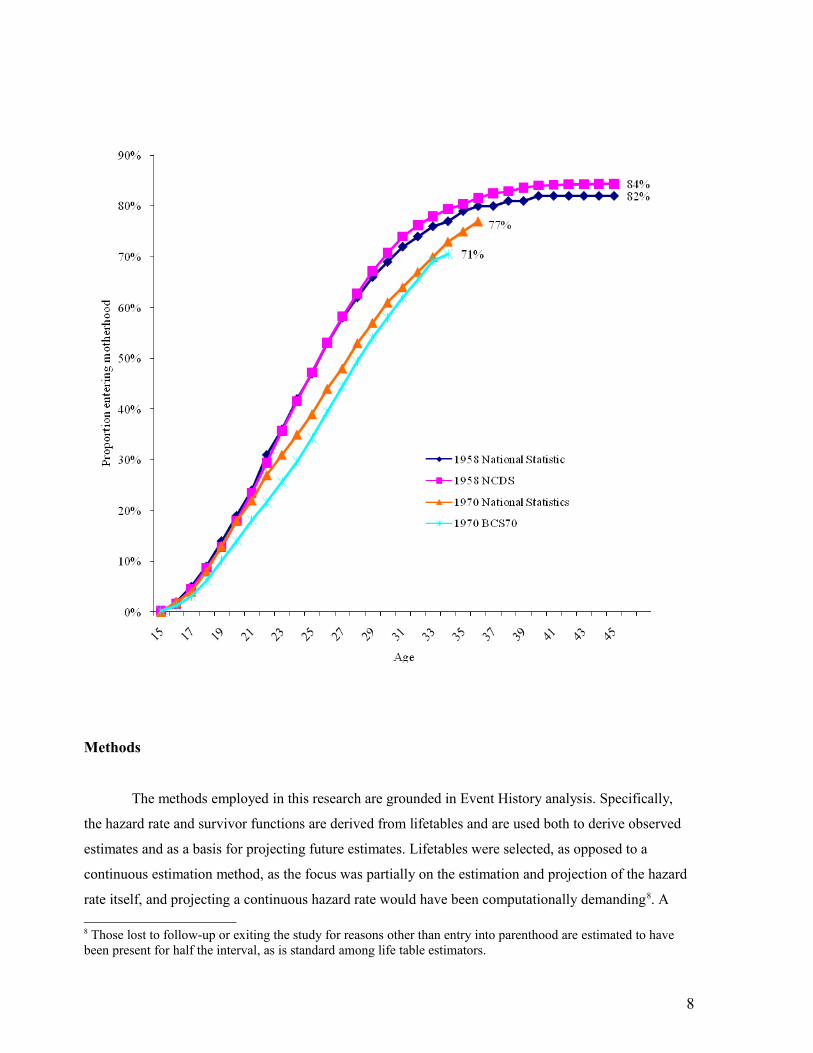
(Greene and Biddlecom, 2000, Rendall et al., 1999). When comparing birth cohort estimates with
national statistics estimates (Office for National Statistics, 2007); for women at least, the picture is
relatively close (Figure 2) showing that entry into motherhood, as estimated from the cohort studies, is
representative. Additionally, entry patterns into first parenthood disaggregated by highest qualifications
also mirror those from other sources (Rendall and Smallwood, 2003)7. Despite these positive
indications, attrition means the cohort studies no longer reflect a true census of people born in 1958 and
1970, but are a close approximation. As such all the results presented in this study are likely to contain
some margin of error.
Figure 2: Comparison of National Statistics cohort estimates of rates of entry into first Motherhood with NCDS and BCS70 rates
5 Both studies cover the three countries of Great Britain - England, Wales and Scotland. Although the 1970 cohort initially included Northern Ireland in collection of data at birth, cohort members from Northern Ireland were not followed-up. Immigrants were added to both studies in childhood waves. Ethnic minorities are not analysed separately because of the low numbers present in both cohorts. 6 Further details of the inclusion criteria and construction of fertility information can be found in Appendix 1.7 Rendall and Smallwood ( 2003) present the following statistics from the ONS Longitudinal Study (LS) for women born 1954-1958, with NCDS equivalent figures in brackets. Women with tertiary qualifications:-10th percentile of entering parenthood – 24 years (23 years) -Final estimate of childlessness – 22.5% (23.4%); Women with no qualifications or intermediate qualifications: -First 10% percentile entering parenthood – 18 years (18 years)-Final estimate of childlessness – 15.2% (13.3%).
7
Methods
The methods employed in this research are grounded in Event History analysis. Specifically,
the hazard rate and survivor functions are derived from lifetables and are used both to derive observed
estimates and as a basis for projecting future estimates. Lifetables were selected, as opposed to a
continuous estimation method, as the focus was partially on the estimation and projection of the hazard
rate itself, and projecting a continuous hazard rate would have been computationally demanding8. A
8 Those lost to follow-up or exiting the study for reasons other than entry into parenthood are estimated to have been present for half the interval, as is standard among life table estimators.
8
number of different methods are used in this paper to estimate the expected differential rates of entry
into first parenthood and are described where relevant.
Summarising childlessness in two British cohorts
Table 1 shows levels of transition into parenthood reflected in proportions still childless at
successive ages. There is a broad consistency between cohorts in levels of young parenthood
(occurring before 22 years), with differences opening up thereafter. The median age at first parenthood
shifted from approximately 29½ years to 33 years for men and from 26½ years for women to almost 28
years between the NCDS and BCS70 cohorts. Among all education groups the proportion of parents
was lower in the BCS70 cohort, at comparable ages, than was the case in the NCDS cohort. The notable
exception to this trend would be the comparatively high level of young motherhood among tertiary
qualified women in the BCS70 cohort. The retreat from parenthood is greater for males, and in
particular, those with tertiary qualifications up to the age of 33/34. This research examines how this
difference will impact on levels childlessness for the BCS70 cohort at the end of the fertility schedule9,
and questions whether these existing differences in transition represent postponement or avoidance of
parenthood.
This analysis uses highest qualification gained by age 33/34 years, and for the most part it is
expected that this level of qualification preceded parenthood. Such assumptions are also made in other
studies (Rendall et al., 2005). For the most part, this assumption is likely to ring true – the exception
being tertiary qualified young mothers, more prominent although still a minority in the BCS70 cohort.
The advantages of using this method which matches qualifications at two equivalent time points
outweighed the advantages of using different methods such as a time varying covariate approach. In
addition, this method was deemed in line with the approach of this study, which describes differentials
and trends within populations delineated by education level; as opposed to directly measuring the
impact of education.
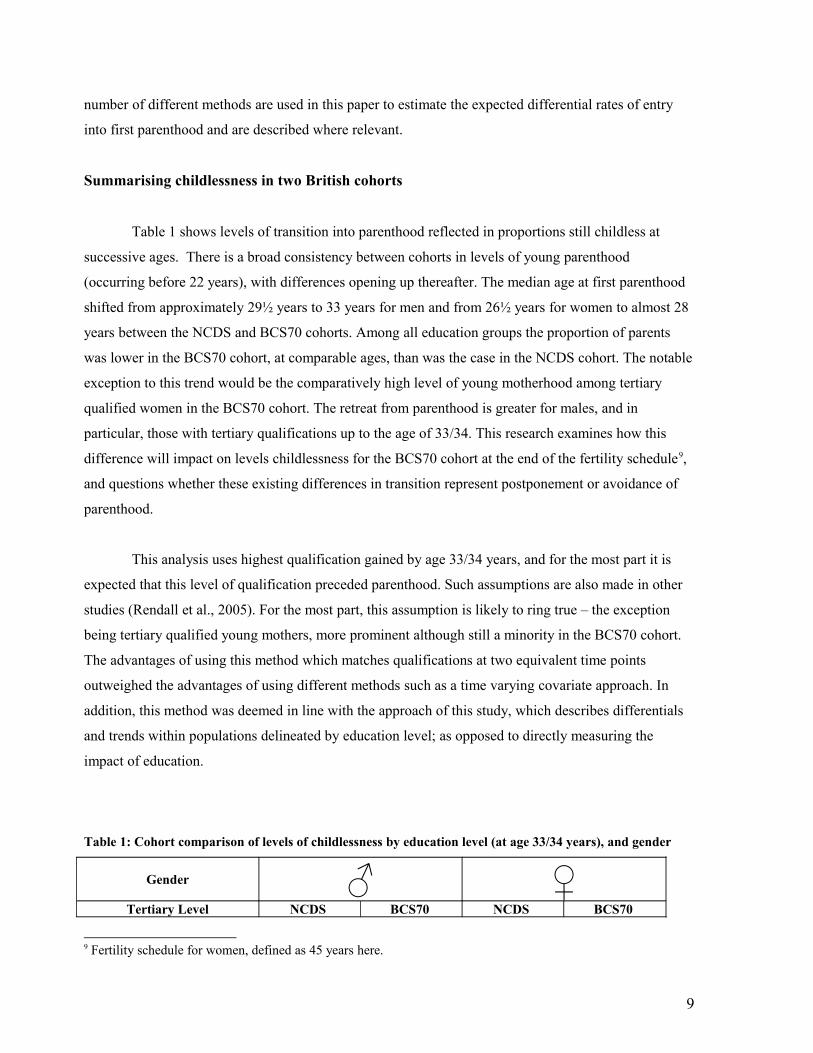
Table 1: Cohort comparison of levels of childlessness by education level (at age 33/34 years), and gender
Gender ♂ ♀Tertiary Level NCDS BCS70 NCDS BCS70
9 Fertility schedule for women, defined as 45 years here.
9
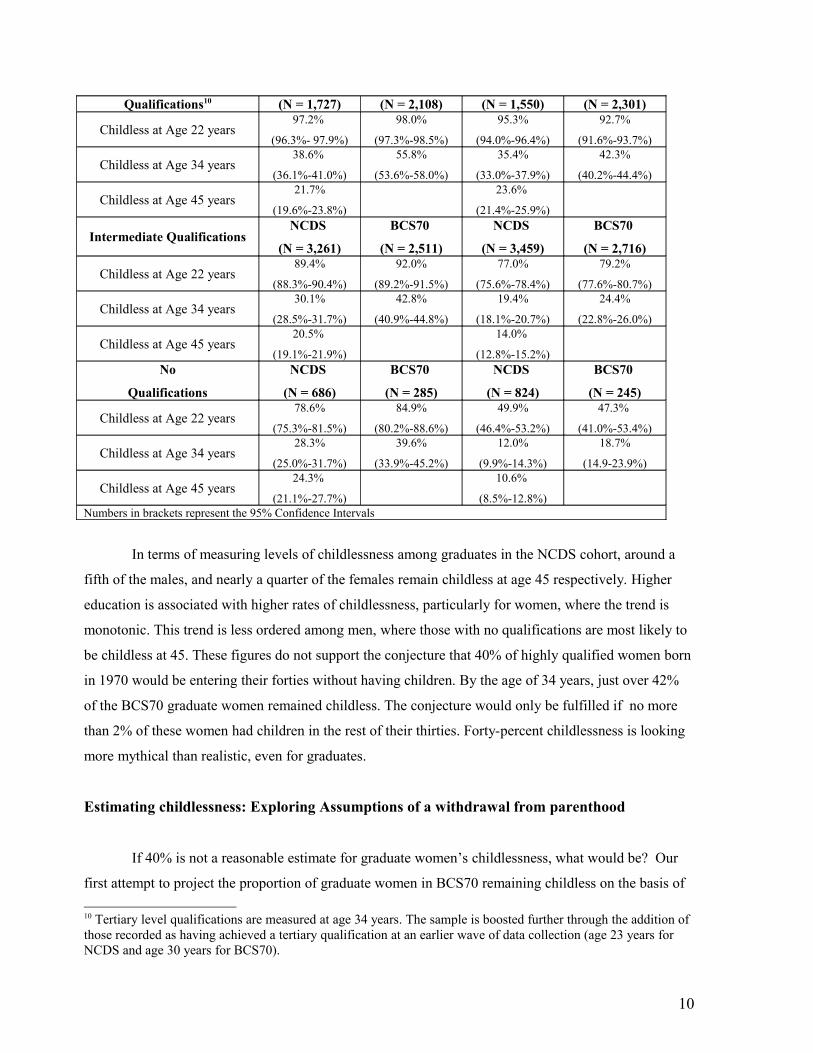
Qualifications10 (N = 1,727) (N = 2,108) (N = 1,550) (N = 2,301)
Childless at Age 22 years97.2%
(96.3%- 97.9%)
98.0%
(97.3%-98.5%)
95.3%
(94.0%-96.4%)
92.7%
(91.6%-93.7%)
Childless at Age 34 years38.6%
(36.1%-41.0%)
55.8%
(53.6%-58.0%)
35.4%
(33.0%-37.9%)
42.3%
(40.2%-44.4%)
Childless at Age 45 years21.7%
(19.6%-23.8%)
23.6%
(21.4%-25.9%)
Intermediate QualificationsNCDS
(N = 3,261)
BCS70
(N = 2,511)
NCDS
(N = 3,459)
BCS70
(N = 2,716)
Childless at Age 22 years89.4%
(88.3%-90.4%)
92.0%
(89.2%-91.5%)
77.0%
(75.6%-78.4%)
79.2%
(77.6%-80.7%)
Childless at Age 34 years30.1%
(28.5%-31.7%)
42.8%
(40.9%-44.8%)
19.4%
(18.1%-20.7%)
24.4%
(22.8%-26.0%)
Childless at Age 45 years20.5%
(19.1%-21.9%)
14.0%
(12.8%-15.2%)No
Qualifications
NCDS
(N = 686)
BCS70
(N = 285)
NCDS
(N = 824)
BCS70
(N = 245)
Childless at Age 22 years78.6%
(75.3%-81.5%)
84.9%
(80.2%-88.6%)
49.9%
(46.4%-53.2%)
47.3%
(41.0%-53.4%)
Childless at Age 34 years28.3%
(25.0%-31.7%)
39.6%
(33.9%-45.2%)
12.0%
(9.9%-14.3%)
18.7%
(14.9-23.9%)
Childless at Age 45 years24.3%
(21.1%-27.7%)
10.6%
(8.5%-12.8%)Numbers in brackets represent the 95% Confidence Intervals
In terms of measuring levels of childlessness among graduates in the NCDS cohort, around a
fifth of the males, and nearly a quarter of the females remain childless at age 45 respectively. Higher
education is associated with higher rates of childlessness, particularly for women, where the trend is
monotonic. This trend is less ordered among men, where those with no qualifications are most likely to
be childless at 45. These figures do not support the conjecture that 40% of highly qualified women born
in 1970 would be entering their forties without having children. By the age of 34 years, just over 42%
of the BCS70 graduate women remained childless. The conjecture would only be fulfilled if no more
than 2% of these women had children in the rest of their thirties. Forty-percent childlessness is looking
more mythical than realistic, even for graduates.
Estimating childlessness: Exploring Assumptions of a withdrawal from parenthood
If 40% is not a reasonable estimate for graduate women’s childlessness, what would be? Our
first attempt to project the proportion of graduate women in BCS70 remaining childless on the basis of
10 Tertiary level qualifications are measured at age 34 years. The sample is boosted further through the addition of those recorded as having achieved a tertiary qualification at an earlier wave of data collection (age 23 years for NCDS and age 30 years for BCS70).
10

NCDS experience post 34 came out as likely to stand in the high twenties, with a top estimate given as
31% (Joshi, 2007)11. Our projections are sensitive to the assumptions made to take forward the lower
proportion of parents at age 34 years in the 1970 cohort compared to the earlier 1958 cohort. In this
section we use two assumptions about progression to parenthood. The first is that the BCS70 cohort has
a permanently lower propensity to enter parenthood at any given age than NCDS which involves a
constant downward shift of the hazard of a first birth at all ages. In other words, the overall lower
propensity for entering parenthood observed over earlier years is set to continue at the same
proportional rate compared to that of NCDS, for imputed BCS70 values. We refer to this first scenario
as a ‘flight from parenthood’. The second scenario is that the BCS70 cohort have been following a slow
path into parenthood during their twenties and early thirties, but will replicate the same age specific
propensities to become parents as the NCDS at equivalent ages, if childless after 34 years. We refer to
this scenario as a ‘late NCDS scenario’, which applies the pattern of consistently diminishing hazards of
entry into parenthood of the NCDS cohort onto the later BCS70 cohort. This scenario is almost
analogous to saying that some obstacle is removed at age 34 years so that the BCS70 can progress into
parenthood at the same rate as the NCDS cohort thereafter. Neither approach fully embraces the notion
of postponement as neither explicitly incorporates any catch-up effect of births ‘lost’ during the
twenties. To return to the discussion at the beginning of the paper, both of these approaches only allow
for a permanent flight from parenthood, as opposed to re-timing - both approaches differ in their
assumption as to the length of this withdrawal, the former stating that the brake on entering parenthood
lasts over the whole fertility schedule, the latter that it is only held down until the early thirties, but that
the subsequent regaining of speed is not sufficient to make up the ground previously lost. The results
from both scenarios are presented in Table 2, where all estimates again refer to the proportion childless
– based on observed data for NCDS and projected data for BCS70.
Should the difference in the rates of childlessness at 33/34 years be interpreted as a permanent
and continuing avoidance of parenthood (‘flight from parenthood’ referred to earlier), then this
difference could be modelled using the derivative from a traditional Cox model. This assumes that the
difference in transition rates between the BCS70 cohort relative to the NCDS cohort should be factored
in future projections of BCS70 parenthood. The model makes the assumption that the difference
remains constant throughout the parenthood schedule, known as the proportionality assumption (Singer
and Willett, 2003, Jenkins, 2004)12. When ‘flight from parenthood’ models are constructed, Table 2
shows a level of 31% childlessness is reached for graduate women born in 1970. This estimate 11 This was rounded to a ‘third of graduate women’ remaining childless in press coverage, Leapman (2007), Clerkin (2007)12 Schoenfeld residual tests are used to assess the proportionality assumption. Where appropriate, the cohort effect for the whole observation period (16-32 years) is used. Where there proportionality assumption is violated through using such a wide observation period, a narrower, later range is used.
11
represents a conservative estimate of entry into parenthood for the 1970 cohort in the absence of
postponement and further reduces the possibility of 40% childlessness among graduate women. Of
interest, however, is that predicted childlessness among graduate men; which under the assumption that
parenthood is being consistently avoided by BCS70 cohort members; does reach 40%.
In the second , ‘late NCDS, scenario’, assuming that the BCS70 cohort will follow the same
transition rates as the NCDS cohort during their thirties and forties, the proportion of tertiary qualified
women expected to remain childless would reach around 28.3 (Table 2). For highly qualified men, the
level of childlessness under this scenario is expected to reach 30.5% – for both sexes well under one
third. ‘Late NCDS scenario’ projections show some interesting trends in terms of education and predict
divergent trends by education for men and women. For BCS70 women, educational attainment appears
to restrict entry into motherhood, as was the case among the NCDS cohort. However, this differential
may be narrowing. In the NCDS cohort, for each woman with no qualifications who remained childless
at the age of 45 years, there were expected to be 2.23 childless tertiary qualified women. For the BCS70
cohort, this ratio had reduced to 1.66. In the case of men, the projected rates of childlessness are not
significantly different across educational groups.
While both sets of projections provide a range of possible courses of transition to parenthood,
they do not take into account any postponement effect, as births lost during earlier years are not
recuperated. In essence, these methods assume that a compensatory catch-up effect will not be observed
to account for the reduced rate of transition to first parenthood observed among the BCS70 cohort up to
the age of 34 years. The following sections begin by presenting descriptive statistics that offer evidence
of postponement, as opposed to avoidance, through examining family building intentions; before taking
these into account in the models. Once these intentions are accounted for, the results are far less
suggestive of any significant rise in childlessness, particularly among graduate women.
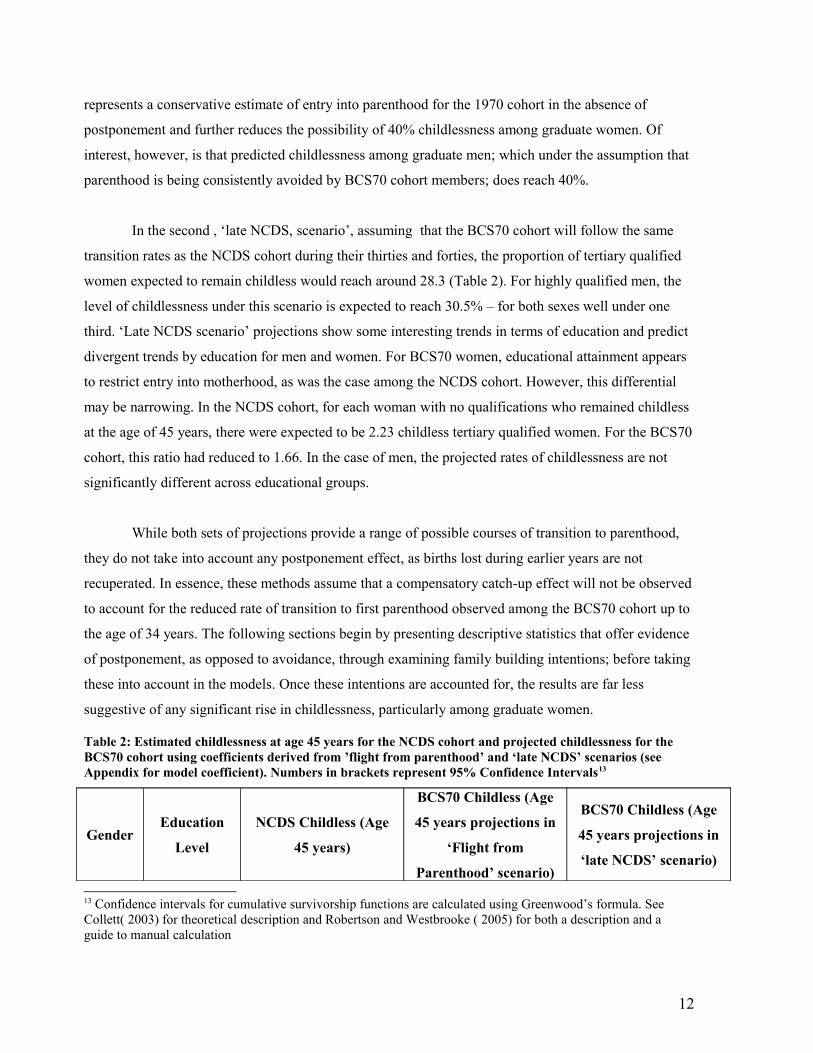
Table 2: Estimated childlessness at age 45 years for the NCDS cohort and projected childlessness for the BCS70 cohort using coefficients derived from ’flight from parenthood’ and ‘late NCDS’ scenarios (see Appendix for model coefficient). Numbers in brackets represent 95% Confidence Intervals13
GenderEducation
Level
NCDS Childless (Age
45 years)
BCS70 Childless (Age
45 years projections in
‘Flight from
Parenthood’ scenario)
BCS70 Childless (Age
45 years projections in
‘late NCDS’ scenario)
13 Confidence intervals for cumulative survivorship functions are calculated using Greenwood’s formula. See Collett( 2003) for theoretical description and Robertson and Westbrooke ( 2005) for both a description and a guide to manual calculation
12
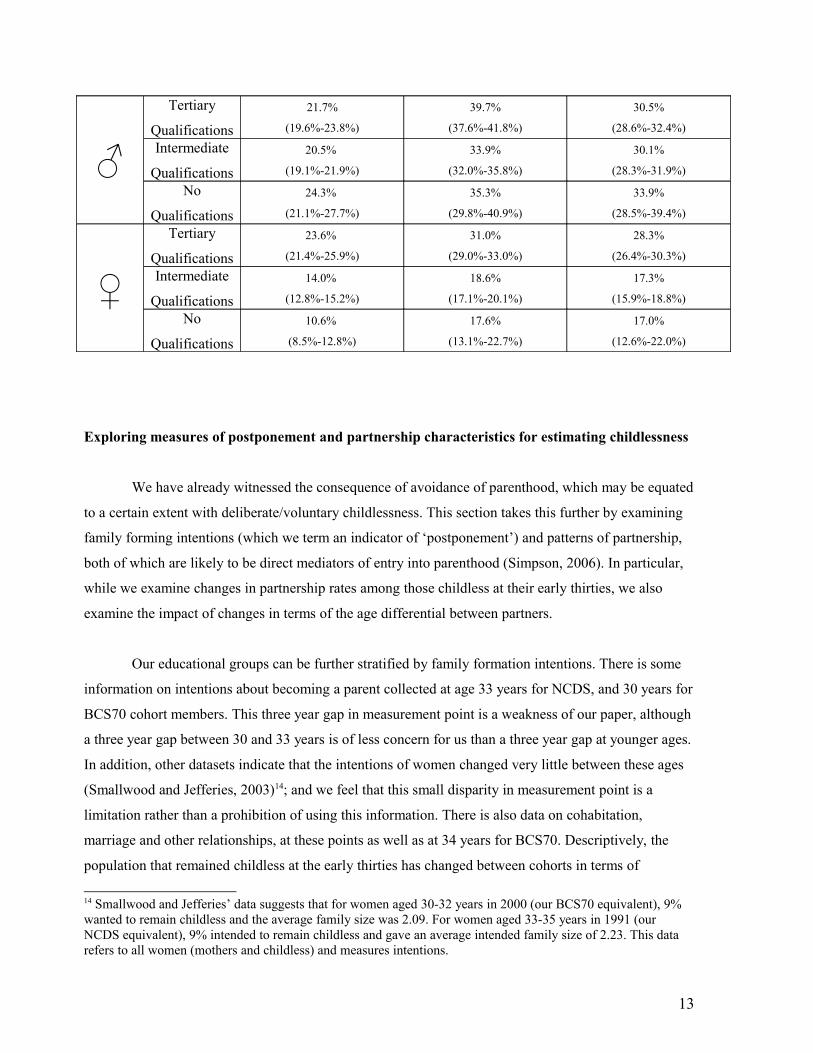
♂
Tertiary
Qualifications21.7%
(19.6%-23.8%)
39.7%
(37.6%-41.8%)
30.5%
(28.6%-32.4%)
Intermediate
Qualifications20.5%
(19.1%-21.9%)
33.9%
(32.0%-35.8%)
30.1%
(28.3%-31.9%)
No
Qualifications24.3%
(21.1%-27.7%)
35.3%
(29.8%-40.9%)
33.9%
(28.5%-39.4%)
♀
Tertiary
Qualifications23.6%
(21.4%-25.9%)
31.0%
(29.0%-33.0%)
28.3%
(26.4%-30.3%)
Intermediate
Qualifications14.0%
(12.8%-15.2%)
18.6%
(17.1%-20.1%)
17.3%
(15.9%-18.8%)
No
Qualifications10.6%
(8.5%-12.8%)
17.6%
(13.1%-22.7%)
17.0%
(12.6%-22.0%)
Exploring measures of postponement and partnership characteristics for estimating childlessness
We have already witnessed the consequence of avoidance of parenthood, which may be equated
to a certain extent with deliberate/voluntary childlessness. This section takes this further by examining
family forming intentions (which we term an indicator of ‘postponement’) and patterns of partnership,
both of which are likely to be direct mediators of entry into parenthood (Simpson, 2006). In particular,
while we examine changes in partnership rates among those childless at their early thirties, we also
examine the impact of changes in terms of the age differential between partners.
Our educational groups can be further stratified by family formation intentions. There is some
information on intentions about becoming a parent collected at age 33 years for NCDS, and 30 years for
BCS70 cohort members. This three year gap in measurement point is a weakness of our paper, although
a three year gap between 30 and 33 years is of less concern for us than a three year gap at younger ages.
In addition, other datasets indicate that the intentions of women changed very little between these ages
(Smallwood and Jefferies, 2003)14; and we feel that this small disparity in measurement point is a
limitation rather than a prohibition of using this information. There is also data on cohabitation,
marriage and other relationships, at these points as well as at 34 years for BCS70. Descriptively, the
population that remained childless at the early thirties has changed between cohorts in terms of
14 Smallwood and Jefferies’ data suggests that for women aged 30-32 years in 2000 (our BCS70 equivalent), 9% wanted to remain childless and the average family size was 2.09. For women aged 33-35 years in 1991 (our NCDS equivalent), 9% intended to remain childless and gave an average intended family size of 2.23. This data refers to all women (mothers and childless) and measures intentions.
13
intentions although has remained relatively stable in terms of whether or not they have a partner (Table
3). However, there are differences in the nature of these relationships including the age of the partner.
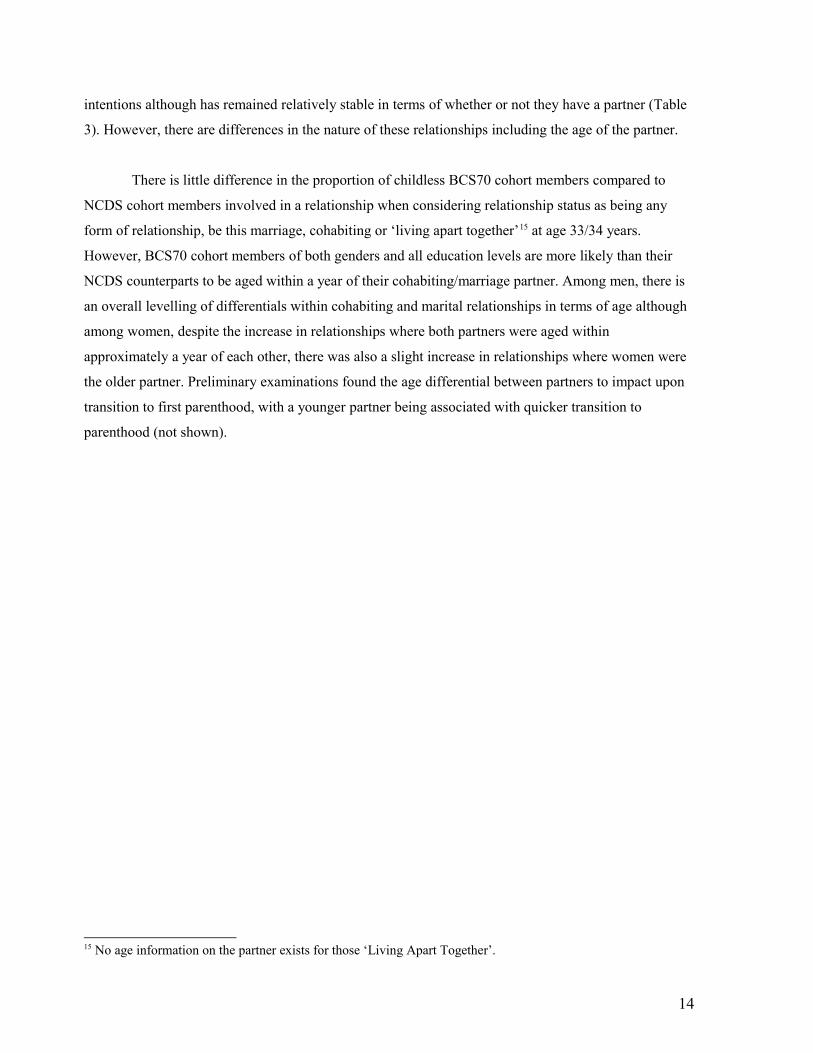
There is little difference in the proportion of childless BCS70 cohort members compared to
NCDS cohort members involved in a relationship when considering relationship status as being any
form of relationship, be this marriage, cohabiting or ‘living apart together’15 at age 33/34 years.
However, BCS70 cohort members of both genders and all education levels are more likely than their
NCDS counterparts to be aged within a year of their cohabiting/marriage partner. Among men, there is
an overall levelling of differentials within cohabiting and marital relationships in terms of age although
among women, despite the increase in relationships where both partners were aged within
approximately a year of each other, there was also a slight increase in relationships where women were
the older partner. Preliminary examinations found the age differential between partners to impact upon
transition to first parenthood, with a younger partner being associated with quicker transition to
parenthood (not shown).
15 No age information on the partner exists for those ‘Living Apart Together’.
14
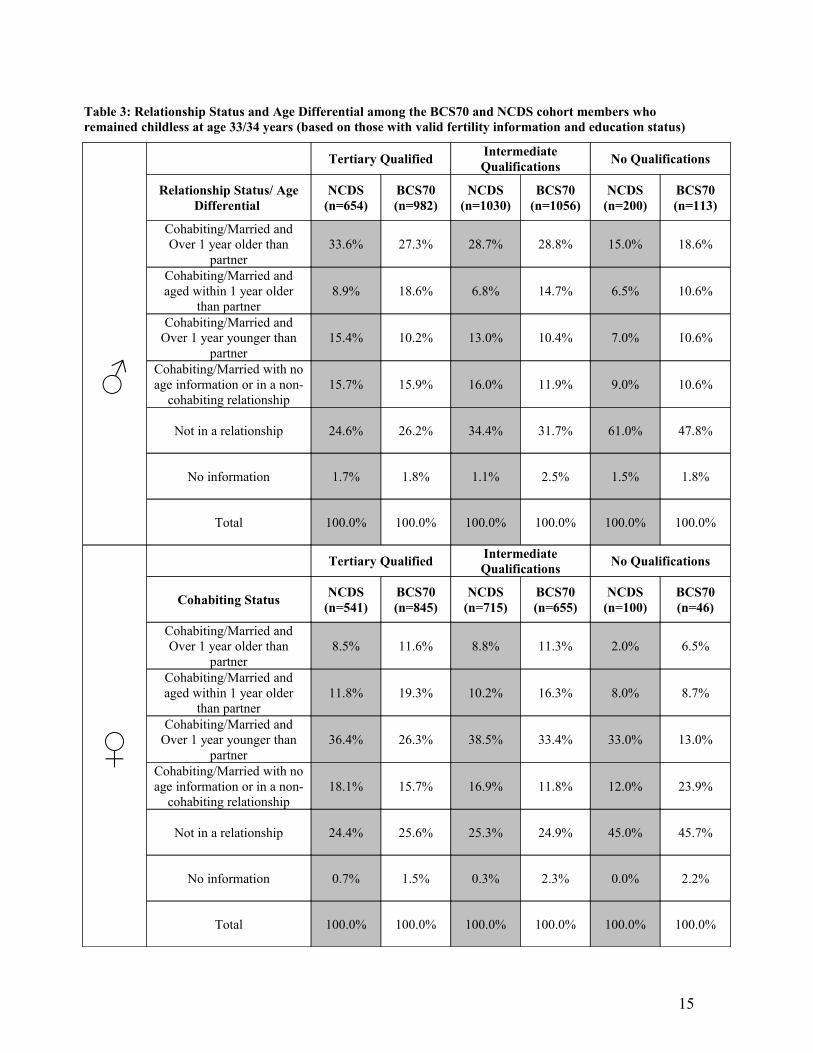
Table 3: Relationship Status and Age Differential among the BCS70 and NCDS cohort members who remained childless at age 33/34 years (based on those with valid fertility information and education status)
♂
Tertiary Qualified Intermediate Qualifications No Qualifications
Relationship Status/ Age Differential
NCDS (n=654)
BCS70 (n=982)
NCDS (n=1030)
BCS70 (n=1056)
NCDS (n=200)
BCS70 (n=113)
Cohabiting/Married and Over 1 year older than
partner33.6% 27.3% 28.7% 28.8% 15.0% 18.6%
Cohabiting/Married and aged within 1 year older
than partner8.9% 18.6% 6.8% 14.7% 6.5% 10.6%
Cohabiting/Married and Over 1 year younger than
partner15.4% 10.2% 13.0% 10.4% 7.0% 10.6%
Cohabiting/Married with no age information or in a non-
cohabiting relationship15.7% 15.9% 16.0% 11.9% 9.0% 10.6%
Not in a relationship 24.6% 26.2% 34.4% 31.7% 61.0% 47.8%
No information 1.7% 1.8% 1.1% 2.5% 1.5% 1.8%
Total 100.0% 100.0% 100.0% 100.0% 100.0% 100.0%
♀
Tertiary Qualified Intermediate Qualifications No Qualifications
Cohabiting Status NCDS (n=541)
BCS70 (n=845)
NCDS (n=715)
BCS70 (n=655)
NCDS (n=100)
BCS70 (n=46)
Cohabiting/Married and Over 1 year older than
partner8.5% 11.6% 8.8% 11.3% 2.0% 6.5%
Cohabiting/Married and aged within 1 year older
than partner11.8% 19.3% 10.2% 16.3% 8.0% 8.7%
Cohabiting/Married and Over 1 year younger than
partner36.4% 26.3% 38.5% 33.4% 33.0% 13.0%
Cohabiting/Married with no age information or in a non-
cohabiting relationship18.1% 15.7% 16.9% 11.8% 12.0% 23.9%
Not in a relationship 24.4% 25.6% 25.3% 24.9% 45.0% 45.7%
No information 0.7% 1.5% 0.3% 2.3% 0.0% 2.2%
Total 100.0% 100.0% 100.0% 100.0% 100.0% 100.0%
15
In these data, family formation expectations are grouped into five different categories from
cohort members’ responses to questions about the fecundity status of themselves and their partner and
about their desire to have children. Both cohorts were asked virtually identical questions about their
desire to have children and we group those who said ‘yes’ as being those open to having more children,
those who said ‘no’ as categorically not wanting children. The split between these two categories is
displayed in Table 5 for comparative purposes. We group as third category those who responded ‘don’t
know’ together with those who responded that they were fertile but gave no response on the desire for
children. Our fourth category, infertile, is composed of those who responded that they, or their partner,
were infertile or had been sterilized. This group is likely to represent an undercount, given that some
cohort members would not know if they were sterile/infertile, although we assume the same bias exists
in both cohorts. Our final category is those where we don’t know both their fecundity status and
intentions. Given that we know the parenthood and educational status of this group, we choose not to
lose these observations, so we model the information for this group as ‘missing’ and assume that the
reasons for missing information are similar among both cohorts. The comparison between graduate
females (non-mothers) of the two cohorts (Table 4) and shows a larger population of highly educated
childless women in BCS70 who intend to have children (childless at 34 but intentions asked at 30)
compared to NCDS (at 33) among those with non-missing data. Further evidence on those still childless
at each educational level (Table 5) shows a generally rising ratio between those categorically not
wanting children (and likely to remain voluntary childless) and those who intend to have children in the
future (potentially involuntary childless). Among those BCS70 cohort members who remained childless
at age 34 years, a significant rise in those intending to become parents when asked at age 30 years
(compared to those categorically avoiding parenthood) is observed in Table 5 between cohorts for all
groups except for tertiary qualified men, where the rise is not significant.
Table 4: Family formation intentions for tertiary qualified females (Non missing data for - BCS70: childless at 34 but intentions asked at 30; NCDS: intentions asked at 33, data for those childless at 33)
Fertility Expectations NCDS BCS70Fertile and Open to having more children 44.6% 58.3%
Fertile and Categorically not want children 20.9% 13.9%
Fertile and don't know intentions 32.2% 23.6%Infertile/Partner Infertile 2.4% 4.2%N 435 721
16

Table 5: Ratio of positive to negative fertility intentions by cohort, gender and education level for fertile16
BCS70 and NCDS cohort members (BCS70: childless at 34 but intentions asked at 30; NCDS: intentions asked at 33, data for those childless at 33)
Gender Education Level NCDS BCS70
♂Graduate Level 4.0 : 1
(n=356)4.9 : 1
(n=668)
Less than Graduate 2.2 : 1(n=476)
3.8 : 1(n=704)
No Qualifications 1.1 : 1(n=77)
2.5 : 1(n=63)
♀Graduate Level 2.1 : 1
(n=276)4.2 : 1
(n=571)
Less than Graduate 1.6 : 1(n=343)
3.1 : 1(n=440)
No Qualifications 0.9 : 1(n=40)
1.9 : 1(n=26)
The exploration of family formation intentions suggests that more of the BCS70 cohort
members still childless at 34 intended to have children, than among those remaining childless at 33 in
NCDS, who would have a larger component of people with low probability of ever becoming
parents. This descriptive evidence suggests that the BCS70 cohort is postponing, as opposed to
avoiding, parenthood. This postponement may also be partly structural, as opposed to solely preference
based, given that there was a smaller age gap and more cohabitation among the BCS70 cohort than
NCDS (Table 3). In terms of the intentions, while there is always the possibility that the differences
may be caused by differentials in measurement point, this is contested by other evidence (Smallwood
and Jefferies, 2003) and by the small nature of the interval. In the next section we introduce both
partnership and family building intentions factors into our models.
Refining estimates of childlessness
In the preceding section it was observed that the childless population measured at the early
thirties had changed between cohorts both in terms of partnership characteristics and family forming
intentions. This information can be incorporated into projections of entry patterns into parenthood
through adaptations to the Cox Proportional Hazards model. The separability assumption of covariates
16 ‘Fertile’ refers to both the cohort member’s fertility and that of their partner. Generally, those who were infertile or who had a partner who was infertile were not asked about their fertility intentions in this section. Therefore, those who have no response for either the infertility or intentions questions are categories in the missing category.
17

from the baseline hazard and the additive properties of the covariates (Singer and Willett, 2003,
Jenkins, 2004) mean that derivatives from the models can be incorporated into projections.
)exp(*)|( 0 jjj xtxt βθθ =The model describes the relationship between covariates on the hazard of experiencing
parenthood within a given period, in relation to the baseline hazard. The baseline hazard represents the
hazard when the value of covariates is set to zero. In this case, the baseline hazard is taken from a joint
consideration of sample size and frequency of events. A condition of the model is that the relationship
between covariates should remain proportional throughout the observation period. The model in this
case describes the effect of partnership and fertility intentions17 on entry into parenthood among NCDS
cohort members from age 33 to age 45 years. Derivatives from the fitted model are then applied onto
specific subpopulations of childless BCS70 cohort members. The underlying assumption is that both
cohorts will behave similarly according to fertility intentions and equally those with missing responses
will also behave similarly on aggregate. The baseline category used for the BCS70 is also that used for
NCDS in this case. In essence the model accounts for the different composition in terms of intentions
and partnership and weights for these factors accordingly. The model is dependent on having a large
number of events and individuals belonging to the baseline category.
Construction of an education and gender specific model that accounted for a binary indicator of
partnership status, age differentials, and fertility intentions was found to raise the levels of childlessness
predicted among BCS70 cohort members compared to all earlier projections presented thus far. This
was due to the small number of events that occurred in some years within the baseline category. The
models constructed were very sensitive to the impact of any periods where no events occurred and this
led to high rates of childlessness among tertiary qualified males of 40.4%, and for females up to 33.6%.
In addition, the model derivatives from the underlying Cox model were found to violate the
proportional hazards assumption when examining Schoenfeld residuals. These proportionality issues
were not encountered in a simpler model that treated partnership status as a binary variable (partnered
versus non partnered) and ignored any age differentials. The results from this simpler model are
presented in Table 6, with the results from both the simpler and more complex models using this
method giving very similar results18.
Table 6: Estimated childlessness at age 45 years for the NCDS cohort and projected childlessness for the BCS70 cohort using coefficients derived from Cox model of the effect of partnership and intentions NCDS (see Appendix (Table A3) for model coefficients)19
17 Fertility intentions in this case is composed of a joint variable that reflects infertility and fertility intentions.18 Estimates were not constructed for those with no qualifications because of sample size issues.
18

Education LevelNCDS Childless (Age
45 years)
BCS70 Childless (Age
45 years projections
using Cox method)
Tertiary Qualified Males 21.7%
(19.6%-23.8%)
40.7%
(37.6%-43.7%)Tertiary Qualified Females 23.6%
(21.4%-25.9%)
34.6%
(32.0%-37.2%)Males with intermediate qualifications 20.5%
(19.1%-21.9%)
34.5%
(32.3%-36.7%)Females with intermediate qualifications 14.0%
(12.8%-15.2%)
21.9%
(20.2%-23.7%)
Towards a preferred estimate of childlessness
Including both information on intentions and partnership presented two problems in our
models. Foremost, from a computational perspective, information from small sub-samples of the
population was being projected as leading to no events being observed in some periods. This may have
exaggerated estimates of childlessness in BCS70, and the problem was compounded with further
stratification given the low number of events in the NCDS after age 33 even among those who did
intend to have children in some years. Secondly, although the models controlled for postponement in
childbearing with the inclusion of family forming intentions; they did not control for the possible
postponement of partnership formation beyond the situation observed at 33/34. From a theoretical
perspective, partnership expectations, should have been included in the models rather than partnership
status, but this information was not collected at the relevant time for the cohort studies. As such, a
simpler model that includes only fertility intentions may be the most computationally and theoretically
viable.
In fact, when future stratified projections are adjusted to account for family building
expectations20, the proportion of the BCS70 cohort expected to remain childless reduced significantly
for all groups compared to all previous estimates presented thus far. At the age of 33 years, of those
childless women who were fertile and intended to have a first child among the NCDS cohort, 60% were
19 Confidence Intervals are again based upon Greenwood’s formula. However in this case, these are only approximations of the Greenwood formula given that this estimate is based upon aggregated data itself.20 In this case, Cox model derivatives are not necessary as with less stratification there are larger sample sizes. The projections represent the projected fertility schedule for BCS70 when the samples are split into those infertile, those fertile and intending on having children, those fertile and not intending to have children, those fertile and whose intentions are unknown and those where fertility status and intentions are unknown. The infertile group is composed of those cohort members who are infertile and/or have an infertile partner, under the assumption that partnership status will remain constant.
19

estimated to become mothers up to the age of 45 years. Given that such a high proportion of BCS70
women fell into this latter category of currently childless but intending to have children, weighting the
data accordingly reduced the proportion of tertiary qualified women projected to be childless. A similar
story existed for tertiary qualified men. These changes show that for tertiary qualified women, after
accounting for family building intentions, the projected estimate of childlessness is just 1.8 percentage
points higher for BCS70 women and 4.8 percentage points higher for BCS70 men, compared to NCDS
levels. We propose that taking into account family building intentions in these models picks up
postponement in the BCS70 cohort and therefore overwrites the ‘flight from parenthood’ scenario that
postulates a permanent withdrawal from parenthood.
Figure 3: Females with Tertiary Qualifications: Estimated entry patterns for the NCDS cohort and Projected entry patterns for BCS70 cohort members using NCDS transition rates (‘late NCDS scenario’ leading to higher estimated childlessness) and NCDS rates adjusted for postponement and infertility (lower estimated childlessness)
20

23.4%
28.3%25.2%
0%
10%
20%
30%
40%
50%
60%
70%
80%
90%
100%
0 3 6 9 12 15 18 21 24 27 30 33 36 39 42 45
Age
Prop
ortio
n E
ntrin
g M
othe
rhoo
d
NCDS Tertiary QualifiedFemales Observed
BCS70 Tertiary QualifiedFemales 'Late NCDS Scenario'
BCS70 Tertiary QualifiedFemales (Adjusted forPostponement and Infertility)
Figure 4: Males with Tertiary Qualifications: Estimated entry patterns for the NCDS cohort and Projected entry patterns for BCS70 cohort members using NCDS transition rates (‘late NCDS scenario’ leading to
21
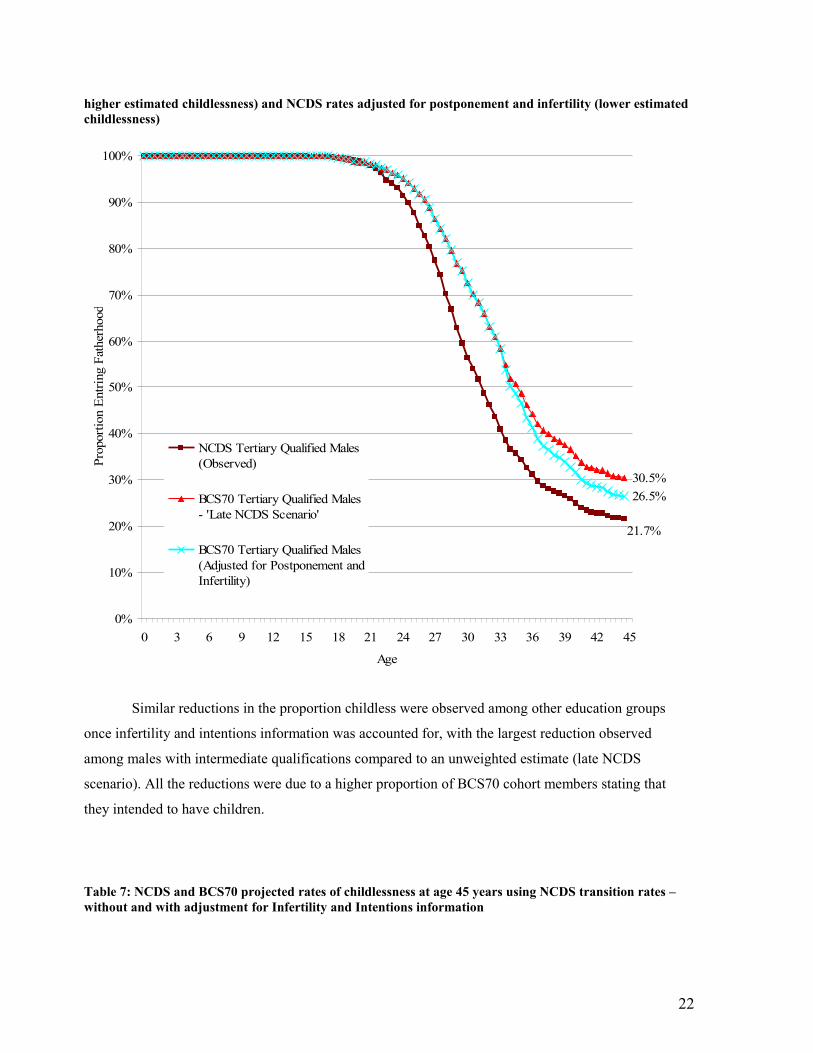
higher estimated childlessness) and NCDS rates adjusted for postponement and infertility (lower estimated childlessness)
21.7%
30.5%26.5%
0%
10%
20%
30%
40%
50%
60%
70%
80%
90%
100%
0 3 6 9 12 15 18 21 24 27 30 33 36 39 42 45
Age
Prop
ortio
n En
tring
Fat
herh
ood
NCDS Tertiary Qualified Males(Observed)
BCS70 Tertiary Qualified Males- 'Late NCDS Scenario'
BCS70 Tertiary Qualified Males(Adjusted for Postponement andInfertility)
Similar reductions in the proportion childless were observed among other education groups
once infertility and intentions information was accounted for, with the largest reduction observed
among males with intermediate qualifications compared to an unweighted estimate (late NCDS
scenario). All the reductions were due to a higher proportion of BCS70 cohort members stating that
they intended to have children.
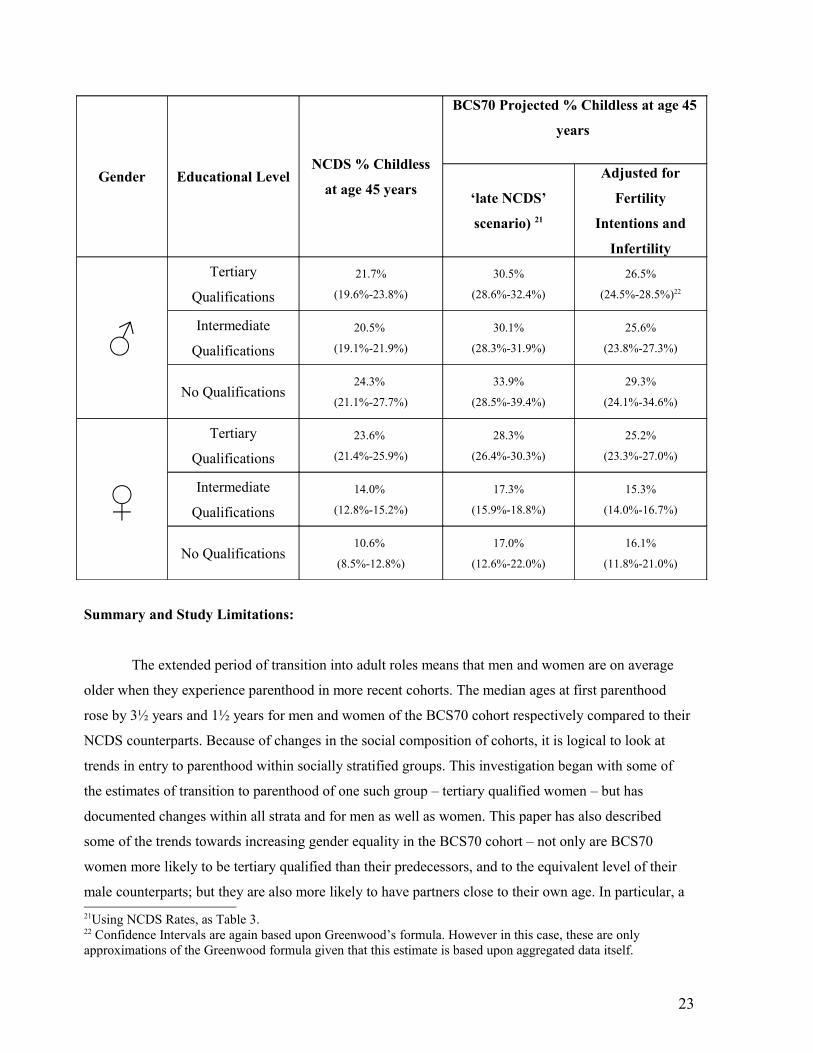
Table 7: NCDS and BCS70 projected rates of childlessness at age 45 years using NCDS transition rates – without and with adjustment for Infertility and Intentions information
22
Gender Educational LevelNCDS % Childless
at age 45 years
BCS70 Projected % Childless at age 45
years
‘late NCDS’
scenario) 21
Adjusted for
Fertility
Intentions and
Infertility
♂
Tertiary
Qualifications21.7%
(19.6%-23.8%)
30.5%
(28.6%-32.4%)
26.5%
(24.5%-28.5%)22
Intermediate
Qualifications20.5%
(19.1%-21.9%)
30.1%
(28.3%-31.9%)
25.6%
(23.8%-27.3%)
No Qualifications24.3%
(21.1%-27.7%)
33.9%
(28.5%-39.4%)
29.3%
(24.1%-34.6%)
♀
Tertiary
Qualifications23.6%
(21.4%-25.9%)
28.3%
(26.4%-30.3%)
25.2%
(23.3%-27.0%)
Intermediate
Qualifications14.0%
(12.8%-15.2%)
17.3%
(15.9%-18.8%)
15.3%
(14.0%-16.7%)
No Qualifications10.6%
(8.5%-12.8%)
17.0%
(12.6%-22.0%)
16.1%
(11.8%-21.0%)
Summary and Study Limitations:
The extended period of transition into adult roles means that men and women are on average
older when they experience parenthood in more recent cohorts. The median ages at first parenthood
rose by 3½ years and 1½ years for men and women of the BCS70 cohort respectively compared to their
NCDS counterparts. Because of changes in the social composition of cohorts, it is logical to look at
trends in entry to parenthood within socially stratified groups. This investigation began with some of
the estimates of transition to parenthood of one such group – tertiary qualified women – but has
documented changes within all strata and for men as well as women. This paper has also described
some of the trends towards increasing gender equality in the BCS70 cohort – not only are BCS70
women more likely to be tertiary qualified than their predecessors, and to the equivalent level of their
male counterparts; but they are also more likely to have partners close to their own age. In particular, a 21Using NCDS Rates, as Table 3. 22 Confidence Intervals are again based upon Greenwood’s formula. However in this case, these are only approximations of the Greenwood formula given that this estimate is based upon aggregated data itself.
23
key finding of this paper has been the incompleteness of considering only female fertility histories
when examining fertility trends.
Males of all education levels in the 1970 cohort entered parenthood at a lower pace than their
equivalent NCDS predecessors, and much more so than BCS70 women. Highly educated males showed
most postponement at age 34 years, even more than highly educated women. When projecting these
data forward and establishing how many BCS70 cohort members would eventually become parents by
age of 45, under a variety of assumptions, BCS70 tertiary qualified men were predicted to sustain rates
of childlessness ranging between 26-40%, the highest of any group. BCS70 tertiary qualified women
were projected to experience rates of eventual childlessness of between 25-35%. Projections for those
males and females with intermediate and no qualifications showed a lower proportion of parents than
NCDS, but differences between these two groups tended to narrow for BCS70. Our preferred method of
projection, stratifying the cohort according to fertility intentions to allow for postponement,
unsurprisingly, generates the lowest rates of childlessness. These forecast that approximately a quarter
of tertiary qualified men and women to be childless by age 45. These projections consolidate
descriptive evidence that later cohorts are postponing, as opposed to avoiding, parenthood. We find no
credible evidence to suggest 40% of tertiary qualified women born in 1970 will enter their forties
childless and a figure well under a third is far more likely.
This exercise has revealed the inadequacy of considering only female fertility histories when
considering fertility trends. The increasing and differentiated delay at entry to fatherhood and male
childlessness are important aspects of the shifting pattern of parenthood in Britain. While we
acknowledge that there is some margin of error associated with estimates therefore in terms of
underreporting of fatherhood trajectories, we also assume that this error is distributed equally across
cohorts.
As noted, these projections rest upon various assumptions, which in themselves present
theoretical challenges. This paper does not attempt to model the causal relationship between fertility
and education. Instead, it examines trends within separate populations that are stratified by the level of
education attained in the early thirties, describing their trajectories of entry into parenthood and
projecting these patterns forward. This rests upon the assumption that education preceded childbirth, or
was anticipated. This may not be the case particularly for the non-negligible minority of tertiary
qualified early mothers in the BCS70. Any earlier age of assessing attainment would have introduced
24
inconsistencies in measurement points between cohorts23. It also should be noted that the favoured
projection is based upon reported expectations: material and biological circumstance may prevent
cohort members from achieving intended fertility which may change over time. In addition, some
research has highlighted the tendency of women to overestimate their future fertility and this may be
linked to age (Smallwood and Jefferies, 2003, Berrington, 2004, McAllister and Clarke, 1998)24.
However, given that both cohorts were asked the same question at around the same age, there is little
reason to expect that this ‘overestimating’ bias would be unevenly distributed between cohorts. In
reality, all intentions with respect to female fertility, and to a lesser extent male fertility, are moderated
by fecundity – known to decrease linearly from the early twenties (McDonald et al., 2005). This may be
moderated for a minority by assisted fertility technology to which the BCS70 cohort have more access.
Nevertheless, postponement represents a risky strategy and there is no indication of exactly how far into
the fertility schedule BCS70 cohort members intend to postpone. Finally, there is both a lack of
evidence and of neutral vocabulary to distinguish the situation where not becoming a parent is seen as
revealing positive agency (avoidance) or has the negative connotations of failures or frustration beyond
individual control. In practice, some childlessness seen is ambivalent25.
Conclusions
The implications of postponement, presented in this paper as the rise in population who do not
have children until their thirties, are two-fold. Firstly, we can expect a rise in the numbers experiencing
‘ambivalent’ childlessness is likely to occur. This group of people have been termed ‘perpetual
postponers’ elsewhere in the literature – a group (of women) who maintain a latent desire for children
but do not act upon this either at all, or until it’s too late (Berrington, 2004). The rise in ‘perpetual
postponers’ could lead to, greater reliance on assisted methods of conception (Beets, 1995), further
decreases in birth rates at all orders, rises in the numbers adopting or fostering children and possible
rises in partnership dissolutions where childlessness becomes a destabilising factor. This is a group
23 This was the point that was closest between both cohorts. An alternative could have been comparing the 23 year olds with 26 year olds but this difference would be great given the relative young age of both cohorts. In addition, the BCS70 26 year old survey would have suffered from low response given that it was a self-completed postal survey that was used for this sweep. The date of obtaining highest qualification is not collected consistently between cohorts, which precluded using qualifications gained by a younger age, retrospectively.24 McAllister and Clarke (1998) state that younger women actually under estimate their fertility when asked about family formation in their early twenties, although Smallwood and Jefferies find young women in their study overestimate their fertility by at least 10%.25 The term ambivalent is used as opposed to involuntary childlessness to reflect the distinction that these were cohort members who were open to having children, although not necessarily actively planning/seeking to become parents. The portion of this group not actively planning/seeking to become parents who remain childless should more accurately be termed voluntary childless, as according to McAllister and Clarke’s distinction (1998).
25
whose fertility ideals might be addressed by policies which eased the obstacles to starting parenthood
sooner. Secondly, the impact of having older (and ‘oldest’, those aged 40 and above) parents on
children’s development and socioeconomic circumstances is comparatively under-researched in
comparison to the impact of having younger parents. While it is known that having an older first time
mother is usually associated with advantageous material circumstances, this is not always the case for
the oldest first time mothers. Little is known of the effect of having older parents on parenting styles,
health or future material dependency. In addition, the composition of households may begin to change,
parents may become dependents much earlier in their children’s working lives.
The process of delaying parenthood among the 1970 birth cohort is more striking for highly
qualified men than highly qualified women. This suggests that the postponement of parenthood is not
solely due to the career aspirations of highly qualified women. In many cases it is likely to be a joint
decision of career couples, or a decision of both men and women with careers to avoid commitments to
childrearing partnerships. In addition, smaller age gaps between partners may also be influential in
slowing transition to first parenthood. As parenthood is a two-person enterprise, it appears apparent that
family friendly policies should concern both men and women given that careers need not necessarily be
incompatible with childrearing.
Acknowledgements
We would like to acknowledge the contribution of Jane Elliott in reviewing earlier drafts of this
paper and for her overall input into the project; to the reviewers and editors at Demographic
Research in shaping this version, as well as to Shirley Dex for her editorial input. We would also
like to acknowledge Jon Johnson and Brian Dodgeon for all their assistance in collating data, and
the ESRC for financial support via UPTAP. Finally we would like to thank the members of the
NCDS and BCS70 cohort members for their entirely voluntary co-operation with the surveys over
many years.
Bibliography
26
Appendices
Appendix 1: Sample inclusion for fertility data
NCDS sample inclusion
At age 23 and 33 years, full fertility histories were collected. At age 33 years this was collected
through two measures, with differences reconciled in a later release (Di Salvo, 2000). At the next point
of data collection (41-42 years), fertility information was collected through a CAPI (Computer Assisted
Personal Interview) instrument. For those respondents present at 33 years, fertility information since
1991 was explicitly collected; while for other respondents fertility information since their previous
interview was collected through a CAPI filtering system. However, the analysis of births reveals no
distinction in the average date of first birth recorded between those continuing the study and those
rejoining. While for some respondents rejoining the study at 41-42 years, this may represent an accurate
picture in that their first birth did occur after 1991, this is unlikely to be the case for some recorded in
this way.26 Because of this potential problem, some observations have been artificially truncated at age
23 years, while information for a small minority of others has not been used in this analysis. The
following table outlines the inclusion criteria for NCDS fertility information.
Table A1: Inclusion Criteria for use of fertility data: NCDS by presence at sweeps 4-7
26 While there are cases of births occurring before 1991 among those rejoining the study and those continuing the study; these cases are proportionally ? more numerous in the group continuing the study.
27
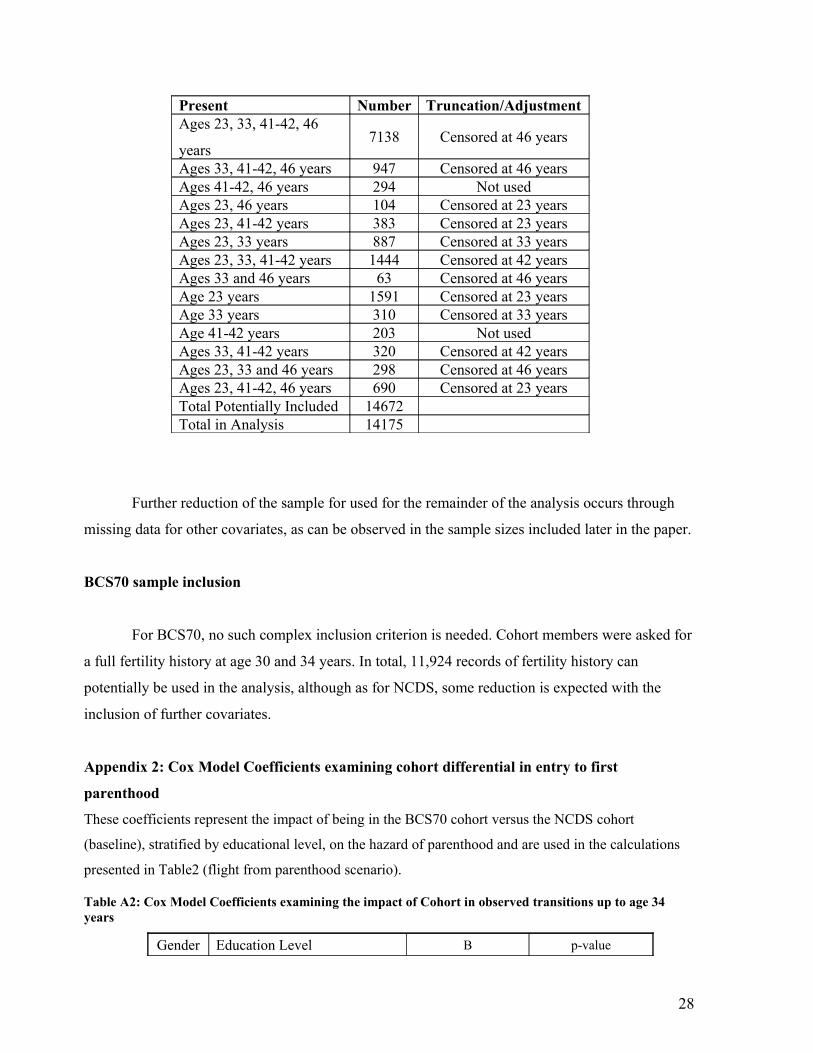
Present Number Truncation/AdjustmentAges 23, 33, 41-42, 46
years7138 Censored at 46 years
Ages 33, 41-42, 46 years 947 Censored at 46 yearsAges 41-42, 46 years 294 Not usedAges 23, 46 years 104 Censored at 23 yearsAges 23, 41-42 years 383 Censored at 23 yearsAges 23, 33 years 887 Censored at 33 yearsAges 23, 33, 41-42 years 1444 Censored at 42 yearsAges 33 and 46 years 63 Censored at 46 yearsAge 23 years 1591 Censored at 23 yearsAge 33 years 310 Censored at 33 yearsAge 41-42 years 203 Not usedAges 33, 41-42 years 320 Censored at 42 yearsAges 23, 33 and 46 years 298 Censored at 46 yearsAges 23, 41-42, 46 years 690 Censored at 23 yearsTotal Potentially Included 14672Total in Analysis 14175
Further reduction of the sample for used for the remainder of the analysis occurs through
missing data for other covariates, as can be observed in the sample sizes included later in the paper.
BCS70 sample inclusion
For BCS70, no such complex inclusion criterion is needed. Cohort members were asked for
a full fertility history at age 30 and 34 years. In total, 11,924 records of fertility history can
potentially be used in the analysis, although as for NCDS, some reduction is expected with the
inclusion of further covariates.
Appendix 2: Cox Model Coefficients examining cohort differential in entry to first
parenthood
These coefficients represent the impact of being in the BCS70 cohort versus the NCDS cohort
(baseline), stratified by educational level, on the hazard of parenthood and are used in the calculations
presented in Table2 (flight from parenthood scenario).
Table A2: Cox Model Coefficients examining the impact of Cohort in observed transitions up to age 34 years
Gender Education Level Β p-value
28

♂Tertiary Qualifications -0.51 0.00
Intermediate Qualifications27 -0.36 0.00
No Qualifications -0.26 0.00
♀ Tertiary Qualifications -0.22 0.00
Intermediate Qualifications -0.20 0.00
No Qualifications28 -0.34 0.01
Appendix 3: Cox Model Coefficients examining the effect of partnership and intentions on
entry into parenthood among the NCDS cohort from the age of 33 years
These coefficients represent the impact of different categories of partnership and family forming
intentions among NCDS cohort members from the age of 33 year onwards and are used in the
calculation of estimates presented in Table 6. The information for those with no qualifications is not
27 Because of concerns of proportionality, the beginning observation date was altered to 23 years28 Because of concerns of proportionality, the beginning observation date was altered to 23 years
29
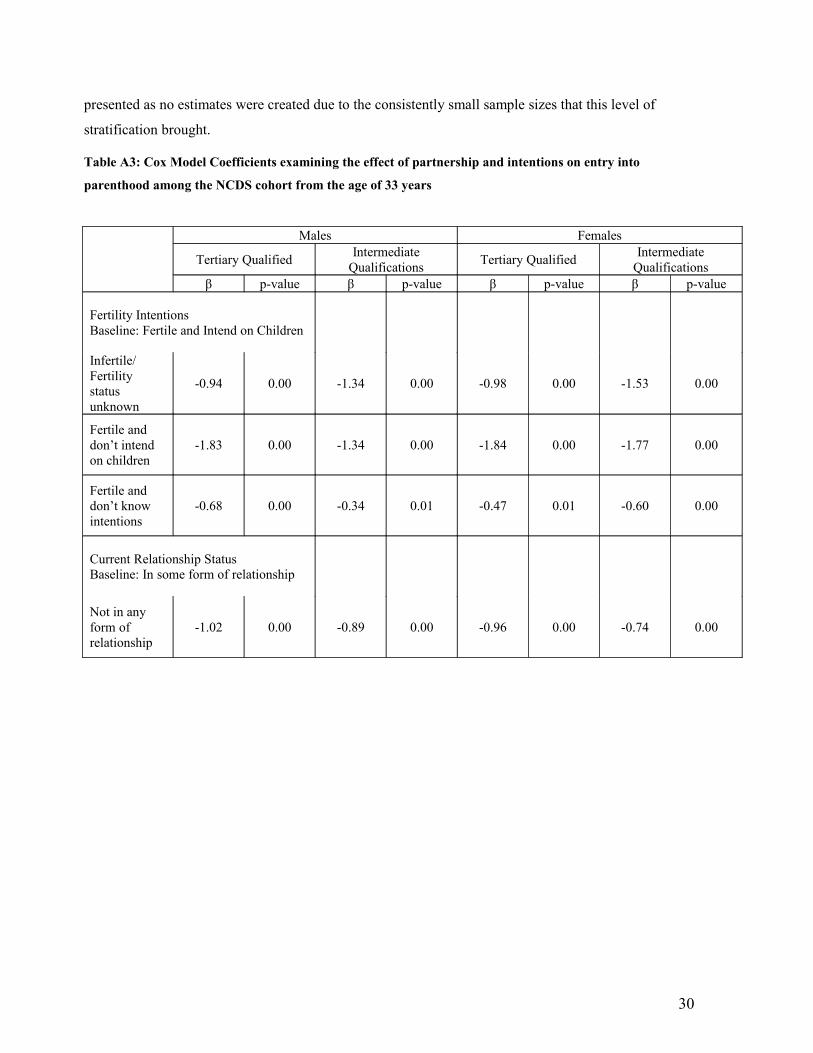
presented as no estimates were created due to the consistently small sample sizes that this level of
stratification brought.
Table A3: Cox Model Coefficients examining the effect of partnership and intentions on entry into
parenthood among the NCDS cohort from the age of 33 years
Males Females
Tertiary Qualified Intermediate Qualifications Tertiary Qualified Intermediate
Qualificationsβ p-value β p-value β p-value β p-value
Fertility Intentions Baseline: Fertile and Intend on Children
Infertile/ Fertility status unknown
-0.94 0.00 -1.34 0.00 -0.98 0.00 -1.53 0.00
Fertile and don’t intend on children
-1.83 0.00 -1.34 0.00 -1.84 0.00 -1.77 0.00
Fertile and don’t know intentions
-0.68 0.00 -0.34 0.01 -0.47 0.01 -0.60 0.00
Current Relationship StatusBaseline: In some form of relationship
Not in any form of relationship
-1.02 0.00 -0.89 0.00 -0.96 0.00 -0.74 0.00
30