Embed Size (px)
Citation preview
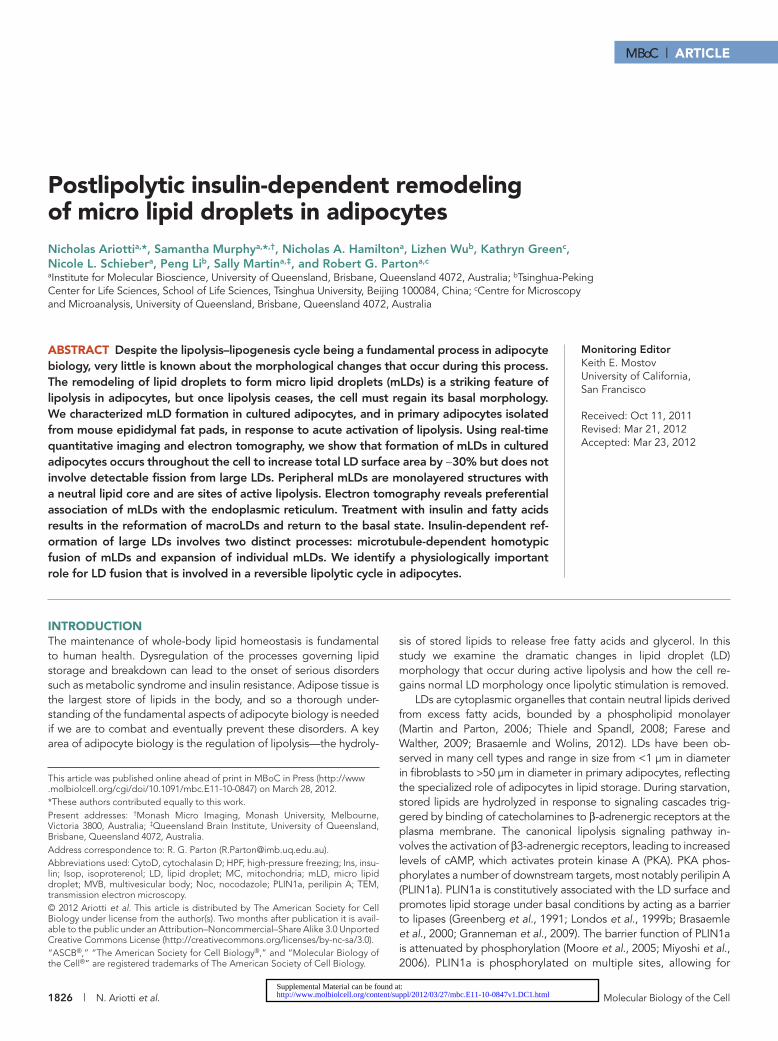
1826 | N. Ariotti et al. Molecular Biology of the Cell
MBoC | ARTICLE
Postlipolytic insulin-dependent remodeling of micro lipid droplets in adipocytesNicholas Ariottia,*, Samantha Murphya,*,†, Nicholas A. Hamiltona, Lizhen Wub, Kathryn Greenc, Nicole L. Schiebera, Peng Lib, Sally Martina,‡, and Robert G. Partona,c
aInstitute for Molecular Bioscience, University of Queensland, Brisbane, Queensland 4072, Australia; bTsinghua-Peking Center for Life Sciences, School of Life Sciences, Tsinghua University, Beijing 100084, China; cCentre for Microscopy and Microanalysis, University of Queensland, Brisbane, Queensland 4072, Australia
ABSTRACT Despite the lipolysis–lipogenesis cycle being a fundamental process in adipocyte biology, very little is known about the morphological changes that occur during this process. The remodeling of lipid droplets to form micro lipid droplets (mLDs) is a striking feature of lipolysis in adipocytes, but once lipolysis ceases, the cell must regain its basal morphology. We characterized mLD formation in cultured adipocytes, and in primary adipocytes isolated from mouse epididymal fat pads, in response to acute activation of lipolysis. Using real-time quantitative imaging and electron tomography, we show that formation of mLDs in cultured adipocytes occurs throughout the cell to increase total LD surface area by ∼30% but does not involve detectable fission from large LDs. Peripheral mLDs are monolayered structures with a neutral lipid core and are sites of active lipolysis. Electron tomography reveals preferential association of mLDs with the endoplasmic reticulum. Treatment with insulin and fatty acids results in the reformation of macroLDs and return to the basal state. Insulin-dependent ref-ormation of large LDs involves two distinct processes: microtubule-dependent homotypic fusion of mLDs and expansion of individual mLDs. We identify a physiologically important role for LD fusion that is involved in a reversible lipolytic cycle in adipocytes.
INTRODUCTIONThe maintenance of whole-body lipid homeostasis is fundamental to human health. Dysregulation of the processes governing lipid storage and breakdown can lead to the onset of serious disorders such as metabolic syndrome and insulin resistance. Adipose tissue is the largest store of lipids in the body, and so a thorough under-standing of the fundamental aspects of adipocyte biology is needed if we are to combat and eventually prevent these disorders. A key area of adipocyte biology is the regulation of lipolysis—the hydroly-
sis of stored lipids to release free fatty acids and glycerol. In this study we examine the dramatic changes in lipid droplet (LD) morphology that occur during active lipolysis and how the cell re-gains normal LD morphology once lipolytic stimulation is removed.
LDs are cytoplasmic organelles that contain neutral lipids derived from excess fatty acids, bounded by a phospholipid monolayer (Martin and Parton, 2006; Thiele and Spandl, 2008; Farese and Walther, 2009; Brasaemle and Wolins, 2012). LDs have been ob-served in many cell types and range in size from <1 μm in diameter in fibroblasts to >50 μm in diameter in primary adipocytes, reflecting the specialized role of adipocytes in lipid storage. During starvation, stored lipids are hydrolyzed in response to signaling cascades trig-gered by binding of catecholamines to β-adrenergic receptors at the plasma membrane. The canonical lipolysis signaling pathway in-volves the activation of β3-adrenergic receptors, leading to increased levels of cAMP, which activates protein kinase A (PKA). PKA phos-phorylates a number of downstream targets, most notably perilipin A (PLIN1a). PLIN1a is constitutively associated with the LD surface and promotes lipid storage under basal conditions by acting as a barrier to lipases (Greenberg et al., 1991; Londos et al., 1999b; Brasaemle et al., 2000; Granneman et al., 2009). The barrier function of PLIN1a is attenuated by phosphorylation (Moore et al., 2005; Miyoshi et al., 2006). PLIN1a is phosphorylated on multiple sites, allowing for
Monitoring EditorKeith E. MostovUniversity of California, San Francisco
Received: Oct 11, 2011Revised: Mar 21, 2012Accepted: Mar 23, 2012
This article was published online ahead of print in MBoC in Press (http://www .molbiolcell.org/cgi/doi/10.1091/mbc.E11-10-0847) on March 28, 2012.*These authors contributed equally to this work.Present addresses: †Monash Micro Imaging, Monash University, Melbourne, Victoria 3800, Australia; ‡Queensland Brain Institute, University of Queensland, Brisbane, Queensland 4072, Australia.Address correspondence to: R. G. Parton ([email protected]).
© 2012 Ariotti et al. This article is distributed by The American Society for Cell Biology under license from the author(s). Two months after publication it is avail-able to the public under an Attribution–Noncommercial–Share Alike 3.0 Unported Creative Commons License (http://creativecommons.org/licenses/by-nc-sa/3.0).“ASCB®,” “The American Society for Cell Biology®,” and “Molecular Biology of the Cell®” are registered trademarks of The American Society of Cell Biology.
Abbreviations used: CytoD, cytochalasin D; HPF, high-pressure freezing; Ins, insu-lin; Isop, isoproterenol; LD, lipid droplet; MC, mitochondria; mLD, micro lipid droplet; MVB, multivesicular body; Noc, nocodazole; PLIN1a, perilipin A; TEM, transmission electron microscopy.
http://www.molbiolcell.org/content/suppl/2012/03/27/mbc.E11-10-0847v1.DC1.htmlSupplemental Material can be found at:

Volume 23 May 15, 2012 Insulin-dependent lipid droplet remodeling | 1827
surface of the large LD (Figure 1B). At higher magnification these puncta had a defined ring shape consistent with spherical mLDs (Figure 1B). Analysis of mLD number overlying the large LD surface showed an average of 18 mLDs/10 μm2, giving an upper limit of ∼40,000 mLDs/cell.
Having established that mLDs are also formed in primary adipo-cytes, we further examined the biogenesis and characteristics of mLDs using 3T3-L1 adipocytes as a model system. Three-dimen-sional rendering of confocal z-stack images showed mLDs distrib-uted throughout the cell, with particular abundance close to the basal surface (unpublished data). Time-course analysis of cells dur-ing Isop treatment showed an increase in the number of mLDs over 30 min, reaching a steady state of 113 ± 4 mLDs/cell (Figure 1C). Because no significant change in mLD number was observed over the subsequent 6 h, 30 min of Isop treatment was used in all subse-quent experiments unless otherwise stated. Control cells contained <10 LDs small enough to class as mLDs, indicating that ∼10% of the mLDs observed in lipolytically active adipocytes were likely to repre-sent preexisting LDs. PLIN1a-labeled mLDs could be counterstained with the neutral lipid dye Bodipy 493/503 (Figure 1D), demonstrat-ing that mLDs are bona fide LDs with a PLIN1a-positive membrane surrounding a neutral lipid core.
To further characterize the mLDs, we used transmission electron microscopy after high-pressure freezing (cryofixation) and low-tem-perature embedding. In lipolytically active cells, abundant small cir-cular structures 50 nm to 1 μm in diameter with electron-lucent cen-ters and monolayer membranes, prototypical of lipid droplets, were evident throughout the cell (Figure 1E, arrows). Immunogold labeling of cryofixed cells showed LDs labeled with PLIN1a under control con-ditions and labeling of both mLD and LDs in cells treated with Isop. Immunogold labeling for phospho-PKA substrates showed negligible labeling of the LD surface under control conditions, but in cells treated with Isop both LDs and mLDs were heavily labeled (Figure 1E). To analyze the interaction of mLDs with other organelles, tomo-grams were generated from cryofixed, lipolytically active 3T3-L1 adi-pocytes. The reconstructed tomograms highlighted the monolayer membrane of the mLDs, in contrast to the obvious bilayered mem-brane of the surrounding organelles, such as the endoplasmic reticu-lum (ER; Figure 1F). Complete segmentation analysis of reconstructed tomograms was undertaken to determine the extent of spatial inter-action between mLDs and other cellular organelles in randomly se-lected peripheral areas of cryofixed cells processed as described earlier or processed using a conventional fixation and embedding scheme (Figure 2 and Supplemental Video S1). A close association between mLDs and the ER was observed in all tomographic volumes (Figure 2, A, B, and D). ER elements could be seen to bridge between individual mLDs and showed particularly close apposition to the mLD surface as compared with other organelles, such as mitochondria and multivesicular bodies (MVBs). This finding was supported by quanti-tative analysis; ER showed a preferential enwrapping of mLDs when compared with both mitochondria and MVBs using an unbiased ex-traction method for volumetric data (Figure 2, B and C).
The wide distribution and largely peripheral localization of mLDs, together with the relative infrequency of mLD association with LDs, raised the question of how mLDs are formed. Initial studies noting the presence of mLDs in lipolytically active adipocytes refer to the “fragmentation” of large LDs giving rise to mLDs (Brasaemle et al., 2004; Marcinkiewicz et al., 2006), suggesting that mLD biogenesis occurs by way of fission or budding from the LD surface. Although CARS microscopy showed mLDs appearing in the cell periphery with no observable budding from the large LDs, these studies relied on observation of single planes that could miss infrequent budding
complex layers of control (Souza et al., 2002; Tansey et al., 2003; Miyoshi et al., 2006; Wang et al., 2009). Although the signaling path-ways involved in lipolysis have been studied in detail (Londos et al., 1999a; Brasaemle et al., 2000; Garcia et al., 2004; Moore et al., 2005; Granneman et al., 2009; Martin et al., 2009), few studies have ana-lyzed the concurrent morphological changes that occur in the cell.
Chronic stimulation of β3-adrenergic receptor–mediated lipoly-sis in rats and mice induces appearance of small LDs (Himms-Hagen et al., 2000; Granneman et al., 2005; Koh et al., 2009). The appear-ance of hundreds of tiny LDs (<1 μm in diameter), termed micro lipid droplets (mLDs), has also been documented in cultured 3T3-L1 adipocytes upon stimulation of lipolysis (Brasaemle et al., 2004; Marcinkiewicz et al., 2006; Yamaguchi et al., 2007). Four proteins have been localized to the mLD surface—PLIN1a, ADRP (PLIN2), S3-12 (PLIN4), and CGI-58 (Brasaemle et al., 2004; Marcinkiewicz et al., 2006; Yamaguchi et al., 2007). However, only PLIN1a and CGI-58 have been studied in the context of mLD biology. Stimula-tion of lipolysis triggered the translocation of CGI-58 from the LD surface to the cytosol, and within 10 min CGI-58 was detectable on mLDs. However, CGI-58 was not required for mLD biogenesis, as demonstrated by small interfering RNA knockdown experiments (Yamaguchi et al., 2007). Marcinkiewicz et al. (2006) showed that PLIN1a localized to mLDs in 3T3-L1 adipocytes and that PLIN1a phosphorylation at serine 492 directed LD dispersion in fibroblasts. The appearance of mLDs and reduction of larger LDs were initially considered to be a fragmentation process in which phosphorylation of PLIN1a mediated mLD dispersion. However, no evidence for fragmentation has been obtained using detailed coherent anti-Stokes Raman scattering (CARS) microscopy (Yamaguchi et al., 2007). In addition, although insulin inhibits lipolytic signaling (Kitamura et al., 1999; Duncan et al., 2007), no studies have ad-dressed how the adipocyte returns to a basal state, characterized by the reformation of macroLDs.
RESULTSIn agreement with previous studies, mLDs (defined by their size, <1 μm in diameter, labeling for PLIN1a, neutral lipid content, and peripheral distribution) were observed in 3T3-L1 adipocytes lipolyti-cally stimulated using isoproterenol (Isop) for 30 min (Figure 1A; Brasaemle et al., 2004; Marcinkiewicz et al., 2006; Yamaguchi et al., 2007). We hypothesized that if mLD formation is a physiologically relevant phenomenon, reversal of the lipolytic state would trigger a return to the distribution and morphology of LDs observed before lipolytic stimulation. Consistent with this hypothesis, insulin stimula-tion of lipolytically active 3T3-L1 adipocytes resulted in the loss of mLDs and a return to a lipolytically inactive morphology (Figure 1A). These data demonstrate that LDs undergo dramatic and reversible changes in morphology and distribution during a full cycle of fatty acid release and storage in a model adipocyte cell line.
To further examine the physiological relevance of LD restructur-ing during lipolysis, we examined the morphology of LDs upon acute stimulation of primary mouse adipocytes in vitro. Although previous studies noted the appearance of multilocular adipocytes after chronic lipolytic stimulation of adipose tissue in vivo (Sugihara et al., 1987; Funatsumaru, 1995; Himms-Hagen et al., 2000; Granneman et al., 2005; Koh et al., 2009), the effect of acute treat-ment on mLD formation was not shown. Primary adipocytes were isolated from the epididymal fat pads of C57Bl/6 mice and stimu-lated with Isop for 90 min. Under basal conditions PLIN1a labeled the surface of the single large LD, as well as clusters of small to medium-sized LDs near the nucleus (Figure 1B). After treatment with Isop, small, PLIN1a-positive puncta were observed overlying the

1828 | N. Ariotti et al. Molecular Biology of the Cell
FIGURE 1: mLDs are sites of active lipolysis and interact with other organelles. (A) 3T3-L1 adipocytes were stimulated with 10 μM (in CO2-independent media containing 0.1% bovine serum albumin) Isop ± 18 h chase in 100 nM insulin, labeling PLIN1a. Far right, a higher magnification view of mLDs after isoproterenol treatment. Bar, 10 μm. (B) Primary mouse adipocytes were directly fixed (Cont) or stimulated with 10 μM Isop for 1.5 h. Labeling: PLIN1a (red), 4′,6-diamidino-2-phenylindole (blue). Bottom, higher-magnification views of PLIN1a labeling from boxed areas at top. Bar, 20 μm; 5 μm in zoom. (C) 3T3-L1 adipocytes were stimulated with 10 μM Isop for 0–60 min and mLDs/cell analyzed. Results shown mean ± SEN (>50 cells, three experiments). (D) Confocal images show mLDs labeled for PLIN1a costained with Bodipy 493/503 (arrows). Bar, 5 μm. (E) Transmission electron microscopy images of Isop-treated 3T3-L1 adipocytes showing electron-lucent structures <1 μm in diameter (arrows). Bar, 2 μm. Images depict associations between mLDs and the ER, mitochondria (MC), and endosomes (E). Bars, 200 nm. Thin sections of control and Isop-treated 3T3-L1 adipocytes immunogold labeled for either PLIN1a or phospho-PKA substrates (arrowheads). Bars, 500 nm. (F) Representative mLD in an electron tomogram showing the electron-lucent center and monolayer membrane (arrowhead, orange highlight), distinguishable from the bilayered membrane of the neighboring ER (open arrowhead, green highlight). Bar, 100 nm.

Volume 23 May 15, 2012 Insulin-dependent lipid droplet remodeling | 1829
FIGURE 2: mLDs interact preferentially with the endoplasmic reticulum. (A) An optical slice and complete reconstruction of several mLDs from HPF and Lowicryl-embedded, Isop-treated adipocyte. mLD, green; ER, light blue; MC, red, multivesicular bodies (MVBs); dark blue, plasma membrane (PM); yellow and gold, unknown. Bar, 200 nm. (B) Close spatial proximity and preferential association can be observed between mLDs and the endoplasmic reticulum when compared with other cellular organelles. Bar, 200 nm. (C) Quantification of the average volume of ER in close proximity to mLDs, MC, and MVBs. A significant difference in the volume of ER was observed when mLDs were compared with MVBs (p = 0.01). (D) Electron tomography of two different, fixed, Isop-treated adipocytes, further demonstrating the close association between ER and mLDs. mLD, green; ER, light blue. Bar, 100 nm.

1830 | N. Ariotti et al. Molecular Biology of the Cell
simultaneously appearing both in the cell periphery and close to large LDs (Figure 3A and Supplemental Video S2). No fission of the large LDs was observed in the time frames studied. The diameter of the mLDs increased from ∼0.4 μm after 5 min of stimu-lation to ∼0.6 μm after 30 min. Assuming that mLDs are spherical with an average di-ameter of 0.5 μm, we have that each mLD has a surface area of ∼3 μm2 and volume of ∼0.5 μm3. Therefore the formation of mLDs requires the generation of 18 μm2 of mono-layer/min, reaching a total of 540 μm2 by 30 min. This equates to 36.5% of the initial total LD membrane in the cell. However, the total volume contained within the mLDs at 30 min was only 105 μm3 (at a rate of 3.5 μm3/min), equivalent to only 7.3% of the total ini-tial LD volume. From these data it is clear that mLD formation significantly increases the total LD surface area-to-volume ratio.
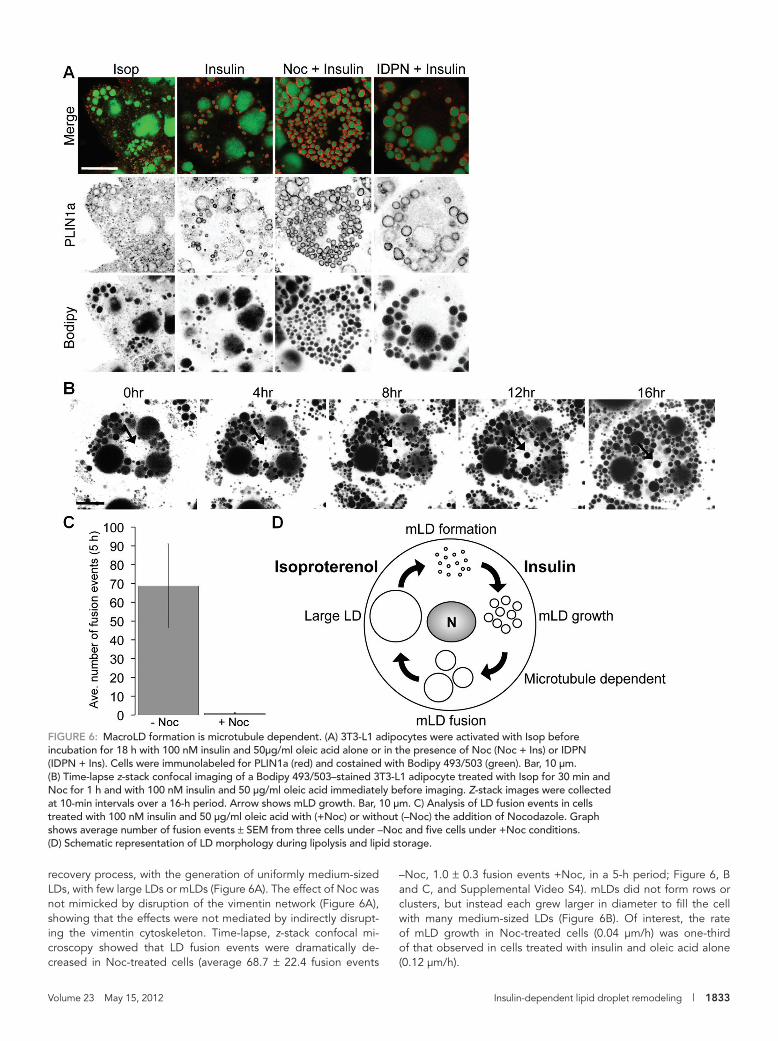
The peripheral localization of mLDs sug-gested a possible role for the cytoskeleton in mLD biogenesis. However, when 3T3-L1 adipocytes were pretreated with nocodazole (Noc) to disrupt or with Taxol to stabilize mi-crotubules before lipolytic activation, mLD formation proceeded normally. Similarly, cy-tochalasin D pretreatment to disrupt the ac-tin cytoskeleton or β, β’-iminodipropionitrile (IDPN) treatment to disrupt vimentin had no effect on mLD formation (Figure 3E-F). Together with our observations in live cells, these data indicate that mLDs are not formed via fission of large LDs and subsequent cytoskeletal transport to the cell periphery.
As shown in Figure 1A, insulin stimula-tion of lipolytically active cells resulted in a decrease in mLDs concomitant with in-creased numbers of large LDs, here termed macroLDs. Consistent with an active regula-tory role for insulin in macroLD formation, removal of the Isop stimulus alone did not result in any significant loss of mLDs or for-mation of macroLDs (Figure 4, A and B). In contrast, overnight treatment with insulin caused mLD number to decrease signifi-cantly, showing that reversal of the lipolytic state is accelerated by insulin action.
In addition to inhibiting lipolytic signal-ing, insulin also promotes lipid storage. To determine whether further enhancing lipid storage would affect mLDs, insulin was sup-plemented with free fatty acids (oleic acid) in the chase media. Whereas oleic acid alone had no observable effect on LD morphology (Figure 4A), the combination of insulin and
oleic acid resulted a rapid reduction in mLD number that was signifi-cantly greater than with insulin alone (Figure 4B). Together these data suggest that the formation of macroLDs requires insulin and elevated fatty acid levels, consistent with postprandial conditions in vivo.
events (Yamaguchi, 2010). By using high-resolution live-cell confocal microscopy to generate real-time z-stack images of 3T3-L1 adipo-cytes, we are able to observe mLD biogenesis in four dimensions (4D). Both the number and size of mLDs increased steadily following Isop stimulation. mLDs were first observed forming within 2 min,
FIGURE 3: mLD biogenesis does not require an intact cytoskeleton. (A) 3T3-L1 adipocytes stained with Bodipy 493/503 and treated with Isop immediately before time-lapse z-stack confocal imaging. Images were acquired every minute over a period of 30 min. Top right, higher magnification of the white boxed areas at the t = 0 and t = 30 min time points, as indicated. Note the appearance of peripheral mLDs. Bar, 10 μm. (B) Analysis of mLD formation in individual cells during the first 30 min of Isop treatment. (C) 3T3-L1 adipocytes were incubated in control medium (Cont), with Isop or Noc alone, or pretreated for 1 h with 33 μM Noc (Noc + Isop) or 25 μM Taxol (Taxol + Isop). Cells were immunolabeled for PLIN1a and β-tubulin and imaged by confocal microscopy. Bar, 20 μm. (D) 3T3-L1 adipocytes were incubated in control medium (Cont), with 3μM cytochalasin D for 1 h (CytoD), or pretreated with cytochalasin D before Isop (CytoD + Isop). Cells were immunolabeled for PLIN1a, costained with phalloidin, and imaged by confocal microscopy. Bar, 20 μm. (E) Confocal images of vimentin labeling in 3T3-L1 adipocytes treated with either Noc or IDPN. Bar, 10 μm. (F) 3T3-L1 adipocytes pretreated with 1% (vol/vol) IDPN for 1 h, followed by Isop, were immunolabeled for PLIN1a and costained with Bodipy 493/503. Bar, 20 μm. (G) Analysis of mLD number in 3T3-L1 adipocytes treated with Isop alone or after cytoskeletal disruption for 1 h. Graph depicts mean mLD/cell (>50 cells). Bars, mean ± SEM (p > 0.28, all treatments).

Volume 23 May 15, 2012 Insulin-dependent lipid droplet remodeling | 1831
PLIN1a (Figure 4C). However, inhibition of Akt using MK2206 blocked the dephospho-rylation of PLIN1a observed in response to insulin (Figure 4C). The inhibitory effect of insulin on prolipolytic signaling preceded any effect on mLD numbers (Figures 4, B and C). Consistent with a requirement for insulin signaling through Akt in the recovery of the basal adipocyte LD phenotype, inhi-bition of Akt prevented the insulin- plus fatty acid–induced loss of mLDs (Figure 4D).
To investigate the mechanisms involved in macroLD formation, we performed time-lapse z-stack confocal imaging on 3T3-L1 adipocytes treated with insulin and oleic acid and stained with Bodipy 493/503. Us-ing this method, we were able to track LDs and analyze changes to LD morphology in 4D. Over 16 h, the majority of mLDs were replaced with medium-sized LDs through a combination of mLD fusion and growth of individual mLDs (Figure 5 and Supplemental Video S3). Three distinct mechanisms of mLD resorption were observed: 1) rapid fu-sion between adjacent LDs (Figure 5C), 2) slow adsorption of LDs into adjacent LDs (Figure 5D), and 3) growth of individual mLDs without any detectable interaction with other LDs (Figure 5E). On insulin and fatty acid treatment, mLDs showed the fol-lowing rearrangements: alignment in rows (first events within 1 min of treatment), for-mation of clusters, and fusion of individual mLDs within clusters. Over time the irregu-larly shaped clusters became one or two larger spherical LDs, which continued as single entities for the remainder of the im-aging time, consistent with our previously defined strict criteria for LD fusion events (Murphy et al., 2010). Analysis of fusion events showed the majority occurring 1–5 h after the addition of insulin and fatty acids (Figure 5, A and B). In addition, we also ob-served the absorption of one LD into an-other over a period of several hours (Figure 5D). Finally, three-dimensional imaging of mLDs showed that some isolated mLDs un-derwent considerable increase in diame-ter—an average of 0.7 ± 0.1 μm over 16 h of treatment with insulin and oleic acid—with-out any observable interaction with other LDs (Figure 5E). Quantitative analysis of this phenomenon showed that mLDs expanded at an average rate of ∼0.12 μm/h over the first 7 h of treatment before reaching an ap-parently stable state.
Our results suggested that mLDs could undergo both growth and homotypic fu-
sion events to generate macroLDs (Figure 5). We next investigated whether these processes were also microtubule independent. In contrast to mLD formation, addition of Noc during insulin and oleic acid treatment resulted in a dramatic perturbation of the
To validate the role of insulin signaling in macroLD formation, we examined the effect of inhibiting Akt on mLD number in insulin- and fatty acid–treated 3T3-L1 adipocytes. Akt inhibition had no effect on the ability of Isop to stimulate PKA-mediated phosphorylation of
FIGURE 4: Insulin stimulates macroLD formation from mLDs. (A) 3T3-L1 adipocytes were activated with Isop before an 18-h chase in normal medium (Wash), 100 nM insulin (Ins), or 50 μg/ml oleic acid (fatty acids). Cells were immunolabeled for PLIN1a (red) and costained with Bodipy 493/503 (green). Bar, 10 μm. (B) Analysis of mLD number in 3T3-L1 adipocytes treated with Isop (Isop) or incubated in normal medium for 18 h (Wash), with 100 nM insulin for 4 h or 18 h, or with 100 nM insulin and 50 μg/ml oleic acid (Ins + FA) for 1 or 18 h. Graphs depict mLD/cell averaged from three micrographs (>50 cells) from one representative experiment. Bars, mean ± SEM. *p = 0.02, **p < 0.001. Isop vs. Wash, p = 0.13. (C) 3T3-L1 adipocytes (Cont) were treated with 10 μM Isop (Isop) for 30 min or 10 μM MK 2206 for 30 min before activation with Isop (MK + Isop). Alternatively, 3T3-L1 adipocytes were treated with 10 μM Isop for 30 min and then with either 100 nM insulin and 50 μg/ml oleic acid (Isop + InsFA) or MK 2206 and then insulin and oleic acid (Isop + MK + InsFA). Samples were immunoblotted for phospho-PKA substrates and PLIN1a. Analysis of the intensity of the phospho-PKA substrate band at ∼60 kDa, normalized to the intensity of the band of the same size on the immunoblot of PLIN1a, shows the changes in phospho-PLIN1a levels. (D) 3T3-L1 adipocytes were activated with Isop and subsequently treated with insulin and fatty acids in the absence or presence of MK 2206. Cells were immunolabeled for PLIN1a and costained with Bodipy 493/503. Bar, 20 μm.

1832 | N. Ariotti et al. Molecular Biology of the Cell
FIGURE 5: Time-lapse imaging of macroLD formation reveals LD fusion and growth. (A, B) Volume-rendered z-stack confocal images of live 3T3-L1 adipocytes stained with Bodipy 493/503, activated with Isop for 30 min, and then treated with 100 nM insulin + 50 μg/ml oleic acid immediately before imaging. (A) Z-stack images were collected every 10 min over a 16-h period. Bar, 20 μm. (B) Z-stack images were collected every 5 min over a 2-h period, Bar, 10 μm (B) and 5 μm (enlargement). Analysis showed clustering of mLDs (red arrowheads), and alignment of LDs (blue arrows), followed by fusion and mLD growth. (C) Detail of the fusion of adjacent LDs (arrows), shown as a volume-rendered image. (D) Detail of the absorption of one LD into the adjacent LD with no fusion, shown as a volume-rendered image. (E) Detail of the growth of an isolated mLD in the cell periphery, shown as a volume-rendered image. Note that although some mLDs appear adjacent this mLD, analysis in three dimensions revealed that the mLDs remained spatially distinct during imaging, with no observable interactions.
Volume 23 May 15, 2012 Insulin-dependent lipid droplet remodeling | 1833
–Noc, 1.0 ± 0.3 fusion events +Noc, in a 5-h period; Figure 6, B and C, and Supplemental Video S4). mLDs did not form rows or clusters, but instead each grew larger in diameter to fill the cell with many medium-sized LDs (Figure 6B). Of interest, the rate of mLD growth in Noc-treated cells (0.04 μm/h) was one-third of that observed in cells treated with insulin and oleic acid alone (0.12 μm/h).
recovery process, with the generation of uniformly medium-sized LDs, with few large LDs or mLDs (Figure 6A). The effect of Noc was not mimicked by disruption of the vimentin network (Figure 6A), showing that the effects were not mediated by indirectly disrupt-ing the vimentin cytoskeleton. Time-lapse, z-stack confocal mi-croscopy showed that LD fusion events were dramatically de-creased in Noc-treated cells (average 68.7 ± 22.4 fusion events
FIGURE 6: MacroLD formation is microtubule dependent. (A) 3T3-L1 adipocytes were activated with Isop before incubation for 18 h with 100 nM insulin and 50μg/ml oleic acid alone or in the presence of Noc (Noc + Ins) or IDPN (IDPN + Ins). Cells were immunolabeled for PLIN1a (red) and costained with Bodipy 493/503 (green). Bar, 10 μm. (B) Time-lapse z-stack confocal imaging of a Bodipy 493/503–stained 3T3-L1 adipocyte treated with Isop for 30 min and Noc for 1 h and with 100 nM insulin and 50 μg/ml oleic acid immediately before imaging. Z-stack images were collected at 10-min intervals over a 16-h period. Arrow shows mLD growth. Bar, 10 μm. C) Analysis of LD fusion events in cells treated with 100 nM insulin and 50 μg/ml oleic acid with (+Noc) or without (–Noc) the addition of Nocodazole. Graph shows average number of fusion events ± SEM from three cells under –Noc and five cells under +Noc conditions. (D) Schematic representation of LD morphology during lipolysis and lipid storage.

1834 | N. Ariotti et al. Molecular Biology of the Cell
A similar mechanism can be envisaged under physiological condi-tions, in which mLDs would form during periods of starvation to increase the efficiency of lipolysis, and, once food is consumed, insulin would be released to stop lipolysis and promote the storage of the newly available fatty acids (Campbell et al., 1992). The sec-ond type of mLD change observed in real time was a putative lipid transfer event in which one LD increases in size with a concurrent decrease in the size of a juxtaposed LD. This process shows remark-able similarities to events mediated by FSP27 (Gong et al., 2011). FSP27 localizes to the LD and mLD surface, with particular abun-dance at LD–LD contact sites, mediating directional flow of lipids from a smaller to a larger LD (Gong et al., 2011). A slow transfer of lipids from small, “donor” LDs to larger, “acceptor’ LDs was de-scribed in recent studies of oleic acid–treated 3T3-L1 cells using CARS microscopy, but this process took several hours (Paar et al., 2012), in contrast to the stimulated fusion described here. The third and most striking feature of the reversal process upon treatment with insulin and fatty acids was the fusion of mLDs. Within minutes of removing a lipolytic stimulus and treating with insulin and oleic acid, mLDs showed clustering and linear accumulations. This was followed by fusion of mLDs, defined using the strict criteria devel-oped in our previous studies (Murphy et al., 2010). Compared to lipid transfer events, LD fusion observed here occurred rapidly, with the two initial LDs replaced by one larger LD within one frame (15 min). We previously demonstrated that LD fusion in basal un-stimulated adipocytes was extremely rare unless the cells were treated with chemical fusogens. The rapid, chemically induced fu-sion was not dependent on an intact cytoskeleton (Murphy et al., 2010). In contrast, the insulin-stimulated fusion described here rep-resents a slower physiological process that is dependent on micro-tubules. Microtubules have been implicated in the organization of upstream insulin signaling complexes (Eyster et al., 2006), but we show here that the effect of Akt inhibitors on macroLD formation is distinct from the effect of nocodazole, arguing against an effect of nocodazole at the level of insulin signaling. We suggest that mLDs cluster before fusion by way of transport along microtubules. A similar but constitutive microtubule-dependent LD clustering and fusion sequence was shown in NIH-3T3 cells and was proposed to be mediated by an interaction between ADRP on the LD surface and the microtubule motor protein dynein (Bostrom et al., 2007). The new findings presented here, showing a physiological role for insulin-stimulated, microtubule-dependent LD fusion, now provide a framework for the detailed characterization of the intersection between insulin signaling pathways, the LD fusion machinery, in-cluding proteins such as FSP27, and microtubule-dependent traf-ficking pathways required for lipid homeostasis in adipocytes.
In conclusion, we showed dramatic changes in LD morphology after lipolytic stimulation in both cultured cells and adipose tissue, suggesting an important physiological role of this cycle of mLD for-mation and consumption in vivo. The LD cycle can regulate the amount of LD surface area available in the cell periphery to suit the amount of lipid hydrolysis required such that, during lipolysis, there is increased area available to allow access for lipases. This situation would be reversed during lipid storage. It is important to note that adipocytes of white adipose tissue are unique in containing a single lipid droplet under basal conditions, allowing the storage of the maximal amount of triglyceride with the smallest surface area. From a number of studies it is apparent that LD size is an important factor that determines lipolysis efficiency (Suzuki et al., 2011). For exam-ple, FSP27 promotes large LD formation, and its deletion is associ-ated with smaller LDs and increased lipolysis (Puri et al., 2007; Keller et al., 2008; Toh et al., 2008; Liu et al., 2009). This effect may arise
DISCUSSIONIn this study, we gained the first insights into the cycle of LD remod-eling that accompanies stimulated lipolysis, as well as the reversal to a basal state characteristic of unstimulated cells (see scheme in Figure 6D). In addition, we described the three-dimensional ultra-structural characteristics and cellular environment of mLDs. We showed, using real-time confocal microscopy, that mLD formation occurs within minutes of β-agonist stimulation, reaching a maximum after 30 min, and we provided quantitative estimates of the volume and surface area of the LD populations before and after stimulation. Using a combination of light microscopy and electron tomography, as well as live-cell imaging, we were able to show that mLDs are bona fide LDs (labeled by perilipin, possessing a neutral lipid core, and surrounded by a monolayer), which form rapidly throughout the cell in response to lipolytic stimulus and form close contacts with the ER. In addition, we were able to follow the subsequent re-versal of the lipolytic state to reform macroLDs and show that this process is stimulated by insulin and oleic acid and requires intact microtubules.
Our real-time observations strongly suggest that mLD formation does not involve the fragmentation of macroLDs, as originally pro-posed (Brasaemle et al., 2004; Marcinkiewicz et al., 2006), but are consistent with previous studies using CARS microscopy (Yamaguchi et al., 2007). We obtained no evidence for budding from larger LDs, and there was no detectable effect of cytoskeletal disruption on the appearance of mLDs in the cell periphery. We cannot rule out the existence of lipid-containing “fragments” derived from macro LDs that are below the detection limits of light microscopy, but no evi-dence for such structures was obtained in our ultrastructural analy-ses by electron microscopy. Our studies therefore suggest that mLDs form de novo in the cell periphery and rapidly become new sites of active lipolysis. These conclusions are in agreement with, and complementary to, a recent study suggesting de novo forma-tion of mLDs upon stimulation of lipolysis in 3T3-L1 adipocytes (Paar et al., 2012). MicroLDs were shown to form throughout the cyto-plasm upon stimulation of lipolysis, and formation was blocked by treatment with triacsin C, which inhibits activation of lipolysis-derived fatty acids and their incorporation into triglycerides (Paar et al., 2012). Our electron tomographic analysis of the ultrastructure and organelle associations of mLDs suggested a particularly close association of the ER in the cell periphery. This raises the possibility that the ER plays a direct role in lipid transfer to and from the mLDs, consistent with the hypothesis that the ER acts as a conduit for lipid transfer (Holthuis and Levine, 2005; Murphy et al., 2009) and in de novo formation of mLDs.
In addition to mLD biogenesis, we also examined the process by which 3T3-L1 adipocytes regained basal morphology (i.e., loss of peripheral mLDs) after the removal of the lipolytic stimulus. Live-cell imaging of insulin- and fatty acid–treated, lipolytically active adipocytes showed that mLDs were converted into larger LDs by three mechanisms: 1) an increase in size of isolated mLDs (expan-sion) without detectable fusion events, 2) the apparent transfer of lipid between adjacent mLDs, and 3) fusion of mLDs. Previous stud-ies showed that lipid can be incorporated into preexisting LDs via lipid synthesis at the LD surface (Kuerschner et al., 2008), and one possibility is that mLD expansion could occur in the same way. In addition to preventing lipolysis, insulin also augments lipid storage by promoting esterification of fatty acids (Campbell et al., 1992). Consistent with this, we found that the rate of macroLD formation was increased when cells were treated with a combination of insulin and oleic acid. We suggest that the availability of additional free fatty acids increased the rate at which mLDs were able to expand.

Volume 23 May 15, 2012 Insulin-dependent lipid droplet remodeling | 1835
real-time microscopy were plated onto glass-bottomed tissue cul-ture dishes (MatTek Corporation, Ashland, MA) or 25-mm, round glass coverslips and transferred into CO2-independent medium (Invitrogen) supplemented with 0.1% fatty acid–free bovine serum albumen (Calbiochem). When used, Bodipy 493/503 was diluted 1:4000 directly to the imaging medium 10 min before start of imag-ing. Reagents were diluted in 1 ml of medium and added to 3 ml of medium covering cells before imaging. For 4D imaging, time series were collected at 37°C using Axiovert 200M SP LSM 510 META or 710 META confocal laser scanning inverted microscopes equipped with a 63× oil immersion objective (numerical aperture, 1.4) and a heated stage. The z-stack confocal images were taken at 30-s inter-vals using AIM, version 3.2, or Zen 2009 software (Zeiss). QuickTime videos (Apple, Cupertino, CA) were assembled using ImageJ 1.37p (National Institutes of Health, Bethesda, MD) or Imaris, version 7 (Bitplane, Zurich, Switzerland), and still images were compiled using Adobe Photoshop CS5.
Mathematical and statistical analysisGiven that analysis of confocal z-stack images demonstrated that the lipid droplets were spherical, surface area (S.A. = 2πr2) and vol-ume (V = [4/3]πr3) were calculated from the radii of individual drop-lets, as measured in the xy-plane bisecting the largest apparent di-ameter of the LD. In fixed cells, measurement of the lipid droplet radii through one xy-plane was used to derive lipid droplet dimen-sions from micrographs. Between 500 and 1000 lipid droplets were analyzed in >100 cells from randomly chosen fields for each experi-ment and differences compared using an unpaired Student’s t test (two tailed, unequal variance). Graphs depict average ± SEM unless otherwise stated.
Western blottingSDS–PAGE and Western blot analysis was carried out as described previously (Murphy et al., 2010). Briefly cells were lysed in 10 mM Tris, 150 mM NaCl, 5 and mM EDTA, pH 7.4, containing phos-phatase and proteinase inhibitors (Roche, Indianapolis, IN), and solubilized in Laemmli sample buffer containing 25 mM dithiothre-itol. Immunolabeled proteins were visualized using horseradish peroxidase–conjugated secondary antibodies and developed using the Supersignal ECL reagent (Pierce/Quantum Scientific, Murarrie, Australia).
Electron microscopySapphire disks (Engineering Office M. Wohlwend, Sennwald, Swit-zerland) were coated with atomized carbon using a Baltec MED 020 coating system (Leica, Wetzlar, Germany) and baked at 120°C for 6–12 h. The 3T3-L1 fibroblasts were plated onto sterilized sapphire disks and differentiated into adipocytes. All reagents used for elec-tron microscopy sample preparation were obtained from ProSciTech (Kirwan, Australia) unless otherwise stated. Sample preparation for electron microscopy was performed as described previously (Nixon et al., 2009). Cells on sapphire disks were immersed in 0.7% low melting point agarose (Progen Biotechnik, Heidelberg, Germany) in DMEM at 37°C and placed into carriers for high-pressure freez-ing (HPF). HPF was performed using an EMPACT 2 HPF (Leica). Sapphire disks were rapidly fixed at 0°C and 2000-bar pressure. Subsequent cryosubstitution was performed with an EM AFS 2 (Leica). Samples for ultrastructural analysis were dehydrated in dry acetone and simultaneously postfixed and stained in a solution comprising1% osmium tetroxide, 0.5% uranyl acetate (SPI, West Chester, PA), and 5% H2O in acetone. Cryosubstitution was per-formed at −90°C over 52 h, raised to 20°C over 48 h, and samples
from disruption of the ongoing cycles of mLD formation and con-sumption as described here. From our estimates, after 30 min of li-polytic stimulation, the formation of mLDs had increased the total LD surface area by one-third, a process that would require the phos-pholipid monolayer enclosing the LDs to be synthesized (or re-cruited from other cellular membranes) at a significant rate. Recent studies defined the conserved mechanisms of phosphatidylcholine synthesis allowing the surface monolayer to be rapidly expanded in response to dramatic changes in LD size during increased lipid stor-age (Krahmer et al., 2011). Assuming the total surface area of the ER in adipocytes is similar to that calculated for fibroblasts (Griffiths et al., 1989), we find that the total area of mLD membrane gener-ated in 30 min (540 μm2) is approximately equal to 10% of the ER surface area (5870 μm2). With this amount of membrane used to generate many mLDs instead of one large LD, the total surface area–to-volume ratio is increased by >10-fold. As lipases act at the LD surface to hydrolyze the core neutral lipid, the large increase in surface area–to-volume ratio could serve to increase the efficiency of lipolysis, making mLDs the major site for lipid hydrolysis. This study provides fundamental new insights into lipid droplet remodel-ing, providing a framework for the detailed characterization of the intersection between insulin signaling pathways and the LD fusion machinery required for lipid homeostasis in adipocytes.
MATERIALS AND METHODSCell culture3T3-L1 fibroblasts (American Type Culture Collection, Rockville, MD) were maintained as described previously (Martin and Parton, 2005) and used between days 6 and 12 of postdifferentiation. Primary adipocytes were isolated from the epididymal fat pads of ∼12-wk-old C57BI/6 mice by collagenase digestion as described previously (Lawrence et al., 1990). To fix cells for immunofluores-cence microscopy, 16% paraformaldehyde was added directly to suspended cells to give a final concentration of 4% and samples incubated at room temperature for 30 min. We placed 200-μl drops of fixed cells onto Parafilm, and a 22-mm2 poly-l-lysine–coated cov-erslip floated on top of the drop for 15 min at room temperature to allow cells to adhere. All steps for immunolabeling were performed as described previously (Murphy et al., 2010).
Antibodies, plasmids, and reagentsRabbit anti–Phospho PKA Substrate (RRXS/T; catalogue no. 9624) was obtained from Cell Signaling Technology (Beverly, MA), and rabbit anti–perilipin A (P1998) and mouse anti–α-tubulin clone DM 1A (T9026) were obtained from Sigma-Aldrich (St. Louis, MO). Alexa 488– and Alexa 594–conjugated secondary antibodies were ob-tained from Molecular Probes (Eugene, OR). Bodipy 493/503 was obtained from Molecular Probes and prepared as a saturated solu-tion in ethanol (working dilution, 1:200). Phalloidin was obtained from Invitrogen (Carlsbad, CA). Oleic acid was obtained from Cal-biochem (La Jolla, CA) and conjugated to fatty acid–free bovine se-rum albumin before use. All other reagents were obtained from Sigma-Aldrich unless stated otherwise.
Indirect immunofluorescence microscopy and real-time video microscopyIndirect immunofluorescence microscopy was performed as de-scribed previously (Murphy et al., 2010). The data were processed using the LSM 510 Meta software (Carl Zeiss, Jena, Germany), and images were assembled using Photoshop CS5 (Adobe Systems, Mountain View, CA). Confocal micrographs are representative of hundreds of cells observed in more than three experiments. Cells for

1836 | N. Ariotti et al. Molecular Biology of the Cell
REFERENCESBostrom P et al. (2007). SNARE proteins mediate fusion between cytosolic
lipid droplets and are implicated in insulin sensitivity. Nat Cell Biol 9, 1286–1293.
Brasaemle DL, Dolios G, Shapiro L, Wang R (2004). Proteomic analysis of proteins associated with lipid droplets of basal and lipolytically stimu-lated 3T3-L1 adipocytes. J Biol Chem 279, 46835–46842.
Brasaemle DL, Rubin B, Harten IA, Gruia-Gray J, Kimmel AR, Londos C (2000). Perilipin A increases triacylglycerol storage by decreasing the rate of triacylglycerol hydrolysis. J Biol Chem 275, 38486–38493.
Brasaemle DL, Wolins NE (2012). Packaging of fat: an evolving model of lipid droplet assembly and expansion. J Biol Chem 287, 2273–2279.
Campbell PJ, Carlson MG, Hill JO, Nurjhan N (1992). Regulation of free fatty acid metabolism by insulin in humans: role of lipolysis and reesteri-fication. Am J Physiol 263, E1063–E1069.
Duncan RE, Ahmadian M, Jaworski K, Sarkadi-Nagy E, Sul HS (2007). Regu-lation of lipolysis in adipocytes. Annu Rev Nutr 27, 79–101.
Eyster CA, Duggins QS, Gorbsky GJ, Olson AL (2006). Microtubule network is required for insulin signaling through activation of Akt/protein kinase B: evidence that insulin stimulates vesicle docking/fusion but not intrac-ellular mobility. J Biol Chem 281, 39719–39727.
Farese RV Jr, Walther TC (2009). Lipid droplets finally get a little R-E-S-P-E-C-T. Cell 139, 855–860.
Funatsumaru S (1995). Cellular structure and function of rat fat cells in the primary culture. Cell Struct Funct 20, 23–32.
Garcia A, Subramanian V, Sekowski A, Bhattacharyya S, Love MW, Brasaemle DL (2004). The amino and carboxyl termini of perilipin a facili-tate the storage of triacylglycerols. J Biol Chem 279, 8409–8416.
Gong J, Sun Z, Wu L, Xu W, Schieber N, Xu D, Shui G, Yang H, Parton RG, Li P (2011). Fsp27 promotes lipid droplet growth by lipid exchange and transfer at lipid droplet contact sites. J Cell Biol 195, 953–963.
Granneman JG, Li P, Zhu Z, Lu Y (2005). Metabolic and cellular plasticity in white adipose tissue I: effects of beta3-adrenergic receptor activation. Am J Physiol Endocrinol Metab 289, E608–E616.
Granneman JG, Moore HP, Krishnamoorthy R, Rathod M (2009). Perilipin controls lipolysis by regulating the interactions of AB-hydrolase contain-ing 5 (Abhd5) and adipose triglyceride lipase (Atgl). J Biol Chem 284, 34538–34544.
Greenberg AS, Egan JJ, Wek SA, Garty NB, Blanchette-Mackie EJ, Londos C (1991). Perilipin, a major hormonally regulated adipocyte-specific phosphoprotein associated with the periphery of lipid storage droplets. J Biol Chem 266, 11341–11346.
were dehydrated stepwise into acetone using a BioWAVE micro-wave (Pelco, Ted Pelling, Redding, CA) at room temperature. Sam-ples were sequentially microwaved at 250 W for 40 s in 50% ace-tone, 70% acetone, and 90% acetone and two 100% acetone washes before embedding in epoxy resin. For embedding, samples were microwaved at 250 W for 3 min under vacuum in 50% resin (in acetone) and then twice in 100% resin. The resin was polymerized in a 60°C oven for 48 h. Alternatively, samples for immunolabeling were frozen as detailed and cryosubstituted into 0.2% uranyl ace-tate and 5% H2O in acetone over 120 h at −85°C. Samples were embedded in Lowicryl (HM20) resin using an EM AFS2 S6E cryo-substitution machine with FSP robot attachment (Leica). Samples were dehydrated in acetone at −50°C (five 20-min washes) before embedding in Lowicryl resin. Samples were incubated at −50°C in 50% resin (in acetone) for 2 h and in 75% resin (in acetone) for 2 h, followed by three 15-h exchanges in 100% resin. The Lowicryl resin was polymerized under UV light for 48 h at −50°C, after which the temperature was increased to 20°C over 2 h and the sample further incubated under UV light for a further 48 h at 20°C. For im-munolabeling, ultrathin sections (60–65 nm) of Lowicryl-embedded samples were washed for 2 min in 0.1 M PHEM (60 nM 1,4-pipera-zinediethanesulfonic acid, 25 mM 4-(2-hydroxyethyl)-1-pipera-zineethanesulfonic acid, 10 mM ethylene glycol tetraacetic acid, and 2 mM MgSO4, pH 7)/137 mM NaCl buffer, quenched in PHEM/NaCl with 10% glycine for 10 min, and blocked in PHEM/NaCl with 10% glycine, 10% fish skin gelatin, and 10% bovine serum albumin for 15 min. Sections were incubated for 30 min in primary antibody diluted 1:100 in blocking solution. Sections were washed twice in blocking solution, followed by two washes in PHEM/NaCl. Sections were then incubated for 30 min in 10 nm protein A–gold (obtained from the Cell Microscopy Center, University Medical Center, Utrecht, Netherlands), which was diluted 1:70 in blocking solution. After this, the sections were washed twice in blocking solution and then twice in PHEM/NaCl before incubation for 5 min in 1% glutar-aldehyde in PHEM/NaCl. Sections were then washed twice in ultra-pure water and dried on Whatman paper. For imaging of unlabeled, ultrathin epoxy resin sections (60–65 nm), samples were poststained first with a solution of 5% uranyl acetate and 50% ethanol in H2O for 2 min, followed by three 1-min washes in H2O, a 30-s incubation in Reynolds’ lead citrate solution, and three further 1-min washes in H2O. Both epoxy resin– and Lowicryl-embedded samples were im-aged in a JEOL 1011 electron microscope (JEOL, Peabody, MA) at 80 kV. Images were captured using a Morada digital camera (Olym-pus, Center Valley, PA), analyzed using ImageJ software, and com-piled using Photoshop CS5. For all ultrastructural and immuno–electron microscopy a minimum of three experiments were performed, with at least two sapphire disks processed, sectioned, and imaged per condition. In some experiments 3T3L1 adipocytes were fixed in glutaraldehyde and processed for Epon embedding as described previously (Parton et al., 2002). For high-resolution tomography, each side of the thick sections (300 nm) was labeled for 5 min with 10 nm of protein A–gold diluted 1:10 in H2O, fol-lowed by three 5-min water washes, to generate fiducial markers. A Tecnai F30 microscope (FEI, Hillsboro, OR) was used to image the dual-axis tilt series at 2° increments from −60° to +60° at an accel-erating voltage of 300 kV. Images were captured using an LC-1100 4K by 4K camera (Direct Electron, San Diego, CA) at a binning of 2 equipped with the microscope control program SerialEM. Tomo-gram alignments and weighted backprojection reconstructions were performed using IMOD software (Boulder Laboratories for 3D Electron Microscopy of the Cell, University of Colorado, Boulder, CO). Areas to be imaged were selected from four different isoprot-
erenol-treated 3T3-L1 adipocytes, two cells each from two experi-ments. mLDs were identified as electron-lucent circular structures with diameters ≤500 nm. Organelles were manually segmented at high fidelity and meshed in 3dmod as previously described (Richter et al., 2008). The slicer tool was used in 3dmod, and optical slices were averaged to improve contrast and aid in resolving fine struc-tures. Quantification of tomographic volumes was performed as follows. Subtomograms were extracted with dimensions 600 by 600 nm by the thickness of the section surrounding all mLDs, MVBs, and MC (chosen because these values were sufficient to encom-pass the full diameter of the organelle of interest, as well as any closely associated organelle in all directions). The program imod-info in IMOD was used to extract all volumetric data within the given subtomograms, and statistical significance was determined using Student’s t tests.
ACKNOWLEDGMENTSThis work was supported by grants from the National Health and Medical Research Council of Australia (511005, to R.G.P.) and from the National Natural Science Foundation of China (3103008, to P.L.). Imaging was conducted at the Australian Cancer Research Founda-tion Dynamic Imaging Facility and the Australian Microscopy and Microanalysis Research Facility Center for Microscopy and Micro-analysis. We thank D. E. James for giving advice and providing reagents.

Volume 23 May 15, 2012 Insulin-dependent lipid droplet remodeling | 1837
Moore HP, Silver RB, Mottillo EP, Bernlohr DA, Granneman JG (2005). Perilipin targets a novel pool of lipid droplets for lipolytic attack by hormone-sensitive lipase. J Biol Chem 280, 43109–43120.
Murphy S, Martin S, Parton RG (2009). Lipid droplet-organelle interactions; sharing the fats. Biochim Biophys Acta 1791, 441–447.
Murphy S, Martin S, Parton RG (2010). Quantitative analysis of lipid droplet fusion: inefficient steady state fusion but rapid stimulation by chemical fusogens. PLoS One 5, e15030.
Paar M et al. (2012). Remodeling of lipid droplets during lipolysis and growth in adipocytes. J Biol Chem 287, 11164–11173.
Nixon SJ, Webb RI, Floetenmeyer M, Schieber N, Lo HP, Parton RG (2009). A single method for cryofixation and correlative light, electron micros-copy and tomography of zebrafish embryos. Traffic 10, 131–136.
Parton RG, Molero JC, Floetenmeyer M, Green KM, James DE (2002). Characterization of a distinct plasma membrane macrodomain in dif-ferentiated adipocytes. J Biol Chem 277, 46769–46778.
Puri V, Konda S, Ranjit S, Aouadi M, Chawla A, Chouinard M, Chakladar A, Czech MP (2007). Fat-specific protein 27, a novel lipid droplet protein that enhances triglyceride storage. J Biol Chem 282, 34213–34218.
Richter T, Floetenmeyer M, Ferguson C, Galea J, Goh J, Lindsay MR, Morgan GP, Marsh BJ, Parton RG (2008). High-resolution 3D quantitative analysis of caveolar ultrastructure and caveola-cytoskeleton interactions. Traffic 9, 893–909.
Souza SC et al. (2002). Modulation of hormone-sensitive lipase and protein kinase A-mediated lipolysis by perilipin A in an adenoviral reconstituted system. J Biol Chem 277, 8267–8272.
Sugihara H, Yonemitsu N, Miyabara S, Toda S (1987). Proliferation of uni-locular fat cells in the primary culture. J Lipid Res 28, 1038–1045.
Suzuki M, Shinohara Y, Ohsaki Y, Fujimoto T (2011). Lipid droplets: size mat-ters. J Electron Microsc (Tokyo) 60 (Suppl 1), S101–S116.
Tansey JT, Huml AM, Vogt R, Davis KE, Jones JM, Fraser KA, Brasaemle DL, Kimmel AR, Londos C (2003). Functional studies on native and mutated forms of perilipins. A role in protein kinase A-mediated lipolysis of triacylglycerols. J Biol Chem 278, 8401–8406.
Thiele C, Spandl J (2008). Cell biology of lipid droplets. Curr Opin Cell Biol 20, 378–385.
Toh SY et al. (2008). Up-regulation of mitochondrial activity and acquire-ment of brown adipose tissue-like property in the white adipose tissue of fsp27 deficient mice. PLoS One 3, e2890.
Wang H et al. (2009). Activation of hormone-sensitive lipase requires two steps, protein phosphorylation and binding to the PAT-1 domain of lipid droplet coat proteins. J Biol Chem 284, 32116–32125.
Yamaguchi T (2010). Crucial role of CGI-58/alpha/beta hydrolase domain-containing protein 5 in lipid metabolism. Biol Pharm Bull 33, 342–345.
Yamaguchi T, Omatsu N, Morimoto E, Nakashima H, Ueno K, Tanaka T, Satouchi K, Hirose F, Osumi T (2007). CGI-58 facilitates lipolysis on lipid droplets but is not involved in the vesiculation of lipid droplets caused by hormonal stimulation. J Lipid Res 48, 1078–1089.
Griffiths G, Back R, Marsh M (1989). A quantitative analysis of the endocytic pathway in baby hamster kidney cells. J Cell Biol 109, 2703–2720.
Holthuis JC, Levine TP (2005). Lipid traffic: floppy drives and a superhigh-way. Nat Rev Mol Cell Biol 6, 209–220.
Himms-Hagen J, Melnyk A, Zingaretti MC, Ceresi E, Barbatelli G, Cinti S (2000). Multilocular fat cells in WAT of CL-316243-treated rats derive directly from white adipocytes. Am J Physiol Cell Physiol 279, C670–C681.
Keller P, Petrie JT, De Rose P, Gerin I, Wright WS, Chiang SH, Nielsen AR, Fischer CP, Pedersen BK, MacDougald OA (2008). Fat-specific protein 27 regulates storage of triacylglycerol. J Biol Chem 283, 14355–14365.
Kitamura T et al. (1999). Insulin-induced phosphorylation and activation of cyclic nucleotide phosphodiesterase 3B by the serine-threonine kinase Akt. Mol Cell Biol 19, 6286–6296.
Koh YJ, Park BH, Park JH, Han J, Lee IK, Park JW, Koh GY (2009). Activation of PPAR gamma induces profound multilocularization of adipocytes in adult mouse white adipose tissues. Exp Mol Med 41, 880–895.
Krahmer N et al. (2011). Phosphatidylcholine synthesis for lipid droplet expansion is mediated by localized activation of CTP:phosphocholine cytidylyltransferase. Cell Metab 14, 504–515.
Kuerschner L, Moessinger C, Thiele C (2008). Imaging of lipid biosynthesis: how a neutral lipid enters lipid droplets. Traffic 9, 338–352.
Lawrence JC Jr, Hiken JF, James DE (1990). Stimulation of glucose transport and glucose transporter phosphorylation by okadaic acid in rat adipo-cytes. J Biol Chem 265, 19768–19776.
Liu K et al. (2009). Functional analysis of FSP27 protein regions for lipid droplet localization, caspase-dependent apoptosis, and dimerization with CIDEA. Am J Physiol. Endocrinol Metab 297, E1395–E1413.
Londos C, Brasaemle DL, Schultz CJ, Adler-Wailes DC, Levin DM, Kimmel AR, Rondinone CM (1999a). On the control of lipolysis in adipocytes. Ann NY Acad Sci 892, 155–168.
Londos C, Brasaemle DL, Schultz CJ, Segrest JP, Kimmel AR (1999b). Perilipins, ADRP, and other proteins that associate with intracellular neutral lipid droplets in animal cells. Semin Cell Dev Biol 10, 51–58.
Marcinkiewicz A, Gauthier D, Garcia A, Brasaemle DL (2006). The phospho-rylation of serine 492 of perilipin A directs lipid droplet fragmentation and dispersion. J Biol Chem 281, 11901–11909.
Martin S, Okano S, Kistler C, Fernandez-Rojo MA, Hill MM, Parton RG (2009). Spatiotemporal regulation of early lipolytic signaling in adipo-cytes. J Biol Chem 284, 32097–32107.
Martin S, Parton RG (2005). Caveolin, cholesterol, and lipid bodies. Semin Cell Dev Biol 16, 163–174.
Martin S, Parton RG (2006). Lipid droplets: a unified view of a dynamic organelle. Nat Rev Mol Cell Biol 7, 373–378.
Miyoshi H et al. (2006). Perilipin promotes hormone-sensitive lipase-medi-ated adipocyte lipolysis via phosphorylation-dependent and -indepen-dent mechanisms. J Biol Chem 281, 15837–15844.