Embed Size (px)
Citation preview

JOURNAL OF CARDIOVASCULAR MAGNETIC RESONANCE1
Vol. 6, No. 1, pp. 209–253, 2004
Poster Abstracts: Clinical MRI—Non-ischemic Acquired Heart Disease
319. Cardiovascular MagneticResonance Evaluation ofTako – Tsubo Cardiomyopathy
Anastasios Athanasiadis, MD, Marcus Honold, MD,
Claudio Kupfahl, MD, Christine Goedecke, MD, Heiko
Mahrholdt, MD, Udo Sechtem, MD. Cardiology,
Robert Bosch Medical Center, Stuttgart, Germany.
Introduction: Tako–Tsubo cardiomyopathy has been
reported in Japan and is characterized by transient left
ventricular (LV) apical ballooning and reversible LV
asynergy in the absence of significant coronary artery
disease. This syndrome usually presents clinically as
acute myocardial infarction (MI). However, in contrast
to acute MI, Tako–Tsubo cardiomyopathy has a be-
nign outcome with full recovery of wall motion within
a few weeks and therefore does not require thrombo-
lytic treatment or angioplasty.
Methods and Results: Gd-enhanced contrast CMR is
well established for the detection of acute and chronic
ischemic myocardial injury and may thus permit a
differentiation between Tako–Tsubo cardiomyopathy
and acute MI in the acute setting. Contrast CMR imaging
using an IR FLASH technique (constantly adapting TI to
null normal myocardium) was performed in 11 patients
(mean age 66+7 yrs.) presenting with typical apical LV
ballooning, LV asynergy and normal coronary arteries, in
average three days after cardiac catheterization. In 10 of
the 11 patients no contrast enhancement was present.
One patient showed evidence of a small myocardial
damage in the inferior apical region which morpholog-
ically looked like coronary embolism of a side branch in
the circumflex region. Acute or chronic myocarditis as
possible cause for the transient wall motion abnormality
has been ruled out by endomyocardial biopsy in
all patients (Fig. 1).
Conclusions: Tako–Tsubo cardiomyopathy is not
an exclusively Japanese phenomenon. It is also present
in Europe and therefore must be differentiated from
acute myocardial infarction in the clinical routine.
Contrast CMR is a valuable tool for the non-invasive
differentiation of those disease entities in the acute phase
and may be useful for therapeutic decision making.
Figure 1.
320. CMR Estimation of Filling Pressures inLeft Ventricular Hypertrophy: A Comparisonwith Tissue Doppler and Invasive Measurements
Bernard P. Paelinck,1 Hildo J. Lamb,2 Jeroen J. Bax,3
Rob J. van der Geest,2 Paul M. Parizel,4 Christiaan J.
Vrints,1 Albert de Roos.2 1Cardiology, University
Hospital Antwerp, Edegem, Belgium, 2Radiology,
LUMC, Leiden, Netherlands, 3Cardiology, LUMC,
Leiden, Netherlands, 4Radiology, University Hospital
Antwerp, Edegem, Belgium.
209
DOI: 10.1081/JCMR-120028314 1097-6647 (Print); 1532-429X (Online)
Copyright D 2004 by Marcel Dekker, Inc. www.dekker.com

ORDER REPRINTS
Introduction: The diastolic long axis displacement ve-
locities of the mitral annulus provide a better estimate
of filling pressures as compared to analysis of the mitral
inflow velocity curve alone. Phase-contrast cardiovas-
cular magnetic resonance (CMR) allows velocity
encoding of both moving structures and blood.
Purpose: We sought to assess if CMR could
estimate filling pressures by combining early diastolic
mitral annular velocity (Ea) and early (E) mitral velocity.
Methods: 18 patients with hypertensive heart
disease (mass index: 114±21 g/m2) and normal or
mildly reduced systolic function (left ventricular ejec-
tion fraction: 57.6±6.5%) referred for cardiac catheteri-
zation underwent consecutive measurement of mitral
inflow and mitral annular velocities with Doppler and
phase-contrast CMR. These data were compared with
mean pulmonary wedge pressure.
Results: The ratio of early mitral flow velocity to
early diastolic velocity of the mitral annulus (E/Ea)
showed a good correlation between Doppler and CMR
phase-contrast (r=0.89). E/Ea<8 predicted normal
and E/Ea>15 increased mean pulmonary wedge
pressure. Between 8 and 15 both techniques displayed
a similar variability in predicting mean pulmonary
wedge pressure.
Conclusions: Phase-contrast CMR of mitral inflow
and diastolic mitral annular motion allows a good
estimate of left ventricular filling pressure.
321. Late Enhancement Without Infarction—Appearance and Etiology of Myocardial LateEnhancement in Contrast-Enhanced MRI ofNon-ischemic Heart Disease
Peter Hunold, MD,1 Thomas W. Schlosser, MD,1 Kai-
Uwe Waltering, MD,1 Sandra Massing, RT,1 Markus
Jochims, MD,2 Walter O. Schuler, MD,2 Jorg F.
Debatin, MD,1 Jorg Barkhausen, MD.1 1Department
for Diagnostic and Interventional Radiology, Universi-
ty Hospital, Essen, Germany, 2Department of Cardiol-
ogy, Elisabeth Hospital, Essen, Germany.
Introduction: ‘‘Late enhancement’’ (LE) in contrast-
enhanced cardiac MRI is currently being established
for the assessment of myocardial viability in ischemic
heart disease. The region area of enhancement after
administration of Gd-based contrast material reflects
irreversible damage after chronic myocardial infarction.
Whereas LE is very highly sensitive in detecting
myocardial scarring, it is not specific for ischemic
damage since Gd-DTPA generally accumulates in
tissues with increased water content. Thus, LE occurs
in myocardial areas of fibrosis, inflammation, and
edema where the extracellular volume is enlarged.
Different myocardial disorders are accompanied by
fibrosis or inflammation and might be diagnosed and
distinguished from ischemic disease based on the
pattern and localization of LE.
Purpose: To summarize and characterize different
myocardial disorders presenting with ‘‘late enhance-
ment’’ (LE) in contrast-enhanced MRI, which are not
related to acute or chronic myocardial infarction.
Methods: Within 18 months, 811 contrast-en-
hanced cardiac MRI studies were performed for various
indications in the University and an affiliated hospital.
All MRI exams were performed on a 1.5 T scanner
(Magnetom Sonata, Siemens Medical Systems, Erlan-
gen, Germany). After completion of a cine study, LE
scans were acquired 8–15 min after administration of
0.2 mmol/kg BW of Gd-DTPA (MagnevistTM, Scher-
ing, Berlin, Germany) using an inversion-recovery
turboFLASH sequence (TR, 8 ms; TE, 4 ms; flip
angle, 25�; TI, 200–260 ms). The entire left ventricular
myocardium was covered by long axis and contiguous
short axis scans (slice thickness, 8 mm). All data sets
were reviewed for myocardial LE. In patients with
excluded myocardial infarction, the different causes of
LE were assessed, and the different patterns of LE
were related to the underlying pathology.
Results: A total of 422 (52%) patients revealed
myocardial LE. In 403 (96%) patients with proven
CAD and/or a history of myocardial infarction, the
transmural extent of LE was variable but always in-
cluded the subendocardial layer. In 19 patients with
angiographically excluded CAD and without a history
of myocardial infarction, LE was found due to
different diseases: myocarditis (n=4), sarcoidosis (2),
left ventricular involvement of arrhythmogenic right
ventricular cardiomyopathy (2), hypertrophic cardio-
myopathy (4), dilative cardiomyopathy (1), endomyo-
cardial fibrosis (2), small septal fibrosis of unknown
origin (1), and iatrogenic scars after emdomyocardial
biopsy (1), transcoronary ablation of septal hypertro-
phy (1), and percutaneous myocardial LASER revas-
cularization (1).
Conclusions: All patients with a history of
myocardial infarction revealed LE always including
the subendocardial layer of the myocardium. However,
many non-ischemic cardiac diseases are accompanied
by fibrosis or edema and, therefore, provide LE also.
If the subendocardial layer is spared out, LE shows a
patchy appearance, or there is no evidence of myocar-
dial infarction, different myocardial diseases must be
considered as a differential diagnosis when myocardial
LE appears. On the other hand, performing LE imaging
210 Poster Abstracts: Clinical MRI—Non-ischemic Acquired Heart Disease

ORDER REPRINTS
might facilitate the differential diagnosis in non-
ischemic heart disease.
322. Asynchronous Regional MyocardialContraction in LBBB in Relation toEjection and Iso-Volumic-Relaxation-TimesAssessed by High Temporal Resolution MRTissue Tagging
Marco J. W. Gotte, MD, PhD,1 Jaco J. M. Zwanenburg,
Msc,2 Willem G. van Dockum, MD,1 Paul Knaapen,
MD,1 J. Tim Marcus, PhD,2 Albert C. van Rossum,
MD, PhD.1 1Cardiology, Vrije Universiteit Medical
Center, Amsterdam, Netherlands, 2Department of
Physics & Medical Technology, Vrije Universiteit
Medical Center, Amsterdam, Netherlands.
Introduction: Recent studies have shown that the pres-
ence of a left bundle branch block (LBBB) prolongs
overall myocardial tension and reduces filing times
(Grines et al., 1989; Xiao et al., 1991). In order to
study how regional asynchrony is related with ejection
and iso-volumic-relaxation-times, high temporal reso-
lution myocardial tagging was applied to evaluate
cardiac contraction in patients with a LBBB.
Purpose: To map regional mechanical activity of
the left ventricle in patients with a LBBB and related
this to the time of aortic valve closure (Tavc) and iso-
volumic-relaxation time (IVRT).
Methods: Patients: Ten patients (8 males, age 56±13
years) with a LBBB (QRS 146±39ms) and depressed LV
function (EF<45%, NYHA class III) were studied.
Imaging: Five consecutive short-axis tagged image
planes with high temporal resolution (14 ms) were ac-
quired using steady state free precession (SSFP) imaging
(Zwanenburg et al., 2003) and a multiple breath-hold
scheme. A three-chamber cine image with the same high
temporal resolution was used to determine the Tavc and
mitral valve opening (Tmvo) relative to the ECG-R
wave. Tavc marked the end of the ejection period. The
IVRT was calculated as (Tmvo-Tavc). Post-processing:
Circumferential strain (ec) curves were calculated using
HARP (Osman at al., 1998) and averaged for 6 segments
per slice: infero-septal (IS), antero-septal (AS), anterior
(AN), antero-lateral (AL), postero-lateral (PL) and
inferior (IN). The time to onset of shortening (Tos)
relative to the ECG-R wave was defined as the beginning
of the down slope of the ec curve and assessed by an
automatic fitting algorithm. From the strain curves, the
maximum circumferential shortening (CSpeak) and the
time to peak shortening (TpeakCS) were obtained.
Results: The averaged onset time of shortening for
each segment is shown in Figure 1. Onset of shortening
in the lateral wall (AL+PL) started significantly later
compared to the septum (IS+AS), 99±21 ms vs. 65±34
ms, respectively, p<0.02). There was no difference in
Tos between the AN and IN regions. Shortening started
earlier at the apex compared to base (79±21 ms vs.
100±17 ms, p<0.05). The CSpeak was significantly
reduced in the septum compared to the lateral wall
(5±2% vs. 13±4%, p<0.001). CSpeak was not different
between AN and IN, and between apex and base.
Peak shortening was reached significantly later in
the lateral wall compared to the septum (415±73 ms
vs. 219±105 ms, p<0.001). No differences in TpeakCS
were found between AN and IN, and between apex and
base. The TpeakCS in the lateral wall was significantly
later than the Tavc (370±57 ms, p<0.02), indicating
post-systolic shortening. Duration of contraction was
found to be the longest in the lateral wall (316±63
ms). It was found that the duration of the IVRT wasFigure 1. (View this art in color at www.dekker.com.)
Figure 2. (View this art in color at www.dekker.com.)
Poster Abstracts: Clinical MRI—Non-ischemic Acquired Heart Disease 211

ORDER REPRINTS
highly correlated to the duration of contraction in this
region (AL+PL) (r=0.88, p=0.001, Figure 2).
Conclusion: In patients with a LBBB, onset of
circumferential shortening starts in the septal and apical
regions and propagates to the lateral and basal regions.
Delayed onset of shortening in the lateral wall is ac-
companied by a longer duration of shortening resulting
in post-systolic shortening and prolonged duration of
IVRT. Therefore, a LBBB prolongs ventricular contrac-
tion at the lateral wall disproportionate to the ejection
time, and simultaneously reduces the filling period.
Acknowledgment: Supported by the Netherlands
Heart Foundation, grant 2000B220.
REFERENCES
Grines, C. L., Bashore, T. M., Boudoulas, H., et al.
(1989). Circulation 79:845–853.
Osman, N. F., Prince, J. L. (1998). Proc. SPIE Med.
Imag. Conf. San Diego, 142–152.
Xiao, H. B., Lee, C. H., Gibson, D. G. (1991). Br. Heart
J. 66:443–447.
Zwanenburg, J. J. M., Kuijer, J. P. A., et al. (2003).
Magn. Reson. Med. 49:722–730.
323. The Normal Physiological Variation ofLeft Ventricular Mass, Dimensions, and Functionfrom Childhood to Late Adulthood by MRI:A Prospective Study of 102 Healthy VolunteersAge 12 – 81 Years
Peter Cain, MD, PHD, Ragnhild Ahl, MD, Erik
Hedstrom, Hakan Arheden, MD, PHD. Department of
Physiology, University of Lund, Lund, Sweden.
Figure 1.
212 Poster Abstracts: Clinical MRI—Non-ischemic Acquired Heart Disease

ORDER REPRINTS
Introduction: How left ventricular mass (LVM), dimen-
sions (LVD), and ejection fraction (EF) evolve in ado-
lescence and vary with adult age is unclear. Previously
defined MRI normal ranges of LVM and LVD have
been described in studies of limited size, age-range, or
in pts with risk factors.
Purpose: We sought to prospectively examine the
normal physiological trend of LVM, LVD, and EF in
truly normal pts from early adolescence to late adult-
hood and define normal ranges of these parameters
according to age and gender.
Methods: 102 pts (55 males, 12–81 yrs) prospec-
tively enrolled with normal ECG and without hyperten-
sion (<140/80) underwent cardiac MRI. Short axis turbo
gradient images (TR 100 ms, TE 4.8 ms, ST 10 mm)
were analyzed by experienced readers (Simpsons rule,
manual delineation). LVM, end-diastolic volume
(EDV), end-systolic volume (ESV), and EF were
analyzed according to gender, adolescence (20 pts) vs.
adulthood, and by 7 age groupings (ANOVA).
Results: LVM, EDV, and ESV rose rapidly during
teenage years and slowly declined over the adult age-
range (p<0.001 all) (Figure 1). Gender differences
were present for LVM in every age group (males
higher LVM (p<0.001) and in most age groups for
EDV and ESV) (Table 1). EF declined during ado-
lescence in both genders with little change thereafter.
Adolescencents displayed lower LVM (116±26 vs.
165±32 g, p<0.001), EDV (116±24 vs. 141±31 ml,
p<0.001), ESV (33±13 vs. 56±18 ml, p<0.001), but
higher EF (72±5 vs. 60±7%, p<0.001) compared to
adults (Figure 1).
Conclusions: Normal LVM and LVD measured by
MRI show a rapid physiological rise during adoles-
cence and slow fall during adulthood. EF declines in
from adolsecence to adulthood in both men and
women. Clear gender differences exist for LVM,
EDV and less so for ESV. These findings may allow
normal ranges of LVM and LVD to be developed from
early adolescence to late adulthood.
324. LV Mass Index and the Common,Functional, X-linked Angiotensin II Type2-receptor Gene Polymorphism (1332 G/A)in Patients with Systemic Hypertension
Khaled Alfakih,1 Azhar Maqbool, PhD,2 Gavin Bain-
bridge,1 John Ridgway,1 Anthony Balmforth,2 Alistair
Hall,3 Mohan Sivananthan.1 1Cardiac MRI, Leeds
General Infirmary, Leeds, United Kingdom, 2Institute
of Cardiovascular Research, University of Leeds,
Leeds, United Kingdom, 3Academic Unit of Cardiovas-
cular Medicine, Leeds General Infirmary, Leeds,
United Kingdom.
Introduction: A common intronic polymorphism,
(�1332 G/A) of the angiotensin type 2 (T2) receptor
gene, located on the X-chromosome, has been reported
to be biochemically functional.
Purpose: To evaluate the AT2 receptor gene poly-
morphism (�1332 G/A) for an association with left
ventricular hypertrophy (LVH).
Methods: LV mass was measured in 197 patients
with systemic hypertension and 60 normal volunteers,
using a 1.5-Tesla Philips MRI system. Genotyping was
performed using a restriction enzyme digestion of an
initial 310 bp PCR product that included the AT2
(�1332 G/A) locus.
Results: The mean LV mass index for the male
patients was 94.3±19.6 g/m2 (n=125) and for the
female patients was 71.2±12.0g/m2 (n=72). Seventy
three (37.1%) of all patients had an elevated LV mass
index, defined as the mean LV mass index for normal
volunteers plus 2 S.D (males 77.8±9.1 g/m2, n=30;
females 61.5±7.5g/m2, n=30). Comparison of LV
mass index, of the A/AA genotype (mean LV mass
index=82.4±21.1 g/m2; n=123) against that of the G/
GG genotype (mean LV mass index=88.1±19.0 g/m2;
n=89), as a continuous variable was significant by
analysis of variance (p=0.044). Chi-square comparison
between normotensive volunteers without LVH (NT
Table 1. Normal values of LVM, EDV, ESV, and EF according to age and gender.
Age 10–19 20–29 30–39 40–49 50–59 60–69 >70 p
LVM (g) MALE 128±10 196±5 191±4 193±8 168±7 185±10 165±12 0.001
LVM (g) FEMALE 109±6 159±12 143±9 145±7 133±7 123±9 121±9 0.001
ESV (ml) MALE 36±3 68±3 69±4 68±6 53±8 55±7 61±9 0.001
ESV (ml) FEMALE 32±3 43±2 46±4 51±4 38±5 39±7 47±6 0.001
EDV (ml) MALE 124±10 163±5 178±9 170±9 138±14 132±11 140±9 0.001
EDV (ml) FEMALE 120±7 136±14 131±8 135±4 109±4 104±7 113±10 0.001
EF (%) MALE 72±12 63±9 63±10 60±9 65±12 64±11 65±10 0.001
EF (%) FEMALE 70±10 62±9 63±8 61±10 62±9 60±9 60±11 0.001
Poster Abstracts: Clinical MRI—Non-ischemic Acquired Heart Disease 213
ORDER REPRINTS
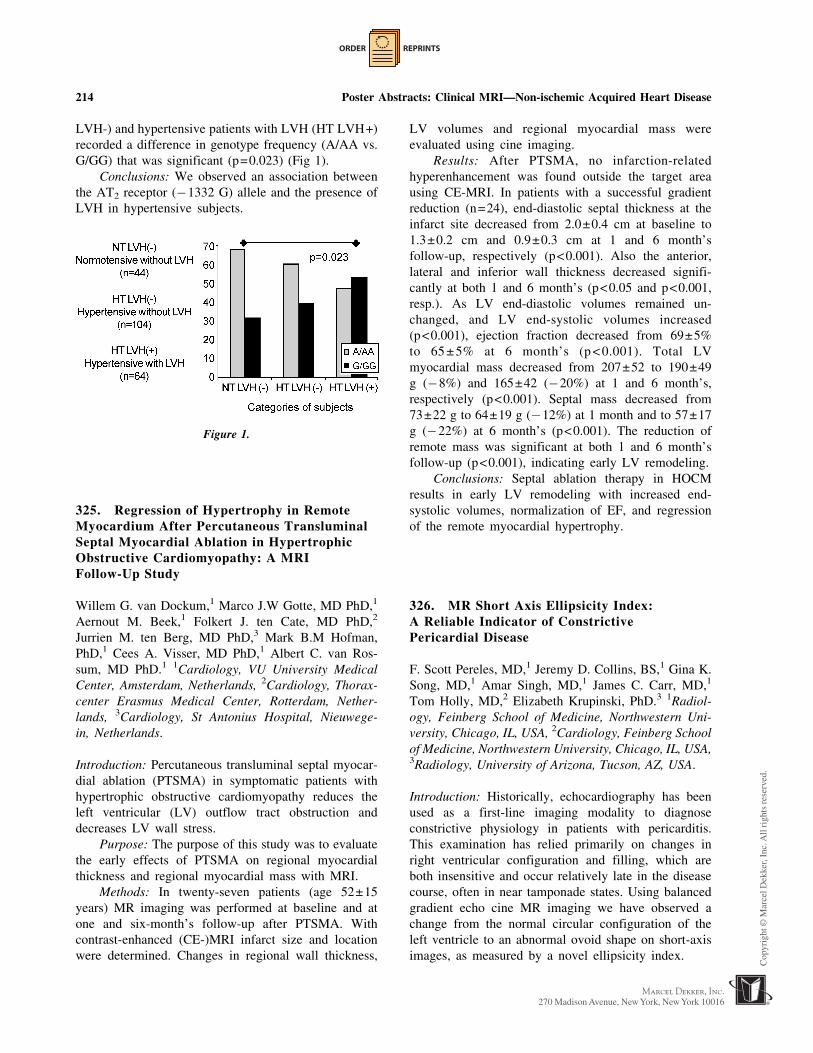
LVH-) and hypertensive patients with LVH (HT LVH+)
recorded a difference in genotype frequency (A/AA vs.
G/GG) that was significant (p=0.023) (Fig 1).
Conclusions: We observed an association between
the AT2 receptor (�1332 G) allele and the presence of
LVH in hypertensive subjects.
Figure 1.
325. Regression of Hypertrophy in RemoteMyocardium After Percutaneous TransluminalSeptal Myocardial Ablation in HypertrophicObstructive Cardiomyopathy: A MRIFollow-Up Study
Willem G. van Dockum,1 Marco J.W Gotte, MD PhD,1
Aernout M. Beek,1 Folkert J. ten Cate, MD PhD,2
Jurrien M. ten Berg, MD PhD,3 Mark B.M Hofman,
PhD,1 Cees A. Visser, MD PhD,1 Albert C. van Ros-
sum, MD PhD.1 1Cardiology, VU University Medical
Center, Amsterdam, Netherlands, 2Cardiology, Thorax-
center Erasmus Medical Center, Rotterdam, Nether-
lands, 3Cardiology, St Antonius Hospital, Nieuwege-
in, Netherlands.
Introduction: Percutaneous transluminal septal myocar-
dial ablation (PTSMA) in symptomatic patients with
hypertrophic obstructive cardiomyopathy reduces the
left ventricular (LV) outflow tract obstruction and
decreases LV wall stress.
Purpose: The purpose of this study was to evaluate
the early effects of PTSMA on regional myocardial
thickness and regional myocardial mass with MRI.
Methods: In twenty-seven patients (age 52±15
years) MR imaging was performed at baseline and at
one and six-month’s follow-up after PTSMA. With
contrast-enhanced (CE-)MRI infarct size and location
were determined. Changes in regional wall thickness,
LV volumes and regional myocardial mass were
evaluated using cine imaging.
Results: After PTSMA, no infarction-related
hyperenhancement was found outside the target area
using CE-MRI. In patients with a successful gradient
reduction (n=24), end-diastolic septal thickness at the
infarct site decreased from 2.0±0.4 cm at baseline to
1.3±0.2 cm and 0.9±0.3 cm at 1 and 6 month’s
follow-up, respectively (p<0.001). Also the anterior,
lateral and inferior wall thickness decreased signifi-
cantly at both 1 and 6 month’s (p<0.05 and p<0.001,
resp.). As LV end-diastolic volumes remained un-
changed, and LV end-systolic volumes increased
(p<0.001), ejection fraction decreased from 69±5%
to 65 ± 5% at 6 month’s (p < 0.001). Total LV
myocardial mass decreased from 207±52 to 190±49
g (�8%) and 165±42 (�20%) at 1 and 6 month’s,
respectively (p<0.001). Septal mass decreased from
73±22 g to 64±19 g (�12%) at 1 month and to 57±17
g (�22%) at 6 month’s (p<0.001). The reduction of
remote mass was significant at both 1 and 6 month’s
follow-up (p<0.001), indicating early LV remodeling.
Conclusions: Septal ablation therapy in HOCM
results in early LV remodeling with increased end-
systolic volumes, normalization of EF, and regression
of the remote myocardial hypertrophy.
326. MR Short Axis Ellipsicity Index:A Reliable Indicator of ConstrictivePericardial Disease
F. Scott Pereles, MD,1 Jeremy D. Collins, BS,1 Gina K.
Song, MD,1 Amar Singh, MD,1 James C. Carr, MD,1
Tom Holly, MD,2 Elizabeth Krupinski, PhD.3 1Radiol-
ogy, Feinberg School of Medicine, Northwestern Uni-
versity, Chicago, IL, USA, 2Cardiology, Feinberg School
of Medicine, Northwestern University, Chicago, IL, USA,3Radiology, University of Arizona, Tucson, AZ, USA.
Introduction: Historically, echocardiography has been
used as a first-line imaging modality to diagnose
constrictive physiology in patients with pericarditis.
This examination has relied primarily on changes in
right ventricular configuration and filling, which are
both insensitive and occur relatively late in the disease
course, often in near tamponade states. Using balanced
gradient echo cine MR imaging we have observed a
change from the normal circular configuration of the
left ventricle to an abnormal ovoid shape on short-axis
images, as measured by a novel ellipsicity index.
214 Poster Abstracts: Clinical MRI—Non-ischemic Acquired Heart Disease

ORDER REPRINTS
Purpose: The purpose of this study is to evaluate
the reliability of a newly discovered cardiac magnetic
resonance sign of constrictive pericardial disease called
the ellipsicity index.
Methods: One hundred eighty-three consecutive
cardiac MR examinations performed on a 1.5 T
Siemens Sonata MR scanner were analyzed for the
presence of an ovoid configuration of the left ventricle
on cardiac short axis images. On these short axis im-
ages, the ellipsicity index was defined as the vertical
height of the left ventricle divided by the horizontal
mid chamber width at end diastole on a slice positioned
equidistant between the mitral valve and the apex. All
measurements were independently performed by two
blinded physicians using electronic calipers on balanced
gradient echo cine images displayed on General
Electric PACS workstations. Of the 183 examinations,
26 cases were referred as clinically suspected cases of
constrictive physiology on the basis of other imaging
modalities and interventions: cardiac catheterization
(5), echocardiography (12), serial follow-up examina-
tion (7), pericardiocentesis (1), pericardiotomy (4),
pericardial biopsy (1) or pericardiectomy (1).
Results: ANOVA analysis indicated that the mean
ellipsicity index for patients with proven constrictive
physiology (1.36) was significantly higher than that
those with either other cardiac pathology (1.23,
p=0.001, degrees of freedom=1, 122, F=10.89) or
normal cardiac examinations (1.25, p=0.005, degrees
of freedom=1, 83, F=8.50).
Conclusion: The end-diastolic ovoid configuration
of the left ventricle as measured by the ellipsicity index
is a valuable addition to other MR findings as an
indicator of constrictive physiology. Using our ap-
proach, an ellipsicity index of 1.30 appears to be a
useful threshold to suggest the presence of constrictive
physiology in the appropriate clinical setting.
327. The Incidence of Myocardial Scarringas Defined by Late Hyperenhancement inPatients with Acute Myocarditis
Jeanette Schulz-Menger, Hassan Abdel-Aty, Andreas
Kumar, Rainer Dietz, Matthias G. Friedrich. Cardiol-
ogy, Franz-Volhard-Klinik, Charite, Berlin, Germany.
Introduction: Contrast-enhanced CMR is able to de-
tect inflammation as well as scarred tissue. In patients
with acute myocarditis, we assessed the incidence of
signal intensity changes 10 minutes after the contrast
bolus (‘‘delayed hyperenhancement’’) as a marker
for necrosis or fibrosis and compared it to that of
signal intensity changes during early steady state
(‘‘relative enhancement’’).
Purpose: To investigate the incidence of inflam-
mation and necrosis in patients with acute myocarditis.
Methods: We investigated 18 (14 men, 4
female; age: 38±18 years) patients with clinically
proven acute myocarditis as defined by a combina-
tion of the following:
. a history of viral infection within the last 2
weeks. no evidence for coronary artery disease. ECG abnormalities and/or significant increase
of serologic markers for myocardial injury
Patients were studied 5±1 days after the onset of
symptoms in a 1.5 T cardiac scanner. To assess
inflammation, we quantified signal intensity changes in
axial multi-slice T1-weighted spin echo images before
and after 0.1 mmol/kg Gd-DTPA (‘‘relative enhance-
ment’’, RE). Myocardial scars were visualized by a
multi-slice inversion recovery gradient echo sequence
of the whole left ventricle (TI 200–250 ms; TR 5.5ms;
TE 1.4ms, 10 mm slices, no spacing, individual TI to
null myocardium), starting 10 minutes after additional
0.1 mmol/kg Gd-DTPA (‘‘delayed hyperenhance-
ment’’, DE). In 14 patients, we assessed the Gd-DTPA
washout over 15 min after the bolus. Global function
and regional wall motion abnormalities (RWMA) were
analyzed based on SSFP-derived images. Two blinded
observers performed the analysis.
Results: In all patients the relative enhancement
was increased (mean 7.9±1.0; normal values <4;
p<0.05). Ejection fraction was slightly decreased
(mean 52.4±3.3%), with 65% of all patients having
normal values (62.9±1.1%). RWMA were observed in
11 patients (55%). A focal DE was visible in the
subepicardial and middle myocardial layers of
8 patients (44%), all of them with RWMA. The group
with RWMA showed a trend towards a lower EF,
which was not significant (49.3% vs. 61.7%, p=ns).
RE was significant higher in the RWMA group
(10.6±4.3 vs. 6.0±2.0, p<0.05). In patients without
late DE, inversion recovery sequences revealed signif-
icant regional hyperenhancement in 50% of the patients
at minute 3 (signal intensity compared to remote 29±9
vs. 23±6, p<0.05), but there was no focal enhance-
ment in later than minute 11 (signal 14±7 compared to
remote 9±3, p<0.05).
Discussion: Contrast-enhanced CMR detects in-
flammation in patients even with a normal LVEF, but
Poster Abstracts: Clinical MRI—Non-ischemic Acquired Heart Disease 215
ORDER REPRINTS
only 44% of patients show regional hyperenhancement,
which turns out to be focally present in subepicardial
and middle, but not in subendocardial layers. Enhance-
ment during the early steady state (RE) is useful to
detect inflammation, but signal enhancement does not
persist over a longer period. This is consistent with
inflammation but not necrosis/fibrosis. These findings
match autoptic studies, showing a low incidence of
myocardial necrosis in acute myocarditis with a local
distribution different to myocardial infarction. Thus,
CMR may be a specific tool to differentiate acute
inflammation from necrosis and both from ischemic
injury. Further studies are warranted.
Conclusions: The incidence of necrosis is rather
low resulting in a limited sensitivity of delayed
enhancement imaging to diagnose acute myocarditis.
The relative enhancement as assessed over a period of
several minutes early after the bolus shows a higher
sensitivity. The pattern of necrosis, if present, differs
from that of ischemic necrosis and is likely to enable a
specific differentiation from acute myocardial infarc-
tion in such a setting.
328. Assessment of Left Atrial Volume byContrast Enhanced Magnetic ResonanceAngiography-Comparison with Cine MR
Thomas H. Hauser, Seth McClennen, MD, Mark E.
Josephson, MD, Warren J. Manning, MD, Susan B.
Yeon, MD, JD. Medicine, Cardiology Division, Beth
Israel Deaconess Medical Center, Boston, MA, USA.
Introduction: An increase in left atrial (LA) volume is
associated with cardiovascular morbidity, particularly
atrial fibrillation. Contrast-enhanced magnetic reso-
nance angiography (MRA) visualizes the LA but the
validity of LA volume measurements using this
technique has not been evaluated.
Purpose: We compared LA volume measurements
from MRA with cine magnetic resonance (MR) LA
volume measurements.
Methods: We performed MRA and cine MR in 17
consecutive patients referred for MRA prior to atrial
fibrillation ablation. LA volumes were calculated by
disk summation in the axial (MRA) or 4-chamber (cine
MR) imaging plane. MRA LA volumes were compared
to cine MR LA volumes at the maximal LA size and at
LA end-diastole using linear regression and limits of
agreement analysis.
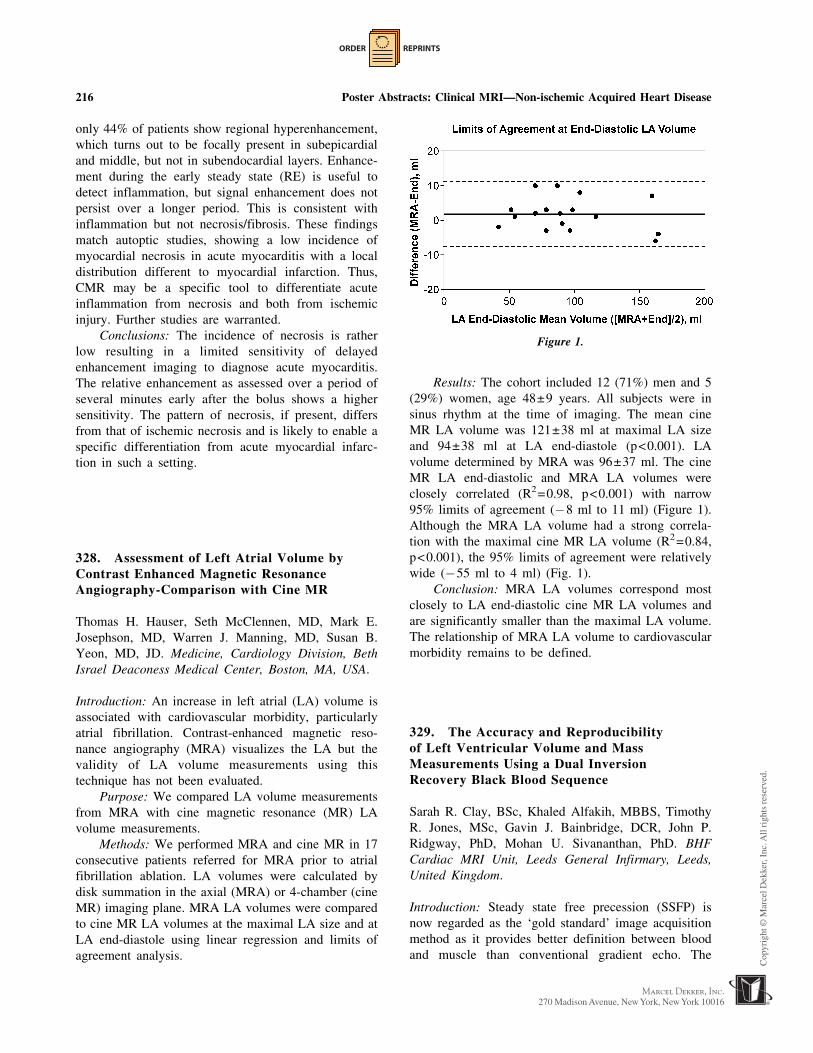
Results: The cohort included 12 (71%) men and 5
(29%) women, age 48±9 years. All subjects were in
sinus rhythm at the time of imaging. The mean cine
MR LA volume was 121±38 ml at maximal LA size
and 94±38 ml at LA end-diastole (p<0.001). LA
volume determined by MRA was 96±37 ml. The cine
MR LA end-diastolic and MRA LA volumes were
closely correlated (R2=0.98, p<0.001) with narrow
95% limits of agreement (�8 ml to 11 ml) (Figure 1).
Although the MRA LA volume had a strong correla-
tion with the maximal cine MR LA volume (R2=0.84,
p<0.001), the 95% limits of agreement were relatively
wide (�55 ml to 4 ml) (Fig. 1).
Conclusion: MRA LA volumes correspond most
closely to LA end-diastolic cine MR LA volumes and
are significantly smaller than the maximal LA volume.
The relationship of MRA LA volume to cardiovascular
morbidity remains to be defined.
329. The Accuracy and Reproducibilityof Left Ventricular Volume and MassMeasurements Using a Dual InversionRecovery Black Blood Sequence
Sarah R. Clay, BSc, Khaled Alfakih, MBBS, Timothy
R. Jones, MSc, Gavin J. Bainbridge, DCR, John P.
Ridgway, PhD, Mohan U. Sivananthan, PhD. BHF
Cardiac MRI Unit, Leeds General Infirmary, Leeds,
United Kingdom.
Introduction: Steady state free precession (SSFP) is
now regarded as the ‘gold standard’ image acquisition
method as it provides better definition between blood
and muscle than conventional gradient echo. The
Figure 1.
216 Poster Abstracts: Clinical MRI—Non-ischemic Acquired Heart Disease

ORDER REPRINTS
improvements in endocardial border definition seen
with SSFP are however not observed at the epicardial
border, which is often difficult to define accurately.
Preliminary observations into the use of black blood
(BB) cardiac magnetic resonance (CMR) pulse se-
quences showed improved epicardial border definition
as well as good endocardial border definition, because
of complete suppression of the blood signal.
Purpose: The aim of this study was to compare
left ventricular (LV) mass and LV end-diastolic
volume (EDV) measurements and the observer vari-
ability between images acquired with a dual inversion
recovery BB sequence and SSFP.
Methods: Images were acquired from 16 healthy
volunteers, 2 patients with left ventricular hypertrophy
and 2 patients with dilated ventricles using SSFP and
black blood sequences in the short-axis orientation. The
sequence parameters are summarised below:
a) BB; TR=1�RR, TE=39 msec, flip angle=90
degrees, acquisition matrix = 384�512,
FOV=290, 6-mm slice thickness, 4-mm inter-
slice gap, 1 phase/cardiac cycle, 2 slices per
10–12 second breath hold.
b) SSFP; TR=3.34 msec, TE=1.67 msec, flip
angle=55 degrees, bandwidth=1042 Hz/pixel,
acquisition matrix=192�163, FOV=360�
288 mm, half Fourier acquisition matrix
6-mm slice thickness, 4-mm interslice gap,
18 phases/cardiac cycle, with two slices ac-
quired per 10- to 12-second breath hold.)
MASS software was used to analyse the images and
the LV EDV and LV mass were calculated by a
modified Simpson’s rule.
Results: The mean±one standard deviation for LV
EDV was 178.3±52.7 ml measured with SSFP and
158.8±62.2 ml with BB. This difference was not
statistically significant (p=0.22). For SSFP the mean
value of LV mass was 124.0±27.0 g and 147.5±37.4 g
for BB, a statistically significant difference (p<0.0001).
Examining the observer variability (Table 1) showed BB
imaging to be at least as reproducible as SSFP for LV
mass which may be a result of better epicardial definition
with a BB technique. The non-significant paired t test
result for the difference in EDV measurements may be a
result of a variable trigger delay set at the end of the R–R
interval in the dual inversion recovery BB sequence. This
may have lead to the ED images being acquired before
the ventricle had fully dilated in some patients (Figure 1).
Conclusions: The dual inversion recovery BB
imaging showed that with further evaluation it could
be as good as SSFP for accuracy and reproducibility of
LV mass measurements. A separate normal range
would need to be established.
330. Measurement of Aortic Root Size byCardiovascular Magnetic Resonance
Elisabeth D. Burman, MSc, Dudley J. Pennell, MD
FRCR FESC FACC, Philip J. Kilner, MD PhD.
Cardiovascular Magnetic Resonance, Royal Brompton
Hospital, London, United Kingdom.
Introduction: Accurate and reproducible measurements
of aortic root dimensions are crucial for informed
decision making on the timing and nature of surgical
replacement of the aortic valve or root. Values for normal
Table 1. The observer variability expressed as the standard deviation of the difference between two values.
LV EDV interobserver
variability
LV EDV intraobserver
variability
Mass interobserver
variability
Mass intraobserver
variability
SSFP SDD(SDD%) 5.7 (3.3%) 4.7 (5.2%) 4.5 (3.7%) 2.9 (4.7%)
BB SDD (SDD%) 8.6 (5.4%) 10.0 (6.3%) 3.3 (2.3%) 3.6 (5.0%)
SDD=standard deviation of difference between two values, SDD%=SDD expressed as a percantage of the mean result.
Figure 1. a) A BB short-axis image with endocardial and
epicardial contours in place on the LV. b) A SSFP short-axis
image with epicardial and endocardial contours in place on the
LV. (View this art in color at www.dekker.com.)
Poster Abstracts: Clinical MRI—Non-ischemic Acquired Heart Disease 217

ORDER REPRINTS
aortic root dimensions have previously been determined
by echocardiography using methods that differ from
those available to cardiovascular magnetic resonance
(CMR). CMR is now widely available and gives virtu-
ally unstricted access to the aorta in any chosen plane,
but methods of acquisition and measurement, and cor-
responding normal ranges have still to be determined.
Purpose: To measure aortic root dimensions by
CMR using specified planes of acquisition and defined
dimensions, and to establish normal ranges with respect
to gender and age.
Methods: Sixty healthy normotensive volunteers
were selected (31M, 29F, age range 20–79). They
comprised three groups aged 20–40, 40–60 and 60–80
years, with ten subjects of each gender in each age range.
CMR was performed using a 1.5 T Siemens Sonata
scanner. Two orthogonal TrueFISP cines aligned with
the left ventricular outflow tract (oblique sagittal and
oblique coronal) were acquired from transaxial and
coronal multislice scouts. From these in-plane cines, two
planes transecting the aortic root at its point of maximum
diameter, mid aortic sinus level, were acquired at mid
systole (at the time of maximum distension) as illustrated
in the Figure 1, and at end diastole. From each of
these cines, 6 aortic root dimensions were measured.
Measurements were made from each of the three cusps to
the opposite commissure (cusp to commissure-dotted
lines in Figure 1) and from each cusp to the furthest
point on the adjacent cusp (cusp to cusp-continuous
lines). Due to the movement of the root during the car-
diac cycle, systolic measurements were taken from the
acquisition aligned at mid-systole, and diastolic mea-
surements from the acquisition aligned at end diastole.
The average of each set of 3 measurements was taken.
Results: The means±standard deviations (and 95%
confidence intervals) for respective groups are shown
in the Tables 1 and 2. Aortic root dimensions were
typically found to be larger by 5 mm in males than in
females. Comparing the 20–40 year olds with the 60–
80 year olds, dimensions increased by 3 to 4 mm over
40 years. Maximum cusp to cusp dimensions were
larger than cusp to commissure measurements by about
2 mm. Dimensions were larger in systole than in
diastole by only about 1 mm.
Conclusions: We report normal aortic root dimen-
sions measured by CMR which show the importance of
gender and age differences. The location and timing
of measurements should be defined for reproducibility
of results.
331. Integrated Approach to the Evaluation ofthe Hypertensive Patient Using Cardiac MRI
Alicia M. Maceira, MD, Sanjay K. Prasad, MD, Raad
Mohiaddin. CMR Unit, Royal Brompton Hospital,
London, United Kingdom.
Table 1. Aortic root dimensions from cusp to commissure in mm.
Age (years) Male systolic Female systolic Male diastolic Female diastolic
20–40 32±3.4 (25–38) 27±2.4 (23–32) 30±3.4 (23–36) 25±2.3 (21–29)
40–60 33±4.1 (25–40) 29±2.0 (25–32) 31±4.1 (24–39) 27±2.0 (24–31)
60–80 35±2.5 (30–39) 30±1.4 (27–32) 34±2.1 (30–38) 28±1.7 (25–32)
All subjects 33±3.5 (26–40) 28±2.2 (24–33) 32±3.6 (25–38) 27±2.4 (22–31)
Table 2. Aortic root dimensions from cusp to cusp in mm.
Age (years) Male systolic Female systolic Male diastolic Female diastolic
20–40 33±4.1 (26–41) 28±3.0 (23–34) 32±3.7 (25–39) 27±3.0 (21–32)
40–60 35±5.0 (25–45) 31±2.7 (26–36) 34±5.3 (24–44) 30±2.2 (25–34)
60–80 37±3.0 (31–43) 32±1.9 (28–35) 36±2.9 (31–42) 31±2.3 (26–35)
All subjects 35±4.3 (27–43) 30±2.8 (25–36) 34±4.4 (26–42) 29±2.9 (23–34)
Figure 1.
218 Poster Abstracts: Clinical MRI—Non-ischemic Acquired Heart Disease

ORDER REPRINTS
Introduction: Long standing hypertension (HTN)
causes significant cardiac morbidity. Accurate evalua-
tion is important to exclude potential remediable
secondary causes. Several diagnostic imaging tests
are usually required both to rule out some of the
commonest causes of secondary HTN and to measure
left ventricular mass and function. Cardiac Magnetic
Resonance (CMR) can provide an integrated approach
to the hypertensive patient, producing a fast diagnosis
and making other tests unnecessary.
Purpose: To assess the feasibility of CMR and
magnetic resonance angiography (MRA) to accurately
define cardiac mass and volume and exclude some of
the commonest causes of secondary HTN including
aortic coarctation, renal artery stenosis and adrenal
gland pathology.
Methods: Forty-eight patients with HTN referred
for CMR study between October’02 and April’03 were
included. The reasons for referral were early-onset
HTN (n=18), HTN resistant to drug therapy (n=20),
paradoxical response to BB therapy (n= 1), and
increase in creatinine with ACEi (n=10). The CMR
studies were performed on a Siemens Sonata 1.5 T
scanner. The study protocol included: 1) a multislice
dark blood (HASTE) sequence in transverse orientation
of the thorax to provide an overview of the
cardiovascular anatomy, 2) TrueFISP cine VLA, four
-chamber and short-axis images to measure left ven-
tricular mass and function plus an aortic arch cine to
exclude coarctation, 3) HASTE multislice and T2
weighted turbospin-echo slices (7 mm slice thickness, 3
mm gap) in transverse and coronal views of the upper
abdomen to scan the adrenal glands and measure renal
dimensions and 4) 3D contrast-enhanced MRA of the
renal arteries with Gadolinium-DTPA (0.2 mmol/Kg).
The average scanning time for the whole protocol was
45 minutes.
Results: Significant abnormalities were found in
12 patients (25%): adrenal mass (n=1), aortic coarc-
tation (n=3) and significant renal artery stenosis (n=8;
three left renal artery stenoses, three right renal artery
stenoses and one bilateral stenosis more severe on the
right), one of these subjects also had significant hydro-
nephrosis and another two intrinsic renal disease.
Mean LV mass index was 136±32 gr/m2, which was
increased when compared to normal reference values,
LVEF was preserved (64±10%), no wall motion
abnormalities were detected.
Conclusions: CMR/MRA can provide a compre-
hensive evaluation of patients with HTN and allows for
a unique integrated approach with assessment of LV
mass, function and wall motion abnormalities as well
as in the detection of secondary causes.
332. Right Ventricular IntramyocardialFatty Infiltration is Associated withDiastolic Dysfunction
Raymond Q. Migrino, MD,1 Suhny Abbara, MD,2
Ricardo Cury, MD,2 David Sosnovik, MD,1 Thomas
Brady, MD,2 Godtfred Holmvang, MD.1 1Radiology
and Medicine, Massachusetts General Hospital, Bos-
ton, MA, USA, 2Radiology, Massachusetts General
Hospital, Boston, MA, USA.
Introduction: Intramyocardial fatty infiltration (IMF) is
a major criterion for the diagnosis of arrhythmogenic
right ventricular dysplasia (ARVD) and has arrhythmo-
genic potential. The functional significance of right
ventricular (RV) IMF in the setting of preserved
systolic function is not known.
Purpose: The study aims to determine whether
IMF is associated with impaired RV diastolic function.
Methods: Twenty four patients underwent cardiac
magnetic resonance imaging between 2002 and 2003 for
ARVD assessment. Cine acquisition of RV function was
performed (field of view 14–16 cm, slice thickness 5.5–
7 mm, temporal resolution 23–54 ms) on contiguous
slices in the axial view. The RV endocardial contour was
traced, volume was calculated using the Simpson’s
method and volume–time curve throughout the cardiac
cycle was obtained. All patients had normal RV systolic
function and were divided into 2 groups: I: no IMF and
II: IMF present (+). Indices of diastolic filling were
compared between the groups: peak filling rate (PFR)
(peak instantaneous change in volume over change in
time), time to peak filling rate (TPFR), filling fraction at
200 ms (FF200) (change in volume in first 200 ms of
diastole over stroke volume).
Results: (see Table 1).
Conclusions: The presence of RV IMF is associ-
ated with diminished peak filling rate and early
diastolic filling fraction. IMF in the RV is associated
with impaired diastolic function and may be an early
manifestation of functional impairment preceding
systolic dysfunction.
Table 1.
No IMF
(n=9)
IMF (+)
(n=15) p value
Cycle length (ms) 748±100 859±38 0.24
RVEF (%) 60±2 55±2 0.11
PFR (mL/ms) 3.1±0.4 2.3±0.2 0.04
TPFR (ms) 72±10 105±13 0.08
FF200(%) 66±3 47±4 0.001
Poster Abstracts: Clinical MRI—Non-ischemic Acquired Heart Disease 219

ORDER REPRINTS
333. Lesion Patterns in Patients After SeptalAblation in Hypertrophic Cardiomyopathy-Relation to the Interventional Approach
Jeanette Schulz-Menger,1 Hassan Abdel-Aty,1 Hart-
mut Goos,2 Rainer Dietz,1 Matthias G. Friedrich.1
1Cardiology, Franz-Volhard-Klinik, Charite, Berlin,
Germany, 2Cardiology, Klinikum Uckermark, Schwedt,
Germany.
Introduction: Septal ablation is an accepted option in
patients with hypertrophic obstructive cardiomyopathy.
The usual approach uses intracoronary alcohol appli-
cation to induce myocardial infarction. This technqie
however is hampered by the occurrence of persistent
AV-bundle branch-block, presumably due to the
extensive tissue destruction. Another approach uses
microparticles to embolize the artery with a low rate of
reported AV blocks. Although the size and type of
lesion likely determines the complication rate, there are
no comparative reports on lesion morphology in the
different approaches. Contrast-enhanced CMR can be
used to characterize the septal lesions.
Purpose: Lesion morphology and extent as
detected by contrast-enhanced CMR differ in patients
with embolic septal infarction as compared to alcohol-
induced necrosis.
Methods: We investigated 7 (6 men age: 50±12
years) patients 3,6±2 years after alcohol ablation and
20(15 men age: 60±4 years) patients (A) 3,7±2 years
after microparticle (M)administration. The amount of
alcohol was 2 ml in each patient, that of polyvinyl
alcohol foam particles 5.2±0.8 ml. A multi-slice in-
version recovery gradient echo sequence was applied in
1.5 T MRI systems to visualize myocardial scarring
(hyperenhancement) (TR 5.5 ms; TE 1.4 ms, slice
thickness 10 mm, no spacing, individual TI) 10
minutes after the second bolus of Gd-DTPA. Function
and mass were quantified in SSFP images.
Results: In both groups the ejection fraction was
normal (A:75.1±3 vs. M:76.8±3%, p=n.s.), the left
ventricle showed a hypertrophy (A:232.9±16 vs.
M:277.0±27). There were no significant differences
between the groups.In all patients the induced infarcts
were detectable and the scan duration was 30–45
minutes. In the alcohol group (Figure 1) the infarcted
area was significantly larger than in the emboli group
(Figure 2) (A:11.1±2.6 g vs. M:7.4.±0.7 g: p<0.05)
and more likely to be transmural (5/7 vs. 2/20).The
improvement of clinical outcome was the same in both
groups (NYHA 3before/NYHA I after.)
Discussion: The advantages of contrast enhanced
CMR should be used in systematic studies on the
relation of lesion patterns to complications and thus
guide interventional approaches.
Conclusions: The advantages of contrast enhanced
CMR should be used in systematic studies on the
relation of lesion patterns to complications and thus
guide interventional approaches.
334. Septal Fibrosis and Skeletal MuscleAbnormalities in Familial Cardiomyopathy
Subha V. Raman, MD, MS, Elizabeth A. Sparks, RN,
Matthew Neff, BA, Steven D. Nelson, MD, Charles F.
Wooley, MD. Internal Medicine, Ohio State University,
Columbus, OH, USA.
Introduction: Over the past 5 decades, our institution
has had the opportunity to investigate a large kindred
with a frameshift mutation in the lamin A/C gene re-
sulting in cardiac conduction abnormalities and progres-
sive cardiomyopathy. Autopsy studies have demonstrated
fibrosis in the mid ventricular septum; antemortem non-
invasive identification would be useful for risk stratifi-
cation of genotype-positive members of the kindred.Figure 1.
Figure 2.
220 Poster Abstracts: Clinical MRI—Non-ischemic Acquired Heart Disease

ORDER REPRINTS
Purpose: We sought to test the utility of magnetic
resonance examination with delayed myocardial en-
hancement (DME) acquisition for noninvasively iden-
tifying midseptal fibrosis and other changes in a group
of early affected genotype-positive family members as
well as age- and sex-matched controls.
Methods: Subjects provided written informed con-
sent to participate in an Institutional Review Board-
approved study. CMR examination with gadolinium-
DTPA administered through a peripheral intravenous
line included comprehensive assessment of atrial and
ventricular size and function, DME acquisitions, as well
as a novel calf muscle imaging protocol. Images from
all subjects were reviewed offline in random order.
Results: No significant difference was observed in
atrial volumes or ventricular size or function between
early affected family members and controls. Subtle
changes on DME imaging were observed in the mid-
ventricular septum in 3 of 13 Family members and in 0
of 18 controls. Striking changes in the calf muscles
with conventional spin echo, spin echo with fat
saturation, and DME applied to the calf were noted
in 3 of 13 Family members (see images below)
whereas none of the controls demonstrated these
skeletal muscle abnormalities (Fig. 1).
Conclusions: A comprehensive CMR examination
including lower extremity assessment may be use-
ful in detection of myocardial fibrosis as well as
skeletal muscle involvement in a family with heredi-
tary cardiomyopathy.
Figure 1.
335. Fat Detection with DualInversion-Recovery Fast Spin-Echo MRI inArrhythmogenic Right Ventricular Dysplasia/Cardiomyopathy (ARVD): A Cadaver andPatient Study
Ernesto Castillo Gallo, MD,1 Harikrishna Tandri, MD,2 E
Rene Rodriguez, MD,3 Khurram Nasir, MD,2 Julie
Rutberg, MS,2 Hugh Calkins, MD,2 Joao A. C. Lima,
MD,2 David A. Bluemke, MD.1 1Radiology, Johns
Hopkins University, Baltimore, MD, USA, 2Cardiology,
Johns Hopkins University, Baltimore, MD, USA, 3Pathol-
ogy, Johns Hopkins University, Baltimore, MD, USA.
Introduction: Fibrofatty infiltration of the right ventri-
cle (RV) is the histopathologic hallmark of arrhythmo-
genic right ventricular dysplasia/cardiomyopathy
(ARVD/C). Dual inversion-recovery fast spin-echo
(DIR-FSE) overcomes the limitations of long scan
times and insufficient blood suppression of the ECG-
gated spin-echo (SE) sequence.
Purpose: To assess the use of MR imaging in
depicting intramyocardial fat with DIR-FSE compared
to gated-SE in cadaveric heart specimens, and patients
with ARVD/C.
Methods: The limiting in-plane spatial resolution of
gated-SE and DIR-FSE imaging protocols (including
TR of 1 and 2 R–R intervals, and echo train length
ranging 12–32) was determined with an American
College of Radiology MR phantom. Two cadaveric
specimens with proven ARVD of women aged 18–35
years (mean age: 26.5 years) were imaged using the
same pulse sequences with the addition of spectrally
selected fat suppression. Contrast-to-noise ratios (CNR)
of the intramyocardial fat in the right ventricle were
measured and compared using analysis of variance
(ANOVA) and Student t-test with Bonferroni correc-
tion. Eleven patients (6 female, 5 male; mean age,
36.9 years; range, 16–58 years) and 10 control subjects
(4 female, 6 male; mean age, 33 years; range, 25–
41 years) underwent DIR-FSE imaging. Images were
evaluated semiquantitatively in terms of fat conspicuity
and image quality using rating scales of 1–4. Differ-
ences between patients with ARVD and the control
group were also assessed by the Student t-test.
Results: The DIR-FSE sequences achieved better
limiting spatial resolution but lower CNR than gated-
SE. The measured absolute CNR in the cadaveric
specimens was larger for DIR-FSE with spectrally
selected fat suppression than without it (P<.05).
Cadaveric specimens demonstrate fat infiltration from
the epicardium toward the endocardium of the right
ventricle free wall. Intramyocardial fat was detected in
8/11 (72.7%) of ARVD patients and in none of the
normal volunteers (P<.001) using a 2R–R DIR-FSE
sequence with a TE=30, 5 mm slice thickness, ETL of
24–32 or less, and FOV of 28 cm.
Conclusions: DIR-FSE MR pulse sequences com-
bined with fat suppression techniques are more
advantageous for intramyocardial fat detection in
ARVD/C compared to gated-SE imaging. However,
when DIR-FSE is applied in vivo, breathholding
constraints limit the spatial resolution of MRI for fat
detection within the right ventricle.
Poster Abstracts: Clinical MRI—Non-ischemic Acquired Heart Disease 221

ORDER REPRINTS
336. Morphologic and FunctionalRight Ventricular Abnormalities inArrhythmogenic Cardiomyopathy
Yves Provost, MD, Tracy Elliot, MD, Narinder Paul,
MD, Naeem Merchant, MD. Radiology, UHN, Toronto,
ON, Canada.
Introduction: Intramyocardial fat infiltration is the
histologic hallmark of the arrhythmogenic cardiomy-
opathy. It is commonly associated with focal or diffuse
right ventricular dilatation, wall thinning or hyper-
trophy and wall motion abnormalities. The MR
appearances of these abnormalities may be subtle and
nonspecific, at times in the range of the normal.
Purpose: To review the MR appearances of right
ventricular abnormalities in arrhythmogenic cardiomy-
opathy and identify more specific pattern of abnormality.
Methods: We have reviewed the cardiac MRI of the
last 25 consecutive patients with a confirmed diagnosis
of arrhythmogenic cardiomyopathy in our hospital.The
right ventricular abnormalities were recorded and
compared with the examinations of 50 other consecu-
tives patients with initial clinical suspicion of arrhyth-
mogenic cardiomyopathy and that subsequently did not
meet the criteria of arrhythmogenic cardiomyopathy.
All the patients underwent cardiac MRI using 1.5 T
magnet and dedicated cardiac phased-array coil. Cine
MRI using a FIESTA pulse sequence in axial and short
axis oblique views plus axial spin-echo DIR sequence
with and without fat saturation were performed.
Results: Most of the patients with confirmed
arrhythmogenic cardiomyopathy showed a combination
of multiple morphologic and functional abnormalities
of the right ventricle rather than isolated findings.
Focal and subtle findings tended to be nonspecific
particularly when isolated.
Conclusions: The range of right ventricular ab-
normalities in arrhythmogenic cardiomyopathy is re-
viewed. The combination of multiple morphologic and
functional abnormalities of the right ventricle, rather
than isolated findings, is strongly associated with the
diagnosis of arrhythmogenic cardiomyopathy.
337. Detection of Myocardial Fibrosisin Systemic Hypertension UsingDelayed-Enhancement MagneticResonance Imaging
Alicia M. Maceira, MD, James C. C. Moon, Sanjay K.
Prasad, MD, Raad Mohiaddin, MD. CMR Unit, Royal
Brompton Hospital, London, United Kingdom.
Introduction: Left ventricular hypertrophy related to
chronic primary systemic hypertension (HT) is associ-
ated with an exaggerated accumulation of collagen,
particularly in the interventricular septum and free
wall, resulting in increased myocardial stiffness. This is
linked to abnormalities of cardiac function, electrical
activity and intramyocardial perfusion. The presence of
myocardial fibrosis has been noninvasively assessed by
measurement of plasma peptides, but is difficult to
study with imaging techniques. Delayed-enhancement
Magnetic Resonance Imaging (DE-MRI) has been
show to be able to distinguish scarred myocardium
(hyper-enhanced) from normal viable myocardium
(dark) in pathologies such as ischaemic cardiomyopa-
thy, hypertrophic cardiomyopathy, Fabry’s disease, and
other conditions.
Purpose: To detect for the presence of myocardial
fibrosis by DE-MRI in hypertension and its correlation
with parameters of cardiac dysfunction including
ejection fraction and ventricular mass.
Methods: 35 consecutive HT patients studied
(57±12 yrs, 24 male) between November’02 and
April’03 were included. Mean duration of HT was
7±4 yrs. All subjects with previous history of (or
symptoms/ECG changes suggestive of) ischemic heart
disease were excluded. The studies were performed on
a Siemens Sonata 1.5 T scanner. The study protocol
included: 1) thoracic dark blood (HASTE) multislice
sequence in transverse orientation for an overall view
of cardiac anatomy, 2) TrueFISP cines of VLA, HLA,
four -chamber as well as SA stack (7 mm slice
thickness with 3 mm gap) to study cardiac anatomy
and function and 3) a peripheral bolus injection of
gadolinium-DTPA (0.2 mmol/kg) was given, and
contrast-enhanced images were acquired using a
segmented inversion-recovery sequence. Imaging com-
menced 20 min after Gd-DTPA was given; segmenta-
tion was from 17 to 23 lines; inversion pulse every 2 to
3 heart beats depending on the RR interval and heart
rate variability; a 90� presaturation pulse was placed
over the cerebrospinal fluid to eliminate ghosting;
VLA, HLA, four chamber and all SA views were
acquired in duplicate but with reversed phase-encoding
direction and the inversion time was optimised for each
scan to ensure myocardial nulling.
Results: Mean LVMI was 136±32 g/m2. Global
and regional systolic function were in the normal
range. In 5 subjects (14%) there was myocardial late
hyperenhancement (1 female, 4 male). In 1 case,
hyperenhancement was located in the papillary mus-
cles, and in the other 4 the distribution was always
midwall and located in the interventricular septum
(n=3) and lateral wall (n=1). In three cases in which
coronary angiography was available there were no
detectable coronary lesions. No significant differences
222 Poster Abstracts: Clinical MRI—Non-ischemic Acquired Heart Disease

ORDER REPRINTS
were found between patients with and without
myocardial enhancement with respect to age, gender,
ventricular mass, years of HT and therapy.
Conclusions: DE-MRI reveals myocardial hyper-
enhancement in a proportion of patients with systemic
hypertension, not related to coronary artery disease.
The presence and extent of hyperenhancement does not
seem to correlate with conventional indicators of
cardiac dysfunction such as increased ventricular
volumes and mass or reduced ejection fraction. Further
work is being undertaken to determine the long-term
significance of these findings.
338. Diastolic Function to Assess MyocardialIron in Thalassemia Major
Mark A. Westwood,1 Alicia M. Maceira, MD,1 Beatrix
Wonke,2 John B. Porter, PhD,3 Malcolm J. Walker,
MD,4 Dudley J. Pennell, MD.1 1CMR Unit, Royal
Brompton Hospital, London, United Kingdom,2Department of Haematology, Whittington Hospital,
London, United Kingdom, 3Department of Haematol-
ogy, University College Hospital, London, United
Kingdom, 4Department of Cardiology, University
College Hospital, London, United Kingdom.
Introduction: Cardiac failure due to iron overload
remains the commonest cause of death in patients with
thalassemia major (TM) in developed countries,
accounting for 71% of all deaths. Due to the lack of
a sensitive diagnostic test for myocardial iron overload,
diastolic dysfunction in TM has not been previously
demonstrated. Diastolic dysfunction may preceed
systolic dysfunction in cardiomyopathy, and thus may
be an early functional marker of iron loading. CMR
T2* measurements allow accurate determination of
myocardial iron levels. We therefore compared the
diastolic function and myocardial iron burden of
thalassemia major patients using CMR.
Purpose: To assess diastolic function in iron
induced cardiomyopathy.
Methods: 67 patients with TM were studied, all of
whom were regularly transfused. For the measurement of
myocardial T2*, a single short axis mid-ventricular slice
was acquired at eight echo times (2.6–16.74 ms, which
increased in 2.02 ms increments) in a single breath-hold.
A gradient-echo sequence was used with a flip angle of
35�, a matrix of 128�256 pixels, a field of view of 40
cm, and a sampling bandwidth of 810 Hz per pixel. The
Repeat Time between the 8 radiofrequency pulses
applied each cardiac cycle was 20 ms. A delay time of
0 ms after the R wave trigger was chosen in order to
obtain a high quality image when blood flow and
myocardial wall motion artefacts are also minimal. A
homogeneous full-thickness region of interest was
chosen in the left ventricular septum, encompassing
both epicardial and endocardial regions. The signal
intensity of this region was measured for each image
using in-house designed software (CMRtools, D Imperial
College), and this was then plotted against the echo
time to form a exponential decay curve of the form
y=Ke�TE/T2* where K represents a constant, TE rep-
resents the echo time and y represents the image signal
intensity. Retrospectively gated TrueFISP sequential
short axis cines (7 mm slice thickness, 3 mm gap) were
acquired, (echo time 1.63 msec, repeat time 22.75 msec,
flip angle 60�, matrix 256�162 pixels), with at least 45
phases per cardiac cycle (temporal resolution between
phases of less than 25 ms). Using in-house software a left
ventricular blood volume time curve can be constructed.
From this the change in blood volume over time can be
derived, giving 2 distinct diastolic filling peaks
corresponding to the early peak filling rate (EPFR) due
to left ventricular relaxation and the atrial peak filling
rate (APFR) due to atrial systole respectively. The ratio
between these can also be calculated. Ten age and sex
matched controls were also scanned, to determine the
normal ranges for these parameters.
Results: The normal ranges obtained were: EPFR
711±236 mls/s, APFR 240±62 mls/s and EPFR/APFR
ratio 3.0±0.8. Out of the 67 patients, 45 had significant
myocardial iron loading (myocardial T2<20 ms). With
the iron loaded patients, the T2* correlated with both
APFR (r=0.48, P=0.001, Figure 1) and EPFR/APFR
ratio (r=0.62, P<0.000, Figure 2), but not the EPFR.
The means of these parameters were significantly
different between controls and iron loaded patients
(APFR 174±240 mls/s, p=0.01, EPFR/APFR ratio
Figure 1. Relationship between APFR and the myocardial
iron burden (myocardial T2*) with a logarithmic correlation
curve shown. The upper and lower 95% confidence intervals
are shown via the dotted lines.
Poster Abstracts: Clinical MRI—Non-ischemic Acquired Heart Disease 223
ORDER REPRINTS
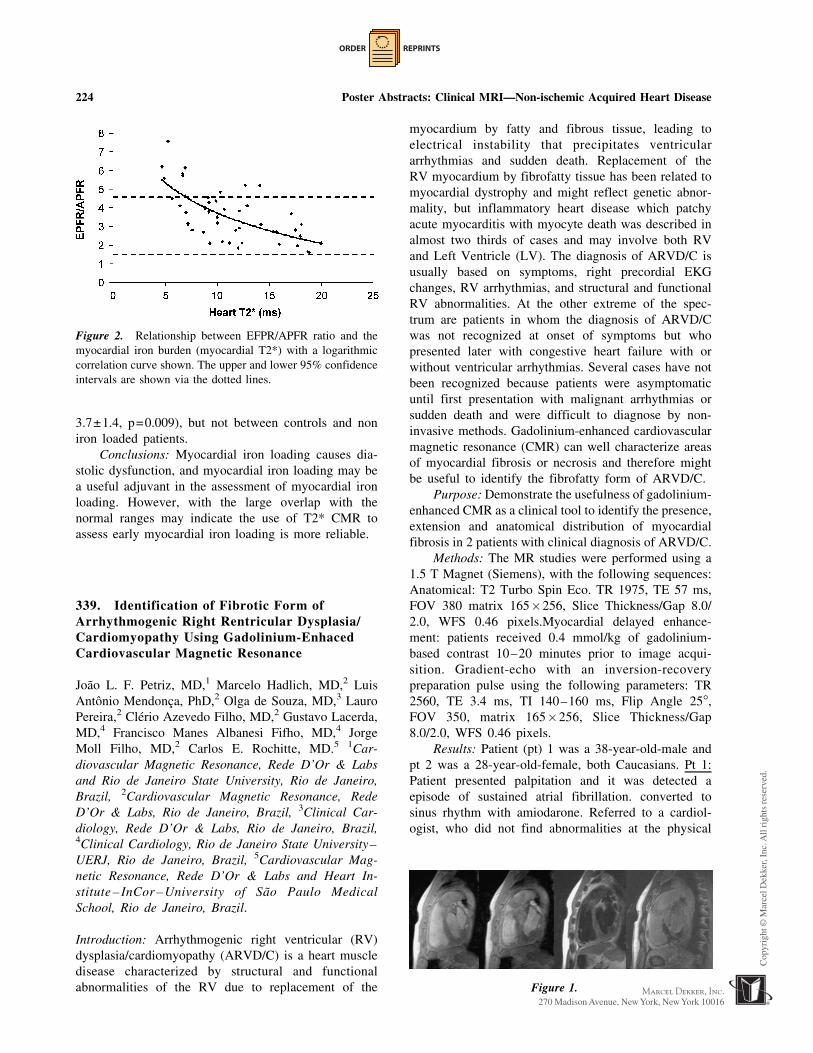
3.7±1.4, p=0.009), but not between controls and non
iron loaded patients.
Conclusions: Myocardial iron loading causes dia-
stolic dysfunction, and myocardial iron loading may be
a useful adjuvant in the assessment of myocardial iron
loading. However, with the large overlap with the
normal ranges may indicate the use of T2* CMR to
assess early myocardial iron loading is more reliable.
339. Identification of Fibrotic Form ofArrhythmogenic Right Rentricular Dysplasia/Cardiomyopathy Using Gadolinium-EnhacedCardiovascular Magnetic Resonance
Joao L. F. Petriz, MD,1 Marcelo Hadlich, MD,2 Luis
Antonio Mendonca, PhD,2 Olga de Souza, MD,3 Lauro
Pereira,2 Clerio Azevedo Filho, MD,2 Gustavo Lacerda,
MD,4 Francisco Manes Albanesi Fifho, MD,4 Jorge
Moll Filho, MD,2 Carlos E. Rochitte, MD.5 1Car-
diovascular Magnetic Resonance, Rede D’Or & Labs
and Rio de Janeiro State University, Rio de Janeiro,
Brazil, 2Cardiovascular Magnetic Resonance, Rede
D’Or & Labs, Rio de Janeiro, Brazil, 3Clinical Car-
diology, Rede D’Or & Labs, Rio de Janeiro, Brazil,4Clinical Cardiology, Rio de Janeiro State University–
UERJ, Rio de Janeiro, Brazil, 5Cardiovascular Mag-
netic Resonance, Rede D’Or & Labs and Heart In-
stitute – InCor – University of Sao Paulo Medical
School, Rio de Janeiro, Brazil.
Introduction: Arrhythmogenic right ventricular (RV)
dysplasia/cardiomyopathy (ARVD/C) is a heart muscle
disease characterized by structural and functional
abnormalities of the RV due to replacement of the
myocardium by fatty and fibrous tissue, leading to
electrical instability that precipitates ventricular
arrhythmias and sudden death. Replacement of the
RV myocardium by fibrofatty tissue has been related to
myocardial dystrophy and might reflect genetic abnor-
mality, but inflammatory heart disease which patchy
acute myocarditis with myocyte death was described in
almost two thirds of cases and may involve both RV
and Left Ventricle (LV). The diagnosis of ARVD/C is
usually based on symptoms, right precordial EKG
changes, RV arrhythmias, and structural and functional
RV abnormalities. At the other extreme of the spec-
trum are patients in whom the diagnosis of ARVD/C
was not recognized at onset of symptoms but who
presented later with congestive heart failure with or
without ventricular arrhythmias. Several cases have not
been recognized because patients were asymptomatic
until first presentation with malignant arrhythmias or
sudden death and were difficult to diagnose by non-
invasive methods. Gadolinium-enhanced cardiovascular
magnetic resonance (CMR) can well characterize areas
of myocardial fibrosis or necrosis and therefore might
be useful to identify the fibrofatty form of ARVD/C.
Purpose: Demonstrate the usefulness of gadolinium-
enhanced CMR as a clinical tool to identify the presence,
extension and anatomical distribution of myocardial
fibrosis in 2 patients with clinical diagnosis of ARVD/C.
Methods: The MR studies were performed using a
1.5 T Magnet (Siemens), with the following sequences:
Anatomical: T2 Turbo Spin Eco. TR 1975, TE 57 ms,
FOV 380 matrix 165�256, Slice Thickness/Gap 8.0/
2.0, WFS 0.46 pixels.Myocardial delayed enhance-
ment: patients received 0.4 mmol/kg of gadolinium-
based contrast 10–20 minutes prior to image acqui-
sition. Gradient-echo with an inversion-recovery
preparation pulse using the following parameters: TR
2560, TE 3.4 ms, TI 140–160 ms, Flip Angle 25�,FOV 350, matrix 165�256, Slice Thickness/Gap
8.0/2.0, WFS 0.46 pixels.
Results: Patient (pt) 1 was a 38-year-old-male and
pt 2 was a 28-year-old-female, both Caucasians. Pt 1:
Patient presented palpitation and it was detected a
episode of sustained atrial fibrillation. converted to
sinus rhythm with amiodarone. Referred to a cardiol-
ogist, who did not find abnormalities at the physical
Figure 1.
Figure 2. Relationship between EFPR/APFR ratio and the
myocardial iron burden (myocardial T2*) with a logarithmic
correlation curve shown. The upper and lower 95% confidence
intervals are shown via the dotted lines.
224 Poster Abstracts: Clinical MRI—Non-ischemic Acquired Heart Disease

ORDER REPRINTS
examination. The electrocardiogram (EKG) showed
epsilon wave in leads V1–V3.
Echocardiogram showed enlargement and severe
dysfunction of the right ventricle and presence of micro
aneurysms. He was undergone stress testing and
developed a episode of non-sustained ventricular
tachycardia (VT). Pt 2: Patient was hospitalized after
a episode of syncope and it was detected sustained VT
(LBB pattern), converted to sinus rhythm after electrical
cardioversion. EKG showed a sinus rhythm, incomplete
right bundle block and sinals of electrical inactivity in
inferior. Echocardiogram showed enlargement and
severe dysfunction of RV and presence hipokinesia in
inferior wall.Patients performed signal averaged EKG
and in both it was found the presence of late potentials.
CMR was performed at this time. In these two patients
we detected the presence of myocardial fibrosis, with
predominant involvement of RV (Figure 1), but con-
comitant presence of areas of delayed enhanced in
septum, anterior wall and inferior wall (Figures 2 and 3).
The patients were referred to electrophysiological
study, in pt 1, it was induced sustained VT with Left
Bundle Block (LBB) pattern and it was not in case 2,
who was in regular use of amiodarone. Patients were
referred to a cardioversor-defibrillator implantable.
Conclusions: Gadolinium-enhanced CMR could
detected the presence of a pattern of patch myocardial
fibrosis with a major involvement of RV in 2 patients
with clinical diagnosis of ARVD/C and malignant
ventricular arrhythmias. These findings may have
implication to improve early diagnosis and risk
stratification of ARVD/C.
340. Altered 3D LV Systolic Strain and StrainRate by MR Tissue Tagging in Type 2 DiabetesMellitus Patients with Diastolic Dysfunction andNormal Ejection Fraction
Carissa G. Fonseca,1 Ajith M. Dissanayake,2 Robert N.
Doughty,1 Gillian A. Whalley,1 Greg D. Gamble,1
Brett R. Cowan,1 Christopher J. Occleshaw,3 Alistair
A. Young.1 1Faculty of Medical and Health Sciences,
University of Auckland, Auckland, New Zealand,2Middlemore Hospital, South Auckland Health, Auck-
land, New Zealand, 3Department of Cardiac Radiology,
Green Lane Hospital, Auckland, New Zealand.
Introduction: Type 2 diabetes mellitus (DM) is
associated with excess cardiovascular morbidity and
mortality. Significant diastolic dysfunction is often
found in DM patients in the absence of atherosclerotic
coronary artery disease (CAD) and regional wall motion
anomalies. However there is little information regarding
3D systolic and diastolic strain in this patient group.
Purpose: To non-invasively assess both systolic
and diastolic 3D myocardial strain in type 2 DM patients
with normal ejection fraction and diastolic dysfunction.
Methods: 28 patients (age 33–70 years) with a
history of type 2 DM and evidence of diastolic
dysfunction with no regional wall motion anomalies
on screening echocardiogram, together with 31 normal
healthy volunteers (NV, age 19–74 years), with no
evidence of cardiac disease, were examined with
multislice cine anatomical and tagged MRI. Three-
dimensional analysis of the images enabled comparison
of mitral valve plane (MVP) motion, LV circumferen-
tial and longitudinal strain and torsion, and strain
relaxation rates. Pulsed wave Doppler echocardiogra-
phy of mitral inflow and tissue Doppler imaging of
the mitral annulus identified diastolic dysfunction in
all patients.
Results: LV ejection fraction was normal in both
patients and volunteers. LV mass:EDV ratio was
increased in the diabetics. Tagged MRI showed a
reduction in the diabetics, compared with NV, in peak
systolic MVP displacement (1.06±0.24 patients vs.
1.21±0.28 cm NV, p=0.040) and peak diastolic MVP
velocity (4.66±1.26 vs. 5.91±2.12 cm/s, p=0.008).
Peak circumferential strain (SC) was also reduced
(16.66±1.99 vs. 19.46±2.44%, p<0.001), as was peak
systolic SC rate (88.16±12.43 vs. 97.85±11.36%/s,
p = 0.008) and peak diastolic SC relaxation rate
(70.83±19.84 vs. 108.26±40.88%/s, p<0.001). Peak
longitudinal strain (SL) was reduced (12.54±2.19 vs.
16.15±2.11%, p<0.001) and decreases were also
observed in peak systolic SL rate (69.12±14.36 vs.
80.74±10.64%/s, p=0.003) and peak diastolic SL
relaxation rate (62.51±21.11 vs. 91.67±36.47%/s,
Figure 2.
Figure 3.
Poster Abstracts: Clinical MRI—Non-ischemic Acquired Heart Disease 225

ORDER REPRINTS
p<0.001). Peak systolic torsion was increased in the
diabetics (6.80±1.44 vs. 5.82±1.26 degrees, p=0.025)
as was peak systolic rate of change of torsion (36.02±
7.47 vs. 29.87±5.36 degrees/s, p=0.002). However,
there was no difference in peak diastolic relaxation of
torsion (34.09 ± 10.597 vs. 34.17 ± 9.27 degrees/s,
p=NS). In both patients and normal volunteers, sig-
nificant correlations were observed between the peak
rate of relaxation and the peak systolic value of each
of the parameters examined (MVP motion; Figure 1,
SC, SL and torsion: r>0.5, P<0.01 in both patients
and NV).
Conclusions: Systolic as well as diastolic myocar-
dial strain and strain-rate, as measured by 3D MR
tissue tagging, is impaired in type 2 DM patients with
normal ejection fraction and diastolic dysfunction. Our
study highlights the need to take into account both
tissue behaviour and LV hemodynamics when asses-
sing LV function.
341. The Clinical Significance of a Common,Functional, X-Linked Angiotensin II Type2-receptor Gene Polymorphism (�1332 G/A)in Patients with Hypertension
Khaled Alfakih,1 Azhar Maqbool,2 Gavin Bainbridge,1
John Ridgway,1 Anthony Balmforth,2 Alistair Hall,3
Mohan Sivananthan.1 1Cardiac MRI unit, Leeds
General Infirmary, Leeds, United Kingdom, 2Institute
of cardiovascular research, University of Leeds,
Leeds, United Kingdom, 3Academic Unit of cardiovas-
cular medicine, Leeds General Infirmary, Leeds,
United Kingdom.
Purpose: We evaluated the common intronic poly-
morphism (�1332 G/A) of the AT2 receptor gene
(X-chromosome) for an association with left ventricular
hypertrophy (LVH), as measured by cardiac MRI.
Methods: Sixty normal volunteers were studied to
establish normal ranges for cardiac MRI as well as the
frequency of the gene in the normal population. 205
patients with hypertension were also studied. MRI
studies were performed on a 1.5-Tesla Philips system
using a cardiac phased-array coil with breath holding.
Multiple short axis slices, covering the entire heart
were acquired using a TGE pulse sequence (TR=8.8
ms, TE=5.2 ms, flip angle=35�). Contour tracing of
the LV at end diastole was performed off-line using
MASS software.Following DNA extraction, a 310 bp
fragment of DNA containing the AT2 (�1332 G/A)
polymorphic site was amplified by PCR. Restriction
fragment length polymorphism analysis was performed
to identify the G allele which digested into two bp
fragments. Means and standard deviations were calcu-
lated for LV mass indexed to body surface area (BSA),
for volunteers and patients.
Results: The mean LV mass indexed to BSA for
the male volunteers was 77.8±9.1 g/m2 (n=30), female
volunteers was 61.5±7.5 g/m2 (n=30), male patients
was 94.3±19.6 g/m2 (n=125), female patients was
71.2±12.0g/m2 (n=75). 73 (37.1%) of all patients had
elevated LV mass index, defined as the mean LV mass
index for normal volunteers plus two standard devia-
tions. Chi-square comparison of normotensive volun-
teers without LVH (NT LVH-) and hypertensive
patients with LVH (HT LVH+) recorded a difference
in genotype frequency (A/AA vs. G/GG) that was
significant (p=0.023) (Fig. 1).
Conclusions: We observed an association between
the AT2 (�1332 G) allele and the presence of LVH in
hypertensive subjects.
Figure 1.
Figure 1. Relationship between peak systolic MVP displace-
ment and peak diastolic MVP velocity.
226 Poster Abstracts: Clinical MRI—Non-ischemic Acquired Heart Disease

ORDER REPRINTS
342. Pulmonary MR Venography FacilitatesElectrophysiologic Pulmonary Venous Ablation
Jeremy D. Collins, BS,1 David Bello, MD,2 Timothy
Betts, MD,2 Eugene Huo, BS,1 Stephanie Shors, MD,1
James Carr, MD,1 F. Scott Pereles, MD.1 1Radiology,
Feinberg School of Medicine, Northwestern Universi-
ty, Chicago, IL, USA, 2Cardiology, Feinberg School
of Medicine, Northwestern University, Chicago, IL,
USA.
Introduction: Pulmonary Magnetic Resonance angiog-
raphy (MRA) generates high-resolution images of the
pulmonary veins (PV) and left atrium (LA), permitting
characterization of complex PV anatomy. Indications
for Pulmonary MRA include electrophysiologic PV
ablation, a proven technique for the treatment of
paroxysmal atrial fibrillation (PAF). Three-dimensional
(3D) MRA datasets can be volume-rendered to provide
high-resolution models of PV and LA anatomy.
Knowledge of complex PV anatomy prior to PV
ablation may facilitate ablation and decrease fluoros-
copy time. Conventional pulmonary venography for
characterization of PV anatomy is less desirable than
MRA because it is invasive, requires nephrotoxic
iodinated contrast, and yields 2D data with low con-
trast resolution.
Purpose: To determine if pre-ablative pulmonary
MR venography with intra-ablative viewing facilitates
PV ablation by reducing fluoroscopy time.
Methods: At 1.5T (Magnetom Sonata, Siemens
Medical Solutions, Malvern, PA) we studied the
morphology of the LA and PV with breath-held
gadolinium-enhanced 3D MRA 13 patients (age 53±8
years) with PAF undergoing PV ablation. Contrast
kinetics were determined with a time-resolved 3D
FLASH MRA sequence with temporal resolution of
5 seconds. MRA sequence parameters were TR/TE 1.8/
0.7, flip angle 13�, 87.5% rectangularized 380 cm
FOV, and 30–40 partitions of 2.2–2.7 mm thickness
with mean in-plane resolution of 1.8 mm�1.5 mm
and mean voxel volume of 7 mm3. Fifteen ml of Gd-
DTPA (Berlex Magnevist, Wayne, NJ) was adminis-
tered at 3.0 ml/s followed by a 20 ml saline flush also
at 3 ml/s. 3D data volumes were serially acquired out
to 30 seconds, producing an initial mask acquisition
and 5 contrast-enhanced time-resolved datasets. These
lower spatial, but high temporal, resolution images
were followed by a high spatial resolution pulmonary
MRA of the following parameters: TR/TE 2.9/1.1, flip
angle 13�, 87.5% rectangularized 380 cm FOV, and
60–72 partitions of 1.2–1.5 mm thickness with mean
in-plane resolution of 1.8 mm�1.5 mm and voxel
volume of 3.5 mm3. 30 ml of Gd-DTPA was ad-
ministered at 3.0 ml/s with a 20 ml saline flush also at
3 ml/s. Central lines of k-space were acquired upon
contrast arrival in the PV. MRA data was volume
rendered (VR) on a stereoscopic workstation (Virtuoso,
Siemens Medical Systems, Iselin, NJ). PV ostial
diameter and cross-sectional area measurements were
obtained on multi-planar reformatted (MPR) images.
VR MRA datasets were converted into digital movies
and were viewed on a laptop computer in the electro-
physiology lab adjacent to real-time fluoroscopic
images. MPR MRA-determined ostial dimensions were
available intra-operatively to facilitate fluoroscopic
vein identification and contact mapping balloon sizing.
Fluoroscopy times were compared for patients under-
going pre-ablative MRA mapping and a cohort of 22
consecutive patients (age 57±9 years) diagnosed with
PAF who underwent catheter ablation without pre-
ablative MRA planning.
Results: There was a significant difference in
both ostial diameters and ostial cross-sectional area
between each vein (ANOVA, p=0.003 and p<0.005
respectively). Mean EP PV ablation fluoroscopic time
with MRA planning versus fluoroscopic imaging
alone were 85±20 minutes and 114±20 minutes
respectively. Pre-ablative MRA planning resulted in a
significant mean fluoroscopy timesavings of 26%
(p<0.05).
Conclusions: In patients with PAF undergoing PV
ablation, analysis of MRA datasets depicting PV
anatomy confirms that there is great variability in
anatomy between veins. Pre-ablative 3D PV mapping
by MRA facilitates fluoroscopic identification of
individual veins and significantly reduces fluoroscopic
radiation time.
343. Subclinical Pulmonary Vein Narrowing isCommon Following Atrial Fibrillation Ablation
Thomas H. Hauser, MD,1 Susan B. Yeon, MD, JD,1
Seth McClennen, MD,1 George Katsimaglis, MD,1
Kraig V. Kissinger, RT, MS,1 Mark E. Josephson,
MD,1 Neil M. Rofsky, MD,2 Warren J. Manning, MD.1
1Medicine, Cardiovascular Division, Beth Israel
Deaconess Medical Center, Boston, MA, USA, 2Radiol-
ogy, Beth Israel Deaconess Medical Center, Boston,
MA, USA.
Introduction: Radiofrequency ablation (RFA) for the
treatment of atrial fibrillation (AF) is increasingly per-
Poster Abstracts: Clinical MRI—Non-ischemic Acquired Heart Disease 227
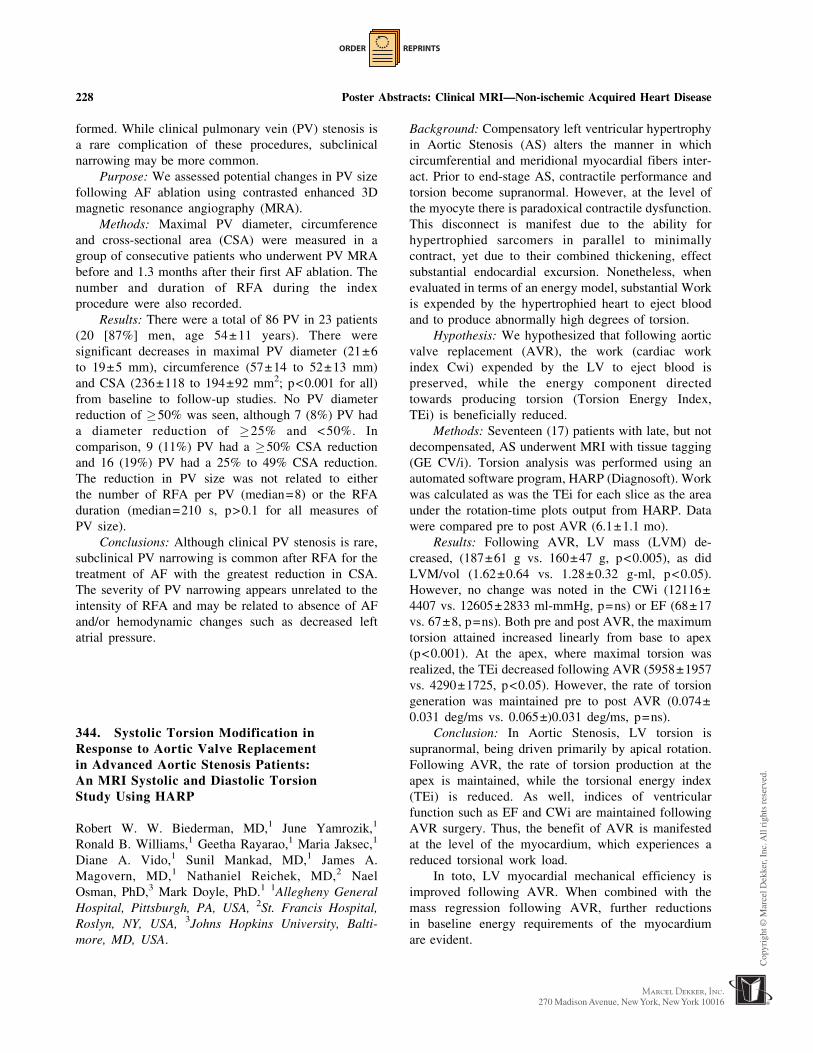
ORDER REPRINTS
formed. While clinical pulmonary vein (PV) stenosis is
a rare complication of these procedures, subclinical
narrowing may be more common.
Purpose: We assessed potential changes in PV size
following AF ablation using contrasted enhanced 3D
magnetic resonance angiography (MRA).
Methods: Maximal PV diameter, circumference
and cross-sectional area (CSA) were measured in a
group of consecutive patients who underwent PV MRA
before and 1.3 months after their first AF ablation. The
number and duration of RFA during the index
procedure were also recorded.
Results: There were a total of 86 PV in 23 patients
(20 [87%] men, age 54±11 years). There were
significant decreases in maximal PV diameter (21±6
to 19±5 mm), circumference (57±14 to 52±13 mm)
and CSA (236±118 to 194±92 mm2; p<0.001 for all)
from baseline to follow-up studies. No PV diameter
reduction of �50% was seen, although 7 (8%) PV had
a diameter reduction of �25% and < 50%. In
comparison, 9 (11%) PV had a �50% CSA reduction
and 16 (19%) PV had a 25% to 49% CSA reduction.
The reduction in PV size was not related to either
the number of RFA per PV (median=8) or the RFA
duration (median=210 s, p>0.1 for all measures of
PV size).
Conclusions: Although clinical PV stenosis is rare,
subclinical PV narrowing is common after RFA for the
treatment of AF with the greatest reduction in CSA.
The severity of PV narrowing appears unrelated to the
intensity of RFA and may be related to absence of AF
and/or hemodynamic changes such as decreased left
atrial pressure.
344. Systolic Torsion Modification inResponse to Aortic Valve Replacementin Advanced Aortic Stenosis Patients:An MRI Systolic and Diastolic TorsionStudy Using HARP
Robert W. W. Biederman, MD,1 June Yamrozik,1
Ronald B. Williams,1 Geetha Rayarao,1 Maria Jaksec,1
Diane A. Vido,1 Sunil Mankad, MD,1 James A.
Magovern, MD,1 Nathaniel Reichek, MD,2 Nael
Osman, PhD,3 Mark Doyle, PhD.1 1Allegheny General
Hospital, Pittsburgh, PA, USA, 2St. Francis Hospital,
Roslyn, NY, USA, 3Johns Hopkins University, Balti-
more, MD, USA.
Background: Compensatory left ventricular hypertrophy
in Aortic Stenosis (AS) alters the manner in which
circumferential and meridional myocardial fibers inter-
act. Prior to end-stage AS, contractile performance and
torsion become supranormal. However, at the level of
the myocyte there is paradoxical contractile dysfunction.
This disconnect is manifest due to the ability for
hypertrophied sarcomers in parallel to minimally
contract, yet due to their combined thickening, effect
substantial endocardial excursion. Nonetheless, when
evaluated in terms of an energy model, substantial Work
is expended by the hypertrophied heart to eject blood
and to produce abnormally high degrees of torsion.
Hypothesis: We hypothesized that following aortic
valve replacement (AVR), the work (cardiac work
index Cwi) expended by the LV to eject blood is
preserved, while the energy component directed
towards producing torsion (Torsion Energy Index,
TEi) is beneficially reduced.
Methods: Seventeen (17) patients with late, but not
decompensated, AS underwent MRI with tissue tagging
(GE CV/i). Torsion analysis was performed using an
automated software program, HARP (Diagnosoft). Work
was calculated as was the TEi for each slice as the area
under the rotation-time plots output from HARP. Data
were compared pre to post AVR (6.1±1.1 mo).
Results: Following AVR, LV mass (LVM) de-
creased, (187±61 g vs. 160±47 g, p<0.005), as did
LVM/vol (1.62±0.64 vs. 1.28±0.32 g-ml, p<0.05).
However, no change was noted in the CWi (12116±
4407 vs. 12605±2833 ml-mmHg, p=ns) or EF (68±17
vs. 67±8, p=ns). Both pre and post AVR, the maximum
torsion attained increased linearly from base to apex
(p<0.001). At the apex, where maximal torsion was
realized, the TEi decreased following AVR (5958±1957
vs. 4290±1725, p<0.05). However, the rate of torsion
generation was maintained pre to post AVR (0.074±
0.031 deg/ms vs. 0.065±)0.031 deg/ms, p=ns).
Conclusion: In Aortic Stenosis, LV torsion is
supranormal, being driven primarily by apical rotation.
Following AVR, the rate of torsion production at the
apex is maintained, while the torsional energy index
(TEi) is reduced. As well, indices of ventricular
function such as EF and CWi are maintained following
AVR surgery. Thus, the benefit of AVR is manifested
at the level of the myocardium, which experiences a
reduced torsional work load.
In toto, LV myocardial mechanical efficiency is
improved following AVR. When combined with the
mass regression following AVR, further reductions
in baseline energy requirements of the myocardium
are evident.
228 Poster Abstracts: Clinical MRI—Non-ischemic Acquired Heart Disease

ORDER REPRINTS
345. LV Diastolic Dysfunction:A Cardiovascular MRI QuantitativeComparision with Echocardiography
Vikas K. Rathi, MD, Mark Doyle, PhD, June
Yamrozik, Ronald B. Williams, Craig Truman, Maria
Jaksec, Diane A. Vido, Robert W. W. Biederman, MD.
Allegheny General Hospital, Pittsburgh, PA, USA.
Introduction: Cardiovascular MRI (CMR) image qual-
ity (spatial resolution, intrinsic 3D nature and repro-
ducibility) has demonstrable superiority compared to
echocardiography (TTE) for systolic function. How-
ever, to date no systematic assessment of diastolic
function representing a wide range of lusitropic
perterbations has been performed by CMR. Limitations
in the current assessment of diastolic function by TTE
exist, including user dependence, acoustic window,
cosinee errors and the inability to interrogate flow in
X,Y, and Z coordinates and yet, TTE is regarded as the
de facto ‘‘gold standard.’’
Hypothesis: We hypothesize that CMR diastolic
flow data is comparable to TTE but without its
aquisition limitations.
Methods: In 21 subjects (male:15, age:26–76 and
female:6, age:46–76) including 7 controls underwent
optimized CMR phase velocity mapping using CV/i
1.5 GE CVMRI scanner (Milwaukee, WI). The 14
patients had diverse diastolic pathology including 6
with impaired relaxation, 2 with restrictive, 2 psuedo-
normalization and 3 with EA fusion and the re-
maining was normal. To include complete diastole, 60
phases/cycle providing a mean temporal resolution of
19±3ms was used to sample 1) entire mitral valve
plane in 3D 2) cross-section through right upper
pulmonary vein (most often visualized by TTE). By
design, within 2 hr post CMR, a blinded TTE of MV
and PV by pulsed wave Doppler on Phillips Sonos
5500 (Andover, MA) using ASE guidelines was
obtained. CMR calculated peak mitral early ’E’ and
late atrial systolic ‘A’ velocites, pulmonary vein ve-
locities, E/A ratios, E gradients and deceleration time
(DT) were compared with the means of 4 TTE images
(see Table 1).
Results: All of the mitral and pulmonary vein
inflow patterns were imaged by CMR while only 17 out
of 21 pulmonary veins were imaged by TTE and, thus
the latter were not further analyzed. There was no
significant difference in the total acquisition plus offline
processing time by either technique. Morphologically,
CMR correctly identified the mitral inflow abnormality
with 100% correlation between CMR and TTE.
Quantifying the absolute inflow velocities demonstrated
that the E velocities, E gradients and DT by CMR and
TTE were not statistically different. The lower ampli-
tude mitral valve A velocities by CMR, however, were
less than the TTE quantitated velocities. Consequently
the absolute E/A ratios did not correlate. However, the
morphologic representation of the E and A velocities
were identical (Figure 1).
Conclusions: CMR phasevelocitymappinghasabili-
ty to derive diastolic function indices. Morphologically,
Table 1. Comparative mean data from CMR and TTE.
TTE CMR TTE CMR TTE CMR TTE CMR TTE CMR
EVel Cm/Sec AVel Cm/Sec E/A EGrad mmHg DecT msec
77.45
(SD±24)
71.14
(SD±20)
55.52
(SD±16.4)
40.83
(SD±16.6)
1.6
(SD±0.76)
2.0
(SD±0.97)
2.63
(SD±1.6)
2.13
(SD±1.3)
157
(SD±43.6)
154
(SD±47.1)
p=0.07 p=<0.05 p=<0.05 p=0.06 p=0.8
Figure 1. Restrictive flow pattern with short DT and high E/A ratio. (View this art in color at www.dekker.com.)
Poster Abstracts: Clinical MRI—Non-ischemic Acquired Heart Disease 229

ORDER REPRINTS
there is homology between the CMR and TTE derived
diastolic flow representations despite heterogeneous
pathology, with near exact inflow E velocity quantifi-
cation. Given the advantages CMR provides for
systolic determinations without the TTE limitations,
diastolic applications appear equally possible.
346. Preclinical Dystrophin DeficientCardiomyopathies Manifest AbnormalSegmental Myocardial Torsion
Marvin W. Ashford, Jr., MD,1 Xin Yu, ScD,1 Wei Liu,
MS,2 Katherine A. Lehr, RN,1 Mary P. Watkins, RT,1
Todd A. Williams, RT,1 Paul Abraszewski, MD,1
Shiow J. Lin, MS,1 Anne Connolly, MD,3 Samuel A.
Wickline, MD.1 1Cardiovacular Medicine, Washington
University, St. Louis, MO, USA, 2Biomedical Engi-
neering, Washington University, St. Louis, MO,
USA, 3Pediatrics, Washington University, St. Louis,
MO, USA.
Introduction: Duchenne muscular dystrophy (DMD)
is an X-linked disorder characterized by early onset
of skeletal muscle degeneration and progressive
weakness. Although cardiomyopathy may occur in
adolescence, it is often undetected due to physical
inactivity and debility. We hypothesize that subtle
defects in regional contractile function may be de-
tected more sensitively at rest with cardiac magnetic
resonance (CMR) by measuring segmental myocar-
dial torsion.
Purpose: The purpose of this investigation was to
apply the method of CMR tagging to uncover evidence
of early cardiac dysfunction in young subjects with
DMD.
Methods: Seven DMD patients without known
heart disease and eight age-matched healthy males
were recruited from a pediatric clinic at Washington
University Medical Center. All subjects were evaluated
using a 1.5 tesla scanner. Cine images of contiguous
short-axis planes from the mitral valve plane to the
apex were obtained using an ECG-triggered gradient-
echo sequence: repetition time (TR), 3.3 msec; echo
time (TE), 1.65 msec; flip angle (FA), 50 degrees;
field of view (FOV), 400 mm; acquisition matrix
224X256; and slice thickness (t), 10 mm. Apical, mid-
ventricular, and base short-axis slices were tagged by
applying two orthogonal spatial modulations of mag-
netization pulses at end-diastole. The tagging gradient
was 10 Gauss/cm with a pulse delay of 0.2 msec,
which yielded a tag grid spacing of 0.6 mm. Tag
displacement was tracked throughout the cardiac cycle
by acquiring gradient echo cine images: TR, 25 msec;
TE, 4.9 msec; FA, 13 degrees; FOV, 330 mm;
acquisition matrix, 176X256; and t, 8 mm. Regional
myofiber twist was measured in four walls (anterior,
septum, inferior, and lateral) using a MATLAB-based
computer program developed in our laboratory. Ven-
tricular torsion was computed by normalizing the
global twist by the distance from apex to mitral valve
plane. Student’s t-test was used to test for differences
between the control and DMD groups.
Results: No significant differences were observed
between control and DMD groups with respect to age
(11.8 years versus 11.4 years), left ventricular ejection
fraction (58.4% versus 59.5%), right ventricular
ejection fraction (52.6% versus 57.4%), left ventricular
mass (101.2 grams versus 94.4 grams), and right
ventricular mass (60.6 grams versus 59.7 grams),
respectively (see Figure 1). Figure 2 indicates thatFigure 1. Left and right ventricular ejection fractions.
Figure 2. Segmental torsion.
230 Poster Abstracts: Clinical MRI—Non-ischemic Acquired Heart Disease

ORDER REPRINTS
the septal and anterior walls exhibit reduced torsion in
the DMD group (p<0.05). Torsion in the lateral and
inferior walls is equal. A trend toward decreased global
torsion was observed in DMD patients (p=0.14).
Conclusion: In patients predisposed to genetic
cardiomyopathies due to mutations of structural genes,
occult cardiac dysfunction can be measured regionally
with CMR tagging. We suggest that the assessment of
torsion may provide a tool to quantify disease
progression and to evaluate over time therapies de-
signed to treat incipient heart failure.
347. The Benefit of Aortic Valve Replacementfor Aortic Stenosis on LV Mechanics is Reducedby CAD
Robert W. W. Biederman, MD,1 Mark Doyle, PhD,1
June Yamrozik,1 Ronald B. Williams,1 Diane A. Vido,1
Maria Jaksec,1 Sunil Mankad, MD,1 James A. Mago-
vern, MD,1 Nathaniel Reichek, MD.2 1Allegheny
General Hospital, Pittsburgh, PA, USA, 2St. Francis
Hospital, Roslyn, NY, USA.
Background: In patients with severe aortic stenosis
(AS), considerable effort has been expended to
understand the mechanism of improvement following
aortic valve replacement (AVR). While results follow-
ing AVR have been very encouraging, the actual effects
regarding the presence or absence of CAD (CAD+,
CAD�) are not well understood. Yet, they are
important as the population eligible for benefit in-
creases as surgical and medical understanding develops.
Hypothesis: We hypothesized that the presence of
CAD blunts the beneficial effects of reverse remodel-
ing following AVR for AS.
Methods: Twenty patients (61 – 90 years, 10
female) with severe AS underwent MRI pre AVR and
6.1±1.2 months post AVR. LV mass Index (LVMI),
mass/volume (LVMI/vol) and EF were measured, along
with 1D transmural circumferential intramyocardial
strain (%S). Complete pre and post data was available
in 16 pts.
Results: EF was normal and similar in the two
groups at baseline and remained unchanged pre to post
AVR (69±17 vs. 67±8%, p=NS). However, LVMI
and LVMI/vol were decreased after AVR, indicating
that reverse remodeling occurred (101±29 vs. 83±23
g/m2, p<0.001; 1.6±0.6 vs. 1.3±0.3, p<0.005). On
sub-set analysis, the reduction in LVMI and LVMI/vol
was confined only to CAD-patients (p<0.05). Pre
AVR,%S was similar in the CAD� and CAD+
subgroups (21±5 vs. 21±9) and mean%S trended
higher for the entire group after AVR (21±4 to
23±5%, p=NS). However, while improvement was
noted in the CAD� subgroup (21±5 to 25±5%,
p<0.05), none was observed in the CAD+subgroup
(21±9 to 19±4, p=0.19).
Conclusion: Following AVR for AS, LV mass
regression is observed, while EF, which was in the
normal range pre AVR, remains unchanged. We note
that the majority of benefit is experienced by
patients without CAD, with regard to LV mass
regression and %S improvement. Interestingly, pre
AVR %S was similar in patients with and without
CAD. Following AVR, patients with CAD trended
towards decreased intramyocardial function. The rela-
tionship to long-term outcome of short-term reverse
remodeling and improved intramyocardial function
remains to be determined.
348. Normal Human Left VentricularDimensions Using Steady State Free PrecessionMRI in the Radial Long-Axis Orientation
Sarah R. Clay, BSc, Khaled Alfakih, MBBS, Alexsan-
dra Radjenovic, MSc, Timothy Jones, MSc, John P.
Ridgway, PhD, Mohan U. Sivananthan, PhD. BHF
Cardiac MRI Unit, Leeds General Infirmary, Leeds,
United Kingdom.
Introduction: The radial long-axis orientation has been
shown to have intrinsic advantages over the short-axis
orientation due to improved contrast, and the avoidance
of errors related to basal slice determination, both of
which aid image analysis (Bloomer et al., 2001).
Previous work has highlighted the need for technique
specific normal ranges (Table 1, Figure 1).
Purpose: The purpose of this study was to
establish normal ranges of left ventricular (LV)
dimensions for the radial long-axis orientation.
Methods: Forty normal subjects (20 male, average
age 32.3, age range 19 to 58; 20 female, average age
37.4, age range 21 to 54) were examined and a steady
state free precession (SSFP) pulse sequence, the
technique of choice in this orientation, was used to
obtain 8 radial slices. Two observers using MASS
software traced endocardial and epicardial contours
independently and volumetric analysis was carried out
Poster Abstracts: Clinical MRI—Non-ischemic Acquired Heart Disease 231

ORDER REPRINTS
using a validated program developed in the department
specifically for the radial long-axis orientation. A
similar program has recently been implemented and
validated in the research version of the MASS software
and this feature is to be added to the commercially
available version in the near future.
Results: The observer variability for LV mass and
LV EDV were expressed as the standard deviation of
the difference between two values (SDD). The inter-
observer variability for LV mass and LV EDV was 6.8
and 7.0 respectively and the intraobserver variability
was 5.7 and 4.5 respectively. These values were lower
than data recently published for a normal range in the
short-axis orientation using SSFP (Alfakih et al., 2003).
Conclusions: A gender specific normal range in the
radial long-axis orientation was established. These re-
sults have provided further evidence that measurements
using radial images are more reproducible than in the
short axis orientation.
REFERENCES
Alfakih, K., Plein, S., Thiele, H., Jones, T., Ridgway, J.,
Sivananthan, M. U. (2003). Normal human left
and right ventricular dimensions for MRI as
assessed by turbo gradient echo and steady-state
free precession imaging sequences. J. Magn.
Reson. 17:323–329.
Bloomer, T., Plein, S., Radjenovic, A., Higgins, D. M.,
Jones, T. R., Ridgway, J. P., et al. (2001). Cine
MRI using steady state free precession in the
radial long axis orientation is a fast accurate
method for obtaining volumetric data of the left
ventricle. J. Magn. Reson. 4:685–692.
349. Clinical Value of CMR for the Detectionof Pericardial Fat in Patients with a FalseDiagnosis of Effusion by Echocardiography
Ana G. Almeida, MD, PhD, Miguel Pacheco, MD,
Eduardo I. Oliveira, MD, Pedro N. Marques, MD,
Claudio David, MD, Arminda Veiga, MD, Sandra
Rodrigues, M-Celeste Vagueiro, MD, PhD. Cardiology,
University Hospital Santa Maria, Lisbon, Portugal.
Introduction: Pericardial effusion is a frequently detected
condition by echocardiography and, very often, repre-
sents a diagnostic challenge. Echocardiography, how-
ever, isn’t often able to distinguish between pericardial
fluid and fat and, so potentially, misdiagnose an effusion.
Purpose: The aim of this study was to assess the
clinical role of CMR in the detection of pericardial fat
in patients with the echocardiographic diagnosis of
pericardial effusion.
Table 1. The mean values±one standard deviation and the normal range for LV parameters.
Male Female
Mean±SD Normal range Mean±SD Normal range
EDV (ml) 181.1±30.3 121–242 144.9±21.1 103–187
EDV/BSA (ml/m2) 90.9±14.3 62–120 80.7±11.2 58–103
ESV (ml) 70.7±18.0 35–107 52.5±12.4 28–77
Mass (g) 136.2±20.5 95–177 96.2±15.5 65–127
Mass/BSA (g/m2) 68.0±8.8 50–86 53.7±8.9 36–72
EF (%) 61.1±6.0 49–73 63.6±4.8 54–73
Key: SD=standard deviation; EDV=end diastolic volume; BSA=body surface area; ESV=end systolic volume; EF=ejec-
tion fraction.
Figure 1. A radial long-axis image taken at end-diastole.
(View this art in color at www.dekker.com.)
232 Poster Abstracts: Clinical MRI—Non-ischemic Acquired Heart Disease

ORDER REPRINTS
Methods: We evaluated, retrospectively, 100 CMR
consecutive studies of our case-load, with miscellaneous
conditions (valvular and ischemic heart disease, cardio-
myopathy, pericardial effusion, aortic diseases, cardiac
masses) and the diagnosis of pericardial effusion, as
assessed by previous echocardiography. The follow-
ing variables were analysed: presence of pericardial
effusion vs. fat; size of fluid or fat at the level of each
cardiac wall in comparison with echocardiographic
findings, considering three degrees of severity (mild,
moderate, severe); size (mm) of the pericardial ab-
normality at the level of free right ventricle wall and the
posterior left ventricle wall. CMR diagnosis of pericar-
dial fluid was bases on the presence of absence of signal
in the pericardial space on SE T1 images and bright
signal on cine-MR, while fat was diagnosed by the
occurrence of bright signal on T1 images, reduction of
intensity by fat-suppression sequence and low signal
around the heart by cine-MR. Axial and short-axis
planes were always obtained. A 1.5 Tesla machine was
used (GE, Signa).
Results: 7 over 100 (7%) patients with the
echocardiographic diagnosis of moderate pericardial
effusion showed, by CMR study, absence of fluid and
occurrence of a thick layer of pericardial fat, which
was also associated to increased epicardial fat. In these
patients, fat was present all around the heart, with a
maximum thickness of 30 mm and a minimum of
22 mm. There was a 100% concordance between the
two methods, concerning the distribution of the peri-
cardial abnormality. There was no significant differ-
ence between the dimension of the pericardial abnor-
mality (fluid/fat) over the right and posterior wall of
left ventricle, obtained by CMR and echocardiography.
Conclusions: Although there is agreement between
echocardiography and CMR, concerning dimensions
and distribution of pericardial effusion/fat, CMR
identified the presence of pericardial fat in an
important number of patients with an echocardiograph-
ic false diagnosis of effusion. The clinical use of CMR
in this condition is advantageous, since unnecessary
further evaluation will be prevented.
350. Conventional Spin Echo MagneticResonance Imaging is Superior to FastSpin Echo in Detection of IntramyocardialFatty Infiltration
Suhny Abbara, MD, Raymond Q. Migrino, MD,
David Sosnovik, Ricardo Cury, MD, Thomas J. Bra-
dy, Godtfred Holmvang. Radiology, MGH, Boston,
MA, USA.
Background: Intramyocardial fatty infiltration (IMF) is
a major criterion for arrhythmogenic right ventricular
dysplasia (ARVD) and is associated with malignant
arrhythmias. Because of lengthy duration of acquisi-
tion, free-breathing conventional spin echo (CSE)
imaging of IMF has largely been supplanted by
blood-suppressed breath-hold fast spin echo (FSE)
techniques. However, the use of FSE, while advanta-
geous because of shorter acquisition time, limits
imaging of the RV to diastole. The aim of this study
is to compare detectability of RV IMF using axial and
sagittal CSE and sagittal FSE.
Methods: Thirty-two patients being evaluated for
ARVD underwent cardiac gated MRI to evaluate for
IMF. The patients were imaged in the prone position
using a 30 cm phased array spine coil, and underwent
axial and sagittal high resolution CSE and sagittal FSE
imaging, with the following parameters: CSE: FOV
12–16 cm, slice thickness 5–7 mm, slice gap 1–1.5 mm,
256/160–224 frequency/phase encoding steps, 4 exci-
tations, minimum echo time, repetition time equal to
cardiac cycle length, spatial saturation pulses superior,
inferior, posterior and over the atria; FSE: same FOV,
trigger delay time of 400–600 ms, echo train length of
16–24, 256/192–224 frequency/phase encoding steps,
1 excitation). If an area of high intramyocardial
signal intensity was detected, the sequence was
repeated with fat suppression. Intramyocardial areas
with high signal intensity that became hypointense fol-
lowing fat suppression were considered to be IMF.
The 3 techniques were compared using McNemar’s chi
square test.
Results: Axial CSE demonstrated fatty infiltration
in 17 out of the 32 patients. Sagittal CSE only detected
fat in 9 cases and sagittal FSE detected fat in only 3
cases (see Table 1, Fig. 1).
Conclusions: CSE is superior to FSE for detec-
tion of IMF, and axial CSE is superior to sagittal
Table 1. Detection of intramyocardial fatty infiltration.
Fat present Fat absent
I Axial CSE 17 15
II Sagittal CSE* 9 22
III Sagittal FSE+ 3 25
I vs. II: p=0.02 I vs. III: P<0.001 II vs. III: P=0.03.
*One patient without sagittal CSE.+Four patients without FSE.
Poster Abstracts: Clinical MRI—Non-ischemic Acquired Heart Disease 233

ORDER REPRINTS
CSE. The use of FSE results in underdetection of
IMF and therefore may result in underdiagnosis
of ARVD.
351. Validation of ImprovedElectrocardiographic Identification of LeftVentricular Hypertrophy in Women UsingCardiovascular Magnetic Resonance
Michael L. Chuang, MD, ScM,1 Yoram Ariel, PhD,2
Carol J. Salton, BA,1 Kraig V. Kissinger, BS, RT (R)
(MR),1 Patricia A. Arand, PhD,3 Lois A. Goepfert, RN,
MS,1 Robert A. Warner, MD,3 Warren J. Manning,
MD.1 1Cardiovascular Division, Beth Israel Deaconess
Medical Center, Boston, MA, USA, 2Inovise Medical,
Inc, Boston, MA, USA, 3Inovise Medical, Inc, Newberg,
OR, USA.
Introduction: The electrocardiogram (ECG) is com-
monly used to identify left venticular hypertrophy
(LVH). To date, electrocardiographic detection of LVH
has been compared to M-mode or 2D echocardiogra-
phy, the accuracies of which are decreased with
anatomic factors such as poor echo windows or
distorted ventricular shape in disease. The performance
of the ECG for detection of LVH in a general
population has not been compared with left ventricular
mass measured using modern volumetric imaging
techniques. Additionally, the sensitivity of the ECG
for LVH is lower in women than men.
Purpose: To assess the sensitivity, specificity and
positive and negative predictive values of commonly
used ECG algorithms for detection of LVH against
mass determined using volumetric cardiovascular
magnetic resonance (CMR) and to determine whether
use of multiple gender-specific ECG criteria improves
LVH detection in women.
Methods: 192 consecutive patients referred for
evaluation of LV function, comprising 70 women and
122 men with a mean (SD) age of 50 (15) years,
underwent CMR using a contiguous multislice SSFP
breathhold cine technique (1.5-T Philips Gyroscan ACS/
NT). Imaging parameters included TR=3.2 ms, TE=1.6
ms, FA=60 deg with 10-mm slice thickness and 1.92-
mm2 in-plane spatial resolution. Patients were classified
as LVH+ or LVH-based on published CMR criteria (LV
mass index;� 74.7 g/m2, women; �95.0 g/m2, men).
Immediately after CMR scanning, a 12-lead ECG was
acquired from each patient using a standard clinical
instrument (Mac Vu, Marquette Medical Systems).
Multiple ECG criteria for LVH were compared to the
CMR reference standard, including: Sokolow-Lyon
(SL); gender-specific Cornell voltage (CV) and Cornell
product (CP); 3 commerical algorithms (C1, C2, C3);
and a novel ‘‘Audicor’’ algorithm that uses multiple
gender specific criteria for LVH.
Results: Prevalence of CMR LVH was 13% in
women and 23% in men (p=NS, chi-square test with
Yates correction). Sensitivity (Sens,%) and specificity
(Spec, %) for detecting LVH by gender for the various
ECG criteria are shown in the Table 1, as are positive
(PPV, %) and negative (NPV,%) predictive values.
For ECG detection of LVH, the Audicor algorithm had
the highest Sens and NPV in women, with preserved
high specificity. For men all the ECG techniques
were similar.
Conclusions: Commonly used ECG algorithms
have high specificity regardless of gender but modest
sensitivity for LVH in men and poor sensitivity in
women. Use of multiple gender-specific ECG criteria
for LVH improves sensitivity in women to a level
comparable to that for men while maintaining high
Table 1. Performance of ECG algorithms vs. CMR for LVH.
SL CV CP C1 C2 C3 Audicor
Women: Sens/Spec 11/95 11/90 11/100 11/95 0/95 22/92 44/92
Men: Sens/Spec 50/85 33/99 61/90 46/82 46/81 68/82 54/90
Women: PPV/NPV 25/88 14/87 100/88 25/88 0/87 29/89 44/92
Men: PPV/NPV 50/85 91/84 65/89 43/84 42/84 53/90 63/87
Figure 1.
234 Poster Abstracts: Clinical MRI—Non-ischemic Acquired Heart Disease

ORDER REPRINTS
specificity. Current ECG algorithms have been devel-
oped using M-mode echocardiography as the reference
standard, although the cubed-power M-mode mass
algorithms have been shown to overestimate LV mass
relative both to volumetrically-determined mass and to
necropsy results. In future it may be desirable to
develop ECG algorithms for detection of LVH based
on mass determined by CMR.
352. Rapid Phase Velocity Mapping of theAortic Flow with and without SENSE-Volumeand Velocity Measurements Compared toStandard Techniques
Srirama V. Swaminathan,1 David L. Owen, RT,2 Ian
Paterson, MD,2 Anthon R. Fuisz, MD.2 1Clinical
Science, Philips Medical Systems, N.A., Cleveland,
OH, USA, 2Cardiology, Washington Hospital Center,
Washington, DC, USA.
Introduction: Phase velocity mapping (pvm) sequences
based on routine gradient echo technique (FFE) can be
used to accurately measure blood flow in the aorta but
are relatively time consuming. In the recent past faster
techniques (Pruessmann et al., 1999) such as segment-
ed k-space gradient echo technique (TFE) has been
proposed. In this work we compared TFE based pvm
sequences with and without SENSitivity Encoding
(SENSE) (Chatzimavroudis et al., 2003) against the
FFE technique. With the TFE technique there is a
considerable reduction in acquisition time. The reduc-
tion in time is much more with SENSE combination.
Purpose: We hypothesized that TFE pvm could
cut acquisition time without any loss in accuracy of
volume measurements or velocity measurements.
Methods: 10 subjects, 7 of who are patients
undergoing pvm for clinical purposes and 3 volunteers
were studied. All the measurements were performed on
Philips Intera CV (Philips Medical Systems, The
Netherlands) system equipped with a 30 mT (150 T/
m/s) Master gradient system. A five element SENSE
Cardiac coil was used. TFE pvm sequences without
and with SENSE (sTFE) were performed directly after
standard pvm sequence. To establish the reproducibility
the standard FFE pvm sequence, it was repeated before
the TFE sequence. The regular FFE sequence used is a
2D Fast Field Echo (2D-FFE) with a TR/TE of 7.6/
4.6 ms. A PC velocity of 250 cm/s was used and 2
signal averaging was done. A slice of 10 mm thick was
planned axially. The average time of acquisition was
187 seconds for about 63 phases. The TFE sequence
was then planned with the same parameter as FFE with
TR/TE of 3.9/2.1 ms. 7 lines of k-space were acquired
per TFE shot. For the SENSE acquisition a factor of 2
was used, with the same number of phases as the FFE
sequence. Images were processed and volumes and
velocities were calculated using Philips’ Q-flow/S-track
processing tool.
Results: Statistical analyses of the data from the
two methods were performed. The results are summa-
rized in Table 1. Paired T-test analysis was done and
P<0.05 is considered significant. The range of mean
difference in flow volume between three different
techniques was �3.625 ml and 1.09 ml and peak
velocities were �1.42 ml and 2.22 ml. Bland Altman
analysis of the techniques was also performed. Figure 1
is a representative plot of the analysis between FFE
and TFE. The percentage mean of difference of flow
volume between TFE without and with SENSE and
FFE are 5% and 3% respectively and is 1% between
TFE with and without SENSE.
Conclusions: Statistical analysis of the flow
volume and peak velocities from three different
methods compares well. TFE technique cuts the
acquisition time by about 80% as compared FFE and
with SENSE it is reduced further by an additional 10%.
This opens up the possibility of doing the acquisition
under breathhold to minimize the respiratory artifacts.
If one chooses, with SENSE one can acquire more
Table 1. FFE vs. TFE, sTFE and TFE vs. sTFE
measurements.
Flow volume
(mL)
Peak velocity
(cm/s)
FFE: Mean(SD) 68.53 (±22.42) 53.74 (±18.27)
TFE: Mean(SD) 72.15 (±35.25) 55.16 (±21.1)
STFE: Mean(SD) 71.06 (±25.54) 52.94 (±19.6)
FFE vs. TFE
Difference: Mean(SD) �3.63 (+30.43) �1.42 (±5.97)
% Difference of mean 5.23% 2.64%
P value 0.36 0.24
FFE vs. sTFE
Difference: Mean(SD) �2.54 (±21.08) 0.8 (±8.06)
% Difference of mean 3.51% 1.45%
P value 0.36 0.38
TFE vs. sTFE
Difference: Mean(SD) 1.09 (±25.97) 2.22 (±7.83)
% Difference of mean 1.53% 4.19%
P value 0.45 0.2
Poster Abstracts: Clinical MRI—Non-ischemic Acquired Heart Disease 235

ORDER REPRINTS
phases. Hence an increased temporal resolution without
any penalty in acquisition time. Shortening the
acquisition time without negatively impacting accuracy
allows the measurement of these important parameters
to be more easily incorporated into clinical scans.
REFERENCES
Chatzimavroudis, G. P., Zhang, H., Halliburton, S. S.,
Moore, J. R., Simonetti, O. P., Schvartzman, P. R.,
Stillman, A. E., White, R. D. (2003). J. Magn.
Reson. Imaging 17:65.
Pruessmann, K. P., Weiger, W., Scheidegger, M. B.,
Boesiger, P. (1999). Magn. Reson. Med. 42:952.
353. Cardiovascular Magnetic Resonance in theAssessment of Aortic Regurgitation
Begona Igual, MD,1 Alicia M. Maceira, MD,1 Vicente
Miro, MD,2 A Osa, MD,2 Pilar Lopez-Lereu, MD,1
Joaquın Martın,1 Jordi Estornell,1 Miguel Palencia,
MD.2 1Eresa, Hospital La Fe, Valencia, Spain,2Department of Cardiology, Hospital La Fe, Valen-
cia, Spain.
Introduction: Phase contrast cardiovascular magnetic
resonance sequences allow for the accurate assessment
of aortic regurgitation (AR) but currently its clinical
use is limited. In patients in whom other imaging
techniques, as Doppler-echocardiography, are not
feasible, CMR should be carried out if available.
Purpose: Our aim was to analyse the results of this
technique in the assessment of AR severity compared
to those derived from echocardiography, and also to
evaluate the utility of aortic planimetry in the study
of AR.
Methods: 30 consecutive patients with aortic valve
disease referred for a cardiac MRI to assess ascending
aorta diameters between January and April 2003 were
included. The studies were performed with a General
Electric1 CVI (1.5 T) scanner. The study protocol
included: 1) multislice dark blood (SSFSE) sequence in
transverse orientation of the thorax to provide an
overview of the cardiovascular anatomy, 2) FIESTA
cine VLA, four -chamber and short-axis images to
measure left ventricular mass and ejection fraction and
3) vascular phase-contrast sequences in three transverse
planes across the aortic valve from which regurgitant
orifice (RO, mm2) and regurgitant fraction (RF, %)
were obtained. CMR criteria of AR severity: AR was
classified as mild if regurgitant fraction (RF)<20%,
moderate if RF=21–40% and severe if RF>40%. All
patients also underwent Doppler-echocardiography
within 2 weeks.
Results: Mean age was 65±11 yrs. Only 9 patients
were females. In 11 cases (37%) the aortic valve
was bileaflet. Pure aortic stenosis was found in 6
patients (20%), pure AR in 11 subjects (37%) and both
aortic stenosis and regurgitation in another 13 (43%).
CMR and Doppler-echocardiography showed good
concordance in detecction of significant AR (Kap-
pa=0.67, P<0.01). CMR allowed for planimetry of the
regurgitant orifice (see Table 1). There was a good
correlation between RF and RO (r=0.84, P<0.01).
Conclusions: 1) Vascular phase contrast CMR
sequence is a good method pro evaluation of AR
severity, with good concordance with doppler-echocar-
diography. 2) CMR planinetry of the regurgitant orifice
Table 1. RO according to AR severity.
Mild
AR
Moderate
AR
Severe
AR
P
(ANOVA)
RF (%) <20 21–40 >40
RO (mm2) 15±8 31±10 83±50 <0.001
Figure 1. (View this art in color at www.dekker.com.)
236 Poster Abstracts: Clinical MRI—Non-ischemic Acquired Heart Disease

ORDER REPRINTS
is easy and simple, it providees useful information and
should be done routinely in the CMR assessment of
aortic regurgitation.
354. Efficacy of MR Indicators for CardiacResynchronization Therapy (CRT)
Benjamin England, MD, Cathleen Enriquez, Andrew
Lee, Alexander P. Lin, Patrick Colletti, MD, Fernando
Roth, MD, Mayer Rashtian, Mark Myers, MD, Brian
D. Ross, MD, PhD. Huntington Medical Research
Institutes, Pasadena, CA, USA.
Introduction: Cardiac resynchronization therapy (CRT)
for treatment of resistant dilated cardiomyopathy (DCM)
with disconjugate cardiac contractility (DCC) defined
indirectly by ECG (qrs<130 ms), is beneficial in 68%
but ineffective in 32% of patients (Abraham et al., 2002).
Directly demonstrating DCC before treatment might
improve outcome (Bax et al., 2002). MR is superior to
echo in observing DCC and offers several means for its
accurate quantitation (Enriquez et al., 2003).
Purpose: We evaluated three quantitative MR
measures of DCC, asymmetery (Is), asynchrony (Ia),
and circumferential strain (ECC), with the principal
aim of generating a robust numerical DCC index for
use in future trials of CRT.
Methods and Patients: Standard cardiac MRI
acquired on a 1.5T (GE LX 9.0) clinical MR scanner
were analyzed by MASS (Medis Inc) and HARP
(Diagnosoft Inc.). Figure 1 illustrates the principal
indices of wall thickness (mm), mean maximum and
minimum thickening (D) and asymmetry (DD), DCC
indices Ia%=(DD/D)x100; Ia=%DD/Dmin and asynchro-
ny (As=peak D 1–2 ms). Is was determined from the
spread of phases over which individual segments of the
left ventricle achieved their maxima, averaged over
two short axis slices (Table 1).
DCC in tagged data was determined as circumfer-
ential strain, ECC, using HARP. The methods were
evaluated in 10 DCM (EF<35%), 10 CRT candidates
(EF<35%, QRS<120 ms,and 11 age-matched normal
subjects, using t-test and standardized differences
(SD=sd/diff; Power (N)=number of patients to reach
P<0.05) to determine efficacy.
Results: Illustrative examples of normal, asymmet-
ric and asynchronous wall motion are shown (Figure 2).
Measurements of asymmetry, asynchrony, and cir-
cumferential strain in left ventricular heart contraction
distinguished control subjects from DCM patients in
Table 1. Summary of LV function and wall motion analysis.
Normal
(11)
DCM
(10)
CRT
(4/10)
DD (mm) 4.44±1.8 3.26±2.5 2.60±1.6
% DD 36.9±14.9 107.2±60.6* 313.7±423.8
Asymmetry Ia 10.9±14.9 388.2±453.5* 275.0±259.8
Asynchrony
Value
2.3±0.8 9.9±4.5* 9.0±2.9*
ECC (strain) �14.6±3.3 �6.0±5.3** 1.8±2.6**
*p<0.05.
**p<0.005.
Figure 1. Measures of asymmetry (Ia) and asynchrony (Is).
(View this art in color at www.dekker.com.)
Figure 2. Normal (left) versus asymetrical and asynchronous
(right) wall motion. (View this art in color at www.
dekker.com.)
Poster Abstracts: Clinical MRI—Non-ischemic Acquired Heart Disease 237

ORDER REPRINTS
all subjects. Ia measures were on average thirty-five
times higher in patients with DCM than in control
subjects (P<0.05). Measures of Is and ECC also dis-
tinguished control from DCM patients (P<0.0005 and
P<0.001 respectively). Patients qualified by current
criteria for CRT were within the ranges measured in
DCM patients.
Discussion: Ia % and Ia proved capable of
distinguishing DCM from control. The power of Ia to
determine DCC reduced from 458 (1) to 20 the number
of patients required for a future trial of DCC in CRT.
Inclusion of Is (and strain) reduce the number still
further as shown in Figure 3. CRT candidates were
readily defined by CVMR measurements of DCC.
Conclusion: 1) CVMR analysis by MASS and
HARP permits quantification of DCC for the individual
patient. 2) Assuming that DCC is the critical component
of chronic heart failure to be corrected by CRT, MR may
be efficacious in screening patients to improve outcome
for this valuable but costly therapy. 3) A study of the
predictive value of DCC using clinical outcome (6 min.
walk) after CRT is in progress.
Acknowledgments: This study was supported
by grants from HMRI and RSRI. We would like to
thank Dr. Richard Bing for his support and interest in
this study.
REFERENCES
Abraham, W. T., et al. (2002). NEJM 346:1845.
Bax, J. J., et al. (2002). NEJM 347:1803.
Enriquez, C. M., et al. (2003).ISMRM, (Late Breaking #7).
355. Are Geometric Indices, Derived fromCMR, Able to Differentiate Various Formsof Cardiac Hypertrophy?
Steffen E. Petersen,1 Joseph B. Selvanayagam,1 Jane
M. Francis,1 Frank Wiesmann,1 Saul G. Myerson,1
Matthew D. Robson,1 Ingegerd Ostman-Smith,2 Bar-
bara Casadei,1 Hugh C. Watkins,1 Stefan Neubauer.1
1Department of Cardiovascular Medicine, University of
Oxford Centre for Clinical Magnetic Resonance
Research, John Radcliffe Hospital, Oxford, United
Kingdom, 2Division of Pediatric Cardiology, Queen
Silvia Children’s Hospital, Gothenburg, Sweden.
Introduction: The clinical diagnosis of hypertrophic
cardiomyopathy (HCM) may be challenging when
relying on echocardiography. HCM may produce a
wide range of cardiac phenotypes, often making the
differentiation from other causes of cardiac hypertro-
phy such as hypertensive heart disease (HHD), aortic
stenosis (AS) or athletes’ hearts (AH) difficult. Typical
morphologic echo criteria for HCM are left ventricular
hypertrophy (LVH), asymmetric distribution of hyper-
trophy, low end-systolic volumes and high ejection
fractions. Cardiac magnetic resonance (CMR) provides
higher image quality and is intrinsically 3D, not relying
on geometric assumptions, and is thus the gold
standard for cardiac volume and mass studies.
Purpose: We hypothesised that HCM can be
accurately differentiated from HHD, AS and AH,
based on CMR-derived measurements of LV geometry,
i.e., wall thickness, degree of asymmetry, left ventric-
ular mass, end-diastolic and end-systolic volume and
ejection fraction.
Methods: 46 subjects (15 HCM, 7 HHD, 12 AS,
12 AH) underwent CMR on a 1.5 T scanner (Sonata,
Siemens Medical Solutions, Erlangen, Germany).
Patient selection and diagnosis of HCM, HHD and
AS was based on family history, ECG and echocardi-
ography showing moderate hypertrophy. Standard
SSFP (TrueFISP) Cine imaging was performed with a
short axis stack covering the complete left ventricle
and two long axis views: Horizontal long axis (HLA)
and left ventricular outflow tract (LVOT) view. Manual
post-processing with Argus Software 2002B (Siemens
Medical Solutions, Erlangen, Germany) computed left
ventricular ejection fraction (LVEF), left ventricular
mass index (LVMI), left ventricular end-diastolic
(LVEDVI) and end-systolic volume index (LVESVI).
Manual measurements of the maximal end-diastolic
septal wall thickness and the minimal lateral end-
diastolic wall thickness in both long axis views and the
SA apical to the LVOT and basal to the papillary
muscles were carried out on the Syngo 2002B software
package. The maximal values of HLA, LVOT and SA
Figure 3. Correlation of asymmetry and asynchrony. (View
this art in color at www.dekker.com.)
238 Poster Abstracts: Clinical MRI—Non-ischemic Acquired Heart Disease

ORDER REPRINTS
slice measurements were used to calculate maximal
end-diastolic wall thickness (Max WT) and maximal
end-diastolic septum-to-lateral wall ratios as a param-
eter to assess the degree of LV asymmetry (DA). Data
post-processing was done blinded to the clinical
diagnosis. One-way ANOVA with adjustments for
multiplicity (Bonferroni) were used to compare LVEF,
LVMI, LVEDVI, LVESVI, Max WT and DA in the
four groups of patients. A p-value<0.05 was consid-
ered statistically significant. Multinomial logistic
regression was used to predict the probability to
correctly classify subjects.
Results: Table 1 shows results for LVEF, LVMI,
LVEDVI, LVESVI, Max WT and DA for the four
patient groups with LVH. Intra-observer and inter-
observer variabilities were low. Max WT showed no
difference for HHD, AS and AH, but a significant
difference between HCM and AH (p=0.02). There was
also a difference for the degree of asymmetry between
HCM and AH (p<0.001) and between AS and AH
(p=0.02), but not for the remaining LVH groups.
Using multinomial logistic regression 11/15 HCM were
classified correctly as having HCM (73.3%) and 12/12
AH as having AH (100%). HHD and AS could only be
classified correctly in 57.1% and 58.3%, respectively.
Conclusions: HCM and AH can be discerned
reliably from each other using six easily determinable
geometric LV parameters (LVEF, LVMI, LVEDVI,
LVESVI, Max WT, DA). This may be useful when AH
needs to be differentiated from HCM when screening
athletic family members with a high a priori risk of
having inherited HCM and ambiguous echo results.
However, the differentiation of HCM from pressure
overload LVH (HHD, AS) cannot be achieved using
geometric CMR parameters alone. Therefore, a multi-
parametric MR approach may be needed including
assessment of diastolic function, delayed enhancement
to identify patchy areas of fibrosis and possibly cardiac31P-Spectroscopy to further clarify the cause of
hypertrophy in such patients.
356. Effect of Volumetric Imaging andCharacterization of Geometry on Prevalenceand Patterns of Left Ventricular Hypertrophyin the Framingham Pilot MRI Study
Michael L. Chuang, MD,1 Daniel Levy, MD,2 Carol J.
Salton, BA,1 Kraig V. Kissinger, BS, RT (R) (MR),1
Christopher J. O’Donnell, MD, MPH,2 Warren J.
Manning, MD.1 1Cardiovascular Division, Beth Israel
Deaconess Medical Center, Boston, MA, USA,2NHLBI’s Framingham Heart Study, Framingham,
MA, USA.
Introduction: Left ventricular hypertrophy (LVH)
predicts excess cardiovascular morbidity and mortality.
LV geometry classified by relative wall thickness
(RWT) may further stratify risk (Ghali et al., 1998;
Krumholz et al., 1995; Verdecchia et al., 1995).
Echocardiographically, concentric geometry is defined
as RWT=2PWT/EDD�0.45, PWT=posterior wall
thickness, EDD=end-diastolic dimension. Persons thus
may be classified as having either: concentric hyper-
trophy (CH=+LVH and RWT=0.45), eccentric hyper-
trophy (EH= + LVH and RWT�0.45), concentric
remodeling (CR=no LVH, RWT�0.45) or normal
geometry (NL=no LVH, RWT�0.45). Despite the
increased accuracy and reproducibility of volumetric
imaging, there is no widely accepted volumetric
descriptor of LV geometry.
Purpose: To determine: 1) whether stratification
by volumetric LV mass and RWT affects prevalence of
the 4 geometric classes and 2) the effect of a novel
volumetric measure, the ‘‘relative total mass’’ (RTM)
in place of RWT on patient classification.
Methods: 278 adults (133 men, 145 women) aged
59±9 years free of clinical cardiovascular disease from
the Framingham Offspring cohort underwent imaging on
a 1.5-T CMR system (Philips Medical Systems, Best, the
Netherlands) using an ECG-triggered breathhold cine
FFE-EPI sequence (TR=RR, TE=9 ms, FA=30�, slice
Table 1. Geometric indices in different forms of hypertrophy.
Diagnosis (N) HCM (15) HHD (7) AS (12) AH (12)
LVEF (%) 76.6±4.7 77.1±6.9 67.5±20.3 67.9±5.9
LVMI (g/m2) 97.7±94.3 71.5±13.6 102.7±47.2 71.8±18.9
LVEDVI (ml/m2) 78.1±15.7 71.5±11.4 79.8±35.6 93.3±9.2
LVESVI (ml/m2) 18.5±5.8 16.7±6.4 32.7±37.3 30.1±7.1
Max WT (cm)* 2.1±1.2$ 1.9±0.7 1.9±0.4 1.1±0.2$
DA (arbitrary units)* 2.0±0.5$ 1.7±0.3 1.8±0.3x 1.3±0.1$,x
Percent correct (%) 73.3 57.1 58.3 100.0
*Denotes statistical significant (p<0.05) difference within the four patient groups with left ventricular hypertrophy using one-way
ANOVA. Statistically significant (p<0.05) differences are marked as $ (HCM vs. AH), x(AS vs. AH). Values are given as
mean±standard deviation.
Poster Abstracts: Clinical MRI—Non-ischemic Acquired Heart Disease 239
ORDER REPRINTS
thickness=10 mm, gap=0, in-plane resolution=1.25�2.0 mm2) to encompass the left ventricle. Volumetric LV
mass (Vol) was determined by summation of disks and
RTM defined as LV mass/end-diastolic volume. Linear-
geometric mass was computed using the Penn cubed
formula, Penn=1.04*((EDD+IVS+PWT)3�EDD3)�13.6; IVS=septal thickness. EDD, PWT and IVS were
measured from a slice just basal to the papillary muscle
tips. Imaging method-specific thresholds were used to
determine LVH. For volumetric mass, LVM�201.4 g,
114.0 g/m or 77.9 g/m2 (men) and 134.0 g, 81.9 g/m or
74.7 g/m2 (women) indicated LVH (Salton et al., 2002).
Penn-mass thresholds were LVM�259 g, 143 g/m or
111 g/m2 (men) and 166 g, 102 g/m or 106 g/m2 (women)
(Krumholz et al., 1995; Salton et al., 2002). RWT�0.45
and RTM�1.465 were considered concentric. The RTM
threshold was previously determined using ROC analysis
(Chuang et al., 2002). Systolic blood pressure (SBP) was
measured periodically during scanning; the mean of at
least 3 measurements was used. Statistical tests used
Student’s t test or the chi-square test at the p<0.05 level
of significance.
Results: Mean SBP=149±27 mmHg. The preva-
lence of Penn-formula LVH was significantly greater
than that of volumetric LVH for raw values (33.8 vs.
10.4%) and after indexation to Ht (36.3 vs. 11.2%) or
BSA (33.8 vs. 12.9%). There was no difference in
LVH prevalence after indexation; thus results are
reported for raw LV mass only. The frequency of
each geometric pattern is given the Table 1. Normal
mass and geometry was the predominant type regard-
less of imaging method and geometric classification
scheme. However, Penn with RWT identified eccentric
LVH as the most prevalent non-normal type, while
volumetric imaging and either RWT or RTM identified
concentric remodeling as the most prevalent non-
normal type.
Conclusion: In adults free of clinical cardio-
vascular disease, normal LV geometry was the most
prevalent type. Traditional echocardiographic criteria
identified EH as the most common non-normal type,
while volumetric mass with RWT identified CR as
the most prevalent non-normal type. Volumetric mass
combined with a proposed volumetric criterion for LV
geometry (RTM) further increased the proportion of
CR subjects. Sstratification of subjects by RWT and
LV mass differs between volumetric and M-mode
(equivalent) measures. This difference is accentuated
with the proposed volumetric RTM criterion for LV
geometry. Further work is needed to determine the
prognostic value of volumetrically-determined LVH
and geometry, but linear and volumetric methods do
not yield equivalent classifications with respect to LV
mass and geometry.
REFERENCES
Chuang, M. L., et al. (2002). JACC 39:368A.
Ghali, J. K., et al. (1998). JACC 31:1635–1640.
Krumholz, H. M., et al. (1995). JACC 25:879–884.
Salton, C. J., et al. (2002). JACC 39:1055–1060.
Verdecchia, P., et al. (1995). JACC 25:871–878.
357. Evaluation of Left Ventricular Massand Function, Gadolinium Late Enhancementand Aortic Valve Area in Patients withAortic Stenosis Before and Early AfterValve Replacement Using CardiovascularMagnetic Resonance
Almut Mahnke, MD,1 Dudley Pennell, MD,1 Sanjay
Prasad, MD,1 Alicia Maceira, MD,1 Heiko Kindler,
MD,2 Ornella Rimoldi, MD,2 Paolo Camici, MD,2
Desmond Sheridan, MD, PhD.3 1CMR Unit, Royal
Brompton Hospital, Imperial College School of Med-
icine, NHLI, London, United Kingdom, 2Hammersmith
Hospital, Imperial College School of Medicine, NHLI,
London, United Kingdom, 3St Mary’s Hospital,
Imperial College School of Medicine, NHLI, London,
United Kingdom.
Introduction: Aortic stenosis (AS) is associated with
left ventricular hypertrophy (LVH) which is an
important risk factor for left ventricular failure and
cardiac arrhythmias. LVH regression has previously
been shown at 6 month and one year after aortic valve
replacement (AVR).
Purpose: The aim of this study was to determine
the relative importance of LV decompression, by
assessing LVH regression early after AVR and to
investigate whether left ventricular hypertrophy caused
by aortic stenosis is associated with gadolinium late
enhancement indicating myocardial fibrosis.
Table 1. Frequency of LV geometric type.
%CR %CH %EH %NL
Penn and RWT 9.4 10.1 23.7 56.8
Vol and RWT 14.7 4.7 5.8 74.8
Vol and RTM 26.3 7.2 3.2 63.3
240 Poster Abstracts: Clinical MRI—Non-ischemic Acquired Heart Disease

ORDER REPRINTS
Methods: Sixteen patients (pts) (age 67±10 years)
with moderate to severe AS and angiographically nor-
mal coronary arteries, were studied before and 4±1
weeks after AVR using echocardiography to assess
severity of AS and cardiovascular magnetic resonance
to assess left ventricular mass index (LVMI) and func-
tion, and aortic valve area (by planimetry). Ten pts
were additionally investigated for signs of myocardial
fibrosis using gadolinium late enhancement technique.
Eighteen sex and age matched healthy volunteers
served as controls.
Results: Before surgery LVMI was significantly
higher in aortic stenosis pts compared with controls
(104±23 vs. 72±13 g/m2, p=0.006). All pts had
normal LV volumes and function (mean EF:
73±6.8%). Four weeks after AVR significant regres-
sion of LVMI occurred in all pts (mean diff.: �20±
9 g/m2, p<0.0001), which was more evident in pts
with severe LVH (r=�0.72, p=0.004). Subendocardial
gadolinium hyperenhancement was seen in 3 patients
and patchy mid-myocardial hyperenhancement sugges-
tive of myocardial fibrosis was seen in only one
patient. The assessment of aortic valve area by
planimetry correlated significantly with the measure-
ment of aortic valve area by transthoracic echocardi-
ography (r=0.79, p=0.002) (Fig. 1).
Conclusion: 1) Regression of LVM after haemo-
dynamic unloading occurs as early as 4 weeks
following AVR and the decrease is linearly related to
the severity of LVH. 2) Planimetric assessment of aortic
valve area by CMR is a reliable tool to assess severity
of aortic stenosis providing an alternative if subobtimal
echocardiographic images are obtained. 3. Significant
areas of myocardial fibrosis detectable by gadolinium
enhancement were not seen in our patient cohort.
Figure 1.
358. Detection of Left Ventricular Dysfunctionand Cavity Dilatation by Cardiac MagneticResonance and Echocardiography in Patientswith Regurgitant Valvular Disease
Sean G. Hughes, MD, Thomas H. Hauser, MD, Kraig
T. Kissinger, RT, Warren J. Manning, MD, Susan B.
Yeon, MD. Cardiology, Beth Israel Deaconess Medical
Center, Boston, MA, USA.
Introduction: Accurate assessment of left ventricular
(LV) size and function is of particular importance in
patients with mitral and aortic regurgitation. However,
assessment of chamber size by 2D echocardiography
(echo) requires geometric assumptions, and visual
estimation of the LV ejection fraction (EF) by echo
may be inaccurate, especially when the LV is dilated.
Volumetric cardiac magnetic resonance imaging
(CMR) is a highly reproducible method for assessing
LV dimensions, volumes, and function.
Purpose: Using CMR as the gold standard, we
sought to determine the sensitivity and specificity of
echo for detecting LV dysfunction and dilatation in
patients with regurgitant valvular disease.
Methods: We identified all patients with a clinical
CMR study performed at our institution from July
2001–March 2003. Patients were included in the study
population if an echo performed within 6 months of the
CMR demonstrated at least moderate mitral or aortic
regurgitation. Patients with segmental wall motion ab-
normalities were excluded. LV dysfunction was defined
as an echo-EF<55% or a CMR-EF<60% (based on
prior work at our institution identifying this as the 95%
lower limit of normal). LV dilatation was defined as a
LV end-diastolic dimension index (LVEDDI) of �31
mm/m2 by either method, or a LV end-diastolic volume
index (LVEDVI) of �81 mm/m2 by CMR.
Results: Data from 20 patients meeting study
criteria were analyzed. The echo-EF was significantly
lower than the CMR-EF (echo-EF 54.4%±11.3% vs.
CMR-EF 61.8%±9.9%, p<0.0001). When modality-
specific lower limits of normal were applied, the
sensitivity and specificity of echo for LV dysfunction
were 100% and 64%, respectively. Echo significantly
underestimated the LVEDDI as compared to CMR
(echo-LVEDDI 28.7 mm/m2±5.4 mm/m2 vs. CMR-
LVEDDI 34.6 mm/m2±4.2 mm/m2, p<0.0001). The
sensitivity of echo for LV dilatation as defined by the
CMR-LVEDDI or the CMR-LVEDVI was 33% and
26%, respectively. The specificity of echo for LV
dilatation was 100% by either method.
Conclusions: Compared with CMR, echo yields a
lower EF and LVEDDI in patients with significant
Poster Abstracts: Clinical MRI—Non-ischemic Acquired Heart Disease 241

ORDER REPRINTS
mitral or aortic regurgitation. Echo is a sensitive test for
LV dysfunction, but is not sensitive for LV dilatation.
Because surgery is warranted in patients with severe
regurgitant valvular disease and progressive LV dilata-
tion, serial testing by echo alone may not be sufficient.
359. Interobserver Agreement of DelayedGadolinium Enhanced Cardiac MagneticResonance Imaging in Sarcoidosis
Jan-Peter Smedema, MD,1 Gabriel Snoep, MD,2
Marinus van Kroonenburgh, MD, PhD,3 Anton P.
Gorgels, MD, PhD.1 1Cardiology, Academic Hospital
Maastricht, Maastricht, Netherlands, 2Radiology, Aca-
demic Hospital Maastricht, Maastricht, Netherlands,3Nuclear Medicine, Academic Hospital Maastricht,
Maastricht, Netherlands.
Introduction: Sarcoidosis has been reported to cause
clinical symptoms due to cardiac infiltration in 5% of
patients. Postmortem studies have revealed cardiac
involvement in 20–50% of cases. Echocardiography,
myocardial scintigraphy and myocardial biopsy suffer
from low sensitivity, low specificity or both. Delayed
gadolinium enhanced cardiac magnetic resonance
(CMR) imaging might be a valuable additional diagnos-
tic technique.
Purpose: To prospectively evaluate delayed gado-
linium-DTPA enhanced CMR findings in patients with
various stages of sarcoidosis, determine sensitivity and
specificity as compared to the guidelines for the diag-
nosis of cardiac sarcoidosis from the Japanese Ministery
of Health and Welfare (1993) as gold standard, and
determine interobserver agreement.
Methods: Breath-hold T1-weigthed (with and
without inversion recovery prepulse) multislice CMR
examinations acquired at 1.5 T with ECG-triggering
before and 10 minutes after the administration of
0.1 mmol/kg gadolinium-DTPA were performed in 51
patients with various stages of sarcoidosis.Additional
evaluation included physical examination, 12 lead
ECG, SAECG, 24-hour Holter ECG, echocardiography,
thallium-201 and 123I MIBG myocardial scintigraphy.
The presence and localization of enhancing
myocardial lesions was assessed by four blinded expert
observers. Interobserver variability was compared by
means of a kappa statistic. The outcomes were
compared with the gold standard.
Results: The range of interpreted abnormalities
was variable: 7/51 to 21/51 cases. Most lesions were
present in the anterolateral segments.
In 6/51 cases all observers agreed on the presence
of enhancing lesions, and in 23/51 all observers agreed
on the absense of enhancing lesions. In only 31/51
(61%) cases did >2 of the 4 observers agree on the
presense or absense of lesions. When >2 observers
agreed on the presence and >1 agreed on the absense of
enhancement, the sensitivity and specificity of delayed
enhanced CMR for the diagnosis of cardiac sarcoidosis
according to the gold standard were 75% and 95%.
Conclusions: Interobserver agreement of delayed
gadolinium-DTPA enhanced CMR in sarcoidosis was
poor in our study; however with at least 3/4 observers in
agreement a reasonable sensitivity for the diagnosis of
cardiac sarcoidosis was reached.
360. Prevalence of Pericardial EffusionUsing Cardiac MRI
Christopher K. Dyke, MD, Peter Kellman, PhD, W.
Patricia Ingkanisorn, MD, Kenneth L. Rhoads,
MD, Anthony H. Aletras, PhD, Anthony E. Arai,
MD. NHLBI/National Institutes of Health, Bethesda,
MD, USA.
Introduction: Pericardial effusion is a common finding
during routine cardiac imaging. Free living and referral
population prevalence data are limited to echo-detected
effusion, but estimates using MRI have not been
previously reported.
Purpose: The aim of the present study is to report
the prevalence of pericardial effusion detected in a
large patient population referred for cardiac MRI and
to determine significant characteristics associated with
the presence of MRI-detected pericardial effusion.
Methods: 832 consecutive patients who completed
a cardiac MRI examination at a tertiary referral center
Figure 1.
242 Poster Abstracts: Clinical MRI—Non-ischemic Acquired Heart Disease

ORDER REPRINTS
(n=188) or a community hospital (n=644) were
evaluated. Imaging was performed using a General
Electric CV/i 1.5 T MRI system and a four-element
cardiac phased array. Pericardial effusion was identi-
fied using cine Steady State Free Precession (SSFP),
double inversion recovery-fast spin echo (DIR-FSE), or
inversion recovery (IR). Standard echocardiographic
size criteria were used to categorize the effusion as
small, moderate, or large. Logistic regression was per-
formed to assess the relationship between potential risk
factors and the presence of pericardial effusion.
Results: MRI-detected prevalence of pericardial
effusion was 15% (n=125) and was similar in the
referral populations. Of the effusions, 75% (n=93) were
small, 18% (n=23) were moderate, and 7% (n=9)
were large. In the multivariate model, cancer (p<0.001),
LVEF<45% (p<0.001), women (p=0.001), and hyper-
tension (p=0.002) were significant predictors of effu-
sion. Prevalence did not vary with age (p=0.56).
Patients with prior bypass surgery had a lower
prevalence of effusion (p<0.001). The odds ratio plot
for effusion is demonstrated in Figure 1. The prevalence
of effusion increased stepwise with progressively more
severe abnormalities in LVEF (Figure 2).
Conclusions: The findings from this study repre-
sent the first prevalence estimates of pericardial effu-
sion in a large consecutive series of patients referred
for cardiac MRI examination. MRI-detected prevalence
of pericardial effusion is 15% and was more common
in women, a finding that compels further investigation
to evaluate potential mechanisms and determine the
prognostic significance of this finding. Effusion was
also more common in patients with cancer, hyperten-
sion, or left ventricular dysfunction. Contrary to prior
reports, no association with age was seen, possibly due
to the ability of MRI to more accurately determine fat
from fluid in the pericardial space.
361. Error Analysis Supports PhaseContrast MRI as a Robust Method forEvaluating Aortic Stenosis
Emily A. Waters,1 Shelton D. Caruthers, PhD,2 Samuel
A. Wickline, MD.3 1Biomedical Engineering, Washing-
ton University in St. Louis, St. Louis, MO, USA,2Cardiovascular Magnetic Resonance Laboratories,
Washington University School of Medicine and Philips
Medical Systems, Best, Netherlands, 3Cardiovascular
Magnetic Resonance Laboratories, Washington Uni-
versity School of Medicine, St. Louis, MO, USA.
Introduction: MRI methods for assessing valvular
disease, particularly phase-encoded velocity mapping,
have achieved a level of accuracy comparable to the
clinically used methods, transthoracic echocardiogra-
phy and cardiac catheterization (Caruthers et al., In
press). However, scan automation could further im-
prove CMR patient throughput, while also improving
reproducibility by reducing human error.
Purpose: As a preliminary investigation into the
potential robustness of an automated system to evaluate
aortic stenosis using the velocity-time integral method,
we use cross-correlation methods to assess the
similarity of flow patterns at different distances from
the valve plane. The cross-correlation results measure
the ‘‘sameness’’ of flow data between aortic levels,
and hence indicate the extent of error that could be
encountered from imaging planes being longitudinally
mispositioned relative to flow profiles.
Methods: Patients with documented aortic stenosis
via echocardiography were imaged using a 1.5 T MRI
scanner (NT Intera CV, Philips Medical Systems).
Quantitative images were obtained about the aortic valve
plane using a free-breathing, retrospectively gated
velocity encoding technique sensitized for flow in the
through-plane direction (TR/TE/alpha=6.0 ms/2.9 ms/
30�, 30 frames/heartbeat, 2 NSA, typical voxel
size=1.0�1.3�9.0 mm3, typical encoding velocity 4
m/s). For quantitative flow measurements, one plane was
positioned just to the aortic side of the valve at its greatest
excursion toward the apex (typically end-systole). Two
more planes were positioned distally parallel to this
plane, offset 10 mm(+) and 15 mm(+) from its center.
Using IDLv.5.5 (Research Systems Incorporated)
and Philips’ PRIDE image processing tools, translational
cross-correlations were performed between the + and ++
level scans for each patient, calculated from a rectan-
gular region of interest circumscribing the aortic lumen.
Results: The patient population comprised six
mild, four mild-moderate, four medium, two medium-
severe, and seven severe cases. Cross-correlation
functions computed between aortic lumens on the +
Figure 2.
Poster Abstracts: Clinical MRI—Non-ischemic Acquired Heart Disease 243

ORDER REPRINTS
and ++ imaging planes had an average maximum value
of 0.88±0.11 (0.59–0.99). A sample analysis is shown
in Figure 1. The maximum occurred at (0,0) offset for
20 of 25 patients and nonzero offset for the remaining
six. In the group with zero offset, the average
maximum correlation was 0.92±0.07 (0.66–0.99). For
the group with nonzero offset, the average maximum
correlation was 0.75±0.11 (0.59–0.87); echocardio-
graphic diagnoses showed three mild, one mild-
moderate, and one severe stenosis.
Discussion: A useful automated imaging system
must be effective for all manifestations of the disease.
A specific subgroup cannot be consistently excluded.
80% of patients representing the full range of disease
exhibited a high maximum correlation with zero offset
between images acquired at the + and ++ levels. The
remaining 20% also spanned the full range of disease.
As the majority of patients had high similarity between
valve profiles at the + and ++ levels, and those
with slight dissimilarities did not constitute a homog-
enous subgroup, we conclude that the development of
a robust method of automated slice selection should
be practicable.
Conclusion: The high number of cross-correlation
functions maximized at (0,0) offset indicates that there
is no major qualitative change in the shape of velocity
profiles between 1 and 1.5cm distal to the valve plane.
This apparent insensitivity to plane location suggests
that an automated slice selection algorithm would be
robust against distance above the valve plane within a
range of 1.0–1.5cm.
REFERENCES
Caruthers, S. D., et al. The practical value of cardiac
magnetic resonance imaging for clinical quantifi-
cation of aortic stenosis: comparison with echo-
cardiography. Circulation. In press.
362. Left Atrial Volume and Ejection FractionAssessment in Sinus Rhythm and AtrialFibrillation Using the Biplane Area – LengthMethod and Cardiovascular Magnetic ResonanceImaging with TrueFISP
Burkhard Sievers, MD, Simon Kirchberg, Bodo
Brandts, MD, Marvin Addo, Hans-Joachim Trappe,
MD. Cardiology and Angiology, University of Bochum,
Herne, Germany.
Introduction: Atrial fibrillation is the most common
arrhythmia in elderly patients. Left atrial size and
volumes play an important role in predicting the short-
and long-term success rate after cardioversion.
Purpose: To determine whether cardiovascular
magnetic resonance imaging (CMR) with TrueFISP
and the biplane area–length method can be used for
left atrial volume and ejection fraction assessment in
normal subjects and patients with atrial fibrillation.
Methods: 18 healthy subjects (mean age 65.6±6.4
years) and 15 patients with atrial fibrillation (mean age
67.2±8.8 years) were examined using a 1.5 Tesla CMR
imager. Images were acquired by TrueFISP using the
horizontal and vertical long axis planes to measure left
atrial end-diastolic and end-systolic area and longitudi-
nal dimensions. Volumes were determined with com-
mercially available software (Siemens). Left atrial end-
diastolic (EDV), end-systolic (ESV), and stroke (SV)
volumes and ejection fraction (EF) were calculated
using the biplane method and compared with results
obtained by the standard short axis method. Images
were acquired and analyzed twice in the patients with
atrial fibrillation.
Results: There was no difference in age between
men and women (p=0.147) and normal subjects and
patients (p=0.128) included in the study. EDV, ESV,
and SV were significantly higher and EF significantly
lower in patients with atrial fibrillation than in healthy
Figure 1. A) Zoomed segment of magnitude image of the aortic valve; B,C) Velocity-mapped images 1cm and 1.5cm above valve
plane, respectively; D) Cross-correlation function between 1cm and 1.5cm images. Values range from 0 (white) to 1 (black). X and Y
scale in pixels; note correlation peak at (0,0). Max correlation=0.99.
244 Poster Abstracts: Clinical MRI—Non-ischemic Acquired Heart Disease

ORDER REPRINTS
subjects (p�0.009), regardless of the method used.
Values for EDV and ESV obtained by the biplane
area–length method in healthy subjects (p<0.001) and
patients with atrial fibrillation (p<0.001) were sig-
nificantly higher than those obtained by the standard
short axis approach, whereas SV (p�0.057) and EF
(p�0.118) did not differ significantly. In the second
examination in patients with atrial fibrillation, ESV, SV,
and EF did not differ significantly between the two
methods (p�0.481). The interobserver variability
shows very good agreement between the measurements
of the first examination in healthy subjects and patients
and the second examination in patients with atrial
fibrillation (overall variability 0.8+6.5%).
Conclusions: Left atrial volumes and ejection
fraction can be assessed by CMR and True FISP with
the biplane area–length method 3in normal subjects
and in patients with varying heart cycle length, as in
atrial fibrillation. Although the heartbeat varies in
patients with atrial fibrillation, the reproducibility of
the measurements is very good.
363. Quantifying Mitral Stenosis Accuratelywith Velocity-Encoded MRI by the ‘‘PressureHalf-Time’’ Method: Repeatability Study
S. J. Lin, MSEE,1 W. Liu, MS,2 M. P. Watkins, RT,1
T. A. Williams, RT,1 P. A. Brown, RDCS,1 K. A. Lehr,
ADN,1 G. M. Lanza, MD,1 S. A. Wickline, MD,1
Shelton D. Caruthers, PhD.3 1Cardiovascular MR Labs,
Washington Univ. School of Medicine, St. Louis, MO,
USA, 2Cardiovascular MR Labs and Biomedical Engr.,
Washington University, St. Louis, MO, USA, 3Cardio-
ovascular MR Labs, Washington Univ. and Philips
Medical Systems, St. Louis, MO, USA.
Introduction: Mitral stenosis in adults occurs usually as
a consequence of either calcific or rheumatic disease,
and requires absolute quantification for appropriate
medical or surgical management. Recently, velocity-
encoded MRI employing the pressure half time (P1/2T)
method for quantification of mitral valve (MV) stenosis
has been shown to have accuracy similar to that of
ultrasound. However, if this method is to be applied
ubiquitously as a clinical tool, the approach must
exhibit minimal interobserver variation. Accordingly,
we implemented an MRI phase contrast version of the
P1/2T method to estimate the orifice area of stenotic
MV. Two independent observers analyzed the data,
which was then compared against valve sizes computed
independently from Doppler ultrasound data.
Purpose: The purpose of this study is to define the
extent of concordance between MV areas determined
by the P1/2T method of velocity-encoded MRI wherein
the data are analyzed by two independent observers.
Furthermore, measurements of the maximum velocities
across the mitral valve during early and late diastole
(Emax and Amax, respectively) also were compared. In
addition to interobserver comparisons, these MR results
are compared against ultrasound.
Methods: Ten patients with an echocardiographic
diagnosis of mitral stenosis were recruited. Each
patient was imaged using a whole-body MRI unit
operating at 1.5 T (Intera CV, Philips Medical Systems,
Best, Netherlands). With the use of the velocity-
encoded MR technique, quantitative flow images
(through-plane encoding) were acquired (TE/TR/
a=3.0 ms/6.1 ms/30�, Matrix 128�256, FOV=350
mm, thk=8 mm, temporal resolution=30 phases/RR
interval). The velocity-encoded MRI series were
performed in the left ventricular short axis plane
oriented parallel to the MV, positioned 1.5 cm from the
valve plane toward the apex. The maximum encoding
velocity limit (VENC) was chosen as �2 m/s. If veloc-
ity aliasing occurred, the images were re-acquired with
a higher VENC. All MR images were transferred to an
offline workstation (EasyVision R5.1, Philips Medical
Systems) for quantitative flow analysis and were
analyzed separately by two readers in the following
manner. A region of interest was drawn to include the
stenotic mitral jet. The peak flow velocity through the
valve measured in each phase during diastole was used
as a starting point to determine the P1/2T by a least
squares fitting technique to the linear portion of the
flow velocity curves (as determined visually by the
reader). E and A-wave velocities were defined (Emax
Figure 1. The mitral valve area estimated independently by
two readers using the pressure half time method is highly
reproducible. (View this art in color at www.dekker.com.)
Poster Abstracts: Clinical MRI—Non-ischemic Acquired Heart Disease 245

ORDER REPRINTS
and Amax). All MRI values were compared double-
blinded with ultrasound measurements, which were
recorded by a skilled sonographer and analyzed
immediately with the patient remaining on the MRI
trolley table. For both MRI and Doppler ultrasound,
valve area was estimated as 220/(P1/2T).
Results: Figure 1 illustrates excellent concordance
between MV area analyses by different readers
(r=0.92, p<0.001). The MRI valve sizes estimated by
each reader also correlated well with Doppler (r=0.92
and r=0.94, p<0.001). In addition to MV, the com-
ponent measurements of P1/2T, Emax and Amax also
correlated well between readers (r=0.84, r=0.99,
r=0.99, p<0.001), suggesting that the phase contrast
MR data can routinely give the correct answer.
Discussion and Conclusion: Velocity-encoded MRI
is a useful and reliable tool for quantification of mitral
valve areas with the use of the conventional pressure
half time method. Although this method requires
manual ROI identification and user-dependant inter-
pretation, the MRI flow data analysis provides robust
and repeatable estimates of the maximum velocities in
early and late diastole and accurate quantification of
mitral valve areas when compared to echocardiography.
364. Concentric Remodeling is Associated witha Decreased Regional Left Ventricular Function:Multi-Ethnic Study of Atherosclerosis, Substudyof Tagged MRI
Boaz D. Rosen,1 Thor Edvardsen, MD, PhD,1 David
Bluemke, MD, PhD,2 Li Pan,3 Michael Jerosch-Herold,
PhD,4 Sinha Shantanu, PhD,5 Shenghan Lai, MD, PhD,6
Joao A. C. Lima, MD.1 1Cardiology, Johns Hopkins
Hospital, Baltimore, MD, USA, 2Radiology, Johns
Hopkins Hospital, Baltimore, MD, USA, 3Department
of Medical Imaging, Johns Hopkins University, Balti-
more, MD, USA, 4Radiology, University of Minnesota,
Mineapolis, MN, USA, 5Radiology, UCLA, Los-Angeles,
CA, USA, 6Department of Epidemiolgy, Johns Hopkins
School of Public Health, Baltimore, MD, USA.
Introduction: Left ventricular concentric left ventricu-
lar hypertrophy (LVH) is a risk factor for congestive
heart failure (CHF) but the transition between com-
pensatory concentric remodeling and hypertrophy to
regional and a global myocardial dysfunction has not
been thoroughly defined.
Purpose: The purpose of our study was to investi-
gate the association between concentric LV remodeling
and regional LV function expressed as peak systolic
midwall circumferential strain (Ecc) in participants of
the Multi-Ethnic Study of Atherosclerosis (MESA).
Methods: Peak systolic Ecc from 441 tagged MRI
studies was obtained by Harmonic Phase Imaging
(HARP) and its relationship with the degree of concentric
remodeling expressed by LV mass/ end diastolic volume
(M/V) ratio was studied. Regions were defined by
coronary territories: left anterior descending coronary,
(LAD), left circumflex (LCX) and right coronary artery
(RCA), according to recently published standards.
Results: In both genders, reduced strain was seen
in the highest quartile of M/V ratio when compared
to lower quartiles (�13.2 vs. �15.3, p<0.01). This
decrease was regionally nonuniform and was more
pronounced in the left anterior descending (LAD)
region (Figure 1, *p<0.01). However, it was statisti-
cally significant in all regions. Reductions between the
first three quartiles and the fourth quartile in LAD,
right and circumflex territories were 15.3%, 12.3%
10.3%, respectively (p<0.05 for all).
Conclusion: Concentric remodeling is associated
with regional systolic dysfunction in asymptomatic
individuals. This reduced function is more pronounced
in the LAD territory but also present in other regions
and may reflect transition from compensatory concentric
remodeling to global LV dysfunction and heart failure.
365. Correlation Between Hyperenhancementon Delayed Contrast Enhanced MRI and DiastolicFunction in Hypertrophic Cardiomyopathy
Munenobu Motoyasu,1 Hajime Sakuma,2 Shoko
Uemura,1 Katsuya Onishi,3 Tsutomu Okinaka,1 Naoki
Isaka,1 Kan Takeda,2 Takeshi Nakano.1 1First Depart-
ment of Internal Medicine, Mie University, Mie, Japan,2Department of Radiology, Mie University, Mie, Japan,
Figure 1.
246 Poster Abstracts: Clinical MRI—Non-ischemic Acquired Heart Disease
ORDER REPRINTS
3Department of Laboratory Medicine, Mie University,
Mie, Japan.
Introduction: Diastolic dysfunction is common in
patients with overt hypertrophic cardiomyopathy
(HCM). However, relatioship between the extent of
fibrosis and impaired diastolic function in HCM
patients has not been fully determined.
Purpose: The purpose of this study was to evaluate
if altered diastolic function in HCM is significantly
related to the extent of myocardial fibrosis demon-
strated by delayed contrast enhanced MRI.
Methods: Seventeen patients (13 men, 4 women,
mean age 57.7±9.8 years) with HCM were studied.
The severity index of hyperenhancement on delayed
contrast enhanced MRI was determined by scoring the
extent of hyperenhanced tissue in 30 myocardial
segments. The peak filling rate (PFR) during diastole,
LVEF and LV mass were determined by using steady
state cine MRI with high temporal resolution.
Results: Contrast-enhanced MRI demonstrated
hyperenhancement in 97 of the 510 segments (19%)
and 13 of the 17 patients (77%). The severity index
determined by delayed enhanced MRI showed a strong
negative correlation with the PFR (r=�0.86, p<0.01),
and significant negative correlation with LVEF
(r=�0.59, p<0.05). No significant correlation was
observed between the severity index of hyperenhance-
ment and LV mass (r=0.23, p=0.30).
Conclusions: The results in the current study using
delayed contrast enhanced MRI and steady state cine
MRI indicated that severity of myocardial fibrosis re-
vealed by contrast enhanced MRI has a strong correla-
tion with diastolic dysfunction in patients with HCM.
366. Exploring a Novel Coil Position in theMagnetic Resonance Imaging of ArrhythmogenicRight Ventricular Dysplasia/Cardiomyopathy
Kelly Tung, MS,1 Robert M. DePhilip, PhD,1 Mark A.
King, MD,2 Subha V. Raman, MD.3 1Anatomy, The
Ohio State University, Columbus, OH, USA, 2Radiol-
logy, The Ohio State University, Columbus, OH, USA,3Internal Medicine, The Ohio State University, Colum-
bus, OH, USA.
Introduction: Arrhythmogenic right ventricular dyspla-
sia/cardiomyopathy (ARVD/C) is an asymptomatic
cardiac disease characterized by fatty infiltration of
the right ventricular myocardium and often results in
sudden cardiac death. ARVD/C diagnosis includes
assessment of fatty infiltration, which can be achieved
non-invasively with magnetic resonance imaging
(MRI). Early diagnosis allows the patient to make ap-
propriate lifestyle changes to possibly decrease the
mortality of the disease.
Purpose: The standard (control) MRI protocol
places the signal-generating coil directly on the anterior
chest wall and produces a non-specific high intensity
signal that obscures the high signal from fatty in-
filtration. The aim of this study was to determine
whether increasing the distance between the coil and
the anterior chest wall would improve identification of
fatty infiltration.
Methods: Thoraces from seven embalmed cadavers
were imaged on the 1.5 Tesla MRI apparatus using the
control protocol and an experimental protocol with a 6
cm distance between coil and chest surface. A
representative MR axial image and corresponding gross
section of the heart were analyzed in each case. Fatty
infiltration was graded on the MR images in the area
typically affected in ARVD/C patients and correlated
with histopathology of the same region.
Results: The experimental protocol was found to
be more accurate in the fatty infiltration assessment of
the least infiltrated as well as the most infiltrated cases.
In two of the remaining four cases, the experimental
protocol was equal in accuracy to the control protocol.
Conclusions: In five of the seven cases, the
experimental protocol provided a correlation between
MRI and histopathology that was as good as or better
than the control protocol. The experimental protocol
was also better in preventing false positive diagnosis in
cases of minimal infiltration. Thus, the experimental
protocol showed a stronger correlation with histopa-
thology than did the control protocol.
367. Flow Measurement in Ectatic CoronariesUsing Magnetic Resonance Flow Mapping
Sophie Mavrogeni,1 E Papadakis,1 A Manginas,1 K
Spargias,1 M Douskou,2 I Seimenis,3 P Baras,3 S
Foussas,1 D V. Cokkinos.1 1Onassis Cardiac Surgery
Center, Athens, Greece, 2Bioiatriki MRI Unit,
Athens, Greece, 3Philips Hellas Medical Systems,
Athens, Greece.
Introduction: Coronary artery ectasia (CAE) is defined
as a dilatation of an arterial segment to a diameter at
least 1.5 times that of the adjacent normal artery. CAE
is considered as a variant of coronary atherosclerosis.
A previous MI is present in 39% of patients with pure
Poster Abstracts: Clinical MRI—Non-ischemic Acquired Heart Disease 247

ORDER REPRINTS
ectasia. Slow flow in ectatic coronaries may occur even
in the absence of atherosclerotic lesions.
Purpose: A direct nonivasive flow evaluation in
CAE using MR-flow mapping (MR-FM).
Methods: Twelve patients with CAE and 10
controls matched for age were examined. MRI was
performed with a 1.5 T Philips Intera MR scanner.
Velocity-encoded MR images were acquired in a
double oblique imaging plane, which was perpendicu-
lar to the ectatic or aneurysmatic segment of the
coronary artery. The sequence used was a 2D,
segmented k-space gradient-echo sequence. A frequen-
cy selective fat-saturation prepulse was employed.
Scans were carried out with the patient free breathing
using respiratory triggering and a 2D real time
navigator beam for slice tracking. Retrospective ECG
triggering from the QRS complex was implemented.
Magnitude and phase-difference velocity-encoded im-
ages were derived using a view sharing reconstruction.
Results: RCA was ectatic in all patients, while 5
patients had also ectatic LAD. In controls, maximal
flow velocity (MFV) was 18±4 cm/sec for RCA and
21±3 cm/sec for LAD. In patients with CAE, MFV
was 12±2 cm/sec for RCA and 10±2 cm/sec for LAD
(both p<0.05 vs. controls).
Conclusions: CAE vessels are characterized by
slower flow and lower velocities compared to normals.
These patients can be evaluated noninvasively by
MR-FM. This modality may guide further treatment,
since the influence of various medications in this entity
is controversial.
368. Myocardial Delayed Enhancementand Abnormal Cardiac Function inHIV-Positive Patients Who Developthe Lipodystrophy Syndrome
Brian D. Ross, MD, DPhil, FRCS, FRCP,1 Cathleen M.
Enriquez,2 Kimberly Shriner, MD,1 Jacquelyn Smillie,1
Alexander P. Lin, BS,2 Jeffrey Denham, MD,1
Fernando Roth, MD,3 Allan Edminston, MD.4 1Hun-
ntington Medical Research Institutes, Pasadena, CA,
USA, 2Rudi Schulte Research Institute, Pasadena, CA,
USA, 3Foothill Cardiology, Pasadena, CA, USA,4Southern California Heart Specialists, Pasadena,
CA, USA.
Introduction: The successful treatment of HIV by
highly active retroviral therapy (HAART) has resulted
in a dramatic increase in the incidence of lipodystro-
phy/lipoatrophy syndromes (L) (Carr et al., 1998).
Lipodystrophy is characterized by increases in circu-
lating triglycerides and HDL and development of
Type 2 diabetes mellitus, factors associated with
increased risk of coronary artery disease (CAD) and
myocardial infarction (MI). Elevated calcium scores
in 5/8 HIV+L+ by electron beam tomography (EBT)
(Shriner et al., 1980 unpublished) suggest need for
further study.
Aims: 1) Validate cardiovascular MRI (CVMR)
with delayed enhancement (DE) for identification of
proven MI. 2) Screen HIV+L+ for abnormalities in
myocardial viability and wall motion.
Patients and Methods: 12 male patients (7
HIV+L+, 7m, age 51±11y; 5 HIV+L�, 5m, age
50±11y) on HAART for an average of 5 years and
10 HIV�L� controls (5 MI+, 4m, 1f, age 64±22y; 5
MI�, 4m, 1f, age 59±14 y). Lipodystrophy was
defined by clinical criteria of Carr et al. (Carr et al.,
1998). To ensure effectiveness of DE, controls were
age-matched HIV-negative with known heart disease,
selected on the basis of known MI (MI+, N=5) or no
known MI (MI�, N=5). CVMR and DE—All patients
underwent CVMR in a GE LX 1.5-T system. Se-
quences included DE ten minutes post-intravenous
Magnevist (Berlex, 0.2 mmol/kg) and tagging. Result-
ing images were processed with proprietary softwares,
MASS and HARP. Myocardial viability was defined by
hyperenhancement in left ventricular wall by two
blinded, experienced readers (BR, PC). Wall motion
was quantified as previously described (England et al.,
2004; Lin et al., 2003).
9/12 HIV+ also underwent single voxel 1H MRS of
brain (PRESS TE 35 ms, white and grey matter) and
skeletal IMCL (Shriner et al., 1980unpublished). Three
Figure 1. Top: Controls (L) HIV, positive DE, (R) HIV,
negative DE patients (L) HIV L+, possible DE, (R) HIV L�,
negative DE.
248 Poster Abstracts: Clinical MRI—Non-ischemic Acquired Heart Disease

ORDER REPRINTS
of the twelve HIV+ patients had EBT. All data was
compared with historic controls (N=10–20).
Results: Representative cases of DE images are
shown in Figure 1. DE identified nonviable myocardi-
um in all patients with known MI (MI+, 5/5 positive
controls) but none of the controls without MI (MI�; 0/5
negative controls). Only one of the HIV+ patients (1/7
HIV+L+; 0/5 HIV+L�) showed possible evidence of DE
(Table 1). HIV+L+ and HIV+L� did not differ
significantly on the basis of left ventricular ejection
fraction, stroke volume and wall thickness (Table 2).1H MRS distinguished HIV+L+ (reduced cerebral NAA/
Cr and increased IMCL) from HIV+L� (Table 3).
Discussion: HIV+L+ patients have several risk
factors for atherosclerosis, CAD, and MI, including
development of Type 2 diabetes. In accordance with
the increased risk, 3/12 patients studied had elevated
EBT calcium scores, and 2/12 had cardiac symptoms
sufficient to require angioplasty and stent placement.
Although DE after Gadolinium was 100% effective
in identifying MI in 100% of control subjects,
only one of the at-risk HIV with lipodystrophy
showed enhancement.
Conclusion: Prior cardiac ‘events’ necessitated
stent placement in 2/7 HIV+L+ and DE in 1/7. It
seems highly probable that a longer period of HAART
may significantly increase cardiac risk. This pilot
study established the value of CVMR with DE for
earlier detection of heart risk in HIV+ patients who
develop lipodystrophy.
Acknowledgements: Berlex for providing Magne-
vist for this Study. We are grateful to HMRI, RSRI and
Table 1.
Viability
HIV-positive patients HIV-negative controls
Lipo Non-lipo MI+ MI�
# of subjects w/enhancement 1/7 0/5 5/5 0/5
Table 2. Cardiac measurements in an HIV-positive population.
Lipo Non-lipo
N 7 5
Sex M M
Age (y) 51±11 50±11
Weight (kg) 87±14 71±7
Height (cm) 172±7 176±7
BSA (m2) 2.06±0.18 1.87±0.12
HR (bpm) 73±11 65±10
LV measures
Non-indexed (ml) Indexed (ml/m2)
Lipo Non-lipo Lipo Non-lipo
End diastolic volume 158.79±27.19 152.47±29.81 77.19±12.65 82.42±19.78
End systolic volume 53.08±15.16 66.13±24.15 25.78±7.40 35.92±14.51
Stroke volume 105.71±20.14 86.34±8.14 51.42±9.76 46.50±6.19
Ejection fraction (%) 66.9±7.83 57.8±8.42 – –
LV wall thickness
Non-indexed (mm) Indexed (mm/m2)
Lipo Non-lipo Lipo Non-lipo
Anterior septal wall, ED 10.5±1.9 8.7±1.2 5.1±0.7 4.8±0.8
Posterior lateral wall, ED 10.0±1.6 8.2±1.7 4.9±0.9 4.4±0.9
Anterior septal wall, ES 19.0±3.4 14.7±2.7 9.2±1.6 8.0±1.7
Posterior lateral wall, ES 15.6±3.0 13.4±2.8 7.6±1.4 7.2±1.3
Poster Abstracts: Clinical MRI—Non-ischemic Acquired Heart Disease 249

ORDER REPRINTS
Berlex for additional financial support and Dr. Patrick
Colletti for image interpretation.
REFERENCES
Carr, A., et al. (1998). AIDS 12:51–58.
England, B., et al. (2004). SCMR Barcelona (submitted).
Lin, A. P., et al. (2003). ISMRM Florida.
Shriner, K., Edminston, A., unpublished.
369. Disparate Effects of Indexation toFat-Free Body Mass on Gender Differencesin Left Ventricular Mass
Michael L. Chuang, MD,1 Carol J. Salton, BA,1 Kraig
V. Kissinger, BS, RT (R) (MR),1 Christopher J.
O’Donnell, MD, MPH,2 Daniel Levy, MD,2 Warren
J. Manning, MD.1 1Cardiovascular Division, Beth
Israel Deaconess Medical Center, Boston, MA, USA,2NHLBI’s Framingham Heart Study, Framingham,
MA, USA.
Introduction: Elevated left ventricular (LV) mass is
associated with excess cardiovascular morbidity and
mortality. Indexation of LV mass to height (Ht) or
body surface area (BSA) is used to account for
differences overall body size between individuals, but
regardless of imaging method or modality used, mean
LV mass is consistently greater in men than women,
and this difference persists despite indexation to Ht or
BSA. However, it has been suggested that indexation
to fat-free body mass (FFM) may more accurately
reflect metabolic demand and thus allow more accurate
identification of inappropriately elevated LV mass.
Purpose: to determine the effect of indexation to
FFM on gender differences in LVM determined using
volumetric cardiovascular magnetic resonance (CMR)
imaging in a population of community-dwelling adults
free of clinically apparent cardiovascular disease.
Methods: 144 women and 135 men from the
Framingham Offspring cohort underwent CMR on a
1.5-T system (Philips Medical Systems, Best, the
Netherlands). Blood pressure was measured during
imaging using an automatic oscillometric device and
the average of at least three measurements was used. A
breath-hold cine FFE-EPI sequence (TR=R–R inter-
val, TE=9 ms, FA=30�, in-plane resolution 1.25�2.0
mm2) was used to acquire 10-mm contiguous LV short-
axis slices encompassing the left ventricle at end-tidal
expiration. Volumetric LV mass was determined from
the end-diastolic phase by summation of disks. FFM
was calculated using two gender-specific methods.
The Kvist formula (Kvist et al., 1988) which is based
on computed-tomography measurements, estimates
adipose mass as 0.923*(1.36*Wt/Ht�42.0) kg in men
and 0.923*(1.61*Wt/Ht�38.3) in women, Wt=weight.
Kvist-formula FFM is adipose mass subtracted from
total body mass. The Kuch formula (Kuch et al.,
2001), based on bioelectric impedance measures, esti-
mates FFM as 5.1*Ht1.14*Wt0.41 for men and FFM=
5.34*Ht1.47*Wt0.33 for women. LV mass was indexed
to Ht, Wt, BSA, Ht2.7 (de Simone et al., 1992) and
to FFM by the Kvist and Kuch methods. Data are
summarized as mean±standard deviation and gender
differences assessed using simple t tests.To account for
possible gender differences in mean blood pressure,
analyses were also performed considering only normo-
tensive (SBP<140 mmHg) subjects.
Results: Women and men did not differ in age
(60±9 and 59±9 years respectively, p=NS) but mean
SBP was lower in women (146±26 vs. 153±28 mmHg,
p=0.04). For the 64 women and 41 men with
SBP�140 mmHg mean SBP did not differ (124±12
vs. 121±12, p=0.22). ‘‘Raw’’ (non-indexed) and
indexed masses by gender are shown in the Table 1.
For the study group as a whole, men had significantly
greater raw mass and this difference persisted after
indexation to Ht, Ht2.7, BSA and Wt. Indexation to
Kuch-FFM eliminated gender differences in LV mass,
while indexation to Kvist-FFM revealed significantly
Table 3. Effects of lipodystrophy on brain and muscle MRS.
HIV and lipo HIV no lipo p
n 8 7
Yrs of HAART 5.0±1.6 4.7±1.4 ns
Age (y) 48±7 46±10 ns
CD4 247±216 546±198 0.01*
Viral load (�103) 35±68 0.4±0.02 ns
Cholesterola 233±70 193±31 ns
TAGmax 1093±779 235±159 0.01*
HDL 26±12 48±17 0.001*
IMCL/EMCL 1.91±1.4 0.92±0.4 0.05
[Creatine]musc 1.97±1.2 2.01±1.0 ns
NAA/Cr, WM 1.57±0.10 1.85±0.12 0.001*
NAA/Cr, GM 1.51±0.12 1.64±0.08 0.01
aOn statins [n=3].*Multivariate correlation p<0.01.
250 Poster Abstracts: Clinical MRI—Non-ischemic Acquired Heart Disease

ORDER REPRINTS
greater adjusted LV mass in women than in men
(p<0.001). These relationships were consistent when
considering only normotensive subjects, apart from
indexation to Ht2.7, after which gender differences
marginally crossed into non-significance with p=0.054.
Conclusion: Men have greater ‘‘raw’’ LV mass
than women and this gender difference persists after
indexation to anthropomorphic descriptors including
Ht, Ht2.7, Wt and BSA. However, indexation to
calculated FFM eliminates gender differences in mean
LV mass using an estimator (Kuch) derived from
bioelectric impedance measures, and actually reveals
greater indexed LV in women compared to men with
using an imaging-based estimator of FFM. Further
work is needed to determine the prognostic value of
LVM indexed to calculated FFM.
REFERENCES
de Simone, G., et al. JACC 20:1251–1260.
Kuch, B., et al. J. Hypertens. 19:135–142.
Kvist, H., et al. Am. J. Clin. Nutr. 48:1351–1361.
370. Assessment of Aortic Stenosis withCardiovascular Magnetic Resonance
Begona Igual, MD,1 Alicia M. Maceira, MD,1 Vicente
Miro, MD,2 Pilar Lopez-Lereu, MD,1 Joaquın Martın,1
Jordi Estornell,1 M Arnau, MD,2 Miguel Palencia,
MD.2 1Eresa, Hospital La Fe, Valencia, Spain,2Department of Cardiology, Hospital La Fe, Valen-
cia, Spain.
Introduction: Phase contrast (PC) cardiovascular mag-
netic resonance (CMR) sequences allow for the
accurate assessment of aortic stenosis (AS). Currently,
its clinical utility is limited and thus the use of these
sequences is scarce.
Purpose: Our aim was to analyse the results of
this technique in the assessment of AS severity com-
pared to those derived from echocardiography, and also
to evaluate the utility of aortic planimetry in the study
of AS.
Methods: 30 consecutive patients with known
aortic valve disease referred for a CMR study to
assess ascending aorta dimensions between January and
April 2003 were included. The studies were performed
with a General Electric1 CVI (1.5 T) scanner. All of
them underwent Doppler-echocardiography scan within
2 weeks. The study protocol included: 1) multislice
dark blood (SSFSE) sequence in transverse orientation
of the thorax to provide an overview of the
cardiovascular anatomy, 2) FIESTA cine VLA, four -
chamber and short-axis images to measure left
ventricular mass and ejection fraction and 3) vascular
PC sequences in three transverse planes across the
aortic valve from which aortic valve area (AoVA) and
peak velocity (AoPV) were obtained. regurgitant
orifice (RO, mm2) and regurgitant fraction (RF,%)
were obtained. CMR criteria of AS severity: mild if
AoPV<3 m/s, moderate if 3 m/s<AoPV<4 m/s and
severe if AoPV>4 m/s.
Results: Mean age was 65±11 yrs, 21 males. In 11
cases (37%) the aortic valve was bileaflet. Pure aortic
stenosis was found in 6 patients (20%), pure AR in 11
subjects (37%) and both aortic stenosis and regurgita-
tion in another 13 (43%). CMR and Doppler-echocar-
diography showed good concordance in detection of
significant AS (Kappa=0.73, P<0.01). Both methods
showed good correlation for calculation of EF (r=0.73,
p<0.01). CMR allowed for planimetry of the AoVA in
systole (see Table 1).
Conclusions: 1) Vascular phase contrast CMR
sequence is a good method for evaluation of AS
severity, with good concordance with Doppler-echo-
cardiography. 2) CMR planimetry of the aortic valve
Table 1. Raw and indexed LV mass by gender.
Index None Ht Ht2.7 BSA Wt Kvist Kuch
Men 156±29 88±16 33±6.5 76±14 1.8±0.36 2.42±0.43 2.55±0.46
Women 110±20 62±14 30±6.4 63±10 1.6±0.29 2.68±0.51 2.51±0.44
p-value <0.001 <0.001 <0.001 <0.001 <0.005 <0.005 0.45, NS
Table 1. AoVA according to AS severity.
Mild
AS
Moderate
AS
Severe
AS
P
(ANOVA)
AoPV (m/s) <3 3–4 >4 –
AoVA (cm2) 3.2±1 1.6±0.6 1±0.3 <0.001
Poster Abstracts: Clinical MRI—Non-ischemic Acquired Heart Disease 251

ORDER REPRINTS
area provides an objective measurement of AS severity,
it is easy and simple to obtain, and it should be done
routinely in the CMR assessment of aortic stenosis.
371. T2-Weighted Magnetic ResonanceImaging Detects Myocardial Edema inAcute Myocarditis
Ralf Wassmuth, Philipp Boye, Daniel Messroghli,
Rainer Dietz, Matthias G. Friedrich. Franz-Volhard-
Clinic, Humboldt-University Berlin, Berlin, Germany.
Introduction: Myocardial edema is a feature of tissue
inflammation. Whereas contrast-enhanced cardiac mag-
netic resonance imaging (CMR) is known to detect
acute myocarditis, the diagnostic value of non-contrast
CMR approaches such as T2-weighted imaging to
visualize myocardial edema is not well defined.
Purpose: We assessed the signal intensity in
T2-weighted images of patients with clinically proven
myocarditis.
Methods: We scanned 42 healthy volunteers (18–
46 years) using the body coil of a 1.5 T clinical scanner.
A normal history, physical examination, ECG and echo
ruled out cardiac disease. They were compared to 23
patients (16–51 years) with acute myocarditis (defined
by acute onset of heart failure, history of infection,
positive troponin, increased CRP or WBC, ECG-
changes, normal angiography, no infarction scar in
delayed enhancement). We acquired 2 short axis slices
with a breathhold triple-inversion-T2-weighted black
blood fast spin echo sequence (TR=2RR, TE 6,4 ms, TI
140 ms, Matrix 256�256, FOV 38 cm).Two indepen-
dent observers read the images in random order blinded
to subject identity and history. We measured signal
intensity in myocardium and skeletal muscle in the same
image and calculated a ratio to adjust for effects related
to heart rate. The results were given in mean±standard
deviation and compared using student’s t-test.
Results: Skeletal muscle signal intensity did not
differ between patients and controls (38±10 vs. 38±7
p=ns), whereas myocardial signal intensity was higher
in acute myocarditis than in controls (78±26 vs.
62±19, p<0.01). The mean ratio of myocardial over
skeletal muscle signal intensity was 2.2±0,8 in patients
versus 1.7±0,6 in controls (p=0.01). The correlation
coefficient for interobserver variability was r=0.67.
Conclusions: Mean myocardial signal intensity is
increased in acute myocarditis as compared to controls.
It may have potential to corroborate the diagnosis. Due
to considerable variability, it seems useful only as an
additional but not as the sole parameter to establish the
diagnosis of acute myocarditis.
372. Clinical Value of Cardiovascular MagneticResonance in the Diagnostic Workup of Patientswith Suspicion of Arrhythmogenic RightVentricular Dysplasia
Juan Sanchez-Rubio, MD, Francesc Carreras, MD,
Ruben Leta, Eva Guillaumet, Sandra Pujadas, Xavier
Vinolas, Guillem Pons-Llado. Cardiology, Hospital
Sant Pau, Barcelona, Spain.
Purpose: Retrospective analysis of the usefulness of
Cardiovascular Magnetic Resonance (CMR) in the
assessment of patients with clinical suspicion of
arrhythmogenic right ventricular dysplasia (ARVD).
Methods: CMR studies were reviewed from 46
consecutive patients (25 men aged 11–73; mean: 41
years) submitted to rule out ARVD. All exams
included transaxial Spin-Echo T1w sequences for the
assessment of fatty infiltration of the right ventricular
(RV) wall, and Cine-MR Gradient-Echo sequences on
longitudinal and short-axis planes of the heart for
morphological and functional studies of the RV. Ab-
normal CMR findings were classified according to the
general imaging criteria for the diagnosis of ARVD:
Major Criteria (MC): 1) severe global dilation and
reduction of ejection fraction (EF) of the RV, with
preserved left ventricular (LV) EF, 2) localized
aneurysm of the RV wall, 3) severe segmental dilation
of the RV, 4) fatty infiltration of the RV wall;
Minor criteria (mC): 1) mild global dilation and re-
duction of EF of the RV with preserved LVEF,
2) mild segmental dilation of the RV; 3) segmental
RV wall hypokinesia.
Results: All CM studies were considered as inter-
pretable. A normal exam was reported in 22 patients
(48%), while in 24 (52%) some abnormal finding was
present, either a MC or a mC, or both: 6 patients
presented with 1 mC, 5 had 2 mC, 10 patients had 1
MC, 2 exhibited 1 MC+2 mC, and 1 patient had 2
MC+3 mC. Among the whole study group of 46
patients, only 5 were finally diagnosed of ARVD from
clinical and electrophysiological data, all of them
presenting with at least 1 MC on CMR. Fatty infiltration
was observed in 9 patients on the whole group, being an
252 Poster Abstracts: Clinical MRI—Non-ischemic Acquired Heart Disease

ORDER REPRINTS
isolate finding in 6 of them while in 3 it was associated
to RV wall systolic dysfunction, these later 3 patients
corresponding to the group with confirmed ARVD.
Conclusions: 1) CMR exams can be performed by
means of a simple study protocol in patients with
suspicion of ARVD, which is readily interpretable in
100% of cases. 2) Normal studies are found in 48%
percent of such patients, wich permits to rule out the
diagnosis. 3) Only in 21% of patients with abnormal
CMR findings the clinical diagnosis of ARVD is
finally confirmed, all of them presenting, however,
with at least 1 MC at the CMR study. 4) The presence
of fatty infiltration of the RV wall does not mean per
se the presence of ARVD unless when associated with
segmental abnormalites of the RV function.
373. Assessment of Pulmonary Vein Anatomyby High Resolution 3D-MRA Prior to and AfterHigh Frequency Ablation or Isolation
Andreas Tausig, MD,1 Karin Schreiber, MD,2 Hubertus
Buelow, MD,2 Martin Karch, MD,3 Carl Ganter, PhD,1
Ernst Rummeny, MD, PhD.1 1Dept. of Radiology, TU-
Munich, Muenchen (Munich), Germany, 2Dept. of
Nuclear Medicine, TU-Munich, Muenchen (Munich),
Germany, 3I. Med. Clinic, TU-Munich, Muenchen
(Munich), Germany.
Introduction: Pulmonary vein (PV) isolation is an
effective procedure to cure resistant atrial fibrillation,
but it may lead to PV-stenoses after treatment. Because
of the large interindividual vatiation in PV-anatomy it
is important to know the exact anatomical situation for
optimal planning of this invasive procedure.
Purpose: Thus the purpose of this study was to
evaluate if a high-resolution 3D-MRA can reproducibly
identitfy PV-anatomy and detect iatrogenic stenosis
after treatment.
Methods: Ten patients (3f, 7m; 53±7,8 yrs) were
examined prior to PV-intervention and 3 pts (1f, 2m;
58±6,5 yrs) afterwards. MR imaging was performed at
a 1.5 T (Sonata, Siemens) using a contrast enhanced
(Magnevist 0.2 mmol/kg at 3 ml/s) breath-hold
FLASH-3D-MRA pulse sequence (GRAPPA, Voxel
size 1.0�0.8�1.0 mm; TA 16 s). Conventional PV-
angiography served as a standard in all pts. Three
independent and with respect to the results of the PV-
angiograms blinded readers (R1, R2, R3) evaluated the
3D-MRA with a dedicated software package. Number
of PV-ostia, number and location of PV-stenoses and
the maximal diameters of the PV were reported.
Results: The 7 known PV-stenoses in 3 pts were
properly identified by all readers. Two of the three
observers detected the same number of PV-ostia (2�3
ostia, 10�4, 1�5); one observer judged an early
branching of a PV as two separate ostia (2�3 ostia,
9�4, 2�5). Normal anatomic variations of the PV
were called stenotic by R1 in 1 pt, by R2 in 2 pts and
by R3 in 3 pts prior to intervention. Compared to the
upper PVs, the measured mean diameters of the lower
PVs were smaller. Upper PV: R1 1.7 cm, range 1.4–
2.3 cm; R2: 1.9 cm, range 1.5–2.4 cm; R3: 1.7 cm,
range 1.3–2.1 cm. The mean difference among them
was calculated to be 0.3±0.1 cm, range 0.2–0.4 cm.
Conclusions: Contrast-enhanced high-resolution
3D-MRA is an adequate technique to visualize PV-
anatomy. Furthermore it is a reliable tool to depict
iatrogenic stenoses after high frequency isolation or
ablation. The number of false positive stenotic findings
stresses the need for serial MRAs, prior and after this
treatment, in order to differentiate physiologic narrow-
ing of a vessel from an iatrogenic stenosis.
Poster Abstracts: Clinical MRI—Non-ischemic Acquired Heart Disease 253

Request Permission/Order Reprints
Reprints of this article can also be ordered at
http://www.dekker.com/servlet/product/DOI/101081JCMR120028314
Request Permission or Order Reprints Instantly!
Interested in copying and sharing this article? In most cases, U.S. Copyright Law requires that you get permission from the article’s rightsholder before using copyrighted content.
All information and materials found in this article, including but not limited to text, trademarks, patents, logos, graphics and images (the "Materials"), are the copyrighted works and other forms of intellectual property of Marcel Dekker, Inc., or its licensors. All rights not expressly granted are reserved.
Get permission to lawfully reproduce and distribute the Materials or order reprints quickly and painlessly. Simply click on the "Request Permission/ Order Reprints" link below and follow the instructions. Visit the U.S. Copyright Office for information on Fair Use limitations of U.S. copyright law. Please refer to The Association of American Publishers’ (AAP) website for guidelines on Fair Use in the Classroom.
The Materials are for your personal use only and cannot be reformatted, reposted, resold or distributed by electronic means or otherwise without permission from Marcel Dekker, Inc. Marcel Dekker, Inc. grants you the limited right to display the Materials only on your personal computer or personal wireless device, and to copy and download single copies of such Materials provided that any copyright, trademark or other notice appearing on such Materials is also retained by, displayed, copied or downloaded as part of the Materials and is not removed or obscured, and provided you do not edit, modify, alter or enhance the Materials. Please refer to our Website User Agreement for more details.


![Cancer really sucks_-_v6[1]](https://img.pdfslide.us/doc/110x75/54ba23b84a7959742c8b46bb/cancer-really-sucks-v61.jpg)
