Embed Size (px)
Citation preview
0
POSTAL AND TELECOMMUNICATIONS
REGULATORY AUTHORITY OF
ZIMBABWE
(POTRAZ)
ABRIDGED ANNUAL POSTAL AND
TELECOMMUNICATIONS SECTOR
PERFORMANCE REPORT
2017
Disclaimer:
This report has been prepared based on data provided by service providers. The information
provided in this quarterly report is subject to alteration in case of any revisions or updates
from the service providers. Although every effort has been made to ensure accuracy of the data
contained in this report, the Authority is not liable for the inaccuracy of any information.
1
TABLE OF CONTENTS 1. EXECUTIVE SUMMARY ................................................................................................... 4
2. SUBSCRIPTIONS ................................................................................................................. 7
2.1 MOBILE SUBSCRIPTIONS ........................................................................................... 7
2.2 FIXED TELEPHONY SUBSCRIPTIONS ...................................................................... 9
2.3 DATA & INTERNET SUBSCRIPTIONS .................................................................... 10
3. PENETRATION RATES .................................................................................................... 12
3.1 FIXED TELEDENSITY ................................................................................................ 12
3.2 MOBILE PENETRATION RATE................................................................................. 12
3.3 INTERNET PENETRATION RATE ............................................................................ 13
4. TRAFFIC AND USAGE PATTERNS ................................................................................ 14
4.1 VOICE TRAFFIC .......................................................................................................... 14
4.2 INTERNET & DATA TRAFFIC ................................................................................... 16
4.3 POSTAL & COURIER VOLUMES .............................................................................. 17
5. REVENUES & INVESTMENT .......................................................................................... 19
5.1 MOBILE......................................................................................................................... 19
5.3 IAP REVENUES & INVESTMENT ............................................................................. 20
6. MOBILE MONEY ........................................................................................................... 21
6.1 SUBSCRIPTIONS ......................................................................................................... 21
6.2 MOBILE MONEY AGENTS ........................................................................................ 22
6.3 VALUE OF TRANSACTIONS ..................................................................................... 23
7. TELECOMMUNICATIONS INFRASTRUCTURE .......................................................... 24
7.1 MOBILE BASE STATIONS ......................................................................................... 24
7.2 NATIONAL BACKBONE FIBRE LENGTH................................................................... 26
8. INTERNATIONAL INTERNET BANDWIDTH ............................................................... 27
9. EMPLOYMENT .................................................................................................................. 28
9.1 FIXED NETWORK .................................................................................................. 28
9.2 MOBILE NETWORK OPERATORS ........................................................................... 29
9.3 INTERNET ACCESS PROVIDERS ........................................................................ 29
9.4 POSTAL & COURIER ............................................................................................. 30
10. OUTLOOK ........................................................................................................................ 31
2
LIST OF FIGURES
Figure 1: Growth in active mobile subscriptions .................................................................................... 7
Figure 2: Market share of mobile subscribers ......................................................................................... 8
Figure 3: Fixed Telephone Subscriptions ............................................................................................... 9
Figure 4: Internet Subscriptions ............................................................................................................ 11
Figure 5: LTE/4G usage ........................................................................................................................ 11
Figure 6: Fixed Tele-density ................................................................................................................. 12
Figure 7: Mobile penetration rate.......................................................................................................... 13
Figure 8: Internet penetration rate ......................................................................................................... 13
Figure 9: Voice traffic ........................................................................................................................... 14
Figure 10: International traffic .............................................................................................................. 15
Figure 11: Mobile voice traffic market share ........................................................................................ 15
Figure 12: Growth in mobile internet & data usage .............................................................................. 16
Figure 13: Market share of data usage .................................................................................................. 17
Figure 14: Market Share of domestic courier ....................................................................................... 18
Figure 15: Market Share of International Courier................................................................................. 18
Figure 16: Mobile Revenues ................................................................................................................. 19
Figure 17: Growth in IAP revenue ........................................................................................................ 20
Figure 18: Growth of active mobile money subscriptions .................................................................... 22
Figure 19: Mobile Money Agents ......................................................................................................... 23
Figure 20: Airtime, Bill & Merchant Payments .................................................................................... 24
Figure 21: Mobile Base Stations ........................................................................................................... 25
Figure 22: Growth in base stations ....................................................................................................... 25
Figure 23: Market share of mobile base stations .................................................................................. 26
Figure 24: National backbone fibre length ........................................................................................... 26
Figure 25: Equipped international internet bandwidth .......................................................................... 27
Figure 26: Market share of equipped bandwidth capacity .................................................................... 27
Figure 27: Employment by the fixed network ...................................................................................... 28
Figure 28: Employment by mobile operators ....................................................................................... 29
Figure 29: Employment by Internet Access Providers ......................................................................... 30
Figure 30: Postal & Courier employees ................................................................................................ 30
3
LIST OF TABLES
Table 1: Active and Total Mobile Subscriptions ....................................................................... 7
Table 2: Active Mobile Subscriptions per Operator .................................................................. 8
Table 3: Fixed telephone lines by location ................................................................................ 9
Table 4: Active Internet subscriptions ..................................................................................... 10
Table 5: Postal & Courier Volumes ......................................................................................... 17
Table 6: Mobile Revenues, Investment & Costs ..................................................................... 19
Table 7: IAP Revenues & Investment ..................................................................................... 20
Table 8: IAP Revenues Market Share ...................................................................................... 21
Table 9: Active mobile money subscriptions........................................................................... 22
Table 10: Value of mobile money transactions ....................................................................... 23
LIST OF ACRONYMS
ARPU…................................Average Revenue per User
ACPU…................................Average Cost per User
AMPU……………………...Average Margin per User
LTE…………………………Long Term Evolution
3G………..............................Third Generation
2G…………………………...Second Generation
MB…………………………..Megabyte
GB…………………………...Gigabyte
TB……………………………Terabyte
Mbps…………………………Megabits per second
4
1. EXECUTIVE SUMMARY
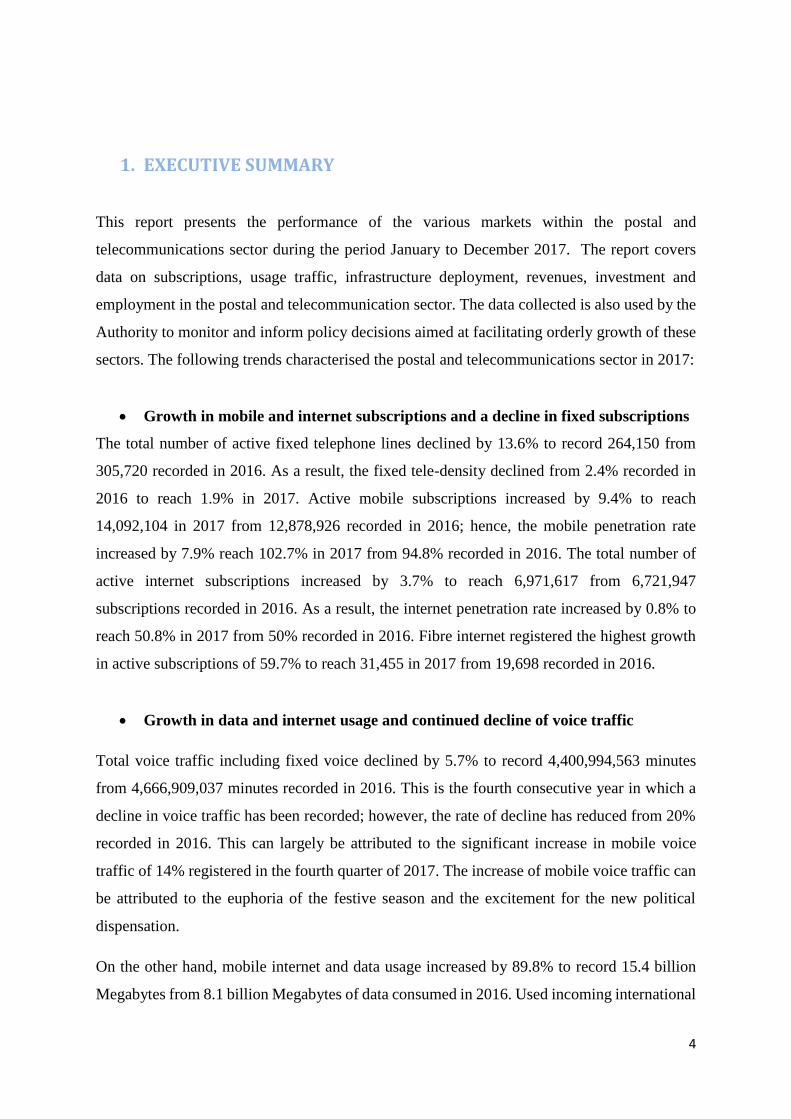
This report presents the performance of the various markets within the postal and
telecommunications sector during the period January to December 2017. The report covers
data on subscriptions, usage traffic, infrastructure deployment, revenues, investment and
employment in the postal and telecommunication sector. The data collected is also used by the
Authority to monitor and inform policy decisions aimed at facilitating orderly growth of these
sectors. The following trends characterised the postal and telecommunications sector in 2017:
Growth in mobile and internet subscriptions and a decline in fixed subscriptions
The total number of active fixed telephone lines declined by 13.6% to record 264,150 from
305,720 recorded in 2016. As a result, the fixed tele-density declined from 2.4% recorded in
2016 to reach 1.9% in 2017. Active mobile subscriptions increased by 9.4% to reach
14,092,104 in 2017 from 12,878,926 recorded in 2016; hence, the mobile penetration rate
increased by 7.9% reach 102.7% in 2017 from 94.8% recorded in 2016. The total number of
active internet subscriptions increased by 3.7% to reach 6,971,617 from 6,721,947
subscriptions recorded in 2016. As a result, the internet penetration rate increased by 0.8% to
reach 50.8% in 2017 from 50% recorded in 2016. Fibre internet registered the highest growth
in active subscriptions of 59.7% to reach 31,455 in 2017 from 19,698 recorded in 2016.
Growth in data and internet usage and continued decline of voice traffic
Total voice traffic including fixed voice declined by 5.7% to record 4,400,994,563 minutes
from 4,666,909,037 minutes recorded in 2016. This is the fourth consecutive year in which a
decline in voice traffic has been recorded; however, the rate of decline has reduced from 20%
recorded in 2016. This can largely be attributed to the significant increase in mobile voice
traffic of 14% registered in the fourth quarter of 2017. The increase of mobile voice traffic can
be attributed to the euphoria of the festive season and the excitement for the new political
dispensation.
On the other hand, mobile internet and data usage increased by 89.8% to record 15.4 billion
Megabytes from 8.1 billion Megabytes of data consumed in 2016. Used incoming international
5
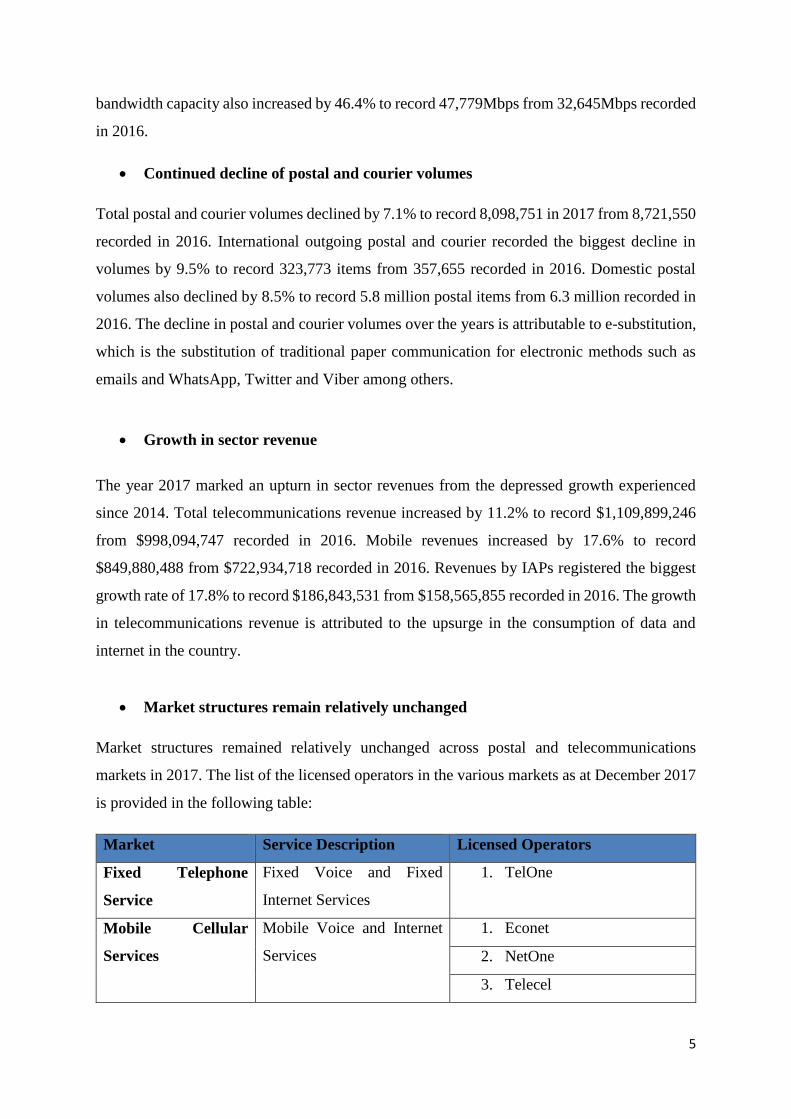
bandwidth capacity also increased by 46.4% to record 47,779Mbps from 32,645Mbps recorded
in 2016.
Continued decline of postal and courier volumes
Total postal and courier volumes declined by 7.1% to record 8,098,751 in 2017 from 8,721,550
recorded in 2016. International outgoing postal and courier recorded the biggest decline in
volumes by 9.5% to record 323,773 items from 357,655 recorded in 2016. Domestic postal
volumes also declined by 8.5% to record 5.8 million postal items from 6.3 million recorded in
2016. The decline in postal and courier volumes over the years is attributable to e-substitution,
which is the substitution of traditional paper communication for electronic methods such as
emails and WhatsApp, Twitter and Viber among others.
Growth in sector revenue
The year 2017 marked an upturn in sector revenues from the depressed growth experienced
since 2014. Total telecommunications revenue increased by 11.2% to record $1,109,899,246
from $998,094,747 recorded in 2016. Mobile revenues increased by 17.6% to record
$849,880,488 from $722,934,718 recorded in 2016. Revenues by IAPs registered the biggest
growth rate of 17.8% to record $186,843,531 from $158,565,855 recorded in 2016. The growth
in telecommunications revenue is attributed to the upsurge in the consumption of data and
internet in the country.
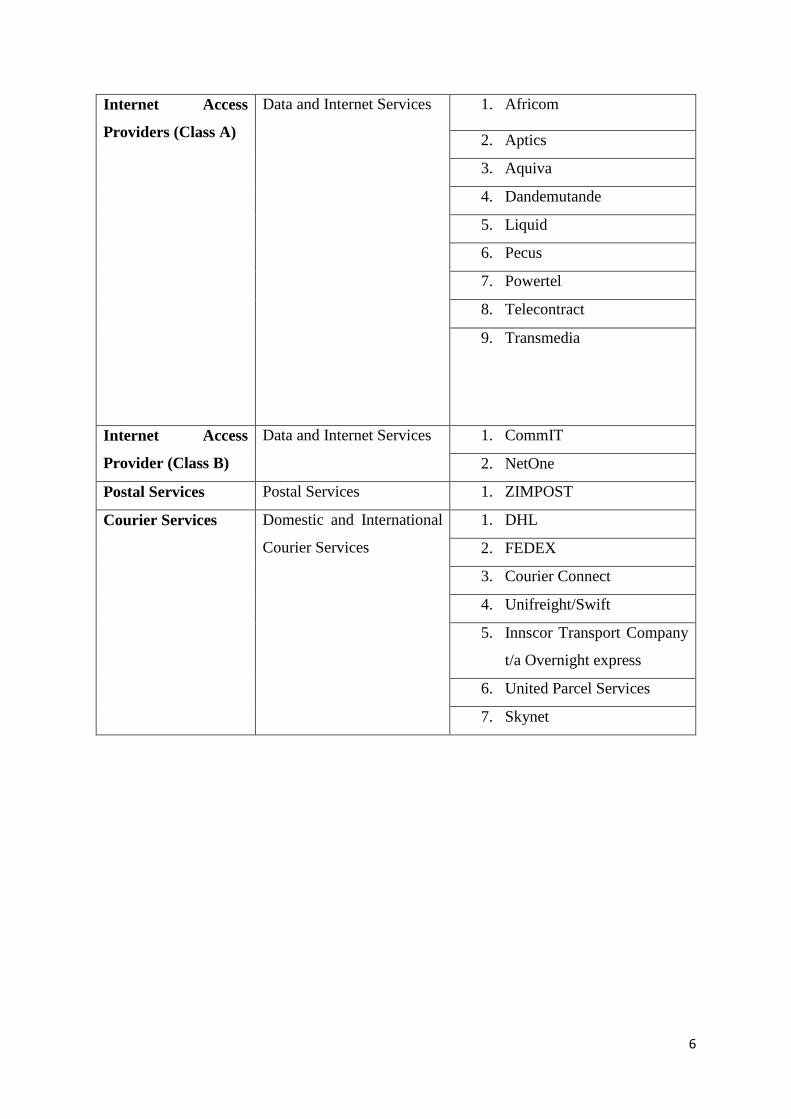
Market structures remain relatively unchanged
Market structures remained relatively unchanged across postal and telecommunications
markets in 2017. The list of the licensed operators in the various markets as at December 2017
is provided in the following table:
Market Service Description Licensed Operators
Fixed Telephone
Service
Fixed Voice and Fixed
Internet Services
1. TelOne
Mobile Cellular
Services
Mobile Voice and Internet
Services
1. Econet
2. NetOne
3. Telecel
6
Internet Access
Providers (Class A)
Data and Internet Services 1. Africom
2. Aptics
3. Aquiva
4. Dandemutande
5. Liquid
6. Pecus
7. Powertel
8. Telecontract
9. Transmedia
Internet Access
Provider (Class B)
Data and Internet Services 1. CommIT
2. NetOne
Postal Services Postal Services 1. ZIMPOST
Courier Services Domestic and International
Courier Services
1. DHL
2. FEDEX
3. Courier Connect
4. Unifreight/Swift
5. Innscor Transport Company
t/a Overnight express
6. United Parcel Services
7. Skynet
7
2. SUBSCRIPTIONS
2.1 MOBILE SUBSCRIPTIONS
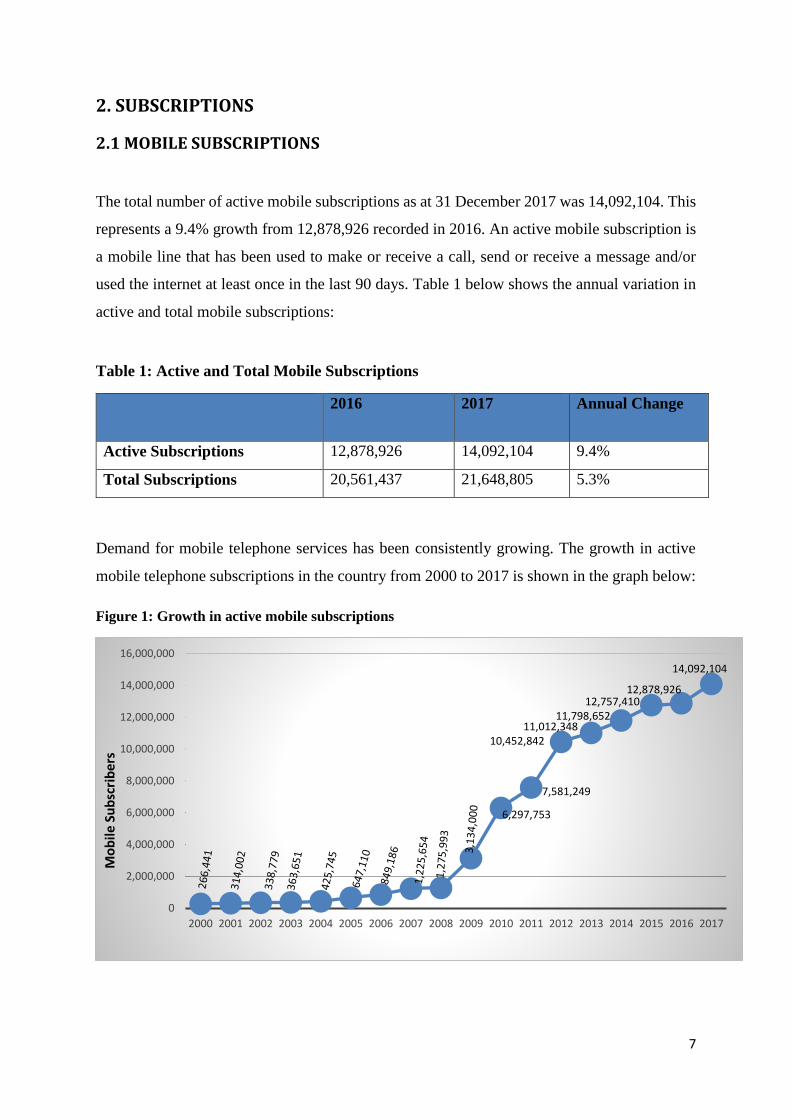
The total number of active mobile subscriptions as at 31 December 2017 was 14,092,104. This
represents a 9.4% growth from 12,878,926 recorded in 2016. An active mobile subscription is
a mobile line that has been used to make or receive a call, send or receive a message and/or
used the internet at least once in the last 90 days. Table 1 below shows the annual variation in
active and total mobile subscriptions:
Table 1: Active and Total Mobile Subscriptions
2016 2017 Annual Change
Active Subscriptions 12,878,926 14,092,104 9.4%
Total Subscriptions 20,561,437 21,648,805 5.3%
Demand for mobile telephone services has been consistently growing. The growth in active
mobile telephone subscriptions in the country from 2000 to 2017 is shown in the graph below:
Figure 1: Growth in active mobile subscriptions
0
2,000,000
4,000,000
6,000,000
8,000,000
10,000,000
12,000,000
14,000,000
16,000,000
2000 2001 2002 2003 2004 2005 2006 2007 2008 2009 2010 2011 2012 2013 2014 2015 2016 2017
6,297,753
7,581,249
10,452,84211,012,348
11,798,65212,757,410
Mo
bile
Su
bsc
rib
ers
14,092,104
12,878,926
8
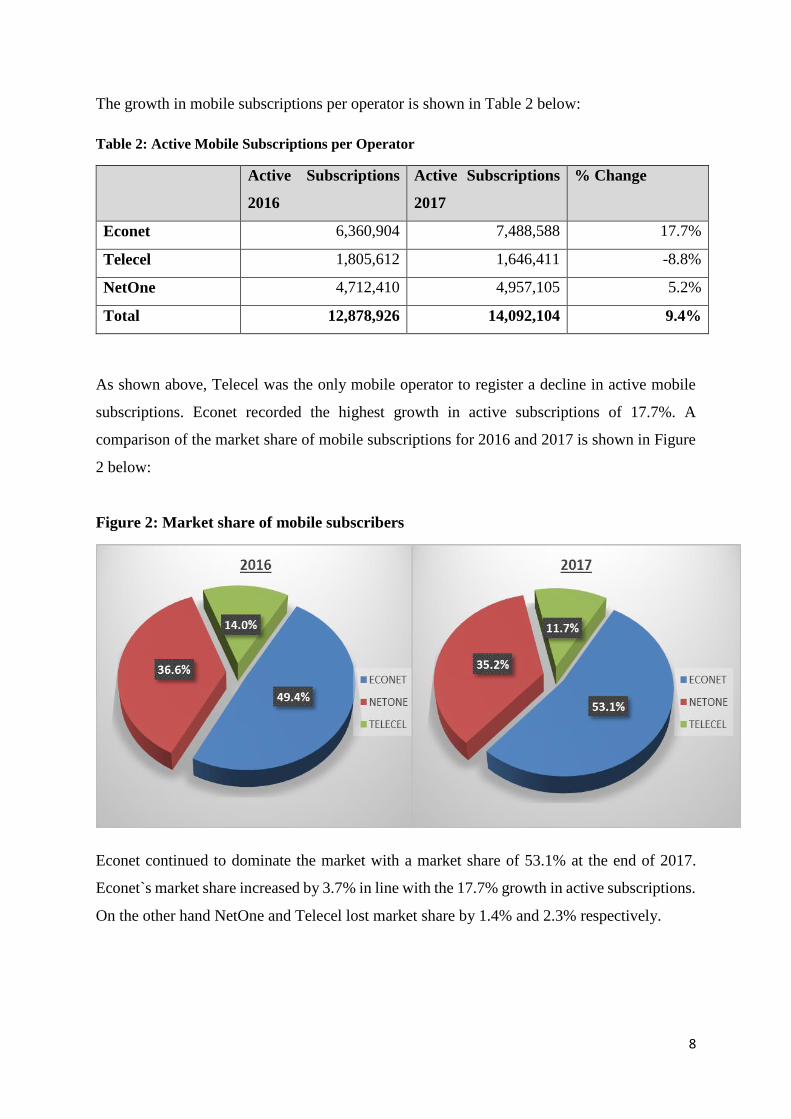
The growth in mobile subscriptions per operator is shown in Table 2 below:
Table 2: Active Mobile Subscriptions per Operator
Active Subscriptions
2016
Active Subscriptions
2017
% Change
Econet 6,360,904 7,488,588 17.7%
Telecel 1,805,612 1,646,411 -8.8%
NetOne 4,712,410 4,957,105 5.2%
Total 12,878,926 14,092,104 9.4%
As shown above, Telecel was the only mobile operator to register a decline in active mobile
subscriptions. Econet recorded the highest growth in active subscriptions of 17.7%. A
comparison of the market share of mobile subscriptions for 2016 and 2017 is shown in Figure
2 below:
Figure 2: Market share of mobile subscribers
Econet continued to dominate the market with a market share of 53.1% at the end of 2017.
Econet`s market share increased by 3.7% in line with the 17.7% growth in active subscriptions.
On the other hand NetOne and Telecel lost market share by 1.4% and 2.3% respectively.
9
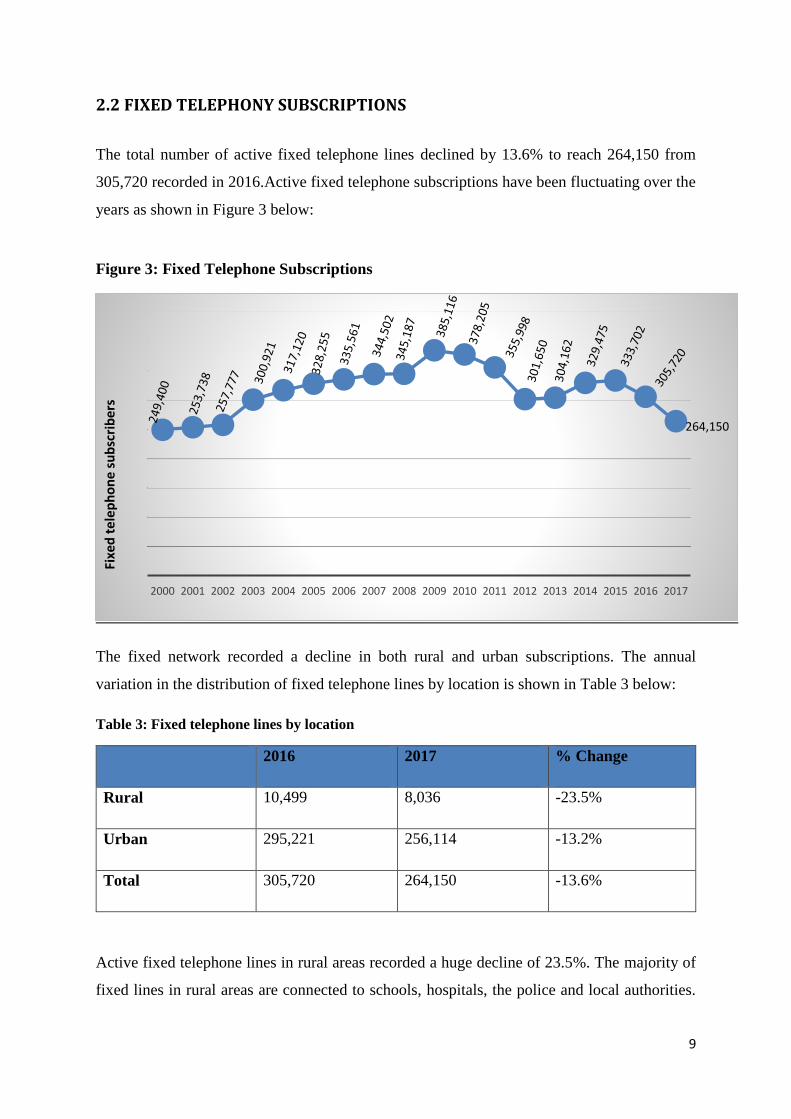
2.2 FIXED TELEPHONY SUBSCRIPTIONS
The total number of active fixed telephone lines declined by 13.6% to reach 264,150 from
305,720 recorded in 2016.Active fixed telephone subscriptions have been fluctuating over the
years as shown in Figure 3 below:
Figure 3: Fixed Telephone Subscriptions
The fixed network recorded a decline in both rural and urban subscriptions. The annual
variation in the distribution of fixed telephone lines by location is shown in Table 3 below:
Table 3: Fixed telephone lines by location
2016 2017 % Change
Rural 10,499 8,036 -23.5%
Urban 295,221 256,114 -13.2%
Total 305,720 264,150 -13.6%
Active fixed telephone lines in rural areas recorded a huge decline of 23.5%. The majority of
fixed lines in rural areas are connected to schools, hospitals, the police and local authorities.
2000 2001 2002 2003 2004 2005 2006 2007 2008 2009 2010 2011 2012 2013 2014 2015 2016 2017
Fixe
d t
ele
ph
on
e s
ub
scri
ber
s
264,150
10
The decline could be attributed to the increasing number of institutions adopting mobile
numbers and VoIP numbers.
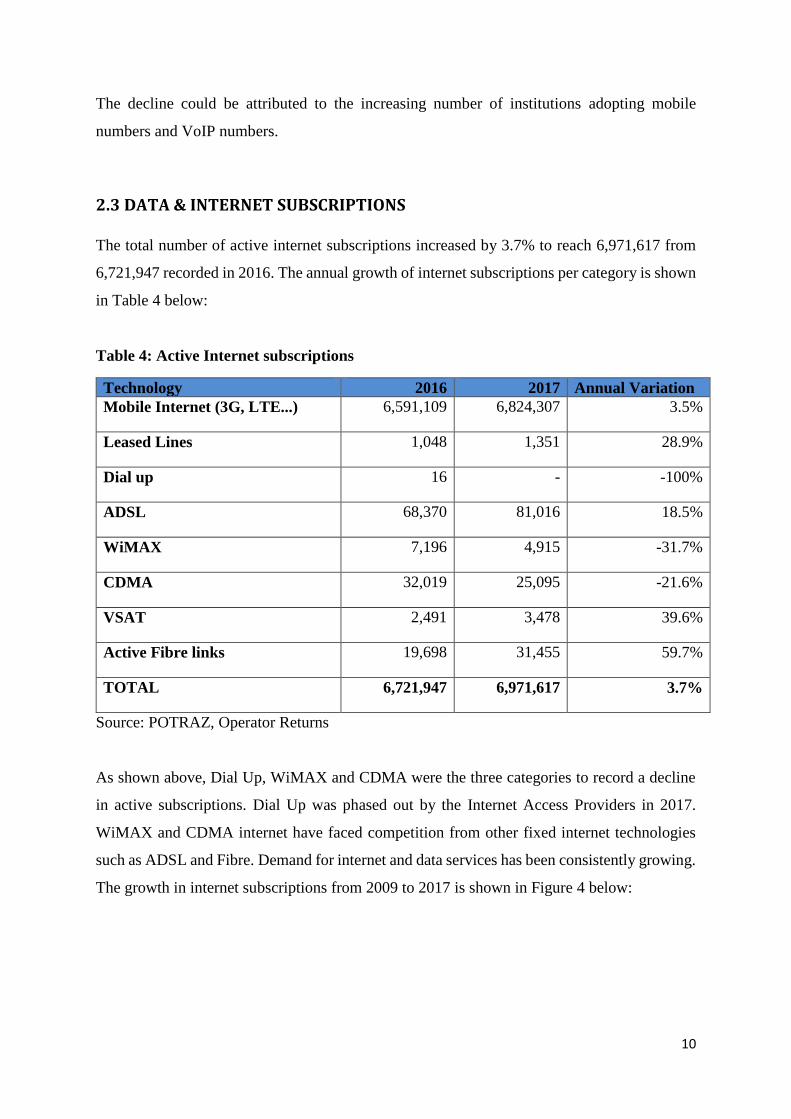
2.3 DATA & INTERNET SUBSCRIPTIONS
The total number of active internet subscriptions increased by 3.7% to reach 6,971,617 from
6,721,947 recorded in 2016. The annual growth of internet subscriptions per category is shown
in Table 4 below:
Table 4: Active Internet subscriptions
Technology 2016 2017 Annual Variation
Mobile Internet (3G, LTE...) 6,591,109 6,824,307 3.5%
Leased Lines 1,048 1,351 28.9%
Dial up 16 - -100%
ADSL 68,370 81,016 18.5%
WiMAX 7,196 4,915 -31.7%
CDMA 32,019 25,095 -21.6%
VSAT 2,491 3,478 39.6%
Active Fibre links 19,698 31,455 59.7%
TOTAL 6,721,947 6,971,617 3.7%
Source: POTRAZ, Operator Returns
As shown above, Dial Up, WiMAX and CDMA were the three categories to record a decline
in active subscriptions. Dial Up was phased out by the Internet Access Providers in 2017.
WiMAX and CDMA internet have faced competition from other fixed internet technologies
such as ADSL and Fibre. Demand for internet and data services has been consistently growing.
The growth in internet subscriptions from 2009 to 2017 is shown in Figure 4 below:
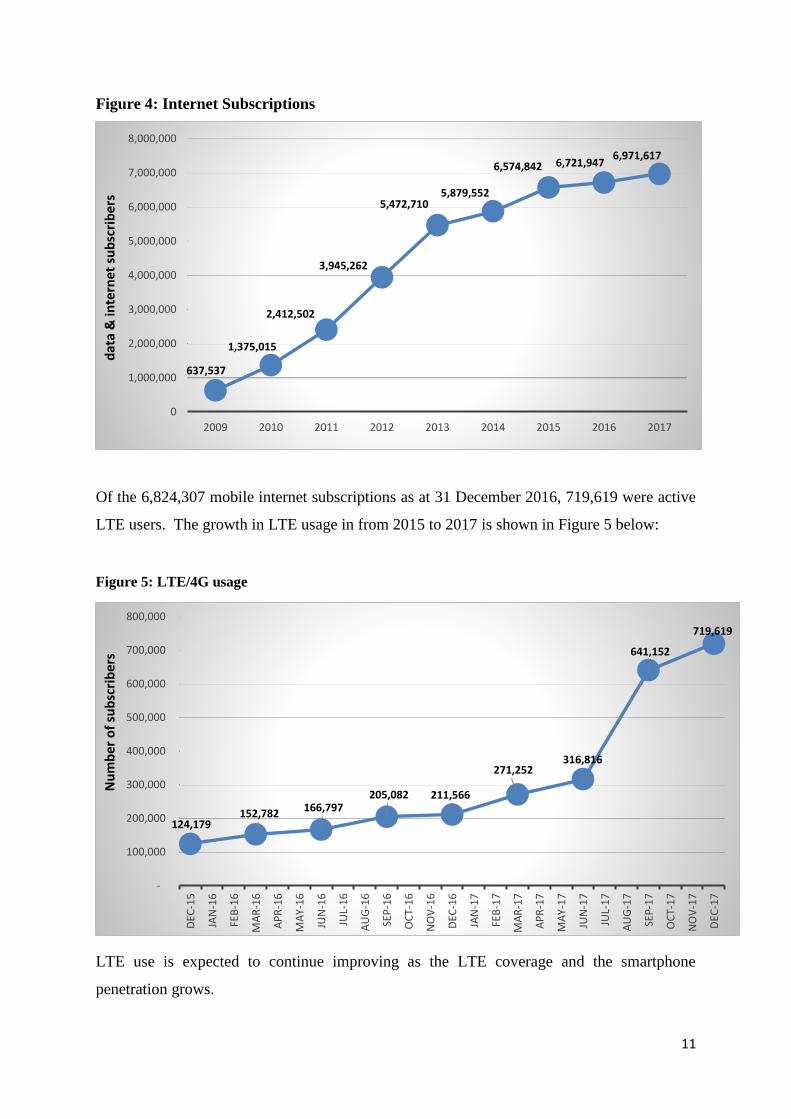
11
Figure 4: Internet Subscriptions
Of the 6,824,307 mobile internet subscriptions as at 31 December 2016, 719,619 were active
LTE users. The growth in LTE usage in from 2015 to 2017 is shown in Figure 5 below:
Figure 5: LTE/4G usage
LTE use is expected to continue improving as the LTE coverage and the smartphone
penetration grows.
637,537
1,375,015
2,412,502
3,945,262
5,472,7105,879,552
6,574,842 6,721,9476,971,617
0
1,000,000
2,000,000
3,000,000
4,000,000
5,000,000
6,000,000
7,000,000
8,000,000
2009 2010 2011 2012 2013 2014 2015 2016 2017
dat
a &
inte
rnet
su
bsc
rib
ers
124,179 152,782 166,797
205,082 211,566
271,252 316,816
641,152
719,619
-
100,000
200,000
300,000
400,000
500,000
600,000
700,000
800,000
DEC
-15
JAN
-16
FEB
-16
MA
R-1
6
AP
R-1
6
MA
Y-1
6
JUN
-16
JUL-
16
AU
G-1
6
SEP
-16
OC
T-1
6
NO
V-1
6
DEC
-16
JAN
-17
FEB
-17
MA
R-1
7
AP
R-1
7
MA
Y-1
7
JUN
-17
JUL-
17
AU
G-1
7
SEP
-17
OC
T-1
7
NO
V-1
7
DEC
-17
Nu
mb
ero
f su
bsc
rib
ers
12
3. PENETRATION RATES
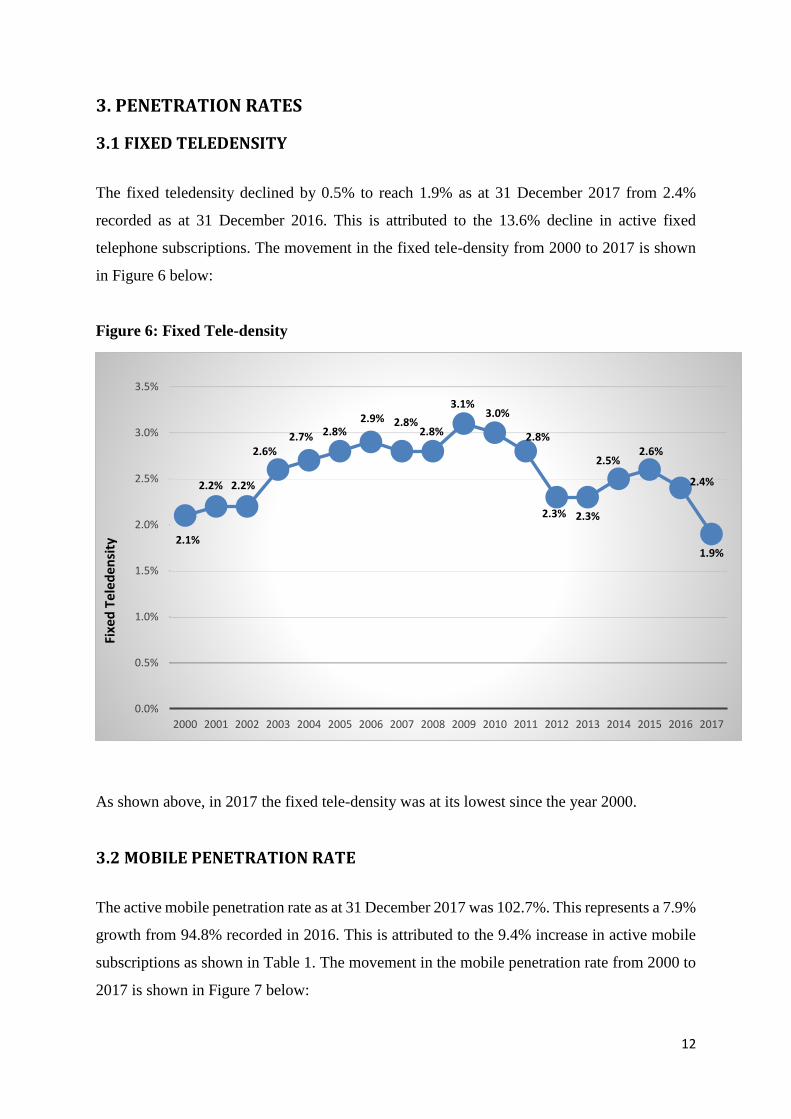
3.1 FIXED TELEDENSITY
The fixed teledensity declined by 0.5% to reach 1.9% as at 31 December 2017 from 2.4%
recorded as at 31 December 2016. This is attributed to the 13.6% decline in active fixed
telephone subscriptions. The movement in the fixed tele-density from 2000 to 2017 is shown
in Figure 6 below:
Figure 6: Fixed Tele-density
As shown above, in 2017 the fixed tele-density was at its lowest since the year 2000.
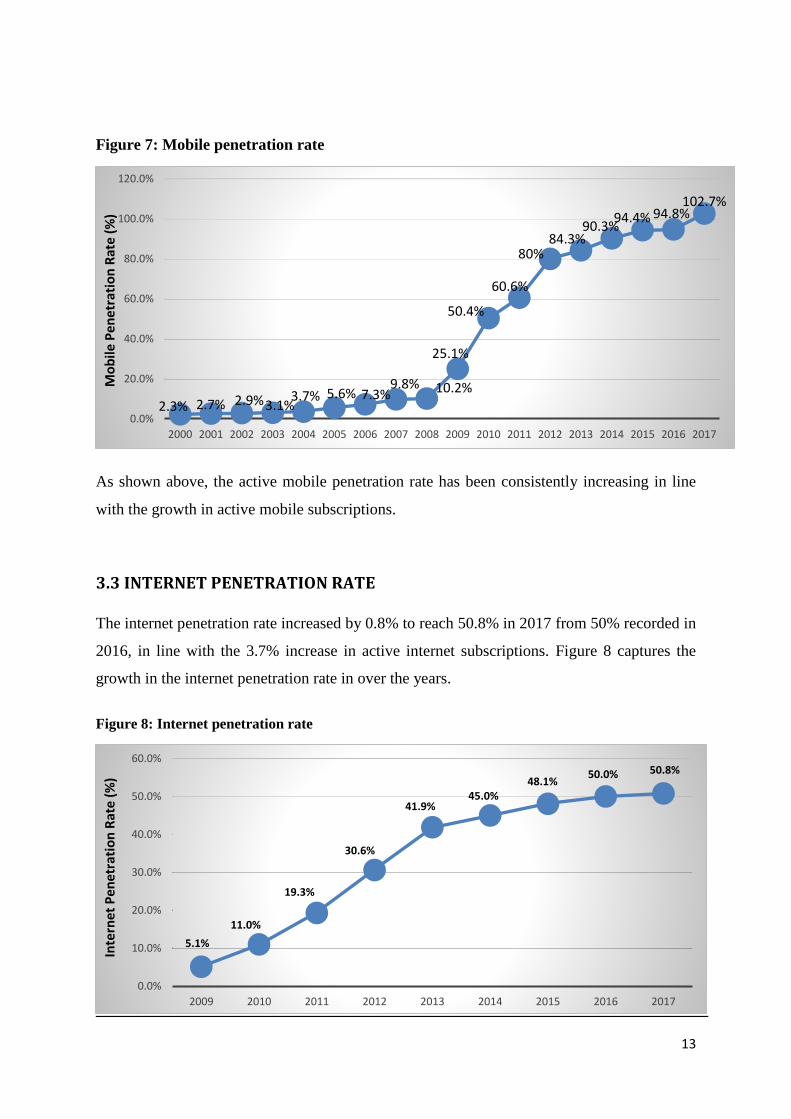
3.2 MOBILE PENETRATION RATE
The active mobile penetration rate as at 31 December 2017 was 102.7%. This represents a 7.9%
growth from 94.8% recorded in 2016. This is attributed to the 9.4% increase in active mobile
subscriptions as shown in Table 1. The movement in the mobile penetration rate from 2000 to
2017 is shown in Figure 7 below:
2.1%
2.2% 2.2%
2.6%2.7% 2.8%
2.9% 2.8%2.8%
3.1%3.0%
2.8%
2.3% 2.3%
2.5%2.6%
2.4%
1.9%
0.0%
0.5%
1.0%
1.5%
2.0%
2.5%
3.0%
3.5%
2000 2001 2002 2003 2004 2005 2006 2007 2008 2009 2010 2011 2012 2013 2014 2015 2016 2017
Fixe
d T
ele
de
nsi
ty
13
Figure 7: Mobile penetration rate
As shown above, the active mobile penetration rate has been consistently increasing in line
with the growth in active mobile subscriptions.
3.3 INTERNET PENETRATION RATE
The internet penetration rate increased by 0.8% to reach 50.8% in 2017 from 50% recorded in
2016, in line with the 3.7% increase in active internet subscriptions. Figure 8 captures the
growth in the internet penetration rate in over the years.
Figure 8: Internet penetration rate
0.0%
20.0%
40.0%
60.0%
80.0%
100.0%
120.0%
2000 2001 2002 2003 2004 2005 2006 2007 2008 2009 2010 2011 2012 2013 2014 2015 2016 2017
94.4%90.3%
84.3%80%
60.6%
50.4%
25.1%
10.2%
2.3% 2.7% 2.9%3.1%3.7% 5.6% 7.3%
9.8%Mo
bile
Pe
net
rati
on
Rat
e (
%) 94.8%
102.7%
5.1%
11.0%
19.3%
30.6%
41.9%45.0%
48.1%50.0% 50.8%
0.0%
10.0%
20.0%
30.0%
40.0%
50.0%
60.0%
2009 2010 2011 2012 2013 2014 2015 2016 2017
Inte
rnet
Pe
net
rati
on
Rat
e (
%)
14
As shown in Figure 8 above, the internet penetration rate has been consistently increasing in
line with the growing number of active internet and data subscriptions. Demand for internet
and data services in the country is expected to continue growing as the internet coverage,
variety of services and the availability and accessibility of devices improves.
4. TRAFFIC AND USAGE PATTERNS
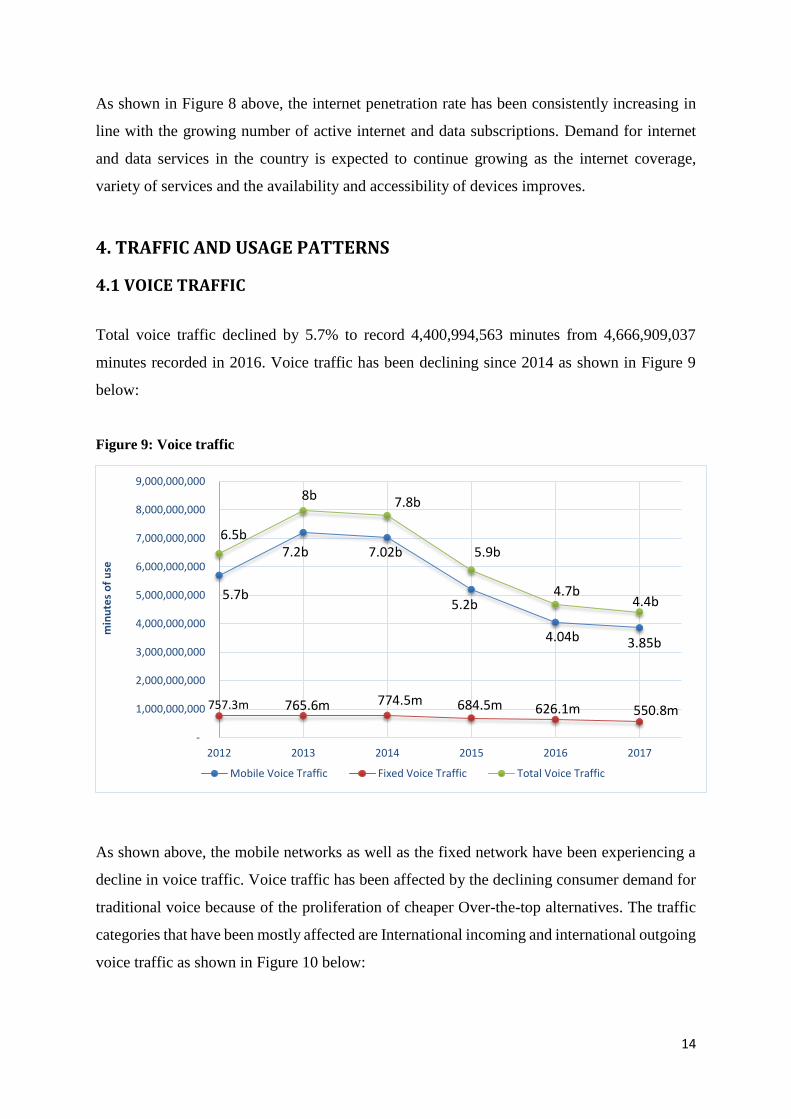
4.1 VOICE TRAFFIC
Total voice traffic declined by 5.7% to record 4,400,994,563 minutes from 4,666,909,037
minutes recorded in 2016. Voice traffic has been declining since 2014 as shown in Figure 9
below:
Figure 9: Voice traffic
As shown above, the mobile networks as well as the fixed network have been experiencing a
decline in voice traffic. Voice traffic has been affected by the declining consumer demand for
traditional voice because of the proliferation of cheaper Over-the-top alternatives. The traffic
categories that have been mostly affected are International incoming and international outgoing
voice traffic as shown in Figure 10 below:
-
1,000,000,000
2,000,000,000
3,000,000,000
4,000,000,000
5,000,000,000
6,000,000,000
7,000,000,000
8,000,000,000
9,000,000,000
2012 2013 2014 2015 2016 2017
min
ute
s o
f u
se
Mobile Voice Traffic Fixed Voice Traffic Total Voice Traffic
4.4b 4.7b
5.9b
7.8b 8b
6.5b
5.7b
7.2b 7.02b
5.2b
4.04b 3.85b
757.3m
765.6m 774.5m 684.5m 626.1m 550.8m
15
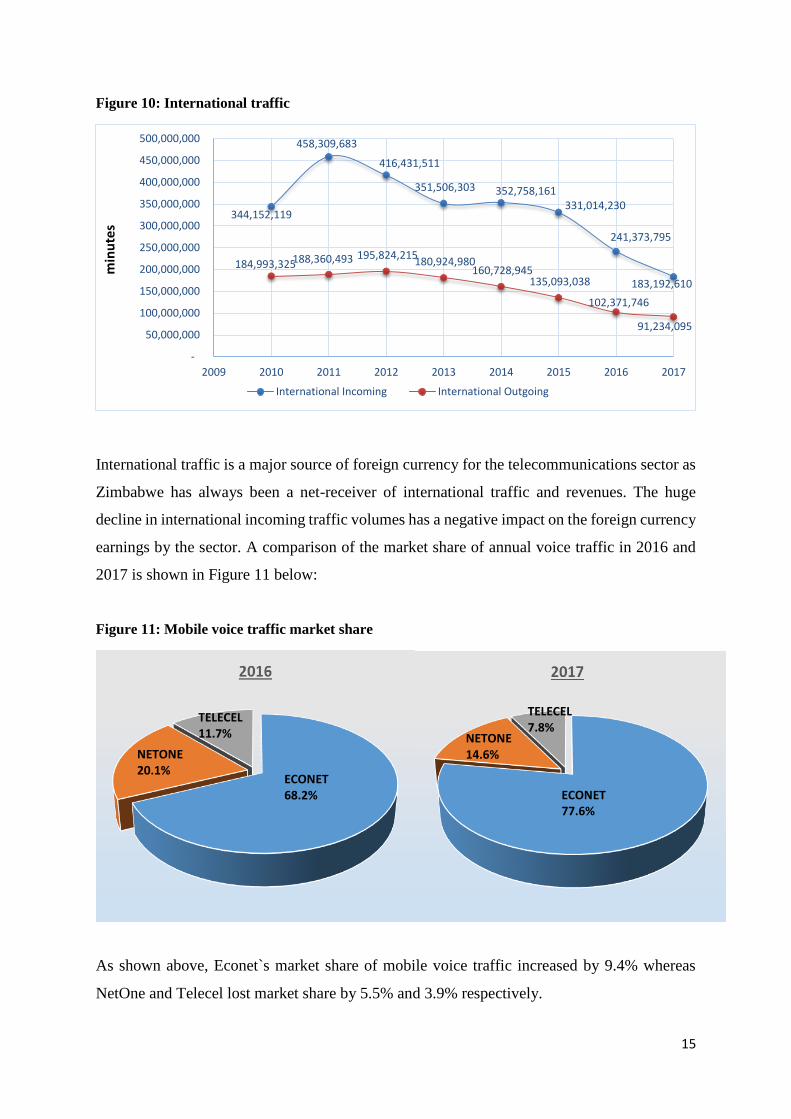
Figure 10: International traffic
International traffic is a major source of foreign currency for the telecommunications sector as
Zimbabwe has always been a net-receiver of international traffic and revenues. The huge
decline in international incoming traffic volumes has a negative impact on the foreign currency
earnings by the sector. A comparison of the market share of annual voice traffic in 2016 and
2017 is shown in Figure 11 below:
Figure 11: Mobile voice traffic market share
As shown above, Econet`s market share of mobile voice traffic increased by 9.4% whereas
NetOne and Telecel lost market share by 5.5% and 3.9% respectively.
344,152,119
458,309,683
416,431,511
351,506,303 352,758,161 331,014,230
241,373,795
183,192,610
184,993,325 188,360,493 195,824,215 180,924,980
160,728,945 135,093,038
102,371,746
91,234,095
-
50,000,000
100,000,000
150,000,000
200,000,000
250,000,000
300,000,000
350,000,000
400,000,000
450,000,000
500,000,000
2009 2010 2011 2012 2013 2014 2015 2016 2017
International Incoming International Outgoing
min
ute
s
ECONET 68.2%
NETONE 20.1%
TELECEL 11.7%
ECONET 77.6%
NETONE 14.6%
TELECEL 7.8%
16
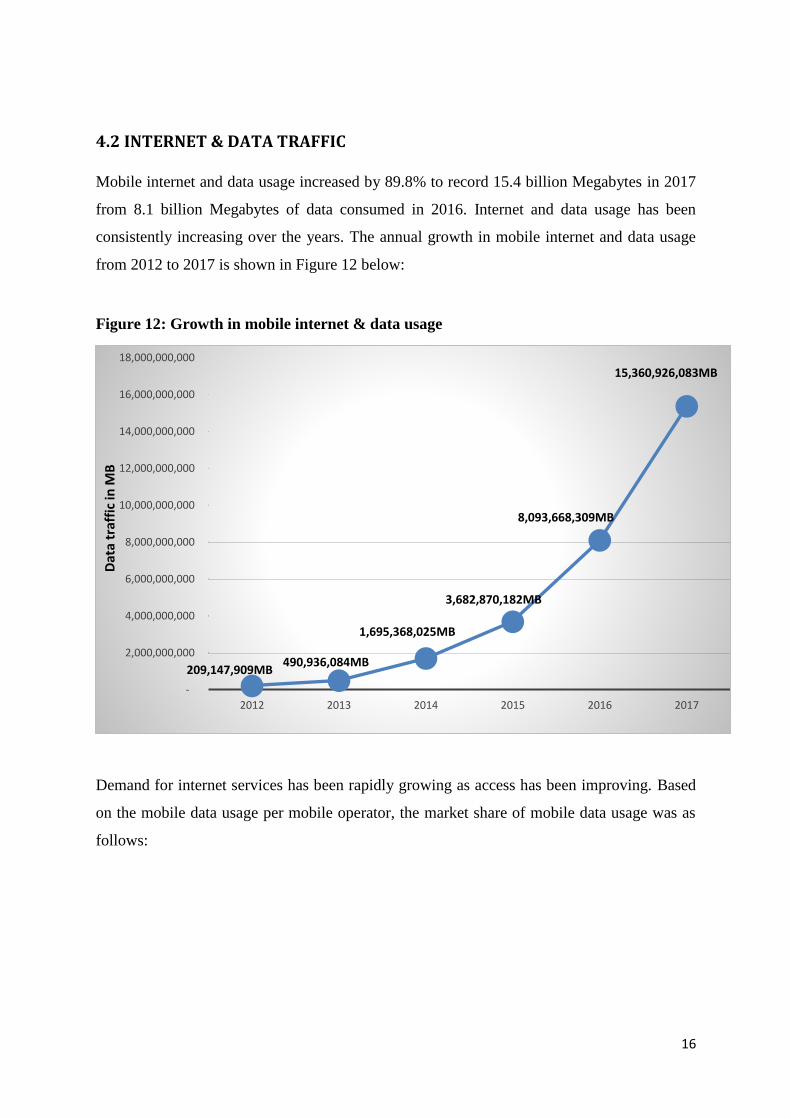
4.2 INTERNET & DATA TRAFFIC
Mobile internet and data usage increased by 89.8% to record 15.4 billion Megabytes in 2017
from 8.1 billion Megabytes of data consumed in 2016. Internet and data usage has been
consistently increasing over the years. The annual growth in mobile internet and data usage
from 2012 to 2017 is shown in Figure 12 below:
Figure 12: Growth in mobile internet & data usage
Demand for internet services has been rapidly growing as access has been improving. Based
on the mobile data usage per mobile operator, the market share of mobile data usage was as
follows:
-
2,000,000,000
4,000,000,000
6,000,000,000
8,000,000,000
10,000,000,000
12,000,000,000
14,000,000,000
16,000,000,000
18,000,000,000
2012 2013 2014 2015 2016 2017
Dat
atr
affi
c in
MB
1,695,368,025MB
490,936,084MB
3,682,870,182MB
8,093,668,309MB
209,147,909MB
15,360,926,083MB
17
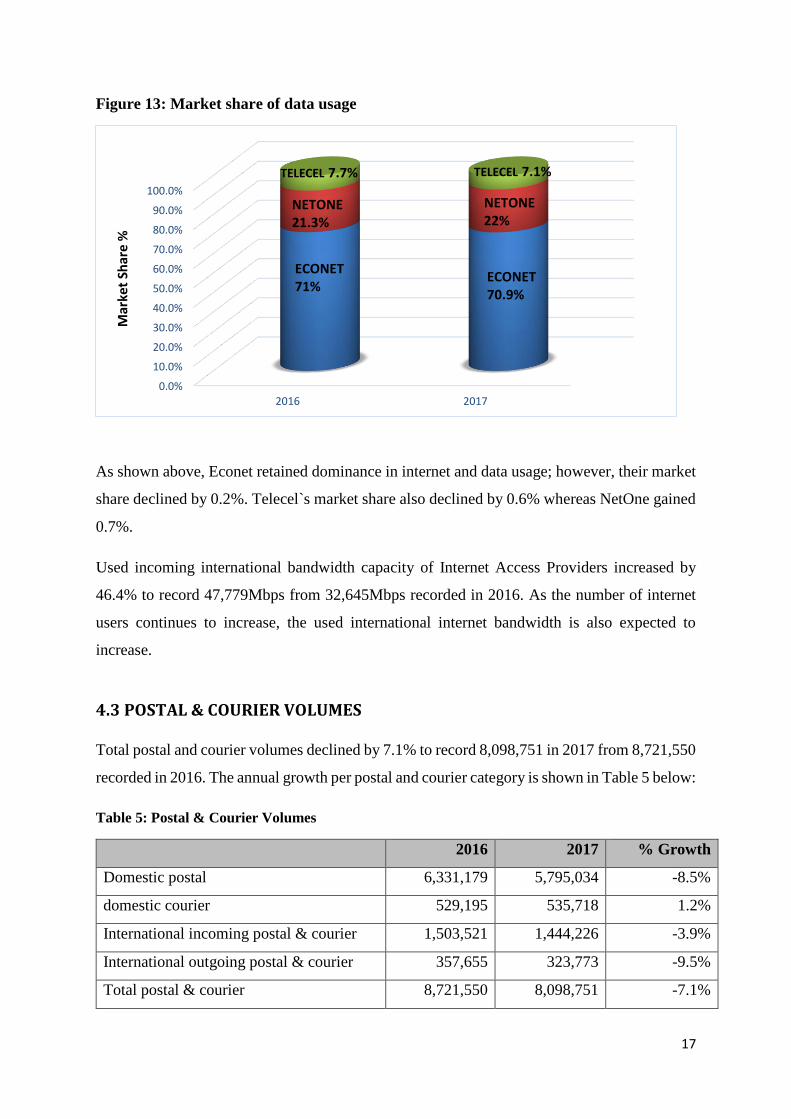
Figure 13: Market share of data usage
As shown above, Econet retained dominance in internet and data usage; however, their market
share declined by 0.2%. Telecel`s market share also declined by 0.6% whereas NetOne gained
0.7%.
Used incoming international bandwidth capacity of Internet Access Providers increased by
46.4% to record 47,779Mbps from 32,645Mbps recorded in 2016. As the number of internet
users continues to increase, the used international internet bandwidth is also expected to
increase.
4.3 POSTAL & COURIER VOLUMES
Total postal and courier volumes declined by 7.1% to record 8,098,751 in 2017 from 8,721,550
recorded in 2016. The annual growth per postal and courier category is shown in Table 5 below:
Table 5: Postal & Courier Volumes
2016 2017 % Growth
Domestic postal 6,331,179 5,795,034 -8.5%
domestic courier 529,195 535,718 1.2%
International incoming postal & courier 1,503,521 1,444,226 -3.9%
International outgoing postal & courier 357,655 323,773 -9.5%
Total postal & courier 8,721,550 8,098,751 -7.1%
0.0%
10.0%
20.0%
30.0%
40.0%
50.0%
60.0%
70.0%
80.0%
90.0%
100.0%
2016 2017
ECONET71%
NETONE 21.3%
TELECEL 7.7%
ECONET70.9%
NETONE22%
TELECEL 7.1%
Mar
ket
Shar
e %
18
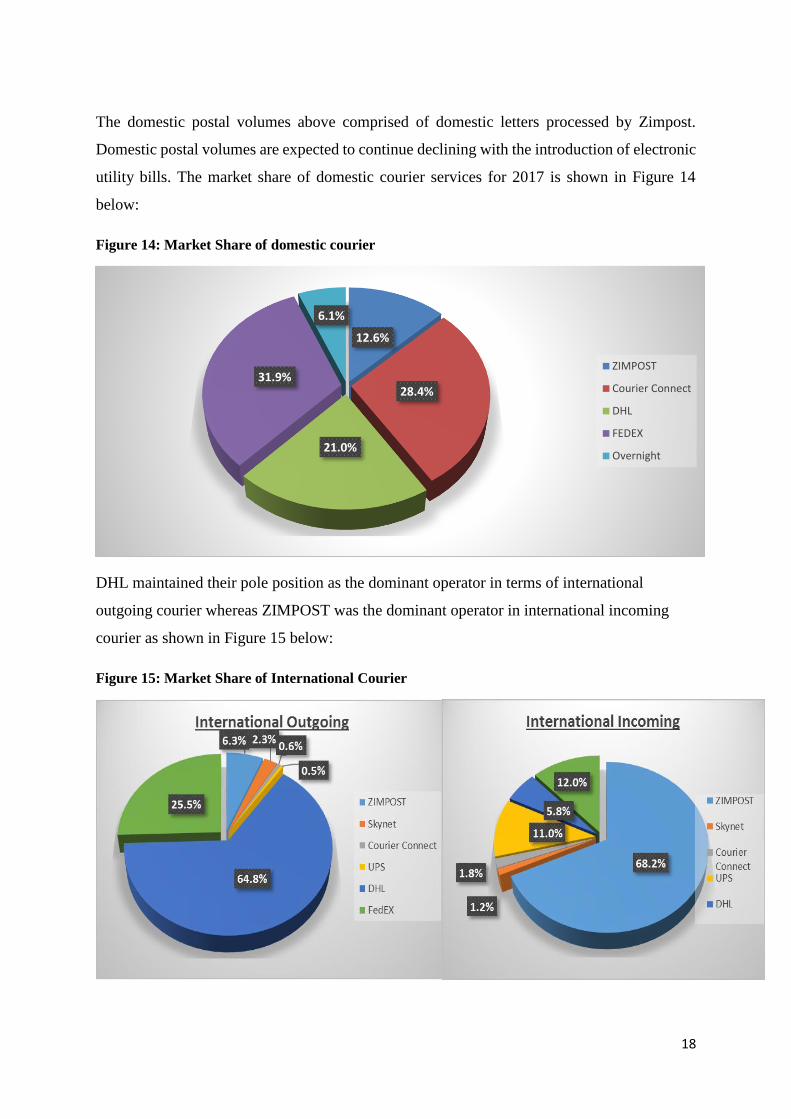
The domestic postal volumes above comprised of domestic letters processed by Zimpost.
Domestic postal volumes are expected to continue declining with the introduction of electronic
utility bills. The market share of domestic courier services for 2017 is shown in Figure 14
below:
Figure 14: Market Share of domestic courier
DHL maintained their pole position as the dominant operator in terms of international
outgoing courier whereas ZIMPOST was the dominant operator in international incoming
courier as shown in Figure 15 below:
Figure 15: Market Share of International Courier
12.6%
28.4%
21.0%
31.9%
6.1%
ZIMPOST
Courier Connect
DHL
FEDEX
Overnight
19
ZIMPOST`s dominance in international incoming courier is attributable to the fact that they
are cheapest channel for receiving courier items in Zimbabwe, especially when purchasing
goods on e-commerce sites such as Aliexpress.
5. REVENUES & INVESTMENT
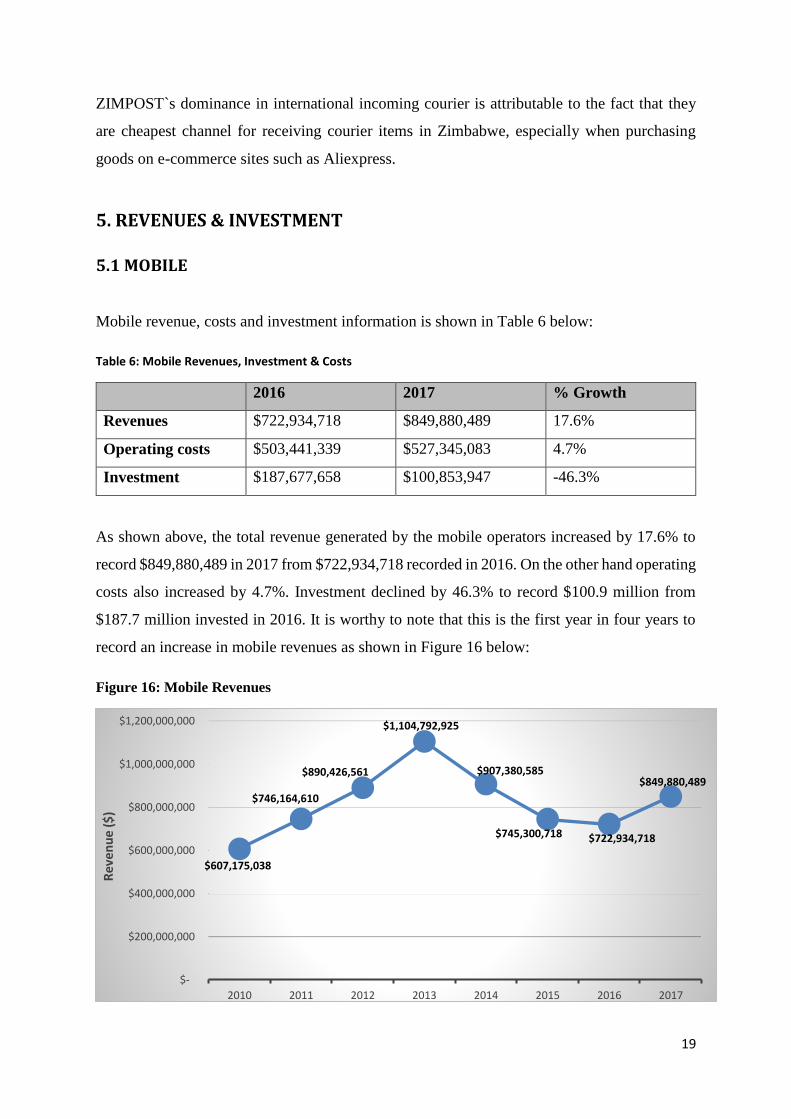
5.1 MOBILE
Mobile revenue, costs and investment information is shown in Table 6 below:
Table 6: Mobile Revenues, Investment & Costs
2016 2017 % Growth
Revenues $722,934,718 $849,880,489 17.6%
Operating costs $503,441,339 $527,345,083 4.7%
Investment $187,677,658 $100,853,947 -46.3%
As shown above, the total revenue generated by the mobile operators increased by 17.6% to
record $849,880,489 in 2017 from $722,934,718 recorded in 2016. On the other hand operating
costs also increased by 4.7%. Investment declined by 46.3% to record $100.9 million from
$187.7 million invested in 2016. It is worthy to note that this is the first year in four years to
record an increase in mobile revenues as shown in Figure 16 below:
Figure 16: Mobile Revenues
$607,175,038
$746,164,610
$890,426,561
$1,104,792,925
$907,380,585
$745,300,718 $722,934,718
$849,880,489
$-
$200,000,000
$400,000,000
$600,000,000
$800,000,000
$1,000,000,000
$1,200,000,000
2010 2011 2012 2013 2014 2015 2016 2017
Rev
enu
e ($
)
20
The growth in mobile revenues is attributable to the growth in mobile internet and data usage
as well as mobile money.
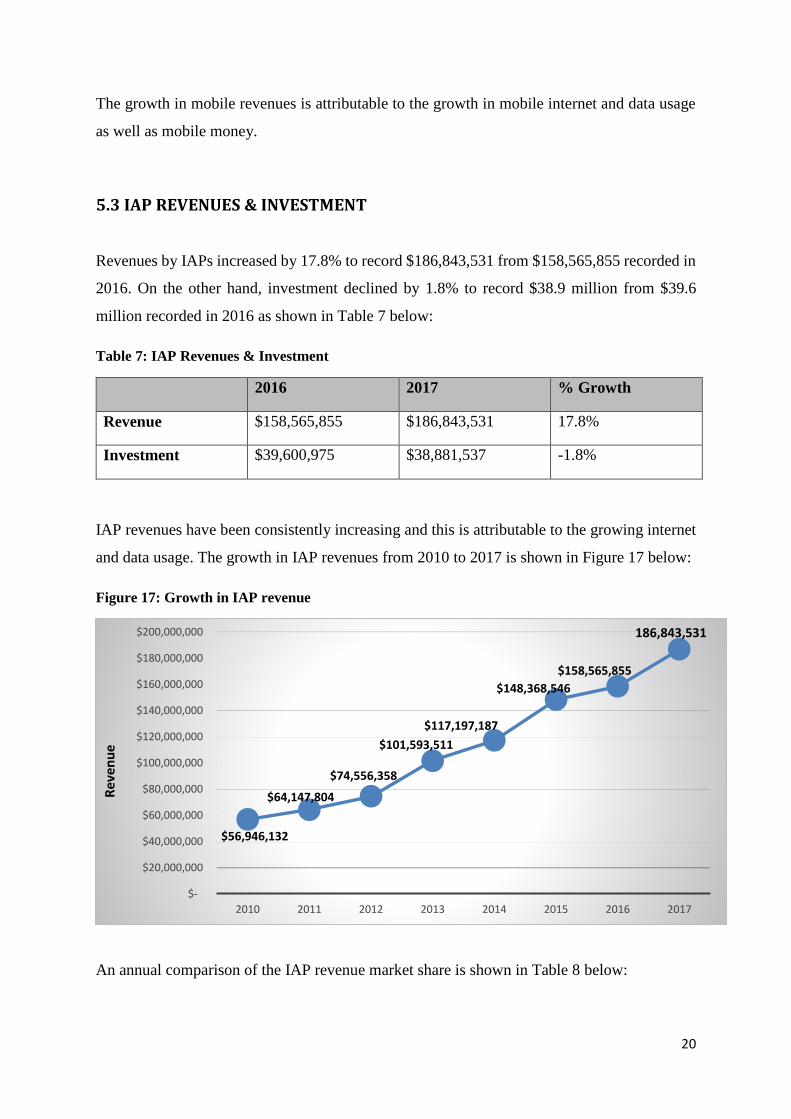
5.3 IAP REVENUES & INVESTMENT
Revenues by IAPs increased by 17.8% to record $186,843,531 from $158,565,855 recorded in
2016. On the other hand, investment declined by 1.8% to record $38.9 million from $39.6
million recorded in 2016 as shown in Table 7 below:
Table 7: IAP Revenues & Investment
2016 2017 % Growth
Revenue $158,565,855 $186,843,531 17.8%
Investment $39,600,975 $38,881,537 -1.8%
IAP revenues have been consistently increasing and this is attributable to the growing internet
and data usage. The growth in IAP revenues from 2010 to 2017 is shown in Figure 17 below:
Figure 17: Growth in IAP revenue
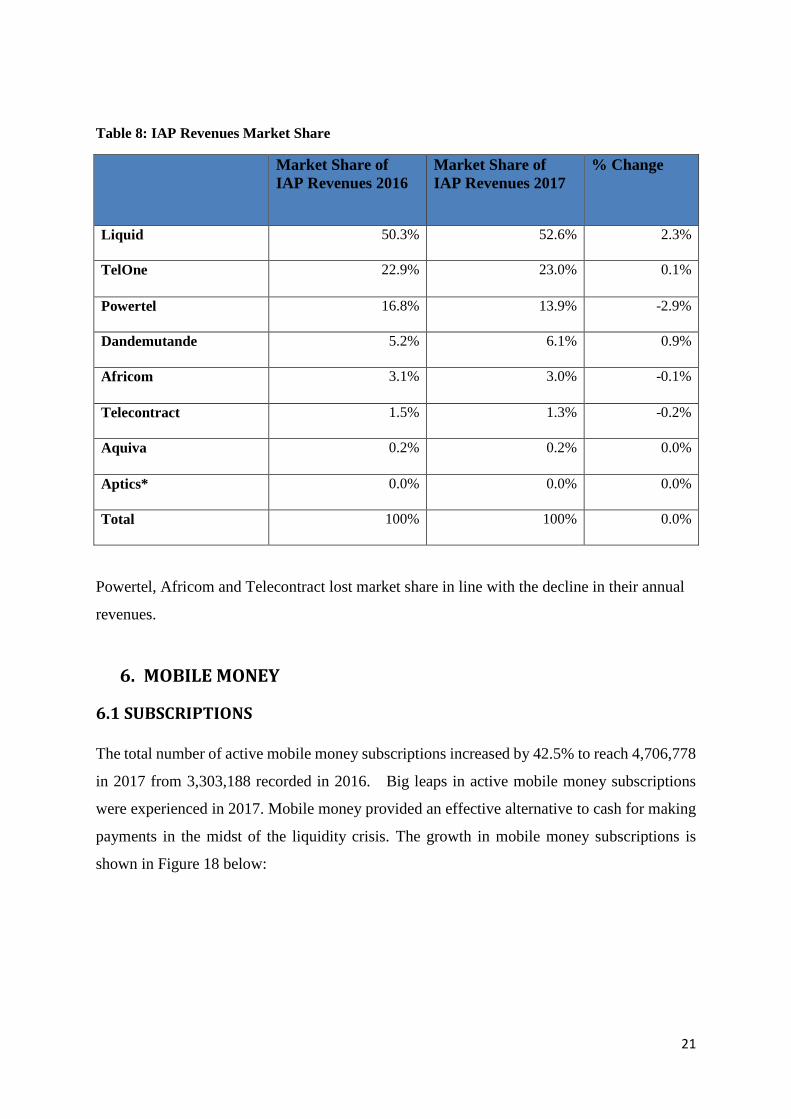
An annual comparison of the IAP revenue market share is shown in Table 8 below:
$-
$20,000,000
$40,000,000
$60,000,000
$80,000,000
$100,000,000
$120,000,000
$140,000,000
$160,000,000
$180,000,000
$200,000,000
2010 2011 2012 2013 2014 2015 2016 2017
Re
ven
ue
$56,946,132
$64,147,804
$74,556,358
$101,593,511
$117,197,187
$148,368,546
$158,565,855
186,843,531
21
Table 8: IAP Revenues Market Share
Market Share of
IAP Revenues 2016
Market Share of
IAP Revenues 2017
% Change
Liquid 50.3% 52.6% 2.3%
TelOne 22.9% 23.0% 0.1%
Powertel 16.8% 13.9% -2.9%
Dandemutande 5.2% 6.1% 0.9%
Africom 3.1% 3.0% -0.1%
Telecontract 1.5% 1.3% -0.2%
Aquiva 0.2% 0.2% 0.0%
Aptics* 0.0% 0.0% 0.0%
Total 100% 100% 0.0%
Powertel, Africom and Telecontract lost market share in line with the decline in their annual
revenues.
6. MOBILE MONEY
6.1 SUBSCRIPTIONS
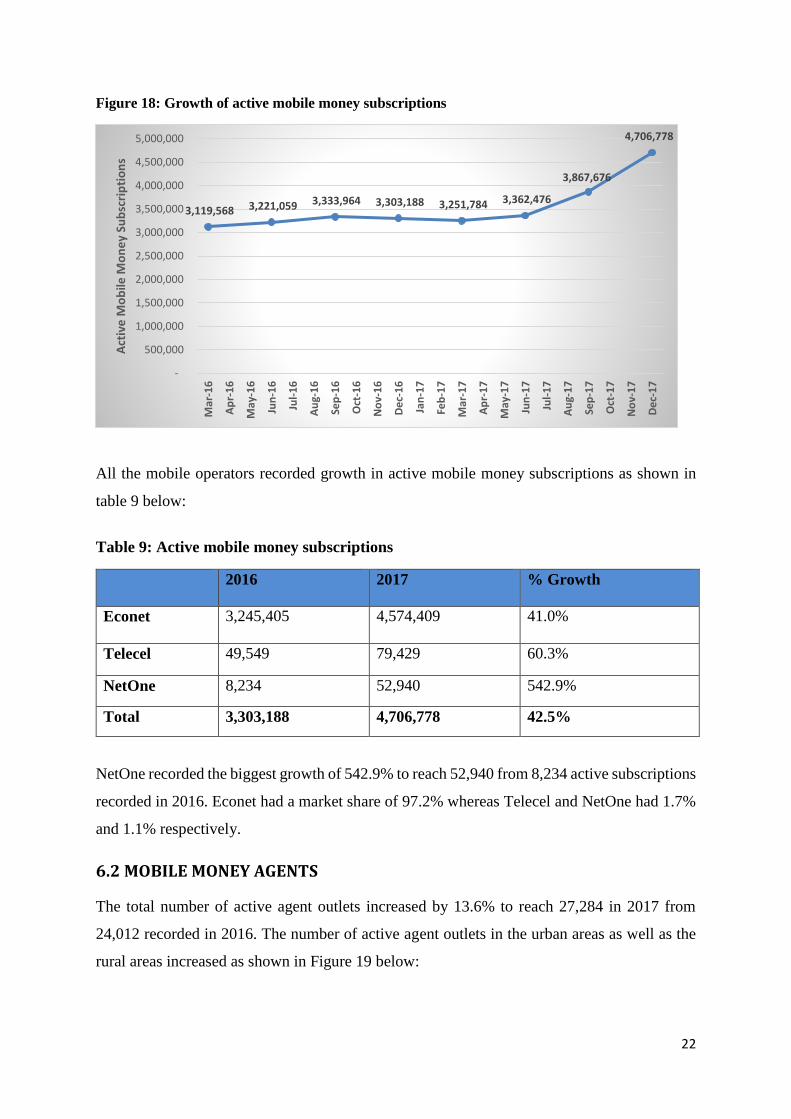
The total number of active mobile money subscriptions increased by 42.5% to reach 4,706,778
in 2017 from 3,303,188 recorded in 2016. Big leaps in active mobile money subscriptions
were experienced in 2017. Mobile money provided an effective alternative to cash for making
payments in the midst of the liquidity crisis. The growth in mobile money subscriptions is
shown in Figure 18 below:
22
Figure 18: Growth of active mobile money subscriptions
All the mobile operators recorded growth in active mobile money subscriptions as shown in
table 9 below:
Table 9: Active mobile money subscriptions
2016 2017 % Growth
Econet 3,245,405 4,574,409
41.0%
Telecel 49,549 79,429 60.3%
NetOne 8,234 52,940 542.9%
Total 3,303,188 4,706,778 42.5%
NetOne recorded the biggest growth of 542.9% to reach 52,940 from 8,234 active subscriptions
recorded in 2016. Econet had a market share of 97.2% whereas Telecel and NetOne had 1.7%
and 1.1% respectively.
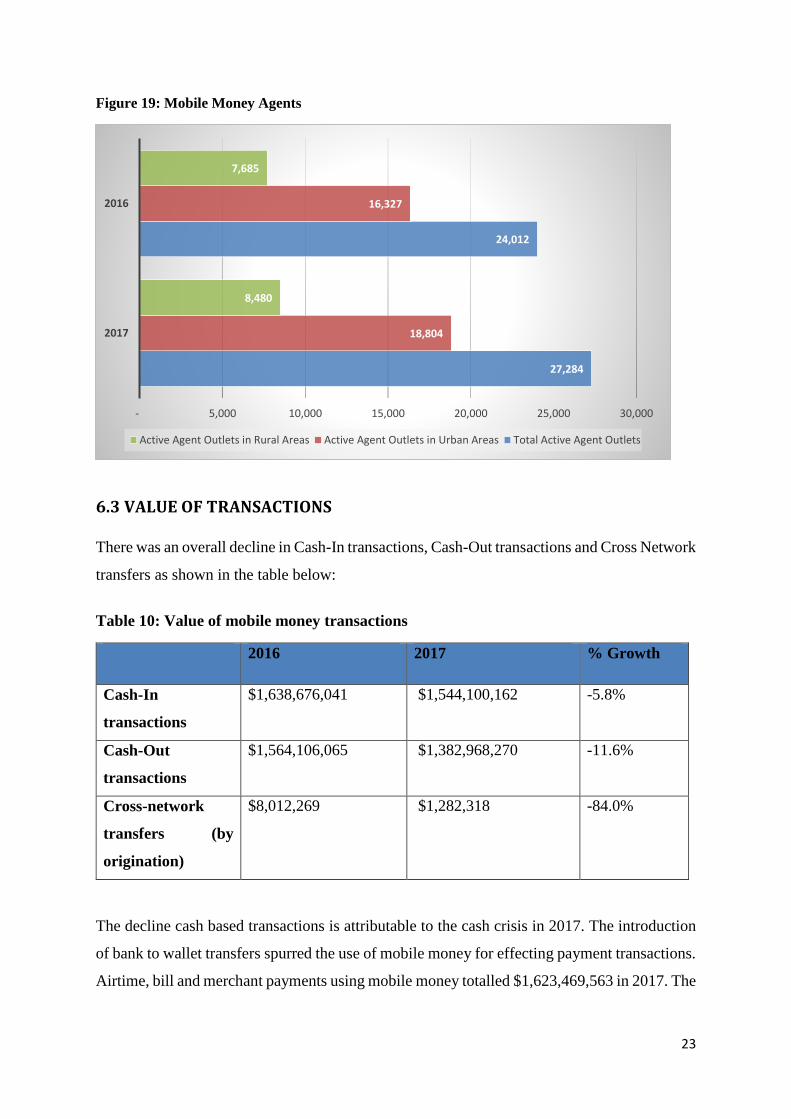
6.2 MOBILE MONEY AGENTS
The total number of active agent outlets increased by 13.6% to reach 27,284 in 2017 from
24,012 recorded in 2016. The number of active agent outlets in the urban areas as well as the
rural areas increased as shown in Figure 19 below:
3,119,568 3,221,059 3,333,964 3,303,188 3,251,784 3,362,476
3,867,676
4,706,778
-
500,000
1,000,000
1,500,000
2,000,000
2,500,000
3,000,000
3,500,000
4,000,000
4,500,000
5,000,000
Mar
-16
Ap
r-1
6
May
-16
Jun
-16
Jul-
16
Au
g-1
6
Sep
-16
Oct
-16
No
v-1
6
De
c-1
6
Jan
-17
Feb
-17
Mar
-17
Ap
r-1
7
May
-17
Jun
-17
Jul-
17
Au
g-1
7
Sep
-17
Oct
-17
No
v-1
7
De
c-1
7
Act
ive
Mo
bile
Mo
ne
y Su
bsc
rip
tio
ns
23
Figure 19: Mobile Money Agents
6.3 VALUE OF TRANSACTIONS
There was an overall decline in Cash-In transactions, Cash-Out transactions and Cross Network
transfers as shown in the table below:
Table 10: Value of mobile money transactions
2016 2017 % Growth
Cash-In
transactions
$1,638,676,041 $1,544,100,162 -5.8%
Cash-Out
transactions
$1,564,106,065 $1,382,968,270 -11.6%
Cross-network
transfers (by
origination)
$8,012,269 $1,282,318 -84.0%
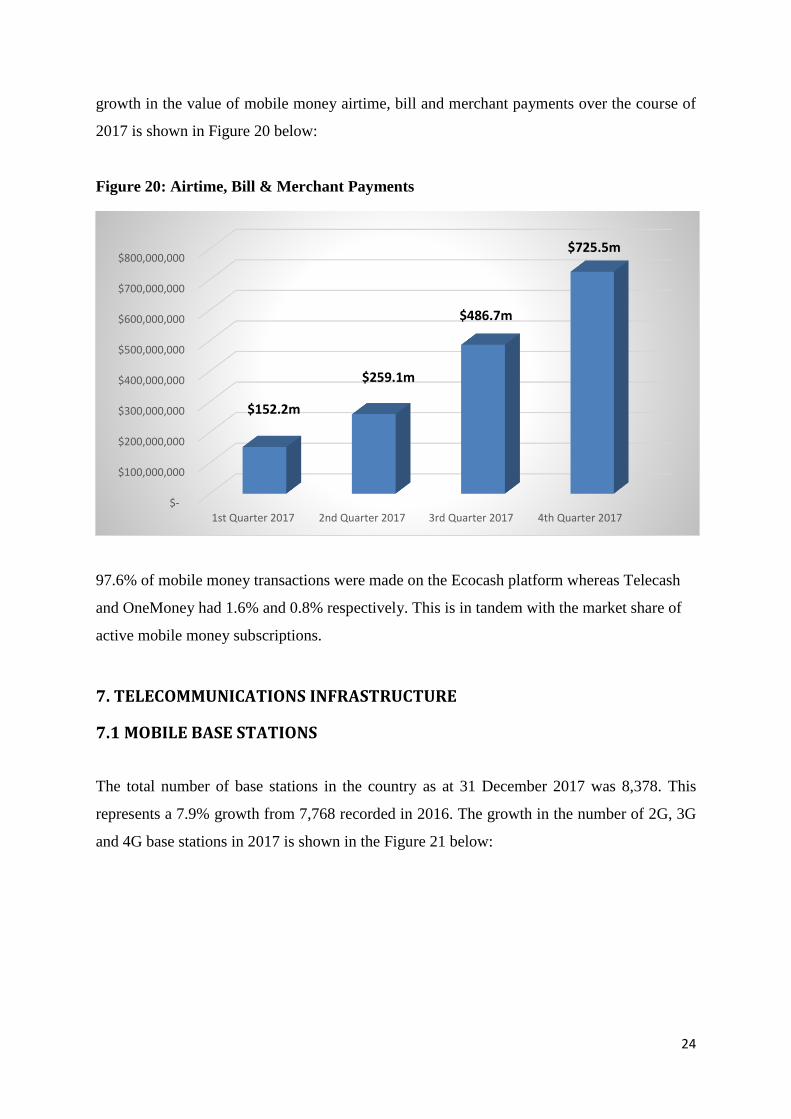
The decline cash based transactions is attributable to the cash crisis in 2017. The introduction
of bank to wallet transfers spurred the use of mobile money for effecting payment transactions.
Airtime, bill and merchant payments using mobile money totalled $1,623,469,563 in 2017. The
27,284
24,012
18,804
16,327
8,480
7,685
- 5,000 10,000 15,000 20,000 25,000 30,000
2017
2016
Active Agent Outlets in Rural Areas Active Agent Outlets in Urban Areas Total Active Agent Outlets
24
growth in the value of mobile money airtime, bill and merchant payments over the course of
2017 is shown in Figure 20 below:
Figure 20: Airtime, Bill & Merchant Payments
97.6% of mobile money transactions were made on the Ecocash platform whereas Telecash
and OneMoney had 1.6% and 0.8% respectively. This is in tandem with the market share of
active mobile money subscriptions.
7. TELECOMMUNICATIONS INFRASTRUCTURE
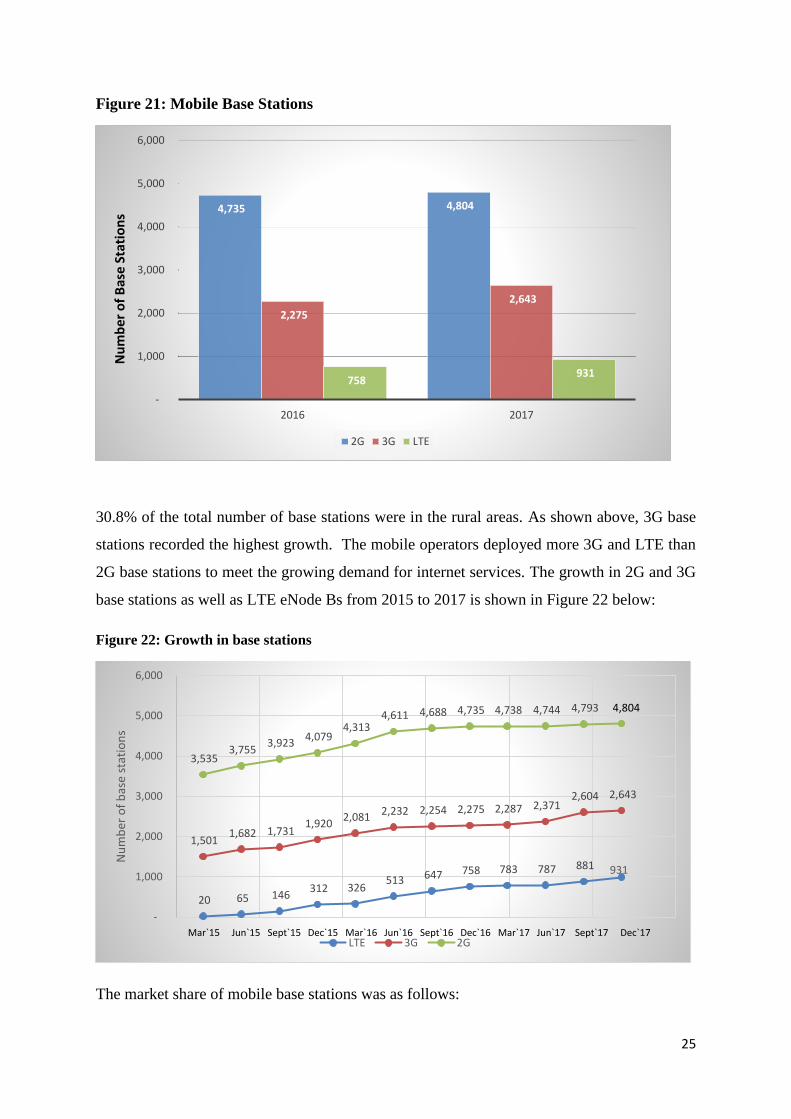
7.1 MOBILE BASE STATIONS
The total number of base stations in the country as at 31 December 2017 was 8,378. This
represents a 7.9% growth from 7,768 recorded in 2016. The growth in the number of 2G, 3G
and 4G base stations in 2017 is shown in the Figure 21 below:
$-
$100,000,000
$200,000,000
$300,000,000
$400,000,000
$500,000,000
$600,000,000
$700,000,000
$800,000,000
1st Quarter 2017 2nd Quarter 2017 3rd Quarter 2017 4th Quarter 2017
$152.2m
$259.1m
$486.7m
$725.5m
25
Figure 21: Mobile Base Stations
30.8% of the total number of base stations were in the rural areas. As shown above, 3G base
stations recorded the highest growth. The mobile operators deployed more 3G and LTE than
2G base stations to meet the growing demand for internet services. The growth in 2G and 3G
base stations as well as LTE eNode Bs from 2015 to 2017 is shown in Figure 22 below:
Figure 22: Growth in base stations
The market share of mobile base stations was as follows:
4,735 4,804
2,275
2,643
758 931
-
1,000
2,000
3,000
4,000
5,000
6,000
2016 2017
2G 3G LTE
Nu
mb
er o
f B
ase
Stat
ion
s
20 65 146 312 326
513 647 758 783 787 881
1,501 1,682 1,731
1,920 2,081
2,232 2,254 2,275 2,287 2,371 2,604 2,643
3,535 3,755
3,923 4,079
4,313 4,611 4,688 4,735 4,738 4,744 4,793
-
1,000
2,000
3,000
4,000
5,000
6,000
Nu
mb
er o
f b
ase
stat
ion
s
LTE 3G 2GMar`15 Jun`15 Sept`15 Dec`15 Mar`16 Jun`16 Sept`16 Dec`16 Mar`17 Jun`17 Sept`17 Dec`17
931
4,804
26
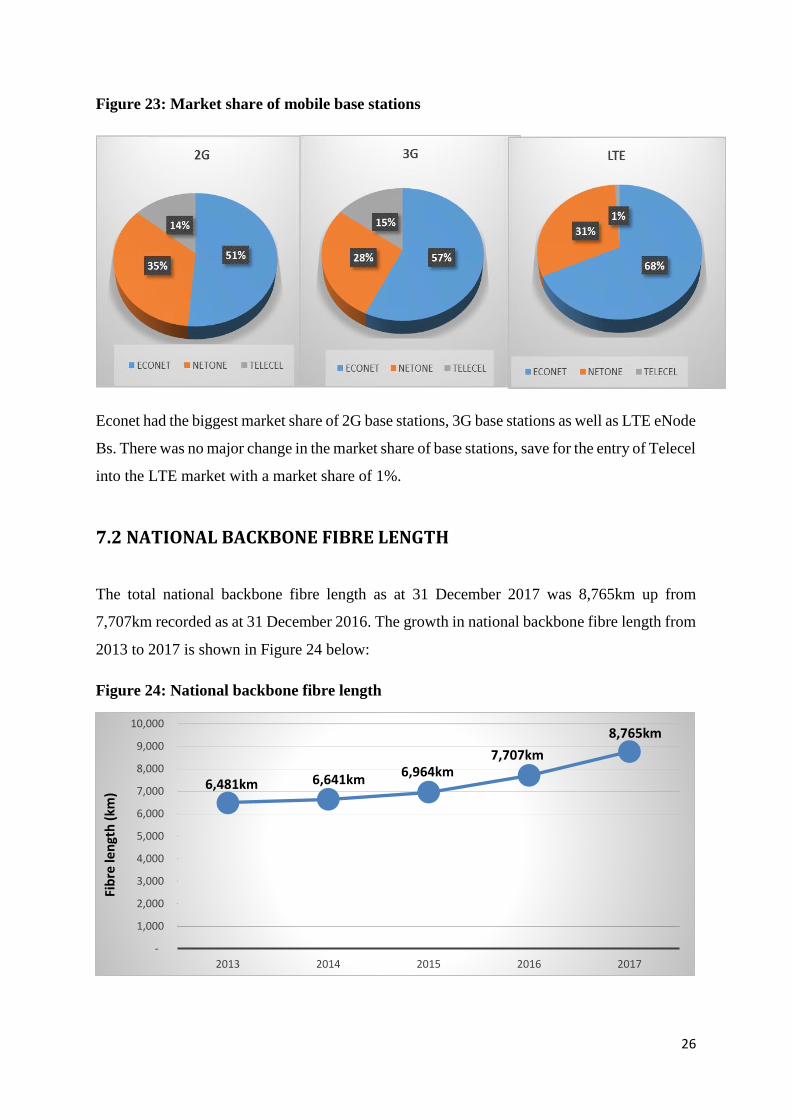
Figure 23: Market share of mobile base stations
Econet had the biggest market share of 2G base stations, 3G base stations as well as LTE eNode
Bs. There was no major change in the market share of base stations, save for the entry of Telecel
into the LTE market with a market share of 1%.
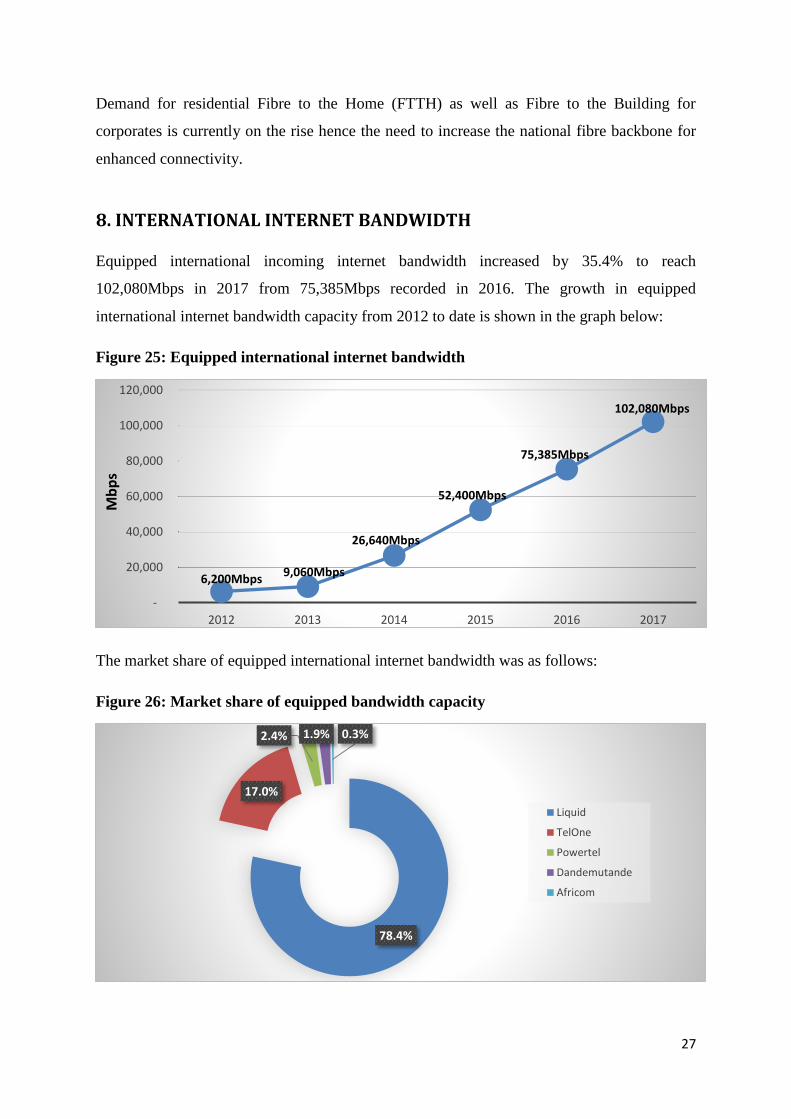
7.2 NATIONAL BACKBONE FIBRE LENGTH
The total national backbone fibre length as at 31 December 2017 was 8,765km up from
7,707km recorded as at 31 December 2016. The growth in national backbone fibre length from
2013 to 2017 is shown in Figure 24 below:
Figure 24: National backbone fibre length
-
1,000
2,000
3,000
4,000
5,000
6,000
7,000
8,000
9,000
10,000
2013 2014 2015 2016 2017
Fib
re le
ngt
h (
km)
6,481km 6,641km6,964km
7,707km
8,765km
27
Demand for residential Fibre to the Home (FTTH) as well as Fibre to the Building for
corporates is currently on the rise hence the need to increase the national fibre backbone for
enhanced connectivity.
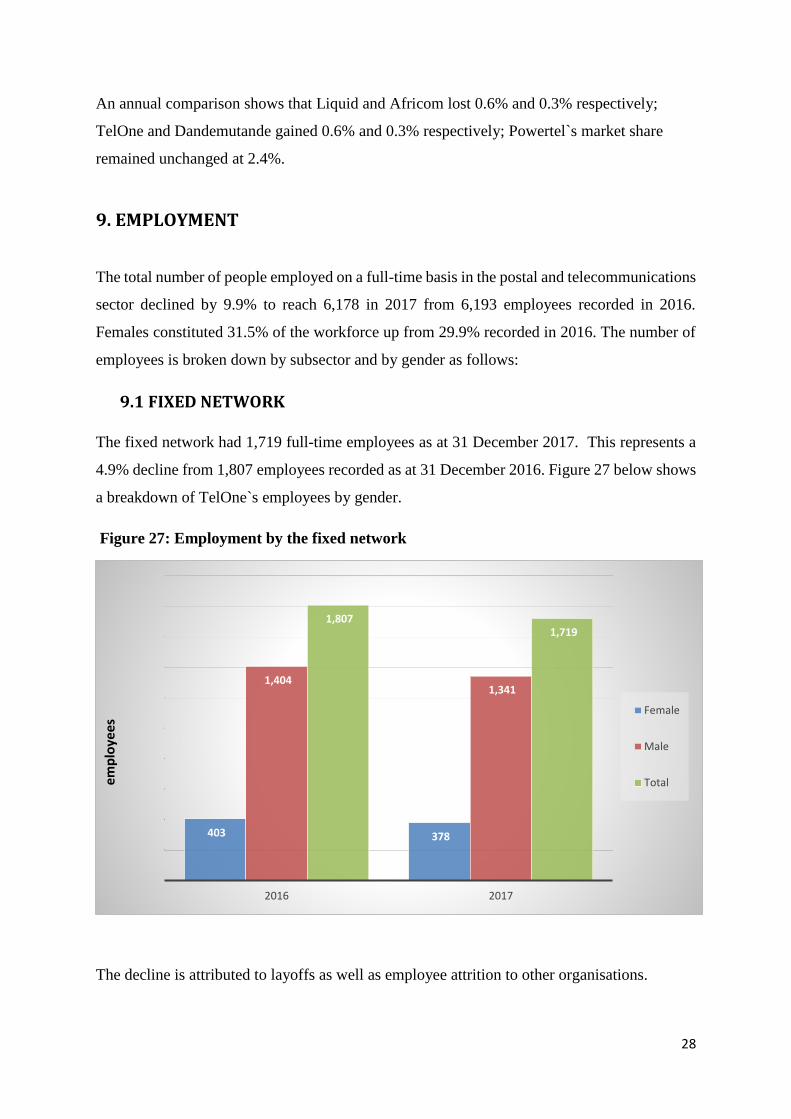
8. INTERNATIONAL INTERNET BANDWIDTH
Equipped international incoming internet bandwidth increased by 35.4% to reach
102,080Mbps in 2017 from 75,385Mbps recorded in 2016. The growth in equipped
international internet bandwidth capacity from 2012 to date is shown in the graph below:
Figure 25: Equipped international internet bandwidth
The market share of equipped international internet bandwidth was as follows:
Figure 26: Market share of equipped bandwidth capacity
-
20,000
40,000
60,000
80,000
100,000
120,000
2012 2013 2014 2015 2016 2017
6,200Mbps
Mb
ps
9,060Mbps
26,640Mbps
52,400Mbps
75,385Mbps
102,080Mbps
78.4%
17.0%
2.4% 1.9% 0.3%
Liquid
TelOne
Powertel
Dandemutande
Africom
28
An annual comparison shows that Liquid and Africom lost 0.6% and 0.3% respectively;
TelOne and Dandemutande gained 0.6% and 0.3% respectively; Powertel`s market share
remained unchanged at 2.4%.
9. EMPLOYMENT
The total number of people employed on a full-time basis in the postal and telecommunications
sector declined by 9.9% to reach 6,178 in 2017 from 6,193 employees recorded in 2016.
Females constituted 31.5% of the workforce up from 29.9% recorded in 2016. The number of
employees is broken down by subsector and by gender as follows:
9.1 FIXED NETWORK
The fixed network had 1,719 full-time employees as at 31 December 2017. This represents a
4.9% decline from 1,807 employees recorded as at 31 December 2016. Figure 27 below shows
a breakdown of TelOne`s employees by gender.
Figure 27: Employment by the fixed network
The decline is attributed to layoffs as well as employee attrition to other organisations.
403 378
1,404 1,341
1,807 1,719
2016 2017
Female
Male
Totalemp
loye
es
29
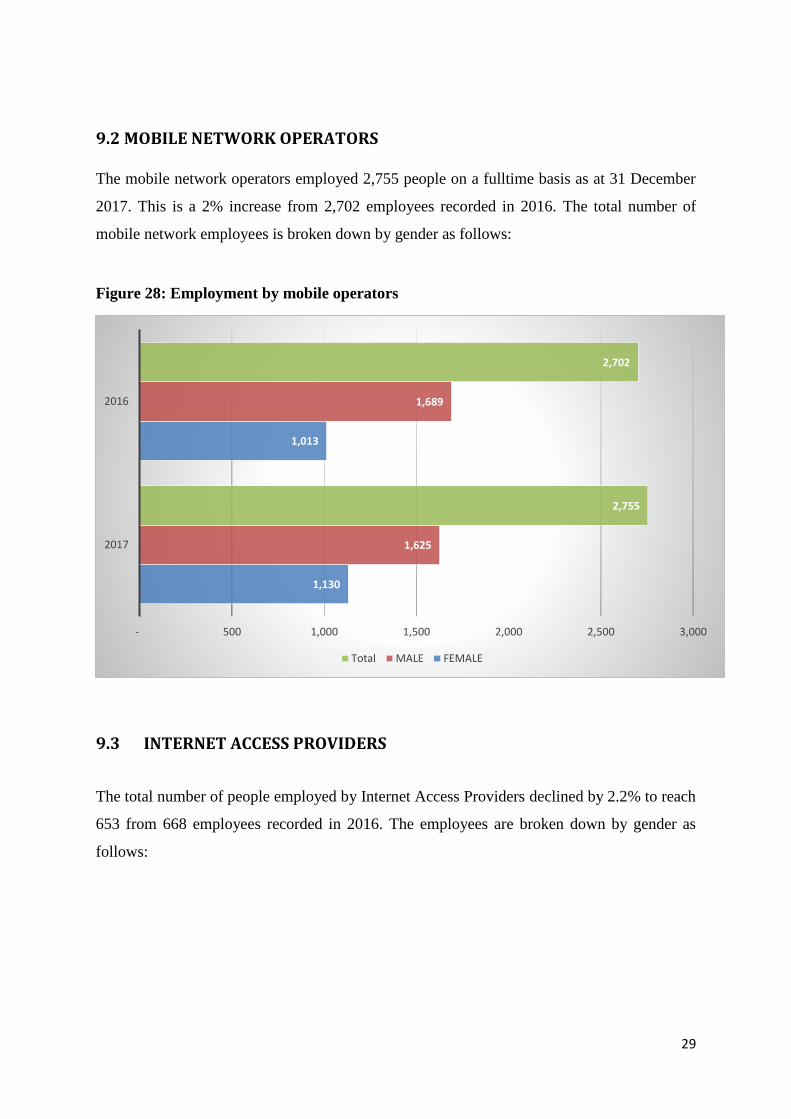
9.2 MOBILE NETWORK OPERATORS
The mobile network operators employed 2,755 people on a fulltime basis as at 31 December
2017. This is a 2% increase from 2,702 employees recorded in 2016. The total number of
mobile network employees is broken down by gender as follows:
Figure 28: Employment by mobile operators
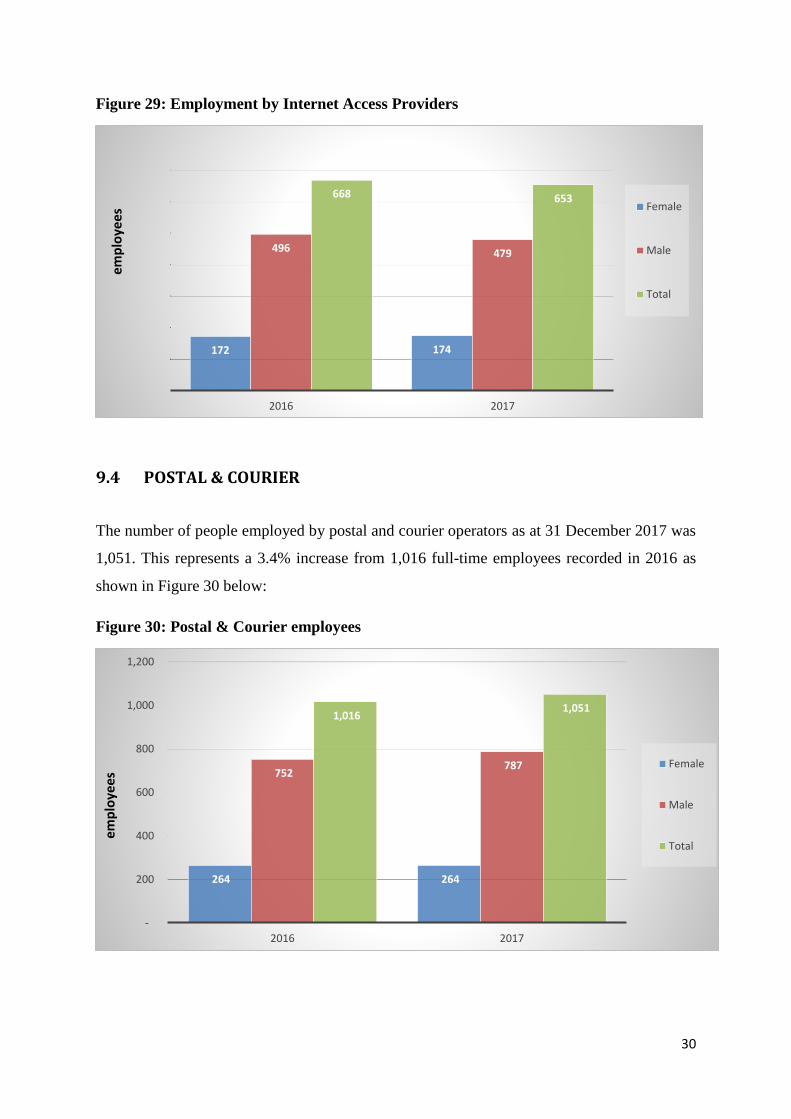
9.3 INTERNET ACCESS PROVIDERS
The total number of people employed by Internet Access Providers declined by 2.2% to reach
653 from 668 employees recorded in 2016. The employees are broken down by gender as
follows:
1,130
1,013
1,625
1,689
2,755
2,702
- 500 1,000 1,500 2,000 2,500 3,000
2017
2016
Total MALE FEMALE
30
Figure 29: Employment by Internet Access Providers
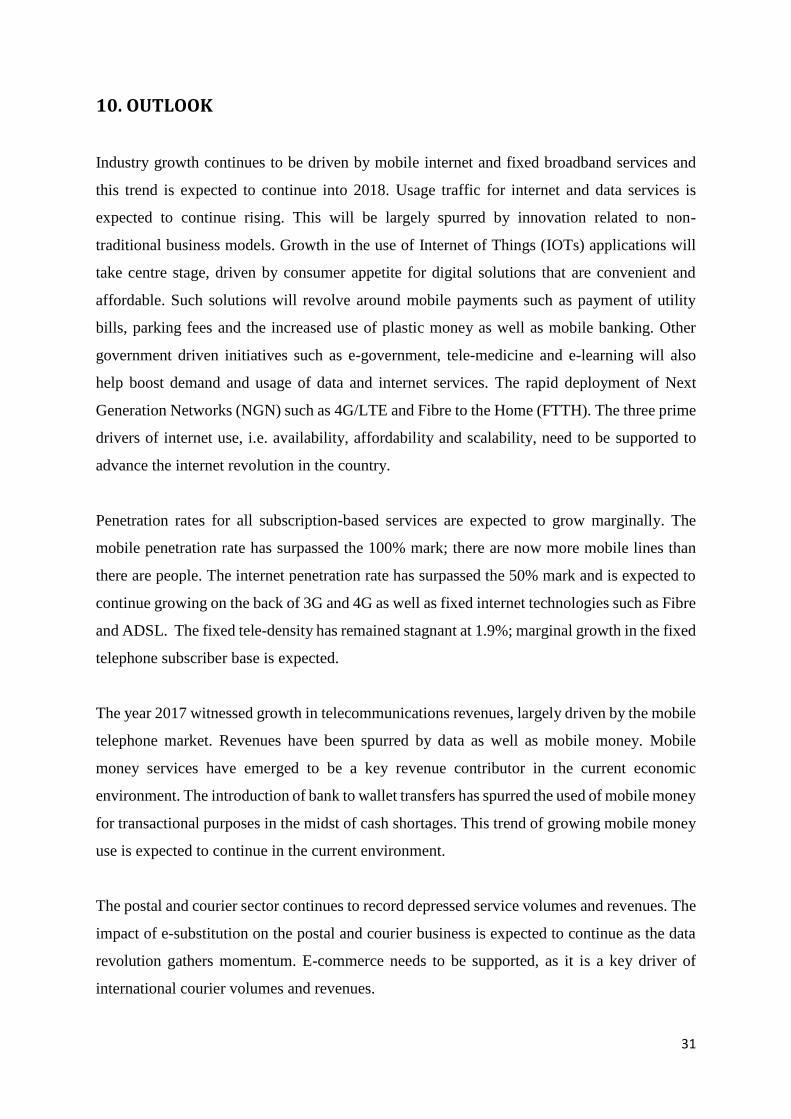
9.4 POSTAL & COURIER
The number of people employed by postal and courier operators as at 31 December 2017 was
1,051. This represents a 3.4% increase from 1,016 full-time employees recorded in 2016 as
shown in Figure 30 below:
Figure 30: Postal & Courier employees
172 174
496 479
668 653
2016 2017
Female
Male
Total
emp
loye
es
264 264
752 787
1,016 1,051
-
200
400
600
800
1,000
1,200
2016 2017
Female
Male
Total
emp
loye
es
31
10. OUTLOOK
Industry growth continues to be driven by mobile internet and fixed broadband services and
this trend is expected to continue into 2018. Usage traffic for internet and data services is
expected to continue rising. This will be largely spurred by innovation related to non-
traditional business models. Growth in the use of Internet of Things (IOTs) applications will
take centre stage, driven by consumer appetite for digital solutions that are convenient and
affordable. Such solutions will revolve around mobile payments such as payment of utility
bills, parking fees and the increased use of plastic money as well as mobile banking. Other
government driven initiatives such as e-government, tele-medicine and e-learning will also
help boost demand and usage of data and internet services. The rapid deployment of Next
Generation Networks (NGN) such as 4G/LTE and Fibre to the Home (FTTH). The three prime
drivers of internet use, i.e. availability, affordability and scalability, need to be supported to
advance the internet revolution in the country.
Penetration rates for all subscription-based services are expected to grow marginally. The
mobile penetration rate has surpassed the 100% mark; there are now more mobile lines than
there are people. The internet penetration rate has surpassed the 50% mark and is expected to
continue growing on the back of 3G and 4G as well as fixed internet technologies such as Fibre
and ADSL. The fixed tele-density has remained stagnant at 1.9%; marginal growth in the fixed
telephone subscriber base is expected.
The year 2017 witnessed growth in telecommunications revenues, largely driven by the mobile
telephone market. Revenues have been spurred by data as well as mobile money. Mobile
money services have emerged to be a key revenue contributor in the current economic
environment. The introduction of bank to wallet transfers has spurred the used of mobile money
for transactional purposes in the midst of cash shortages. This trend of growing mobile money
use is expected to continue in the current environment.
The postal and courier sector continues to record depressed service volumes and revenues. The
impact of e-substitution on the postal and courier business is expected to continue as the data
revolution gathers momentum. E-commerce needs to be supported, as it is a key driver of
international courier volumes and revenues.