Embed Size (px)
Citation preview
Post War Reconstruction Priorities of Buildings in
Gaza Strip Using Decision Support Systems
قطاع غزة على بعد الحرب ما تحديد أولويات اعادة االعمار
باستخدام أنظمة دعم القرار
Mohammed Ibraheem Lubbad
Supervised by:
Dr. Mohammed Arafa
Associated professor
Dr. Mamoun Alqedra
Associated professor
A Thesis Submitted in Partial Fulfillment of Requirements for the Degree of Master
in Civil Engineering.
February / 2017
The Islamic University–Gaza
غزة - الجامعة االسالمية
Research and Postgraduate Affairs شئون البحث العلمي والدراسات العليا
Faculty of Engineering كلية الهندسة
Master of design and rehabilitation of
structures
تصميم واعادة تأهيل المنشآتماجستير

II
Abstract
Governments and decision makers are obsessed with well-planned reconstruction
after natural disasters and after human caused disasters. Post war reconstruction of
damaged buildings must be well managed. The management can be achieved by
creating a suitable program fitting with the situation in a stricken country.
This issue appears in many societies after disasters, because of the large numbers of
affected people and their needs to be satisfied. Another issue appeared when there
is a lack of construction machines and equipment and human resources which
makes it hard to start working on all destructed houses at the same time. Moreover,
siege of Gaza aggravates the problem of reconstruction process, due to the very
little amount of allowed materials to be distributed in Gaza Strip and the lack of
financial support from donors. The main aim of this study is to establish an effective
model for post war reconstruction process by identifying the priorities of housing
reconstruction based on a predefined specific criteria and using fuzzy logic model.
Reconstruction management is achieved in this study by developing a validated
model which would help to distribute reconstruction materials and determining the
priority of services and affected people according to specific criteria. The developed
model consists of two stages. First, four main criteria were evaluated by a fuzzy
logic model. The weights obtained from the first stage are applied in the second
stage as inputs to identify the priority degree, subjected to maximum achievable
difference between priorities. The developed model has been verified and applied
on collected data of totally damaged buildings after 2014 conflict on Gaza. North
Governorate’s data was used as a specific case study where results were linked with
Geographic Information System. Totally damaged buildings in North Governorate
have been graphically shown through linked GIS and categorized into five groups
according to emergency level of reconstruction of damaged buildings. All
achieved results prove that the proposed model is effective and can be applied to
ensure fair distribution of construction materials and financial support for affected
people.

III
الملخص
تبقى الحكومات وصناع القرار منشغلون بخطط محكمة إلعادة االعمار بعد حدوث كوارث طبيعية أو كوارث من هذا النوع من االدارة ملية اعادة االعمار بعد الحروب تحديدا يجب أن تكون مدارة بشكل جيد. صنع االنسان، وع
الجيدة قد تحقق عن طريق برنامج مصمم بطريقة مالئمة لظروف معايير البيئة في الدراسة.
تظهر مشكلة ادارة األزمات في بعض المجتمعات بشكل جلي بسبب العدد الكبير من األفراد المتضررينواحتياجاتهم الواجب تأمينها. وقد تتفاقم هذه المشكلة في حال نقص الموارد ومعدات وآليات البناء مما يجعل العمل على كافة المباني المتضررة في وقت واحد أمرا في غاية الصعوبة، إضافة إلى ذلك فإن الحصار على غزة
لك يعود لشح المقومات ونقص الدعم المالي."على سبيل المثال" يفاقم من مشكلة عملية إعادة االعمار، وذ
إن الهدف الرئيسي لهذه الدراسة يمكن تلخيصه في تحقيق أنموذج فعال لعملية اعادة االعمار بعد الحرب من خالل تحديد أولوية كل مبنى يحتاج إلعادة اعمار باالعتماد على عدة معايير معرفة وذلك باستخدام أنموذج
(.Fuzzy Logicالمنطق الضبابي)
إن عملية إدارة إعادة االعمار في هذه الدراسة تتحقق من خالل تصميم أنموذج من شأنه أن يقوم بتوزيع الموارد واالمكانات " على نقصها" ويحدد درجة أولوية كل منزل في اعادة االعمار من خالل معايير محددة.
ألولى، تم تقييم أربع معايير أساسية باستخدام من مرحلتين، المرحلية ا النموذج المصمم في هذه الدراسة يتكون أداة المنطق الضبابي. درجة األهمية المحصلة من المرحلية األولى تستخدم كمدخالت للمرحلة الثانية لتحديد
درجة أولوية كل منزل قائم على تحقيق أكبر فرق ممكن بين درجات األولوية.
للمباني المهدومة مجموعة ه من خالل تطبيقه على البيانات التم تطبيق النموذج المصمم وتم اثبات مدى فعاليتعلى قطاع غزة، وتم استخدام بيانات منطقة شمال قطاع غزة على وده الخصوص 2014كليا بعد حرب عام
كحالة دراسية يمكن ربط نتائجها ببرامج نظم المعلومات الجغرافية، وتم تصنيفها لخمس درجات وفق درجة مية اعادة اعمار كل درجة وتم اظهارها بشكل بصري.األولوية ومدى أه
جميع النتائج التي تم الحصول عليها تثبت بشكل عملي أن النموذج المصمم والمقترح في الدراسة هو أنموذج فعال وقابل للتطبيق لضمان توزيع عادل لمواد البناء والدعم المتوفر ألصحاب المنازل المهدومة.

IV
Dedication
To the fountain of patience and optimism and hope.
To each of the following in the presence of God and his Messenger.
To the big heart my dear parents.
To those who have demonstrate to me what is the most beautiful of life, my wife, my
kids, brother and sisters.
To the people who paved our way of science and knowledge.
All our teachers distinguished.
To the taste of the most beautiful moments with my friends.
I dedicate this work.
V
ACKNOWLEDGMENTS
I feel obliged to extend my sincere thanks and appreciation to my instructors in the
faculty of engineering at the Islamic university, who were helpful.
Special thanks to my supervisors Dr. Mohammed Arafa and Dr. Mamoun Alqedra who
saved no effort in supporting me to complete this work.
My thanks to the discussion committee instructors.
Finally, thanks to all official organizations and persons who provided me with valuable
information. I mention in particular, Eng. Mahmoud Abu Sall who helps me in the
practical works, Ministry of Public Works and Housing, GIS Specialist Mohammed
Skoot, Eng. Amjed Ouda and Eng. Mohammed Al Ostaz.

VI
بسم هللا الرحمن الرحيم
ومماتي ومحياي ونسكي صلتيقل إن " "العالمين رب لل
[ 162] األنعام :
VII
Table of Contents
DECLARATION ........................................................................................................................... I
ABSTRACT ................................................................................................................................. II
III ........................................................................................................................................... الملخص
DEDICATION ............................................................................................................................ IV
ACKNOWLEDGMENTS .......................................................................................................... V
TABLE OF CONTENTS ......................................................................................................... VII
LIST OF TABLES ..................................................................................................................... X
LIST OF FIGURES ................................................................................................................. XII
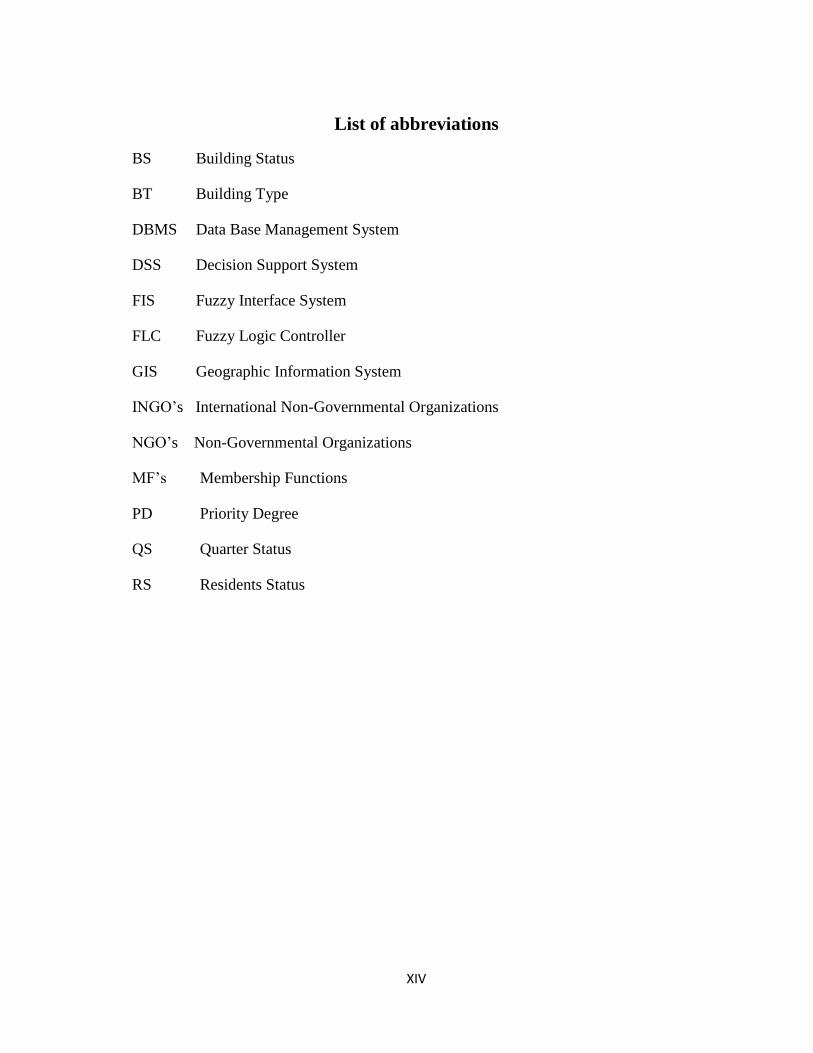
LIST OF ABBREVIATIONS................................................................................................. XIV
CHAPTER 1 ................................................................................................................................. 1
INTRODUCTION ........................................................................................................................ 1
1.1 BACKGROUND: ............................................................................................................... 2
1.2 PROBLEM STATEMENT: .................................................................................................. 2
1.3 AIM AND OBJECTIVES .................................................................................................... 3
1.4 RESEARCH METHODOLOGY ........................................................................................... 4
1.4.1 Reviewing Previous studies ........................................................................................ 4
1.4.2 Gathering Information ............................................................................................... 4
1.4.3 Data Analysis ............................................................................................................. 4
1.4.4 Verification of the Developed Model ......................................................................... 4
1.5 RESEARCH ORGANIZATION ............................................................................................ 4
CHAPTER 2 ................................................................................................................................. 6
LITERATURE REVIEW ............................................................................................................ 6
2.1 INTRODUCTION: .............................................................................................................. 7
2.2 PREVIOUS STUDIES AROUND THE WORLD: ..................................................................... 7
2.3 REGIONAL PREVIOUS STUDIES: ...................................................................................... 9
2.4 PREVIOUS STUDIES IN GAZA STRIP: ............................................................................... 9
2.5 CONCLUSION REMARKS: .............................................................................................. 10
CHAPTER 3 ............................................................................................................................... 11
DECISION SUPPORT SYSTEM ............................................................................................. 11
3.1 INTRODUCTION ............................................................................................................. 12
3.2 DECISION SUPPORT SYSTEM COMPONENTS ................................................................. 12
3.2.1 Dialogue ...................................................................................................................... 12
3.2.2 Data ............................................................................................................................. 13
VIII
3.2.3 Models ......................................................................................................................... 13
3.3 FUZZY SET THEORY ...................................................................................................... 14
Basic Fuzzy Logic: ............................................................................................................... 16
Numerical definition............................................................................................................. 17
Functional definition ............................................................................................................ 17
CHAPTER 4 ............................................................................................................................... 19
DEVELOPED MODEL FOR RECONSTRUCTION PROCESS ......................................... 19
4.1 INTRODUCTION ................................................................................................................... 20
4.2 CONSTRAINTS ON RECONSTRUCTION PROCESS ............................................................ 20
4.2.1 Lack of buildings materials ......................................................................................... 21
4.2.2 Building and rubble removal machines ...................................................................... 22
4.2.3 Pledged money from the donors .................................................................................. 22
4.3 IMPLEMENTATION OF ASSESSMENT CRITERIA EVALUATION USING FUZZY LOGIC
THEORY: ................................................................................................................................... 23
4.3.1 Building status: ........................................................................................................ 26
4.3.2 Residents status ........................................................................................................ 30
4.3.3 Quarter status: ......................................................................................................... 35
4.3.4 Building type: ........................................................................................................... 38
4.4 IMPLEMENTATION OF PRIORITY DETECTION USING FUZZY LOGIC THEORY ................ 39
4.4.1 Objective .................................................................................................................. 39
4.4.2 Implementation of priority degree using fuzzy logic ................................................ 40
CHAPTER 5 ............................................................................................................................... 46
RESULTS AND ANALYSIS ..................................................................................................... 46
5.1 CASE STUDY ....................................................................................................................... 47
5.1.1 Proposed approach verification ............................................................................... 47
5.1.2 Verification using selected data of 2014 conflict ..................................................... 51
5.2 RESULTS ............................................................................................................................. 53
5.3 SUMMARY OF RESULTS ....................................................................................................... 61
CHAPTER 6 ............................................................................................................................... 63
CONCLUSION AND RECOMMENDATIONS ..................................................................... 63
6.1 INTRODUCTION: ............................................................................................................ 64
6.2 CONCLUSIONS ON THE MODEL ..................................................................................... 64
6.3 RESULTS CONCLUSIONS: .............................................................................................. 65
6.4 RECOMMENDATIONS .................................................................................................... 65
REFERENCES ........................................................................................................................... 67
APPENDICES ............................................................................................................................ 71
APPENDIX A ............................................................................................................................. 72

IX
APPENDIX B ............................................................................................................................. 73
APPENDIX C ............................................................................................................................. 76
X
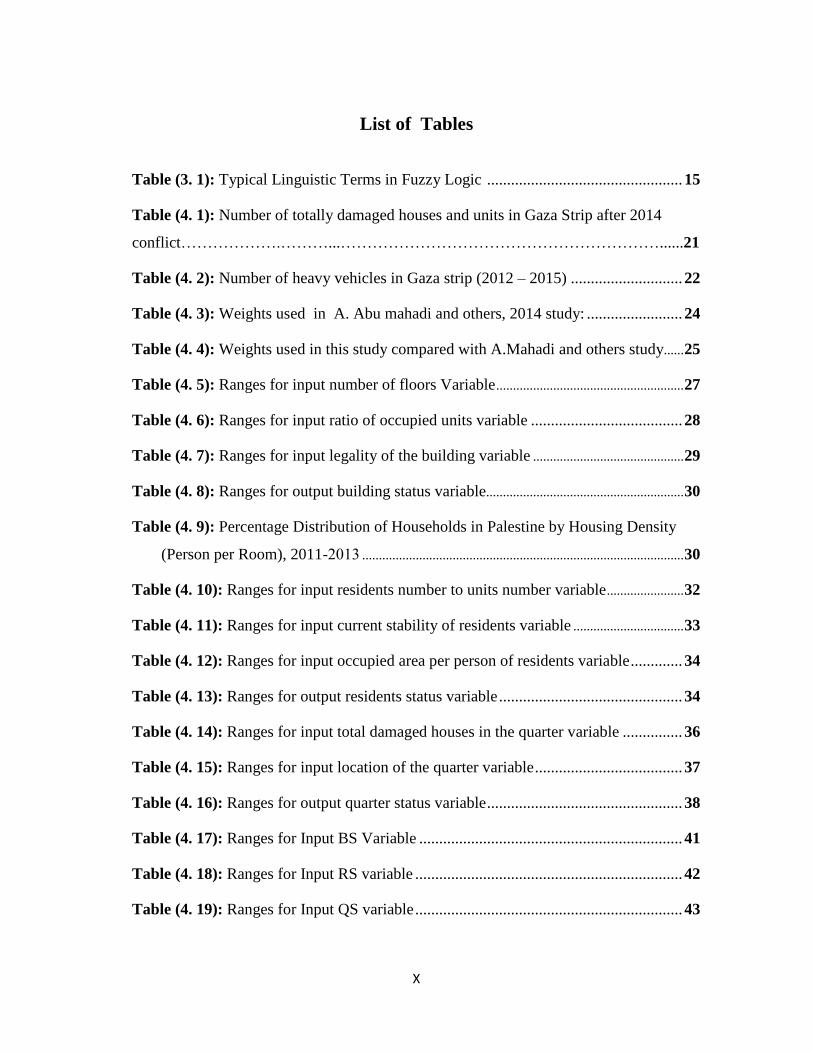
List of Tables
Table (3. 1): Typical Linguistic Terms in Fuzzy Logic ................................................. 15
Table (4. 1): Number of totally damaged houses and units in Gaza Strip after 2014
conflict……………….………...……………………………………………………......21
Table (4. 2): Number of heavy vehicles in Gaza strip (2012 – 2015) ............................ 22
Table (4. 3): Weights used in A. Abu mahadi and others, 2014 study: ........................ 24
Table (4. 4): Weights used in this study compared with A.Mahadi and others study...... 25
Table (4. 5): Ranges for input number of floors Variable ........................................................ 27
Table (4. 6): Ranges for input ratio of occupied units variable ...................................... 28
Table (4. 7): Ranges for input legality of the building variable ............................................. 29
Table (4. 8): Ranges for output building status variable........................................................... 30
Table (4. 9): Percentage Distribution of Households in Palestine by Housing Density
(Person per Room), 2011-2013 ................................................................................................ 30
Table (4. 10): Ranges for input residents number to units number variable ....................... 32
Table (4. 11): Ranges for input current stability of residents variable ................................. 33
Table (4. 12): Ranges for input occupied area per person of residents variable ............. 34
Table (4. 13): Ranges for output residents status variable .............................................. 34
Table (4. 14): Ranges for input total damaged houses in the quarter variable ............... 36
Table (4. 15): Ranges for input location of the quarter variable ..................................... 37
Table (4. 16): Ranges for output quarter status variable ................................................. 38
Table (4. 17): Ranges for Input BS Variable .................................................................. 41
Table (4. 18): Ranges for Input RS variable ................................................................... 42
Table (4. 19): Ranges for Input QS variable ................................................................... 43
XI
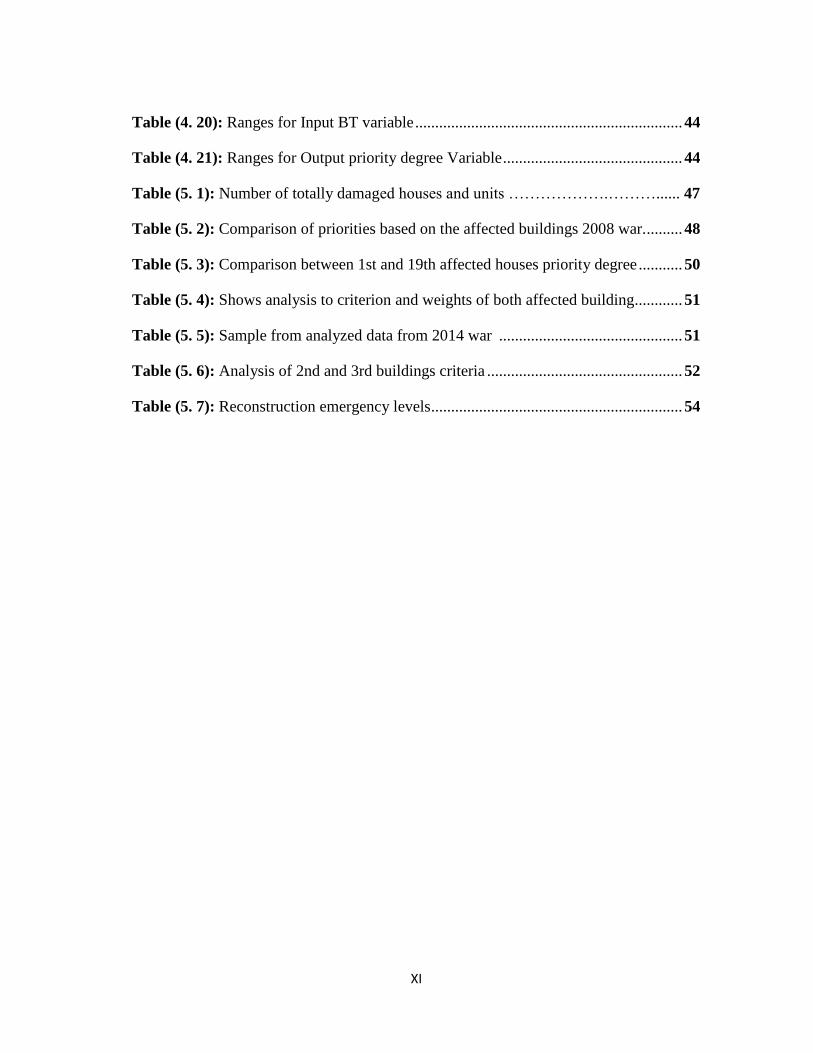
Table (4. 20): Ranges for Input BT variable ................................................................... 44
Table (4. 21): Ranges for Output priority degree Variable ............................................. 44
Table (5. 1): Number of totally damaged houses and units ……………….………...... 47
Table (5. 2): Comparison of priorities based on the affected buildings 2008 war. ......... 48
Table (5. 3): Comparison between 1st and 19th affected houses priority degree ........... 50
Table (5. 4): Shows analysis to criterion and weights of both affected building ............ 51
Table (5. 5): Sample from analyzed data from 2014 war .............................................. 51
Table (5. 6): Analysis of 2nd and 3rd buildings criteria ................................................. 52
Table (5. 7): Reconstruction emergency levels ............................................................... 54
XII
List of Figures
Figure( 3. 1): Set theory representation ......................................................................... 15
Figure (3. 2): Fuzzy Set Membership Function Representation ..................................... 16
Figure (3. 3): Basic Fuzzy Logic Controller (FLC) ....................................................... 17
Figure (4. 1): Implemented fuzzy model for Building Status criterion…..…………….26
Figure (4. 2): Specifying the First Input Variable as WF
BS............................................. 27
Figure (4. 3): Specifying the second Input Variable as WU
BS ........................................ 28
Figure (4. 4): Specifying the Third Input Variable as WL
BS ........................................... 29
Figure (4. 5): Specifying the output Variable as WBS ..................................................... 29
Figure (4. 6): Percentage Distribution of Households in Palestine by Housing Density
(Person per Room), 2013 .......................................................................................... 31
Figure (4. 7): Implemented fuzzy model for Residents Status criterion ........................ 31
Figure (4. 8): Specifying the first input Variable as WRRS ........................................... 32
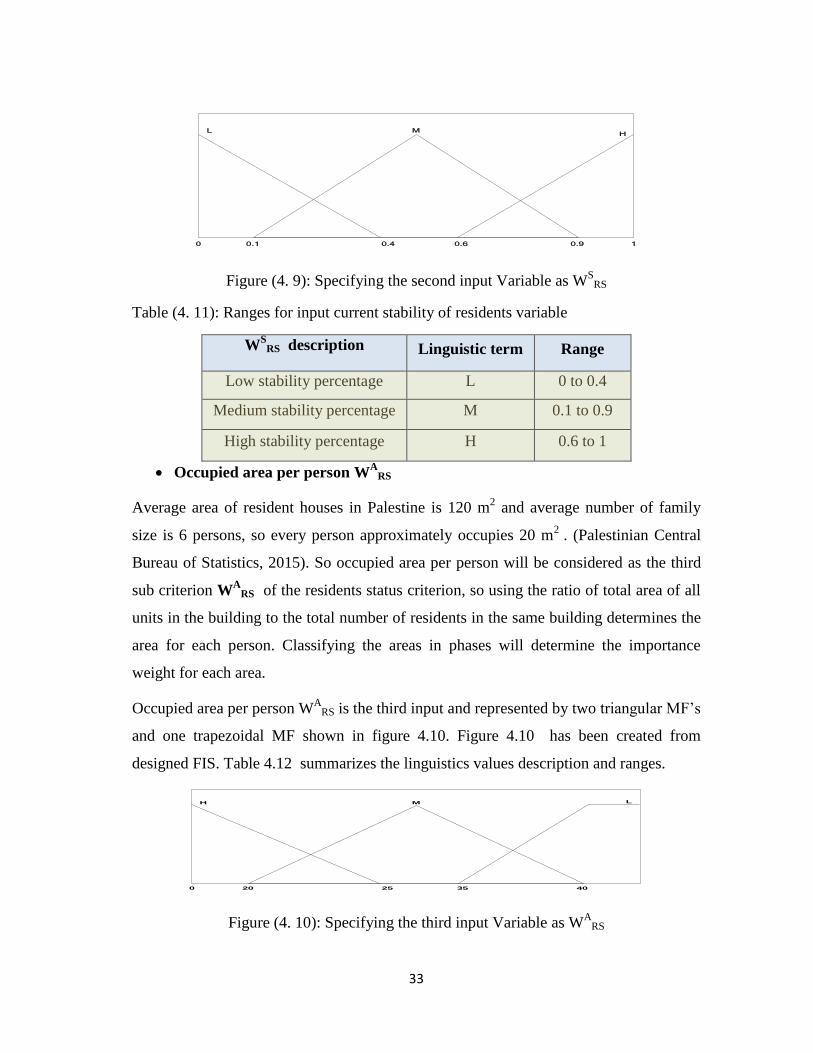
Figure (4. 9): Specifying the second input Variable as WSRS ....................................... 33
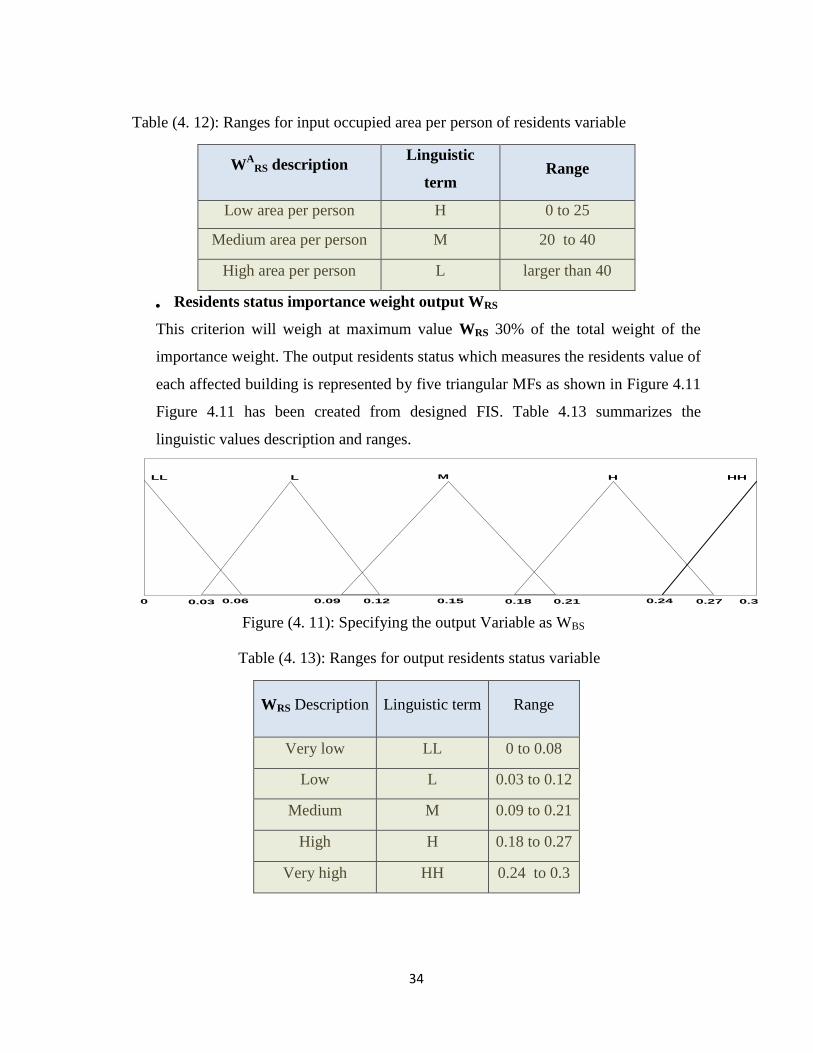
Figure (4. 10): Specifying the third input Variable as WARS ....................................... 33
Figure (4. 11): Specifying the output Variable as WBS ................................................. 34
Figure (4. 12): Implemented fuzzy model for Quarter Location criterion ..................... 35
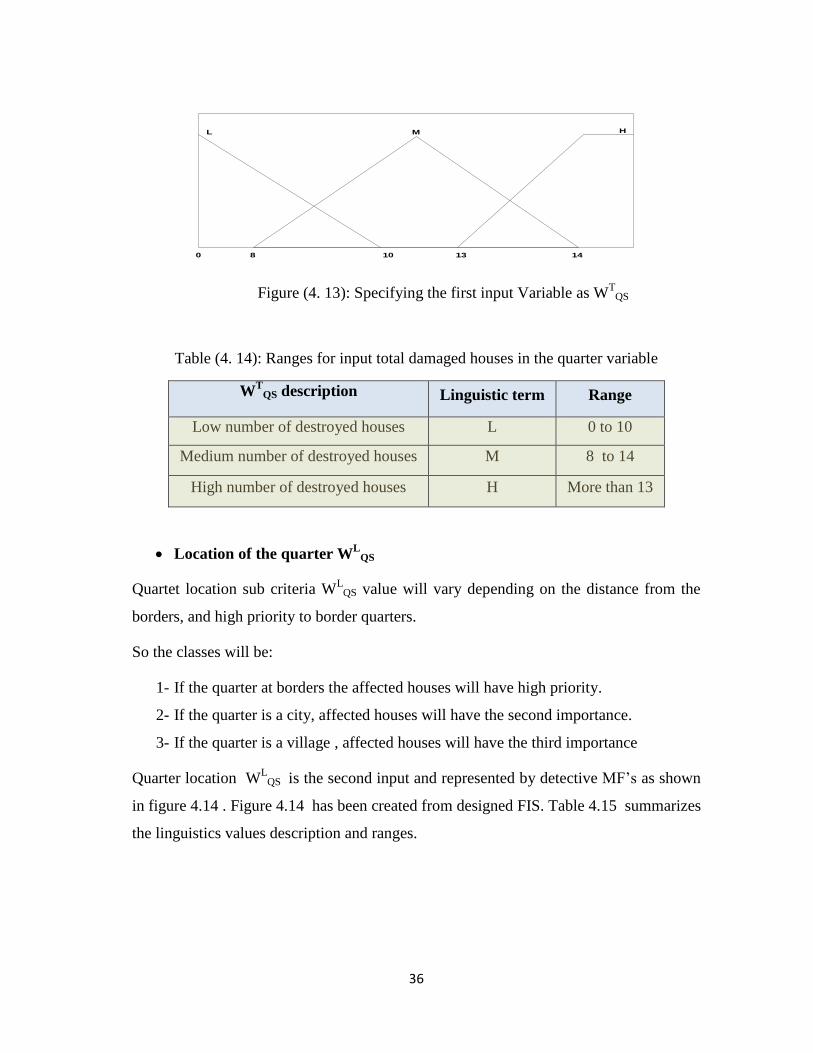
Figure (4. 13): Specifying the first input Variable as WTQS ......................................... 36
Figure (4. 14): Specifying the second input Variable as WLQS .................................... 37
Figure (4. 15): Specifying the output Variable as WQS ................................................. 37
Figure (4. 16): Building type criteria flow chart ............................................................. 38
Figure (4. 17): Implemented fuzzy model ...................................................................... 41
Figure (4. 18): Specifying the First Input Variable as BS .............................................. 41
XIII
Figure (4. 19): Specifying the First Input Variable as RS .............................................. 42
Figure (4. 20): Specifying the First Input Variable as QS .............................................. 43
Figure (4. 21): Specifying the First Input Variable as BT .............................................. 43
Figure (4. 22): Specifying the Output Variable priority degree ..................................... 44
Figure (5. 1): priority degree comparison between AHP and Fuzzy…………………...50
Figure (5. 2): Priority Degree Percentages –North Governorate .................................... 53
Figure (5. 3) : Color Coded Priority Distribution – Om Al Nasser Municipality .......... 55
Figure (5. 4): Color Coded Priority Distribution – Beit – Hanoon Municipality ........... 56
Figure (5. 5): Color Coded Priority Distribution – Jabalya Municipality ...................... 57
Figure (5. 6): Color Coded Priority Distribution – Beit_Lahia Municipality ................. 58
Figure (5. 7): Priority Degree Percentages –GAZA Governorate .................................. 59
Figure (5. 8): Priority Degree Percentages –Middle of Gaza Governorate .................... 60
Figure (5. 9): Priority Degree Percentages –Khan Yonus Governorate ......................... 60
Figure (5. 10): Priority Degree Percentages –Rafah Governorate .................................. 61
Figure (5. 11): Priority Degree Ranges and Results –Gaza Strip ................................... 62
XIV
List of abbreviations
BS Building Status
BT Building Type
DBMS Data Base Management System
DSS Decision Support System
FIS Fuzzy Interface System
FLC Fuzzy Logic Controller
GIS Geographic Information System
INGO’s International Non-Governmental Organizations
NGO’s Non-Governmental Organizations
MF’s Membership Functions
PD Priority Degree
QS Quarter Status
RS Residents Status

1
Chapter 1
Introduction
2
Chapter 1
Introduction
1.1 Background:
Housing is essential to the well-being and development of most societies. It is a
complex asset, with links to livelihoods, health, education, security and social and
family stability. Housing acts as a social center for family and friends, a source of
pride and cultural identity, and a resource of both political and economic
importance. Housing is also an extremely vulnerable asset, and the destruction of
homes or their loss through displacement or dispossession is one of the most visible
effects of conflict and natural disaster. Housing reconstruction should be a more
prominent element in post-conflict and post-disaster programming than is currently
the case (Barhkat, 2003).
Post war reconstruction of buildings is often construed as a developmental
responsibility rather than properly a humanitarian concern, and consequently tends
to be low on the humanitarian agenda. Arguably, there is a clear humanitarian
imperative to provide victims of conflict and disaster with basic shelter, in the same
sense as there is a humanitarian imperative to ensure access to water, sanitation,
food and healthcare. Unlike other relief items such as food aid or medicine, housing
is a significant, long-term and non-consumable asset. Housing reconstruction is a
complex process, and success typically requires a good deal of time and preparation.
It argues that housing reconstruction interventions should take into account local
resources, needs, perceptions, expectations, potentials and constraints (Barahkat,
1993).
1.2 Problem Statement:
In Gaza strip after 3 wars during 7 years there are a lot of houses still not
reconstructed. This delay in reconstruction process refers to using simple criteria
and absence of clear strategy to reconstruction process in the organizations that
mange the reconstruction process.
3
Post war reconstruction of damaged buildings must be well managed. The
management can be achieved by creating a suitable program fitting with the
situation in stricken area such as Gaza Strip which is limited of resources.
This system will be by defining steps to distribute reconstruction and determining
the priority of services and affected people reconstruction according to specific
criteria.
All these steps are to minimize the time and to ensure fair distribution of
construction materials and financial support for affected people.
This problem appears in many societies after disasters, because of the big numbers
of affected people and their needs to be satisfied. Another issue appeared when
there is a lack of construction machines and equipment and human resources which
makes it hard to start working on all destructed houses at the same time.
Add to this, siege of Gaza aggravate the problem of reconstruction process, due to
very little amount of allowed materials to distributed in Gaza Strip and the lack of
financial support from donors.
1.3 Aim and Objectives
The main aim of this study is to establish an effective model for identifying the
priorities of the post-war reconstruction based on a predefined specific criteria, so the
objectives to be achieved are:
1. Study the current criteria that is used to evaluate the priorities to distribute the
available financial and human aids to affected people from disasters.
2. Investigating the suitability of the current criteria for the situation of Gaza.
3. Develop a model with suitable criteria for reconstruction process in Gaza strip.
4. Establish a suitable fuzzy logic model to evaluate the alternatives.
5. Apply real cases to the validated management system on the reconstruction
process in Gaza.
4
1.4 Research Methodology
To undertake the current study, specific steps must be followed to achieve the desired
aims and the objectives.
1.4.1 Reviewing Previous studies
Various publications, for example books, technical papers and reports, were
critically reviewed for this study to identify if there is any suitable methods
and criterion to determine the priorities of houses to be reconstructed in Gaza
Strip.
1.4.2 Gathering Information
Several institutions and organizations existed in the Gaza Strip, for example
The Association of Engineers, Ministry of Public Works and Housing,
Association of Labors, Nongovernmental organizations, United Nations
Associations, were approached, followed by conducting interviews with
specialized staff involving in the reconstruction process. The primary
concern of these interviews sought addressing the strategies adopted to
manage the process of reconstruction in Gaza Strip.
1.4.3 Data Analysis
The data collected of 2014 conflict on Gaza will be analyzed using tools for
decision support system like fuzzy logic.
1.4.4 Verification of the Developed Model
The reasonable selected criteria for Gaza Strip will be verified by applying
them through built model for the reconstruction process in Gaza Strip after
2014 conflict.
1.5 Research Organization
Chapter one : explains a background about the topic of the study, problem statement,
research aim and objectives and methodology.
5
Chapter two : explains the researches that discussed management process after disasters
in many countries. This chapter separated into global studies, regional studies and case
of Gaza Strip reconstruction management after 2008 conflict.
Chapter three : discusses decision support system and tools used to develop systems to
help decision makers to reach the best decision.
Chapter four : shows the built model to determine the importance weight of affected
buildings after 2014 conflict based on specified criterion gathered from previous studies
and information from Palestinian Central Bureau of Statistics.
Chapter five : explains and discusses the results after running the model on data
collected from ministry of public works and housing for affected buildings after 2014
conflict.
Chapter 6 : includes conclusion and recommendations in addition to future thoughts for
future research.

6
Chapter 2
Literature Review
7
Chapter 2
Literature Review
2.1 Introduction:
The ongoing natural and human made disasters have been making researchers focus on
developing reconstruction management in order to ensure basic living conditions for affected
people. It is worthwhile to search in resourcing, integrated development, sustainable
construction and embodied resilience, but this require either existing tools to be adapted or
new tools developed to allow efficient management and evaluation of reconstruction process
(Yi & Yang, 2014).
2.2 Previous studies around the world:
Sultan Barahkat (2003) studied the disaster in Philippines, he noticed that the
beneficiaries of reconstruction program had to satisfy a set of stringent criteria in order
to be eligible. These criteria are, having a secure land title, residence in an existing
dwelling on the land, poorness, and being excepted from assistance by another agency
(Barhkat, 2003).
Due to Mahdi and Mahdi, Iran has a Housing Foundation (semi-governmental) start the
reconstruction of affected houses after an earth quake. But the government had prepared
temporary shelters or tents for survived people. In the reconstruction or rehabilitation ,
Housing Foundation started building in rural area because of simplicity of building.
After that it started preparing to reconstruct in urban area with a special team has
engineers and architecture and specialists (Mahdi & Madi, 2013).
Boen and Jigyasu (2003) discussed the case of relocating two villages in Flores,
Indonesia after 1992 earthquake, they found that relocated people from their original
villages beside the beach didn’t adapt with new places, and they returned to their
original villages (Boen & Jigyasu, 2003).
Roosli and Collinsb (2016) discussed the case of natural disaster stroked Kelantan in
Malaysia, when the flood destructed so many homes and led to high lose in humans life.
They studied the main reason of destroying buildings and the best design to avoid
similar disaster losses, they suggested a proper design for the area and recommended
that organizations such as NGOs, universities and private firms with uniform based
8
bodies can be involved in earlier stage of reconstruction to achieve the goal of
reconstruction (Roosli & Collinsb, 2016).
Jigyasu (2001) studied reconstruction program following Marathwada earth quake of
1993 in India, he found that the developers and donors suggested to rebuild the affected
buildings in new area with more organized plan to build organized city, where it was
located so far from the original village. But this plan failed because it was not suitable
for villagers and didn’t match their habitants and traditions and incompatible with their
life. Beside this, they lost their agriculture lands and become landless (Jigyasu, 2001).
Vladimir Ladinski (1995) as cited in Boen and Jigyasu (2003) had done in his study
analyses the impact of internationally led 1963 earthquake reconstruction of Skopje. His
study also reveals that the immediate housing, which was provided by building on
agricultural land away from the city center, has caused many problems. Also the
acceptance of ‘modern’ ideas for the city center redevelopment led to transformation of
the city and departure from traditional organic approach to planning. The decision to
protect buildings with technology solely based on earthquake engineering principles led
to damage of integrity, identity and the originality of the built heritage (Boen & Jigyasu,
2003).
Robert Geipel (1991) had done an interesting study on long-term consequences (1976-
1988) of reconstruction of Friuli, Italy after 1976 earthquake. In his detailed analysis of
three settlements, Geipel points out that ‘modern’ layout and architecture has more or
less satisfied the basic needs of inhabitants. However, he cited problems like “less
communication”, “more anonymity” and “worse neighborhood relationships” due to
lack of cultural considerations in reconstruction (Geipel, 1991).
After war in Kosovo, housing reconstruction program collected the data of affected
people from the war and School of Technology in Italy studied the cases and determined
the priority degree for beneficiaries using predefined criterion these criterion were
residents stability, family size, social situation of the family, poorness degree of the
family and the family at risk from their present living conditions. The criterion were
developed by Municipal Housing Committees composed of representatives from local
and national government, and external agencies (Corrado Minervini, School of
Technology, Architecture and Towns in Developing Countries, 2002).
9
2.3 Regional previous studies:
Barahkat (1993) has done another interesting study on long-term impact of the
contractor built reconstruction in Yemen following the 1982 Dhamar earthquake. Here,
Government gave more emphasis to the tender (contractor built approach) by relocating
villages, rather than the self-help or repair approaches. Barahkat discovered that in some
cases, new settlements within an acceptable distance were actually competing with the
old ones since they were neither close enough to merge with the original village, nor far
enough away to establish a new center. Moreover, the relocation of villages closer to
main roads and the provision of services and infrastructure have had a detectable impact
on the economic and social structure of settlements (Barahkat, 1993).
El-Masri and Kellett (2001) prepared a study about reconstruction in Lebanon after the
civil war (1975 to 1991) and discussed the top-down approach to reconstruction. They
categorized the displaced people into three categories: Peoples live in refugee and
started rebuilding their homes in the origin village, Peoples live in refugee and didn’t
start rebuilding their homes in the origin village and People live in original village and
started rebuilding their homes. The researcher concluded from their study that physical
results does not ensure that people will stay in their villages and establishing local
committees encourages reconciliatory dialogues between opposing groups which should
be expanded to encourage a common vision towards village reconstruction (EL_Masri &
Kellet, 2001).
Due to consequence and variety of disasters in Egypt, Abu_Alnour discussed this issue
in full length article. He suggested a plan to efficient disaster management in Egypt. He
suggested guidelines to follow in each disaster, studying risk and loss management,
control of events, resource management and impact reduction. These steps lead to
efficient disaster management system in Egypt. To prove the availability of his system,
he applied the system on the provision of integral post disaster settlements in Egypt
(Abu_Alnoour, 2014).
2.4 Previous studies in Gaza Strip:
After 2008 conflict on Gaza Strip, 3408 units were destroyed and 20000 persons lost
their homes and became homeless. And with the siege on Gaza through this period and
limitation of building materials, authorities suggested a plan to rebuild the affected
10
buildings, and they stated criterion to choose the first affected buildings to rebuild. The
starting was with ground floor units and with specific criterion. These criterion were, the
land must be legal, the unit busy at the time of damage, there is no other home for the
affected person and the rebuilding must be in the same land of damage if there is no any
constraints. This plan was to rebuild 1000 units after 3 years of really hard closure and
siege on Gaza Strip (Oudeh & Al_Ostaz, 2015).
2.5 Conclusion remarks:
Some researches around the world developed new tools to allow efficient
management and evaluation of reconstruction process , but this depends on the
capacity and the economy of affected country. On the other hand, other
researchers had to use existing tools to ensure basic living conditions for affected
people. In this study many constraints must be taken into account and existing
tools must be adapted to allow fair reconstruction management.
11
Chapter 3
Decision Support System
12
Chapter 3
Decision Support System
3.1 Introduction
Decision Support Systems (DSS) were defined by Scott (1971) as “interactive computer-
based systems, which help decision makers utilize data and models to solve unstructured
problems.” Keen & Scott (1978) defined a DSS as a computer-based support system for
management DMs who deal with semi-structured problems. A DSS couples the
intellectual resources of individuals with the capabilities of a computer to improve the
quality of decisions.
A popular conceptual framework for DSS evolved from work at the IBM Research
Laboratory in San Jose, California, during the late 1970s. This framework was first
articulated by Sprague (1980) and developed later by Sprague & Carlson (1982). Watson
& Sprague (1989) depicted the component parts of a DSS as dialogue, data, and model.
In this conceptualization, the dialogue between the user and the system provides some
data that support the system, and models provide the necessary analysis capability.
3.2 Decision Support System Components
3.2.1 Dialogue
Dialogues allow commands, requests, and data to be entered into the DSS and
results and information to be generated. A well-designed dialogue should
provide a user-friendly interface that allows users to avail themselves of the
full potential of the system. Bennett (1977) defined dialogue components to
include the knowledge base, the action language, and the presentation language
(Bennett, 1977). The knowledge base includes what the user knows about the
decision and about how to use the DSS. The action language serves to direct
the system’s actions. The actions that the user can take to control the DSS can
be described in a variety of ways, depending on the system’s design. For
example, some DSS use an input-output form approach. The user is provided
13
an input form and enters the required data. After all the data are input, the DSS
performs the analysis and presents the results. The presentation language
provides alternative presentations of the system’s responses. The output is
often presented on the screen, internalized by the DM’s, and discarded.
3.2.2 Data
Data play an important role in a DSS. Data can be either stored in the DSS and
accessed by the user or inputted manually to the models for processing. The
capability of a DSS is constrained by the availability and the accuracy of the
data. Data can be categorized as external data (data outside organizations) and
internal data (data inside organizations). Typically, data can be obtained in two
ways. One way is to have the database management system (DBMS) extract
the transaction data, summarize them, and make the results available to the
DSS. The other option is to extract the data but have the summarization done
externally using a computerized process or manual processing (Watson &
Sprague, 1989).
In addition, other internal data may be needed such as subjective estimates
from managers. These data are seldom available from normal data processing
activities but are sometimes crucial in decision making.
3.2.3 Models
Models provide the analysis capabilities for a DSS and can be classified as
optimization or descriptive (Watson & Sprague, 1989). An optimization model
seeks to identify points of maximization or minimization. It is usually utilized
in a profit or revenue maximization or cost minimization scenario. On the other
hand, descriptive models serve to describe the behavior of a system, but do not
suggest optimizing conditions. Models can also be classified as strategic,
tactical, and operational Watson & Sprague, covering a wide variety of issues
from company objectives planning (strategic), to worker requirements planning
(tactical), to credit scoring and production scheduling (operational). In addition
14
to strategic, tactical, and operational models, the model base includes model-
building blocks and subroutines (Watson & Sprague, 1989). These tools can be
adopted separately for ad hoc decision support and might range from a
designed subroutine for solving a specific problem to a packaged set of
programs for exploring a generic class of problems (Watson & Sprague, 1989).
3.3 Fuzzy set theory
Fuzzy control, introduced in 1970’s, occupies an obvious attention among intelligent
controllers. Fuzzy set theory, which has been derived to overcome the roughness of
classical set theory, is the kernel of fuzzy logic based on approximating rather than
precision. Knowledge based systems developers developed fuzzy logic to define system
values as true or false, fuzzy logic depends on information provided by membership
functions (MFs) and uses fuzzy sets and rules for controlling actions. There are many
available computer applications and software for designing and building such fuzzy
logic model. (Abhisek, 2007)
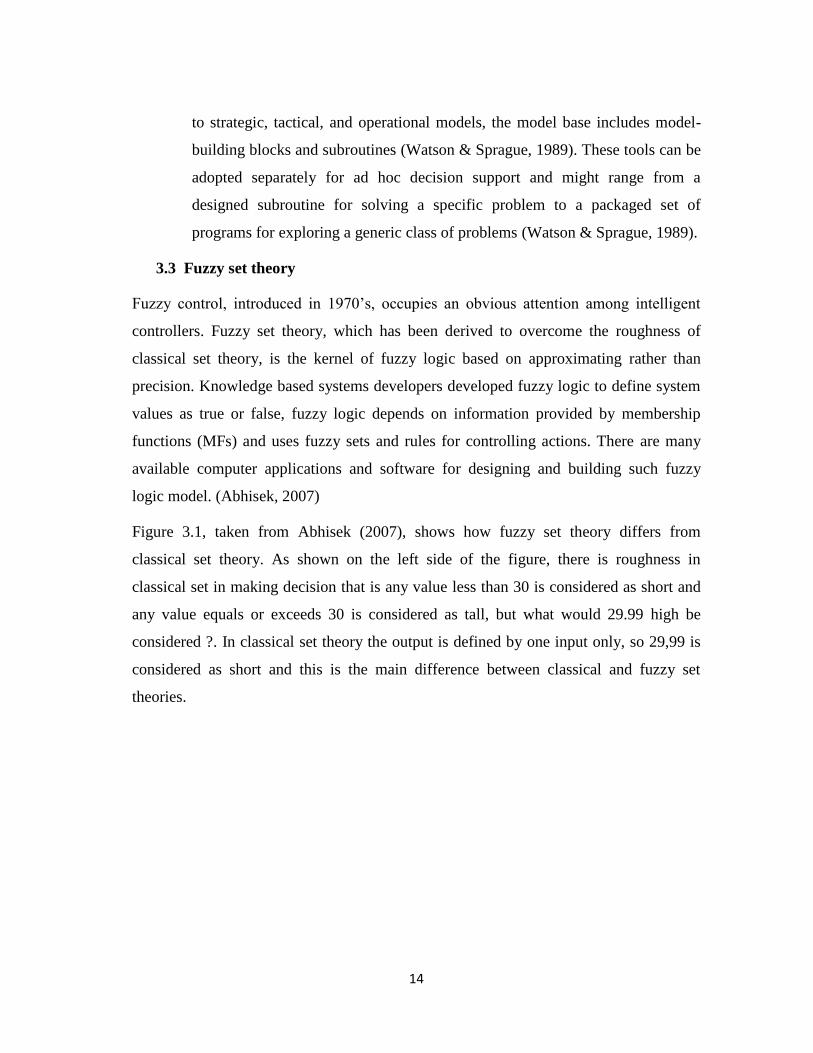
Figure 3.1, taken from Abhisek (2007), shows how fuzzy set theory differs from
classical set theory. As shown on the left side of the figure, there is roughness in
classical set in making decision that is any value less than 30 is considered as short and
any value equals or exceeds 30 is considered as tall, but what would 29.99 high be
considered ?. In classical set theory the output is defined by one input only, so 29,99 is
considered as short and this is the main difference between classical and fuzzy set
theories.
15
Figure (3. 1): Set theory representation (Abhisek, 2007)
On the right side of Figure 3.1 , the output of fuzzy set is not defined by single input .It
is defined by a set of MFs and rules as part of both inputs. Fuzzy set theory gives more
realistic answer such that 29.99 height is 90% tall and 10% short or something different
according to how user defines MFs. In fuzzy logic there is number of linguistic terms
can be used in defining MFs.
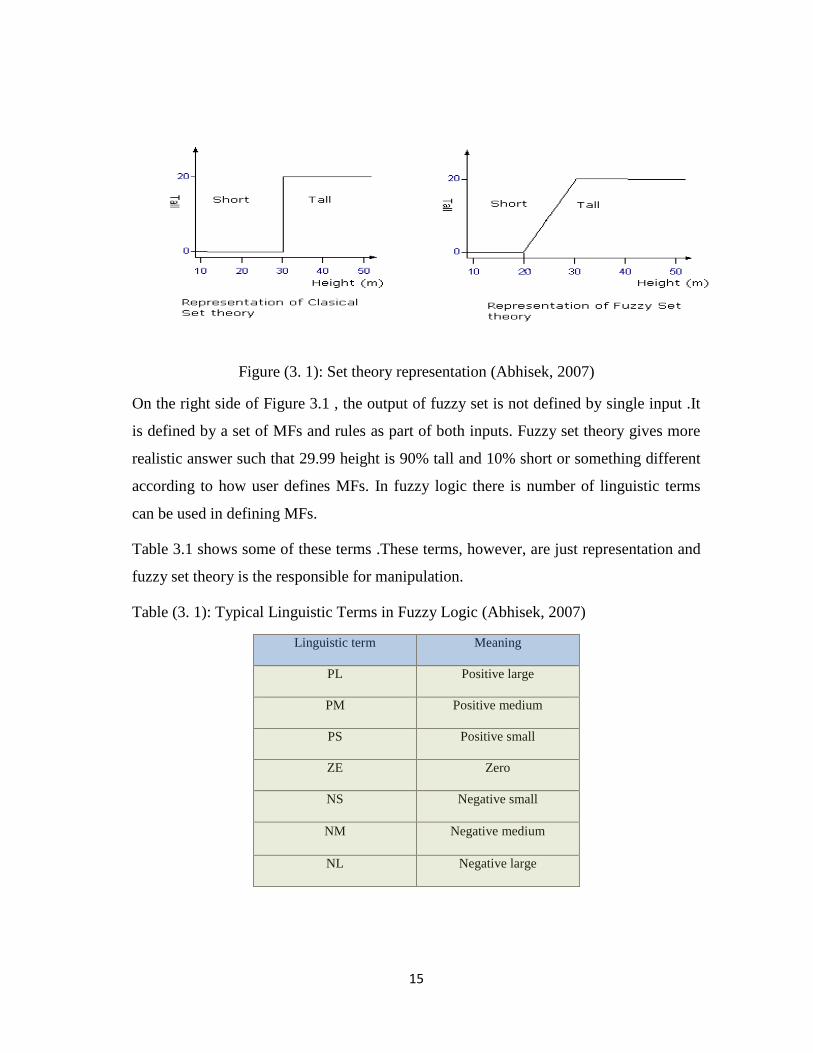
Table 3.1 shows some of these terms .These terms, however, are just representation and
fuzzy set theory is the responsible for manipulation.
Table (3. 1): Typical Linguistic Terms in Fuzzy Logic (Abhisek, 2007)
Linguistic term Meaning
PL Positive large
PM Positive medium
PS Positive small
ZE Zero
NS Negative small
NM Negative medium
NL Negative large
16
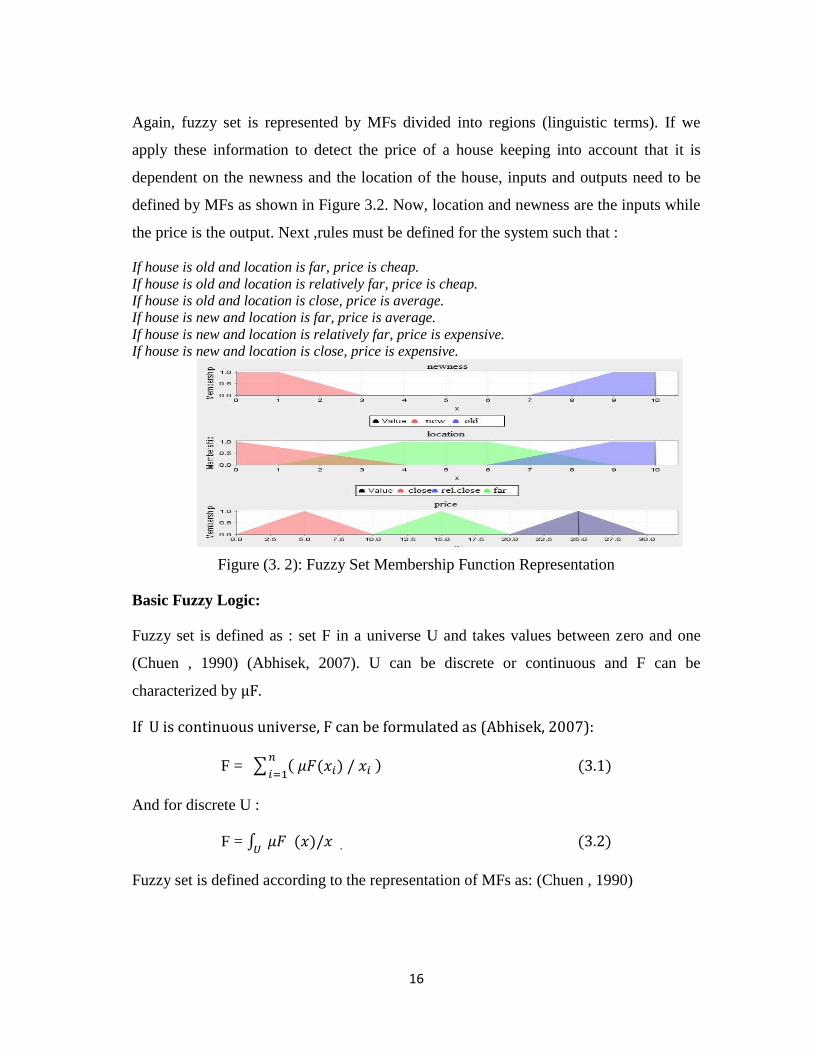
Again, fuzzy set is represented by MFs divided into regions (linguistic terms). If we
apply these information to detect the price of a house keeping into account that it is
dependent on the newness and the location of the house, inputs and outputs need to be
defined by MFs as shown in Figure 3.2. Now, location and newness are the inputs while
the price is the output. Next ,rules must be defined for the system such that :
If house is old and location is far, price is cheap.
If house is old and location is relatively far, price is cheap.
If house is old and location is close, price is average.
If house is new and location is far, price is average.
If house is new and location is relatively far, price is expensive.
If house is new and location is close, price is expensive.
Figure (3. 2): Fuzzy Set Membership Function Representation
Basic Fuzzy Logic:
Fuzzy set is defined as : set F in a universe U and takes values between zero and one
(Chuen , 1990) (Abhisek, 2007). U can be discrete or continuous and F can be
characterized by μF.
If U is continuous universe, F can be formulated as (Abhisek, 2007):
F = ∑ ( 𝜇𝐹(𝑥𝑖) / 𝑥𝑖 )𝑛
𝑖=1 (3.1)
And for discrete U :
F = ∫ 𝜇𝐹 (𝑥)/𝑥 .
𝑈 (3.2)
Fuzzy set is defined according to the representation of MFs as: (Chuen , 1990)
17
Numerical definition
Each input in the fuzzy set is a range of numerical values and the output is evaluated
only for those values.
Functional definition
Unlike numerical definition, MFs are represented functionally. Function can be
sinusoidal, trapezoidal, triangular and sigmoid ..etc.
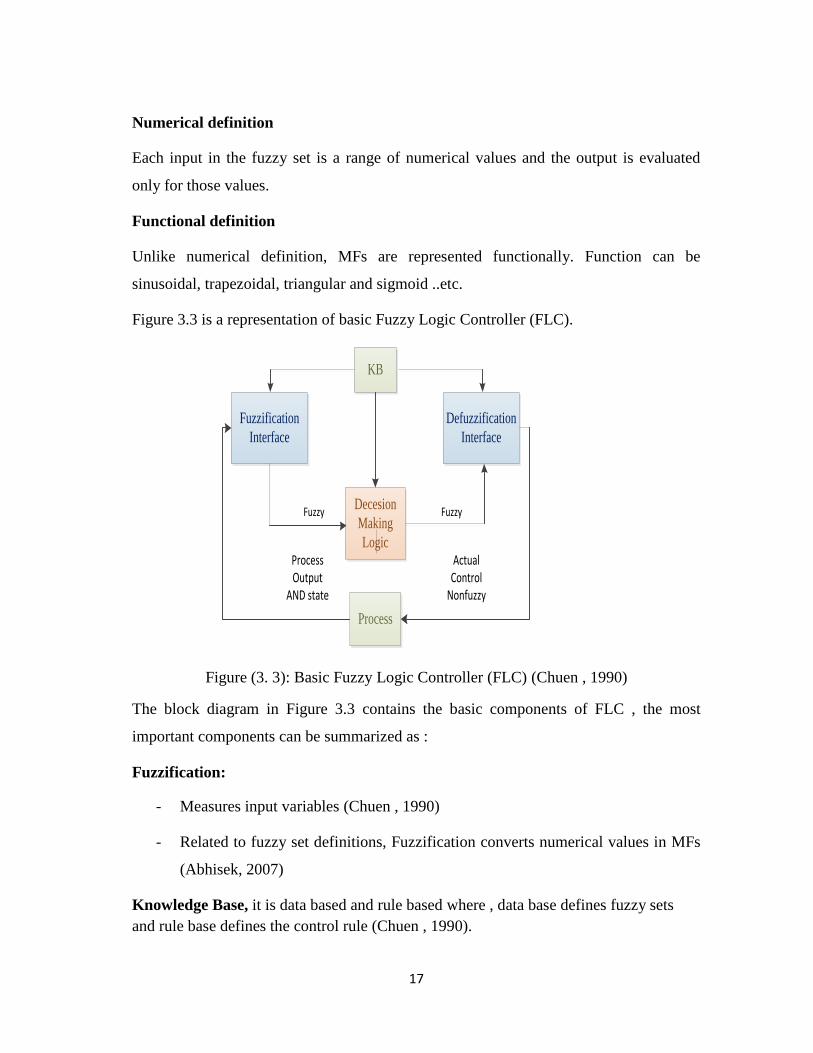
Figure 3.3 is a representation of basic Fuzzy Logic Controller (FLC).
Fuzzification
Interface
KB
Defuzzification
Interface
Decesion
Making
Logic
Process
FuzzyFuzzy
Actual Control
Nonfuzzy
Process Output
AND state
Figure (3. 3): Basic Fuzzy Logic Controller (FLC) (Chuen , 1990)
The block diagram in Figure 3.3 contains the basic components of FLC , the most
important components can be summarized as :
Fuzzification:
- Measures input variables (Chuen , 1990)
- Related to fuzzy set definitions, Fuzzification converts numerical values in MFs
(Abhisek, 2007)
Knowledge Base, it is data based and rule based where , data base defines fuzzy sets
and rule base defines the control rule (Chuen , 1990).

18
Decision Making Logic, in this step, fuzzy logic rules examines knowledge
representations from previous step (Abhisek, 2007)
Defuzzification, converts logic values taken from fuzzy set to scaled values. Away from
accounting all methods, CENTROID and MAXIMUM are the most common for
Defuzzification (Abhisek, 2007)
19
Chapter 4
Developed Model for
Reconstruction Process
20
Chapter 4
Developed Model for Reconstruction Process
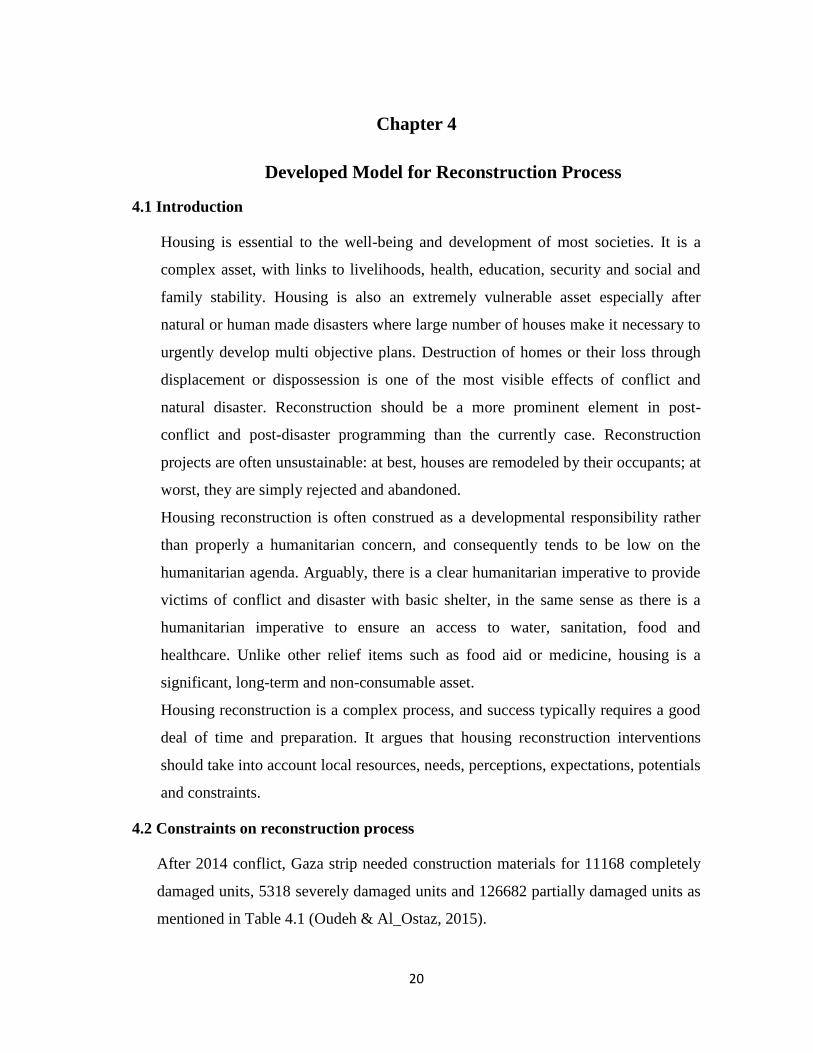
4.1 Introduction
Housing is essential to the well-being and development of most societies. It is a
complex asset, with links to livelihoods, health, education, security and social and
family stability. Housing is also an extremely vulnerable asset especially after
natural or human made disasters where large number of houses make it necessary to
urgently develop multi objective plans. Destruction of homes or their loss through
displacement or dispossession is one of the most visible effects of conflict and
natural disaster. Reconstruction should be a more prominent element in post-
conflict and post-disaster programming than the currently case. Reconstruction
projects are often unsustainable: at best, houses are remodeled by their occupants; at
worst, they are simply rejected and abandoned.
Housing reconstruction is often construed as a developmental responsibility rather
than properly a humanitarian concern, and consequently tends to be low on the
humanitarian agenda. Arguably, there is a clear humanitarian imperative to provide
victims of conflict and disaster with basic shelter, in the same sense as there is a
humanitarian imperative to ensure an access to water, sanitation, food and
healthcare. Unlike other relief items such as food aid or medicine, housing is a
significant, long-term and non-consumable asset.
Housing reconstruction is a complex process, and success typically requires a good
deal of time and preparation. It argues that housing reconstruction interventions
should take into account local resources, needs, perceptions, expectations, potentials
and constraints.
4.2 Constraints on reconstruction process
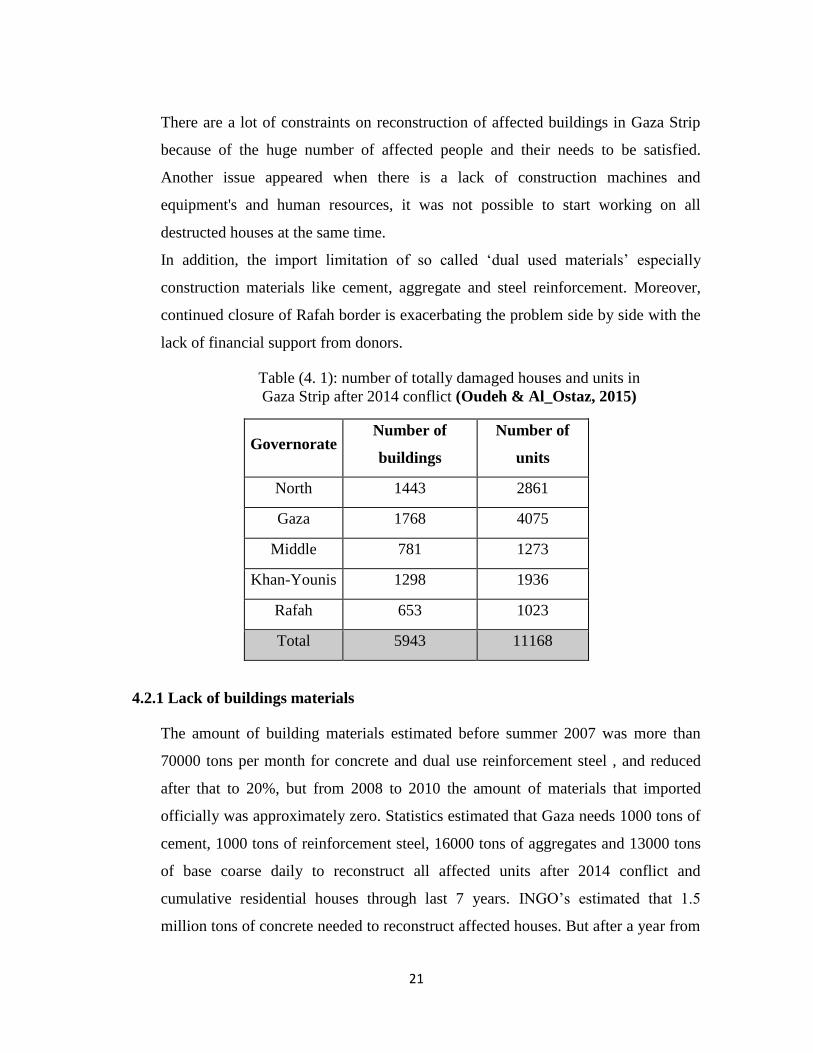
After 2014 conflict, Gaza strip needed construction materials for 11168 completely
damaged units, 5318 severely damaged units and 126682 partially damaged units as
mentioned in Table 4.1 (Oudeh & Al_Ostaz, 2015).
21
There are a lot of constraints on reconstruction of affected buildings in Gaza Strip
because of the huge number of affected people and their needs to be satisfied.
Another issue appeared when there is a lack of construction machines and
equipment's and human resources, it was not possible to start working on all
destructed houses at the same time.
In addition, the import limitation of so called ‘dual used materials’ especially
construction materials like cement, aggregate and steel reinforcement. Moreover,
continued closure of Rafah border is exacerbating the problem side by side with the
lack of financial support from donors.
Table (4. 1): number of totally damaged houses and units in
Gaza Strip after 2014 conflict (Oudeh & Al_Ostaz, 2015)
Governorate Number of
buildings
Number of
units
North 1443 2861
Gaza 1768 4075
Middle 781 1273
Khan-Younis 1298 1936
Rafah 653 1023
Total 5943 11168
4.2.1 Lack of buildings materials
The amount of building materials estimated before summer 2007 was more than
70000 tons per month for concrete and dual use reinforcement steel , and reduced
after that to 20%, but from 2008 to 2010 the amount of materials that imported
officially was approximately zero. Statistics estimated that Gaza needs 1000 tons of
cement, 1000 tons of reinforcement steel, 16000 tons of aggregates and 13000 tons
of base coarse daily to reconstruct all affected units after 2014 conflict and
cumulative residential houses through last 7 years. INGO’s estimated that 1.5
million tons of concrete needed to reconstruct affected houses. But after a year from
22
2014 conflict the amount of cement allowed to enter Gaza Strip was 338000 tons,
which means that with this range (22% of actual quantity), reconstruction process
needs 4 years to complete (Ead, 2015).
Add to this Karm Abu-Salem cross point is not suitable and not prepared with
sufficient technical equipment and facilities limits the amount of trucks that can
enter Gaza Strip, where its capacity is 700 tons per day, but 5000 tons are needed
daily to reconstruct affected houses after 2014 conflict (Ead, 2015).
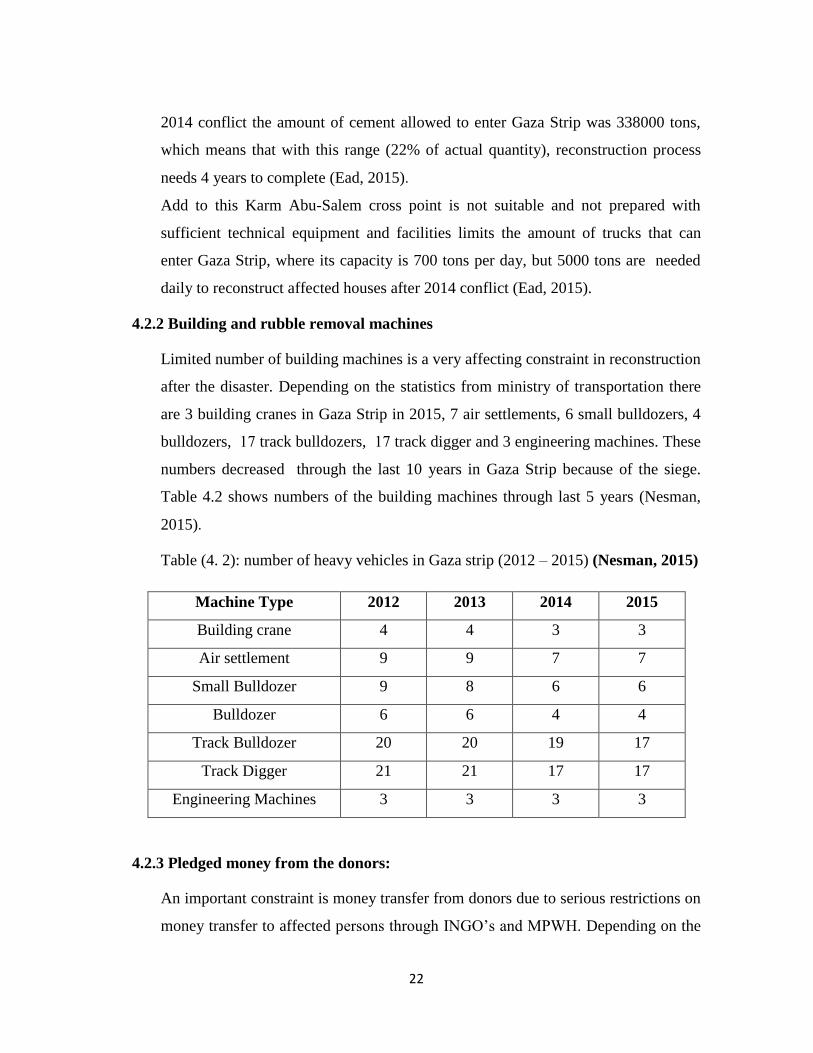
4.2.2 Building and rubble removal machines
Limited number of building machines is a very affecting constraint in reconstruction
after the disaster. Depending on the statistics from ministry of transportation there
are 3 building cranes in Gaza Strip in 2015, 7 air settlements, 6 small bulldozers, 4
bulldozers, 17 track bulldozers, 17 track digger and 3 engineering machines. These
numbers decreased through the last 10 years in Gaza Strip because of the siege.
Table 4.2 shows numbers of the building machines through last 5 years (Nesman,
2015).
Table (4. 2): number of heavy vehicles in Gaza strip (2012 – 2015) (Nesman, 2015)
Machine Type 2012 2013 2014 2015
Building crane 4 4 3 3
Air settlement 9 9 7 7
Small Bulldozer 9 8 6 6
Bulldozer 6 6 4 4
Track Bulldozer 20 20 19 17
Track Digger 21 21 17 17
Engineering Machines 3 3 3 3
4.2.3 Pledged money from the donors:
An important constraint is money transfer from donors due to serious restrictions on
money transfer to affected persons through INGO’s and MPWH. Depending on the
23
reports, the donors from Cairo conference pledged to pay 5.4 billion dollars to Gaza
Strip after 2014 conflict, 2.7 billion dollars will be to reconstruct the affected houses
after 2014 conflict, but actually until the end of 2015, 30% were transferred.
Table A.1 in APPENDIX A explains what the donors have pledged to Gaza in Cairo
conference depending on the international bank report in millions. (Ead, 2015)
4.3 Implementation of assessment criteria evaluation using Fuzzy Logic theory:
Four main criteria are considered to determine the priority of affected buildings;
building status, resident status, quarter status and building type. A comprehensive
description of each criteria can be found in the next sections. The importance weight
of each criterion plays an important role in priority detection of the affected
building. Due to this fact, it is important to set these weights through the
reconstruction organizations, stakeholders, governmental ministries involved and
local committees.
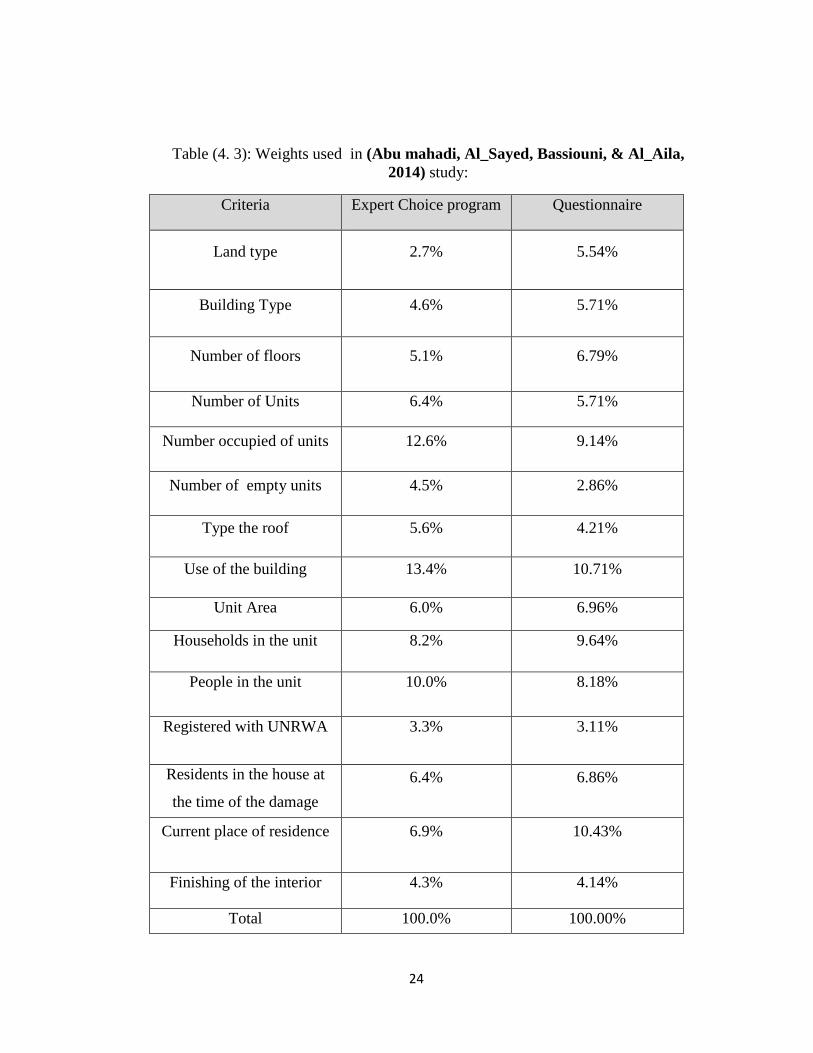
In Abu mahadi and others, 2014 study, they determined multi criteria through a
questionnaire and expert choice program in their study to determine weights for
buildings using analytical hierarchy process as shown in Table (4.3). They used 15
criteria without classification. The questionnaire was distributed on professional
offices, professional engineers, and involved organizations in reconstruction process
(Abu mahadi, Al_Sayed, Bassiouni, & Al_Aila, 2014). Table (4.3) shows the
weights of used criteria.
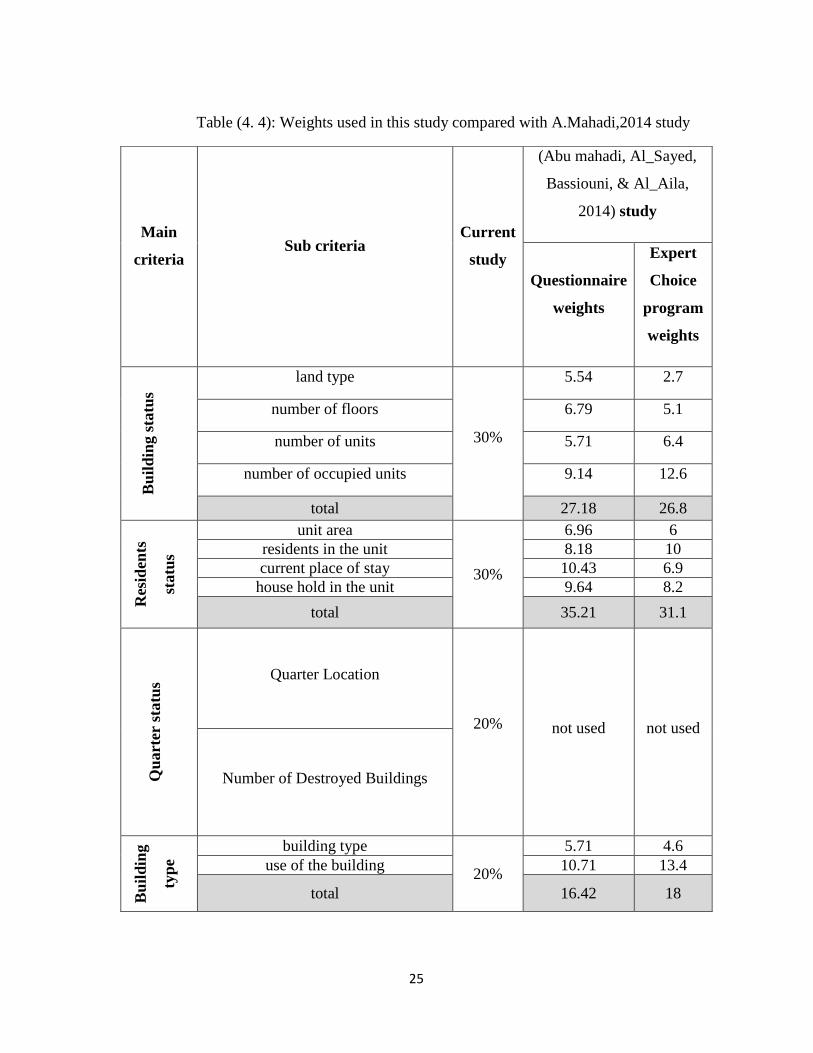
Table (4.4) shows the importance weights factor used in this study which is
approximately equal to their importance weights, but with arranging these criteria
and classifying them in logical way. In this study the weights will be assumed as
shown in Table (4.4). These weights can be changed or modified if needed,
furthermore quarter status criteria was not considered in the previous study, so in
this study it considered with sub criteria related to the location of affected building.
24
Table (4. 3): Weights used in (Abu mahadi, Al_Sayed, Bassiouni, & Al_Aila,
2014) study:
Criteria Expert Choice program
Questionnaire
Land type 2.7% 5.54%
Building Type 4.6% 5.71%
Number of floors 5.1% 6.79%
Number of Units 6.4% 5.71%
Number occupied of units 12.6% 9.14%
Number of empty units 4.5% 2.86%
Type the roof 5.6% 4.21%
Use of the building 13.4% 10.71%
Unit Area 6.0% 6.96%
Households in the unit 8.2% 9.64%
People in the unit 10.0% 8.18%
Registered with UNRWA 3.3% 3.11%
Residents in the house at
the time of the damage
6.4% 6.86%
Current place of residence 6.9% 10.43%
Finishing of the interior 4.3% 4.14%
Total 100.0% 100.00%
25
Table (4. 4): Weights used in this study compared with A.Mahadi,2014 study
Main
criteria Sub criteria
Current
study
(Abu mahadi, Al_Sayed,
Bassiouni, & Al_Aila,
2014) study
Questionnaire
weights
Expert
Choice
program
weights
Bu
ild
ing s
tatu
s
land type
30%
5.54 2.7
number of floors 6.79 5.1
number of units 5.71 6.4
number of occupied units 9.14 12.6
total 27.18 26.8
Res
iden
ts
statu
s
unit area
30%
6.96 6
residents in the unit 8.18 10
current place of stay 10.43 6.9
house hold in the unit 9.64 8.2
total 35.21 31.1
Qu
art
er s
tatu
s
Quarter Location
20% not used not used
Number of Destroyed Buildings
Bu
ild
ing
typ
e
building type
20%
5.71 4.6
use of the building 10.71 13.4
total 16.42 18
26
The implemented fuzzy logic model is shown in the figures in next sections. In this
model four main criteria were selected to study the importance weight of each
affected building. These four criteria are building status, residents status, quarter
status and building type with many sub criteria that have been analyzed to be
suitable for each main criterion. Weights are assumed depending on previous
studies and statistics from Palestinian central bureau of statistics related to the
social situation in Palestine and Gaza specifically. The main four criteria were
chosen with their sub criteria as shown in next sections. Building status will weigh
30% of the importance weight, residents’ status will weigh 30%, quarter status
weight is 20% while quarter status weight is 20%. Each criterion contains different
sub criteria gathered from collected data that will be evaluated using fuzzy logic
models.
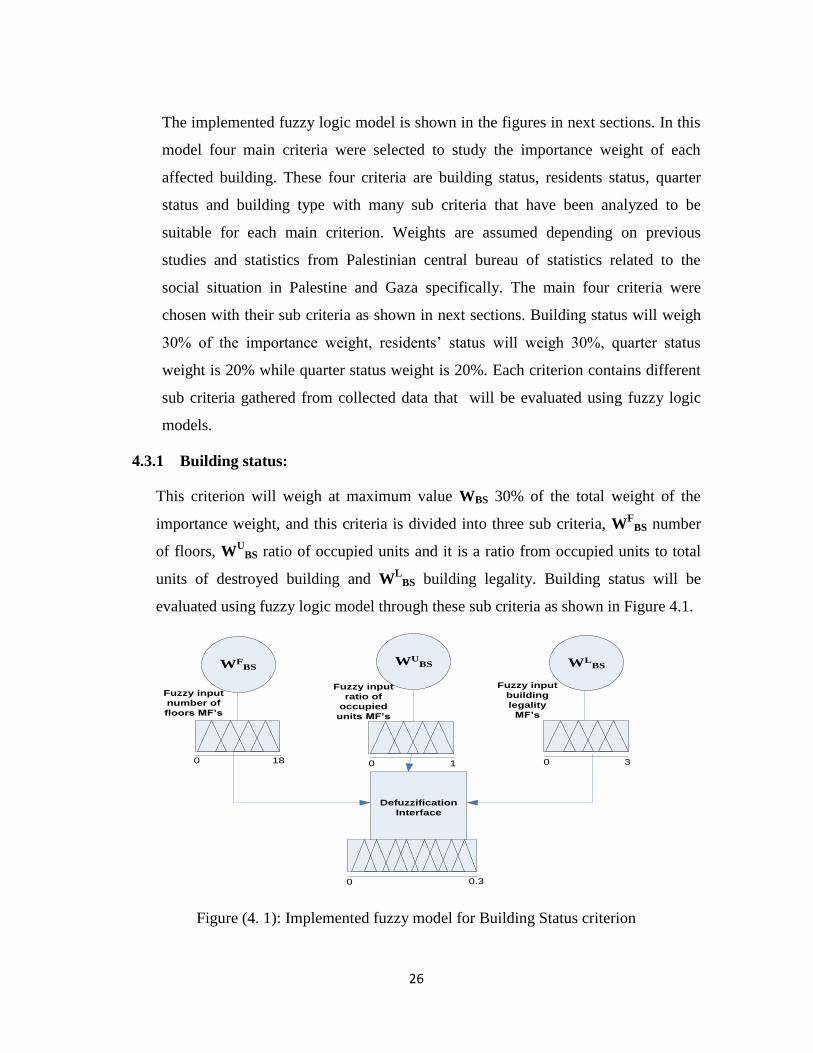
4.3.1 Building status:
This criterion will weigh at maximum value WBS 30% of the total weight of the
importance weight, and this criteria is divided into three sub criteria, WF
BS number
of floors, WU
BS ratio of occupied units and it is a ratio from occupied units to total
units of destroyed building and WL
BS building legality. Building status will be
evaluated using fuzzy logic model through these sub criteria as shown in Figure 4.1.
Defuzzification
Interface
0
0 0 018 1
0.3
3
WFBS
WUBS WL
BS
Fuzzy input
number of
floors MF’s
Fuzzy input
ratio of
occupied
units MF’s
Fuzzy input
building
legality
MF’s
Figure (4. 1): Implemented fuzzy model for Building Status criterion
27
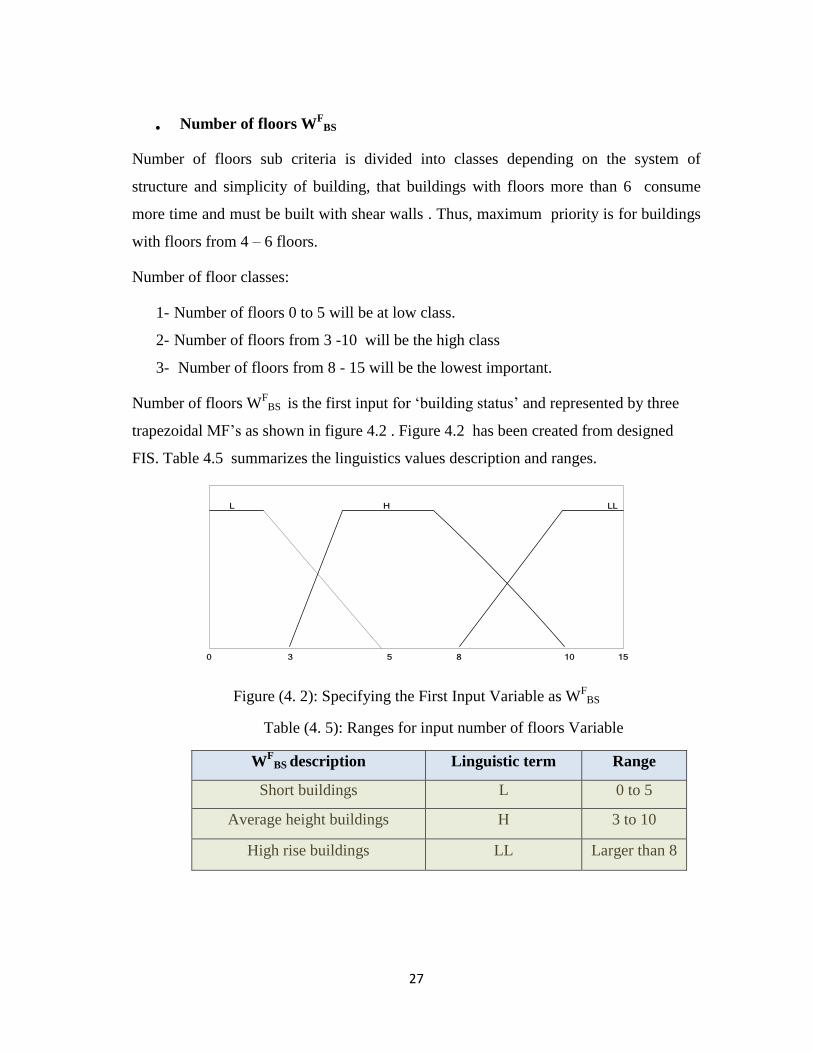
Number of floors WF
BS
Number of floors sub criteria is divided into classes depending on the system of
structure and simplicity of building, that buildings with floors more than 6 consume
more time and must be built with shear walls . Thus, maximum priority is for buildings
with floors from 4 – 6 floors.
Number of floor classes:
1- Number of floors 0 to 5 will be at low class.
2- Number of floors from 3 -10 will be the high class
3- Number of floors from 8 - 15 will be the lowest important.
Number of floors WF
BS is the first input for ‘building status’ and represented by three
trapezoidal MF’s as shown in figure 4.2 . Figure 4.2 has been created from designed
FIS. Table 4.5 summarizes the linguistics values description and ranges.
0 3 5 8 10 15
L H LL
Figure (4. 2): Specifying the First Input Variable as WF
BS
Table (4. 5): Ranges for input number of floors Variable
WF
BS description Linguistic term Range
Short buildings L 0 to 5
Average height buildings H 3 to 10
High rise buildings LL Larger than 8
28
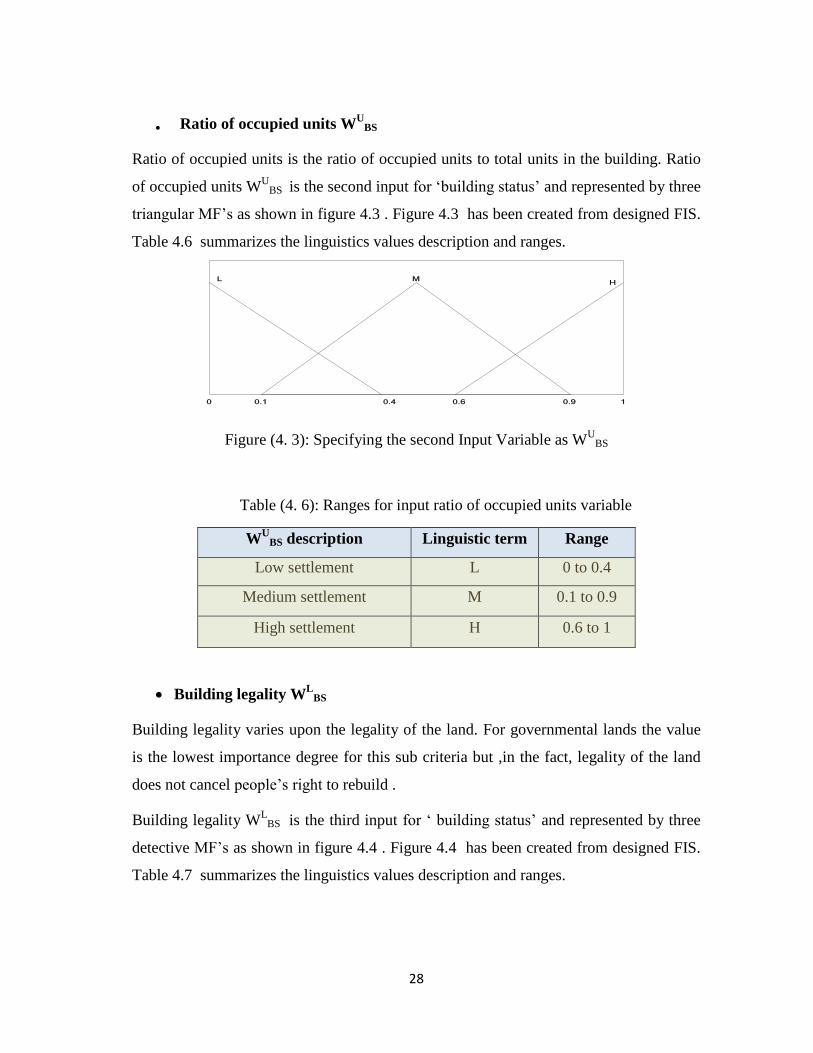
Ratio of occupied units WU
BS
Ratio of occupied units is the ratio of occupied units to total units in the building. Ratio
of occupied units WU
BS is the second input for ‘building status’ and represented by three
triangular MF’s as shown in figure 4.3 . Figure 4.3 has been created from designed FIS.
Table 4.6 summarizes the linguistics values description and ranges.
0 0.1 0.4 0.6 0.9 1
L MH
Figure (4. 3): Specifying the second Input Variable as WU
BS
Table (4. 6): Ranges for input ratio of occupied units variable
WU
BS description Linguistic term Range
Low settlement L 0 to 0.4
Medium settlement M 0.1 to 0.9
High settlement H 0.6 to 1
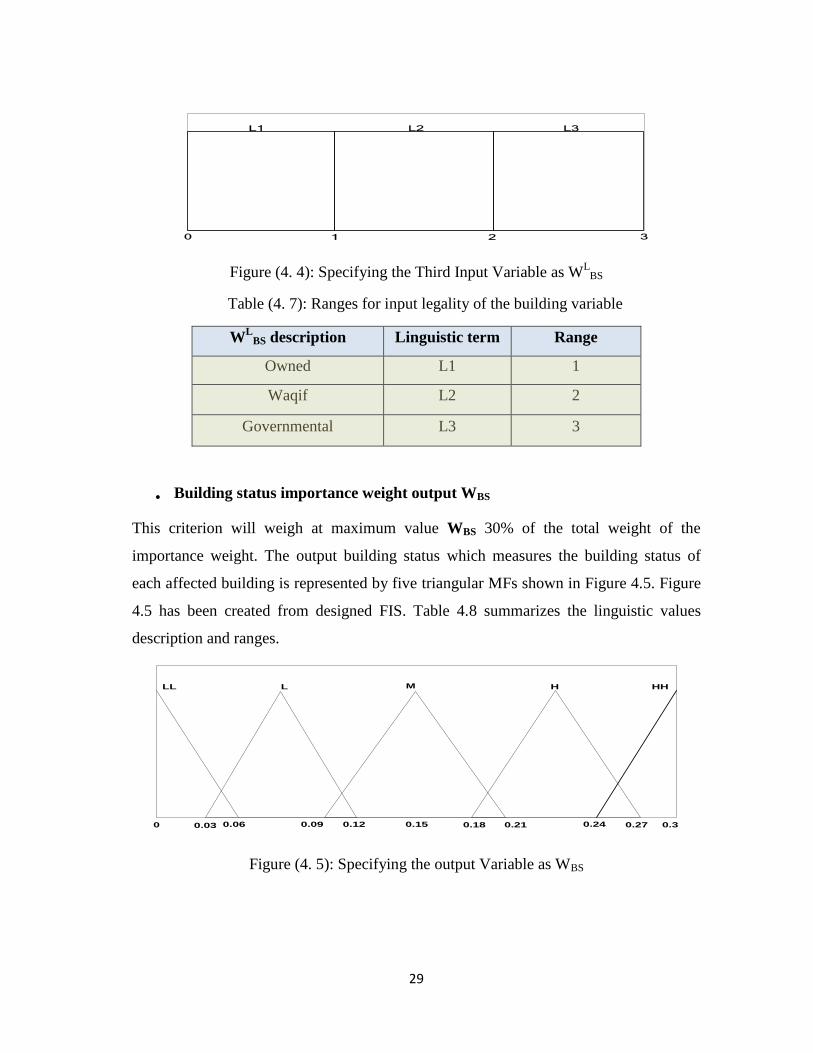
Building legality WL
BS
Building legality varies upon the legality of the land. For governmental lands the value
is the lowest importance degree for this sub criteria but ,in the fact, legality of the land
does not cancel people’s right to rebuild .
Building legality WL
BS is the third input for ‘ building status’ and represented by three
detective MF’s as shown in figure 4.4 . Figure 4.4 has been created from designed FIS.
Table 4.7 summarizes the linguistics values description and ranges.
29
0 1 2 3
L1 L2 L3
Figure (4. 4): Specifying the Third Input Variable as WL
BS
Table (4. 7): Ranges for input legality of the building variable
WL
BS description Linguistic term Range
Owned L1 1
Waqif L2 2
Governmental L3 3
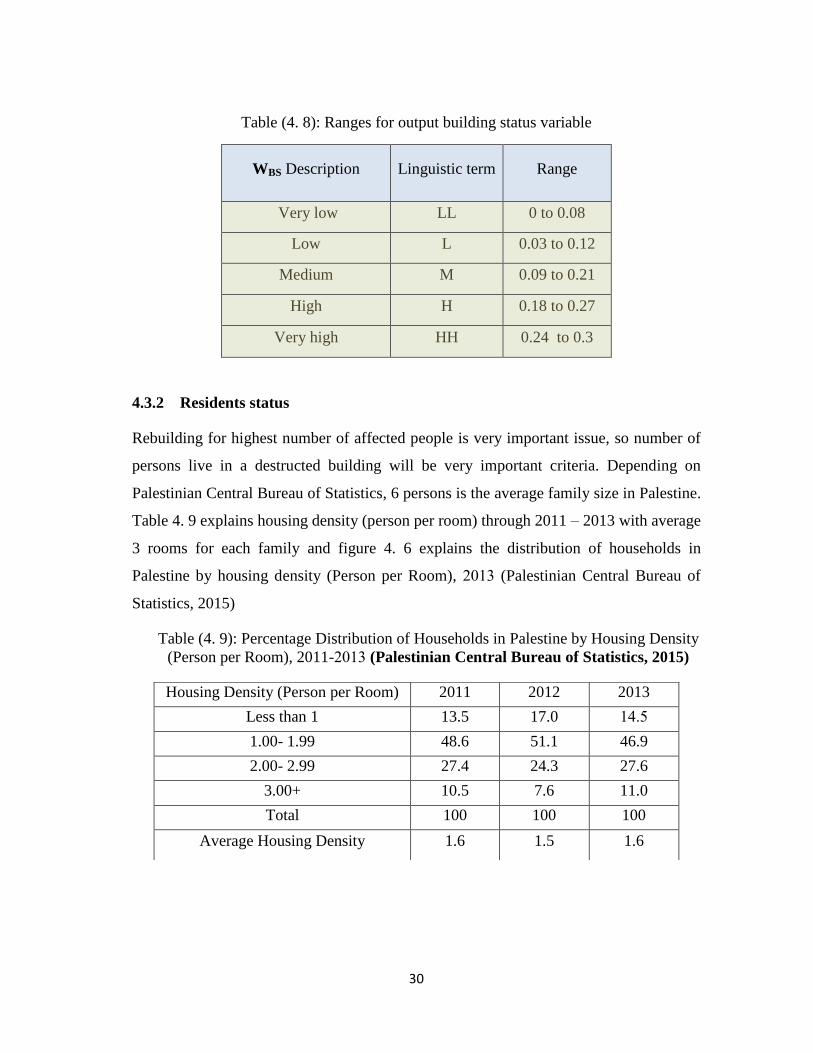
Building status importance weight output WBS
This criterion will weigh at maximum value WBS 30% of the total weight of the
importance weight. The output building status which measures the building status of
each affected building is represented by five triangular MFs shown in Figure 4.5. Figure
4.5 has been created from designed FIS. Table 4.8 summarizes the linguistic values
description and ranges.
0 0.06 0.12 0.18 0.27 0.3
MLL L H HH
0.09 0.15 0.210.03 0.24
Figure (4. 5): Specifying the output Variable as WBS
30
Table (4. 8): Ranges for output building status variable
WBS Description Linguistic term Range
Very low LL 0 to 0.08
Low L 0.03 to 0.12
Medium M 0.09 to 0.21
High H 0.18 to 0.27
Very high HH 0.24 to 0.3
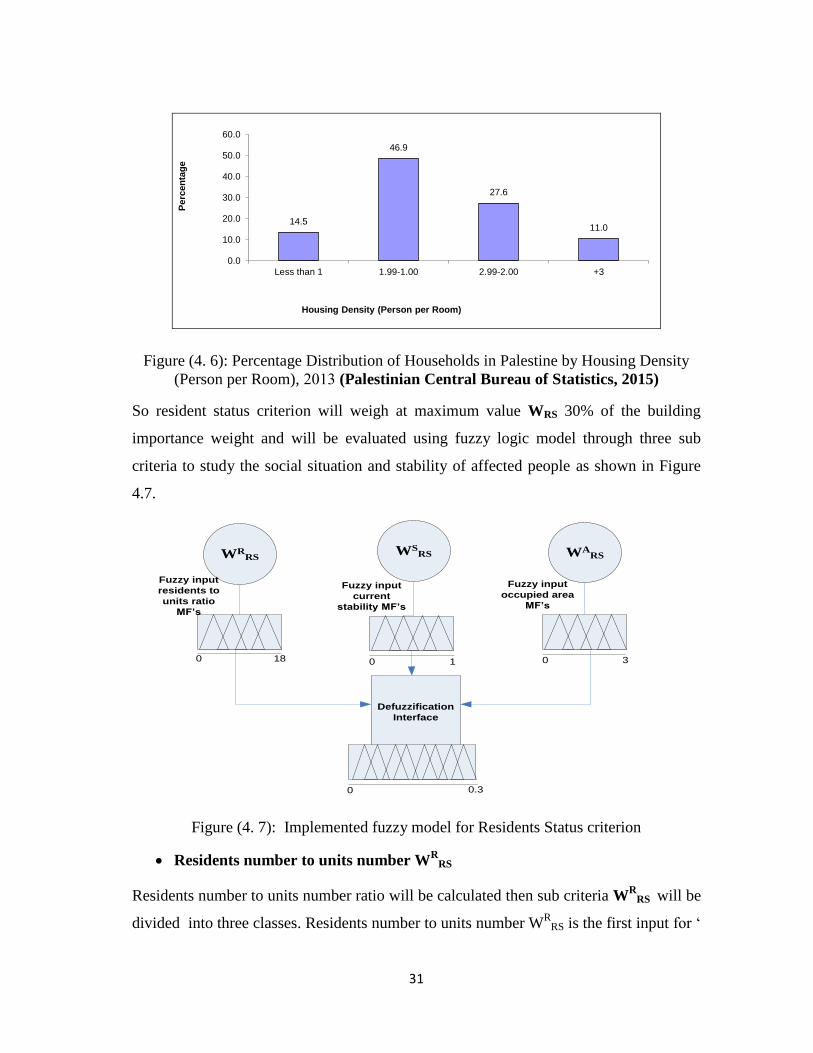
4.3.2 Residents status
Rebuilding for highest number of affected people is very important issue, so number of
persons live in a destructed building will be very important criteria. Depending on
Palestinian Central Bureau of Statistics, 6 persons is the average family size in Palestine.
Table 4. 9 explains housing density (person per room) through 2011 – 2013 with average
3 rooms for each family and figure 4. 6 explains the distribution of households in
Palestine by housing density (Person per Room), 2013 (Palestinian Central Bureau of
Statistics, 2015)
Table (4. 9): Percentage Distribution of Households in Palestine by Housing Density
(Person per Room), 2011-2013 (Palestinian Central Bureau of Statistics, 2015)
Housing Density (Person per Room) 2011 2012 2013
Less than 1 13.5 17.0 14.5
1.00- 1.99 48.6 51.1 46.9
2.00- 2.99 27.4 24.3 27.6
3.00+ 10.5 7.6 11.0
Total 100 100 100
Average Housing Density 1.6 1.5 1.6
31
Figure (4. 6): Percentage Distribution of Households in Palestine by Housing Density
(Person per Room), 2013 (Palestinian Central Bureau of Statistics, 2015)
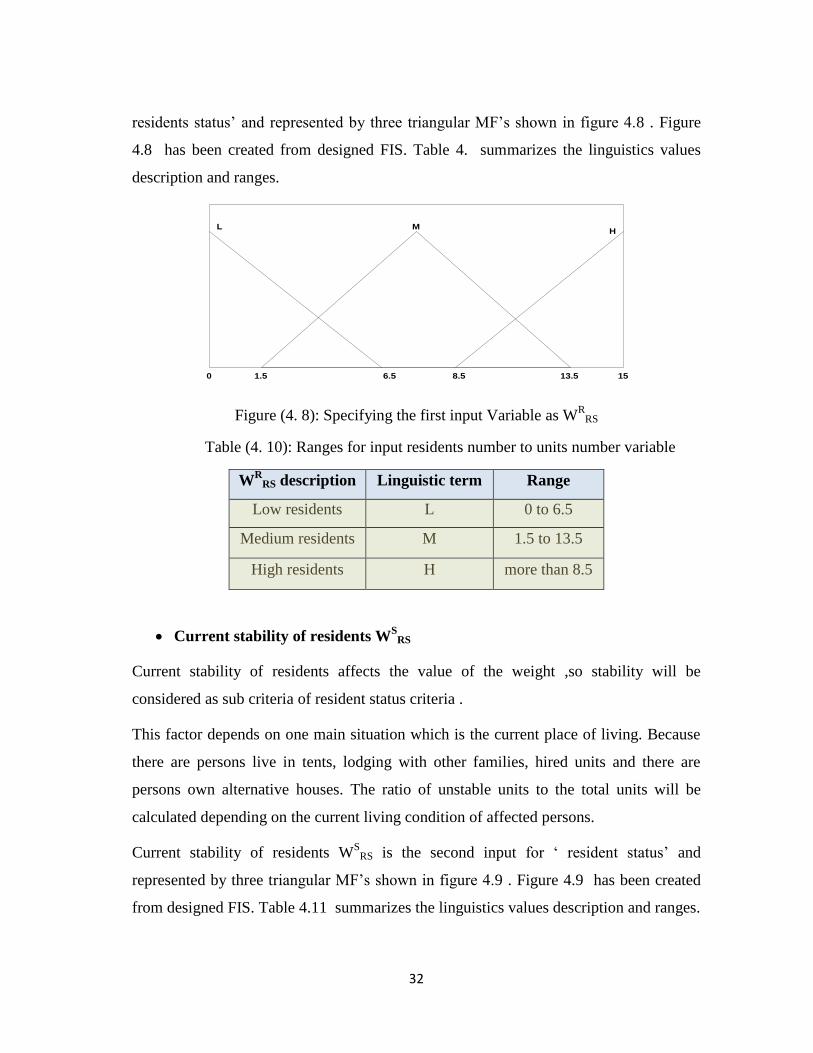
So resident status criterion will weigh at maximum value WRS 30% of the building
importance weight and will be evaluated using fuzzy logic model through three sub
criteria to study the social situation and stability of affected people as shown in Figure
4.7.
Defuzzification
Interface
0
0 0 018 1
0.3
3
WRRS
WSRS WA
RS
Fuzzy input
residents to
units ratio
MF’s
Fuzzy input
current
stability MF’s
Fuzzy input
occupied area
MF’s
Figure (4. 7): Implemented fuzzy model for Residents Status criterion
Residents number to units number WR
RS
Residents number to units number ratio will be calculated then sub criteria WR
RS will be
divided into three classes. Residents number to units number WR
RS is the first input for ‘
14.5
46.9
27.6
11.0
0.0
10.0
20.0
30.0
40.0
50.0
60.0
Less than 1 1.99-1.00 2.99-2.00 +3
Housing Density (Person per Room)
Perc
en
tag
e
32
residents status’ and represented by three triangular MF’s shown in figure 4.8 . Figure
4.8 has been created from designed FIS. Table 4. summarizes the linguistics values
description and ranges.
0 1.5 6.5 8.5 13.5 15
L MH
Figure (4. 8): Specifying the first input Variable as WR
RS
Table (4. 10): Ranges for input residents number to units number variable
WR
RS description Linguistic term Range
Low residents L 0 to 6.5
Medium residents M 1.5 to 13.5
High residents H more than 8.5
Current stability of residents WS
RS
Current stability of residents affects the value of the weight ,so stability will be
considered as sub criteria of resident status criteria .
This factor depends on one main situation which is the current place of living. Because
there are persons live in tents, lodging with other families, hired units and there are
persons own alternative houses. The ratio of unstable units to the total units will be
calculated depending on the current living condition of affected persons.
Current stability of residents WS
RS is the second input for ‘ resident status’ and
represented by three triangular MF’s shown in figure 4.9 . Figure 4.9 has been created
from designed FIS. Table 4.11 summarizes the linguistics values description and ranges.
33
0 0.1 0.4 0.6 0.9 1
L MH
Figure (4. 9): Specifying the second input Variable as WS
RS
Table (4. 11): Ranges for input current stability of residents variable
WS
RS description Linguistic term Range
Low stability percentage L 0 to 0.4
Medium stability percentage M 0.1 to 0.9
High stability percentage H 0.6 to 1
Occupied area per person WA
RS
Average area of resident houses in Palestine is 120 m2 and average number of family
size is 6 persons, so every person approximately occupies 20 m2
. (Palestinian Central
Bureau of Statistics, 2015). So occupied area per person will be considered as the third
sub criterion WA
RS of the residents status criterion, so using the ratio of total area of all
units in the building to the total number of residents in the same building determines the
area for each person. Classifying the areas in phases will determine the importance
weight for each area.
Occupied area per person WA
RS is the third input and represented by two triangular MF’s
and one trapezoidal MF shown in figure 4.10. Figure 4.10 has been created from
designed FIS. Table 4.12 summarizes the linguistics values description and ranges.
0 20 25 35 40
H M L
Figure (4. 10): Specifying the third input Variable as WA
RS
34
Table (4. 12): Ranges for input occupied area per person of residents variable
WA
RS description Linguistic
term Range
Low area per person H 0 to 25
Medium area per person M 20 to 40
High area per person L larger than 40
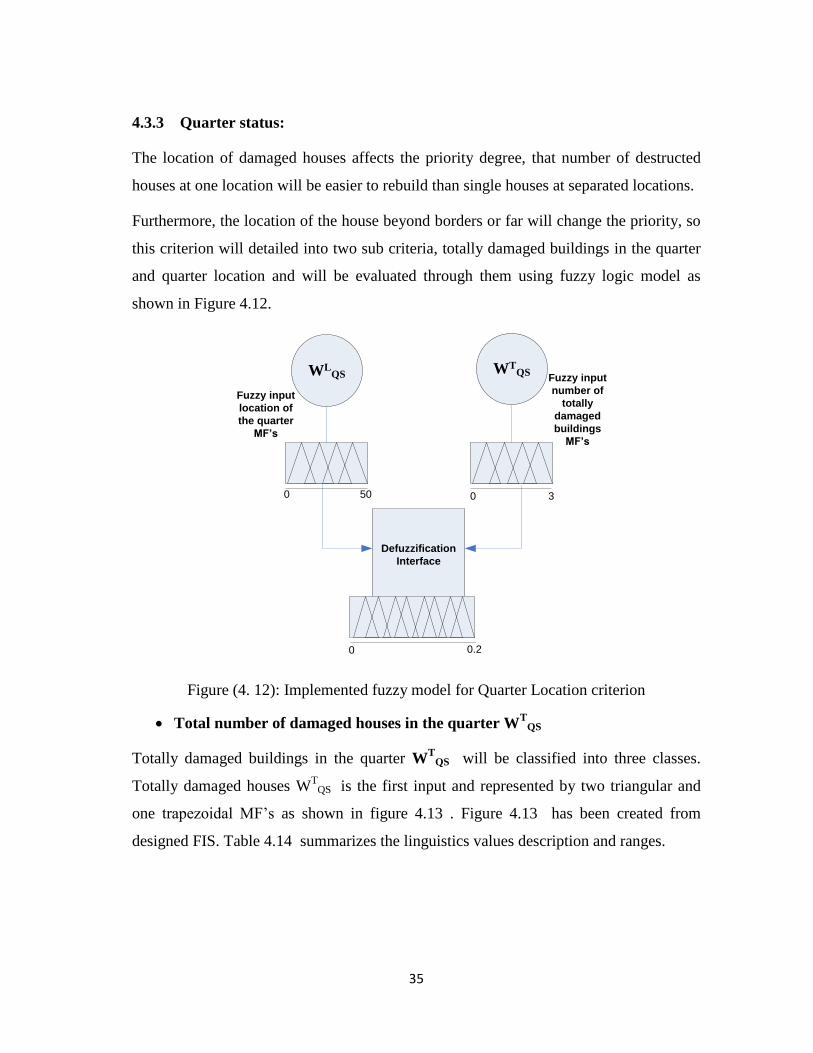
Residents status importance weight output WRS
This criterion will weigh at maximum value WRS 30% of the total weight of the
importance weight. The output residents status which measures the residents value of
each affected building is represented by five triangular MFs as shown in Figure 4.11
Figure 4.11 has been created from designed FIS. Table 4.13 summarizes the
linguistic values description and ranges.
0 0.06 0.12 0.18 0.27 0.3
MLL L H HH
0.09 0.15 0.210.03 0.24
Figure (4. 11): Specifying the output Variable as WBS
Table (4. 13): Ranges for output residents status variable
WRS Description Linguistic term Range
Very low LL 0 to 0.08
Low L 0.03 to 0.12
Medium M 0.09 to 0.21
High H 0.18 to 0.27
Very high HH 0.24 to 0.3
35
4.3.3 Quarter status:
The location of damaged houses affects the priority degree, that number of destructed
houses at one location will be easier to rebuild than single houses at separated locations.
Furthermore, the location of the house beyond borders or far will change the priority, so
this criterion will detailed into two sub criteria, totally damaged buildings in the quarter
and quarter location and will be evaluated through them using fuzzy logic model as
shown in Figure 4.12.
Defuzzification
Interface
0
0 050
0.2
3
WLQS WT
QS
Fuzzy input
location of
the quarter
MF’s
Fuzzy input
number of
totally
damaged
buildings
MF’s
Figure (4. 12): Implemented fuzzy model for Quarter Location criterion
Total number of damaged houses in the quarter WT
QS
Totally damaged buildings in the quarter WT
QS will be classified into three classes.
Totally damaged houses WT
QS is the first input and represented by two triangular and
one trapezoidal MF’s as shown in figure 4.13 . Figure 4.13 has been created from
designed FIS. Table 4.14 summarizes the linguistics values description and ranges.
36
0 8 10 13 14
L M H
Figure (4. 13): Specifying the first input Variable as WT
QS
Table (4. 14): Ranges for input total damaged houses in the quarter variable
WT
QS description Linguistic term Range
Low number of destroyed houses L 0 to 10
Medium number of destroyed houses M 8 to 14
High number of destroyed houses H More than 13
Location of the quarter WL
QS
Quartet location sub criteria WL
QS value will vary depending on the distance from the
borders, and high priority to border quarters.
So the classes will be:
1- If the quarter at borders the affected houses will have high priority.
2- If the quarter is a city, affected houses will have the second importance.
3- If the quarter is a village , affected houses will have the third importance
Quarter location WL
QS is the second input and represented by detective MF’s as shown
in figure 4.14 . Figure 4.14 has been created from designed FIS. Table 4.15 summarizes
the linguistics values description and ranges.
37
0 1 2 3
L M H
Figure (4. 14): Specifying the second input Variable as WL
QS
Table (4. 15): Ranges for input location of the quarter variable
WL
QS description Linguistic term Range
Village quarter L 1
City quarter M 2
Border quarter H 3
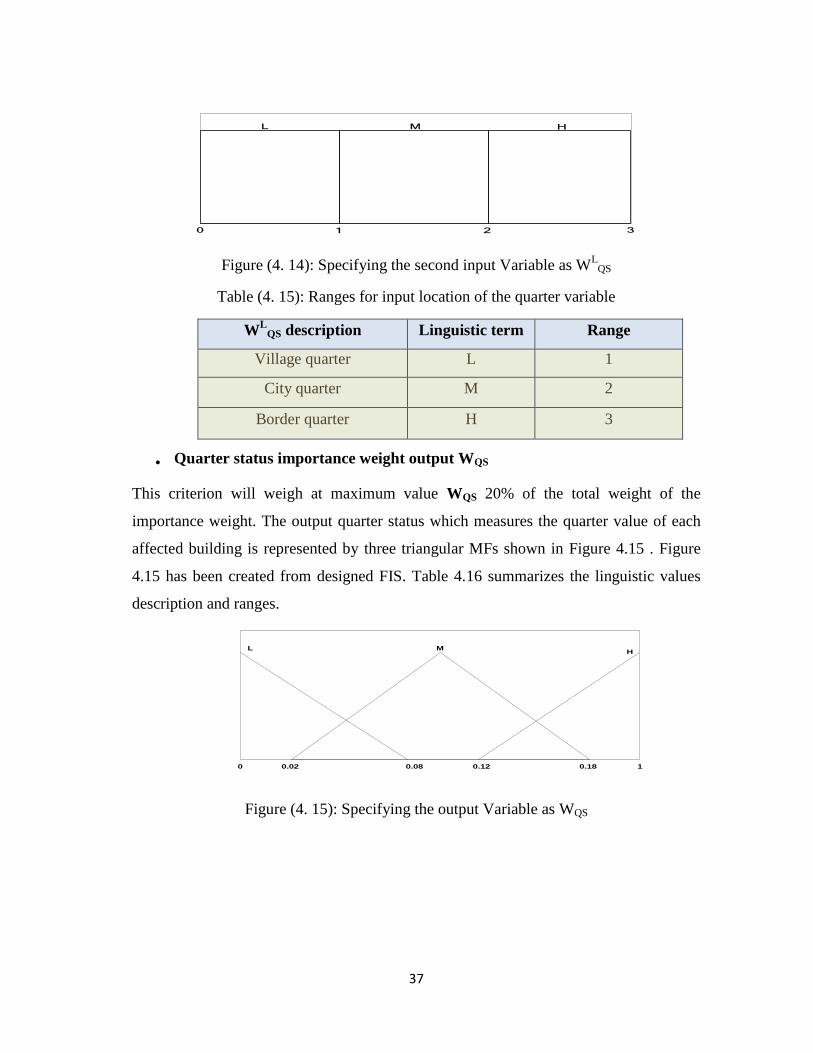
Quarter status importance weight output WQS
This criterion will weigh at maximum value WQS 20% of the total weight of the
importance weight. The output quarter status which measures the quarter value of each
affected building is represented by three triangular MFs shown in Figure 4.15 . Figure
4.15 has been created from designed FIS. Table 4.16 summarizes the linguistic values
description and ranges.
0 0.02 0.08 0.12 0.18 1
L MH
Figure (4. 15): Specifying the output Variable as WQS
38
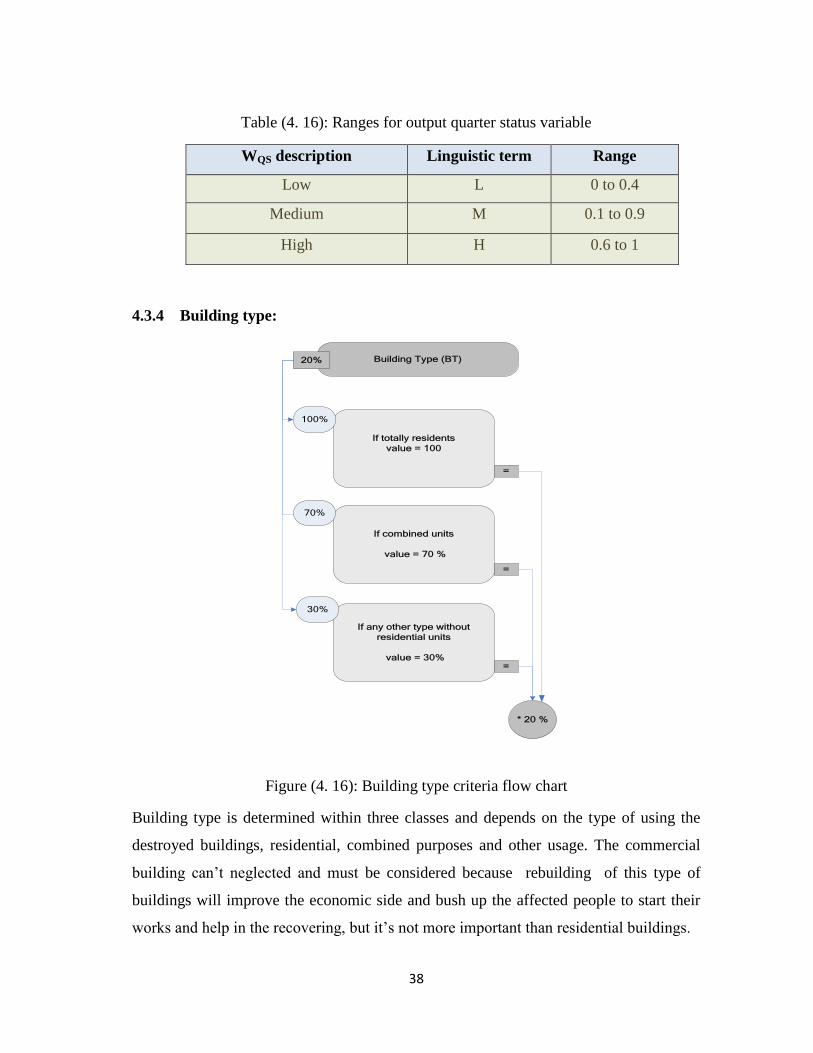
Table (4. 16): Ranges for output quarter status variable
WQS description Linguistic term Range
Low L 0 to 0.4
Medium M 0.1 to 0.9
High H 0.6 to 1
4.3.4 Building type:
Building Type (BT)
If totally residents
value = 100
If combined units
value = 70 %
If any other type without
residential units
value = 30%
70%
30%
=
=
=
100%
20%
* 20 %
70%
100%
30%
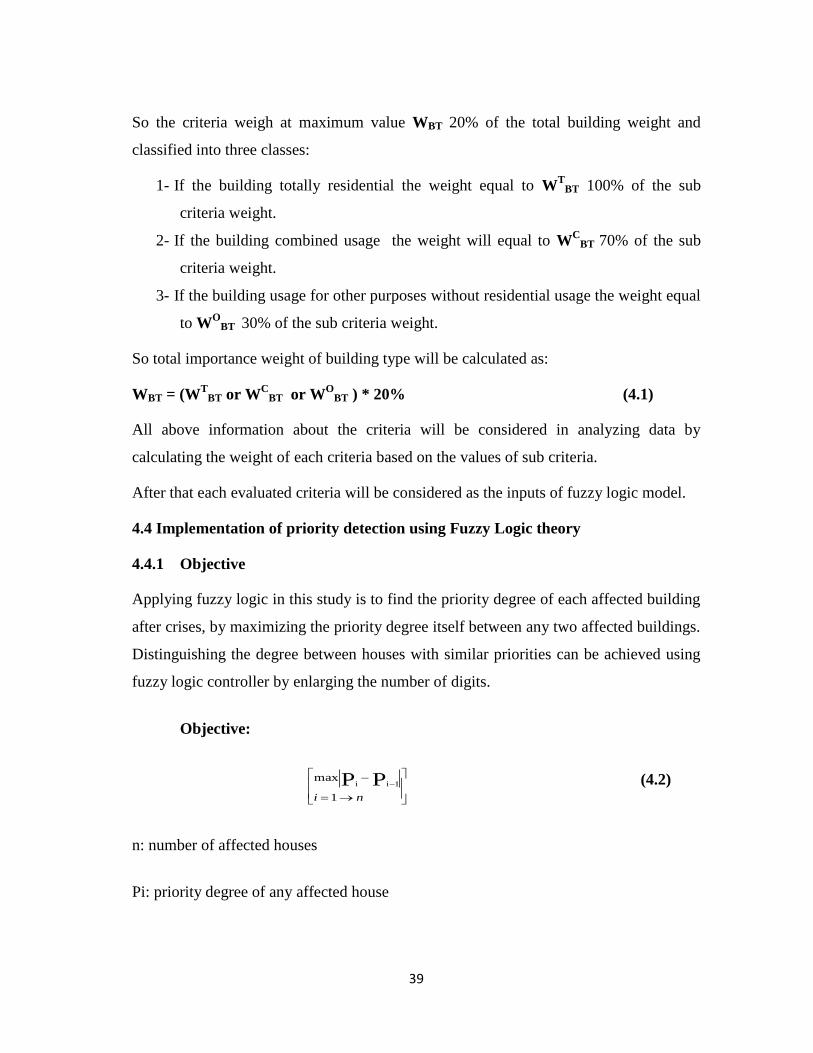
Figure (4. 16): Building type criteria flow chart
Building type is determined within three classes and depends on the type of using the
destroyed buildings, residential, combined purposes and other usage. The commercial
building can’t neglected and must be considered because rebuilding of this type of
buildings will improve the economic side and bush up the affected people to start their
works and help in the recovering, but it’s not more important than residential buildings.
39
So the criteria weigh at maximum value WBT 20% of the total building weight and
classified into three classes:
1- If the building totally residential the weight equal to WT
BT 100% of the sub
criteria weight.
2- If the building combined usage the weight will equal to WC
BT 70% of the sub
criteria weight.
3- If the building usage for other purposes without residential usage the weight equal
to WO
BT 30% of the sub criteria weight.
So total importance weight of building type will be calculated as:
WBT = (WT
BT or WC
BT or WO
BT ) * 20% (4.1)
All above information about the criteria will be considered in analyzing data by
calculating the weight of each criteria based on the values of sub criteria.
After that each evaluated criteria will be considered as the inputs of fuzzy logic model.
4.4 Implementation of priority detection using Fuzzy Logic theory
4.4.1 Objective
Applying fuzzy logic in this study is to find the priority degree of each affected building
after crises, by maximizing the priority degree itself between any two affected buildings.
Distinguishing the degree between houses with similar priorities can be achieved using
fuzzy logic controller by enlarging the number of digits.
Objective:
ni 1
max PP 1ii (4.2)
n: number of affected houses
Pi: priority degree of any affected house
40
Pi-1: priority degree of any other affected house.
Subject to affected families current stability and their urgent need for building
reconstruction.
4.4.2 Implementation of priority degree using fuzzy logic
There are many software used to design and build fuzzy controller. In this chapter
MATLAB, Fuzzy Logic Toolbox is used.
MATLAB is the most famous software for technical computing. It has the property of
working within one environment by consolidating programming, visualization and
computation in the same environment. It can express and solve problems in frequent
mathematical notation. In this thesis m files in MATLAB has been used to code the
computation of weights of criteria and sub criteria. Fuzzy Inference System FIS has been
used to build fuzzy model for priority detection through multi steps process starting with
identifying 4 inputs and related membership functions MFs, then identifying one output
and related MFs. “ If , then “ rules have been built through rule building process . Built
fuzzy model through FIS is imported within coded m file in order to have results by only
one run.
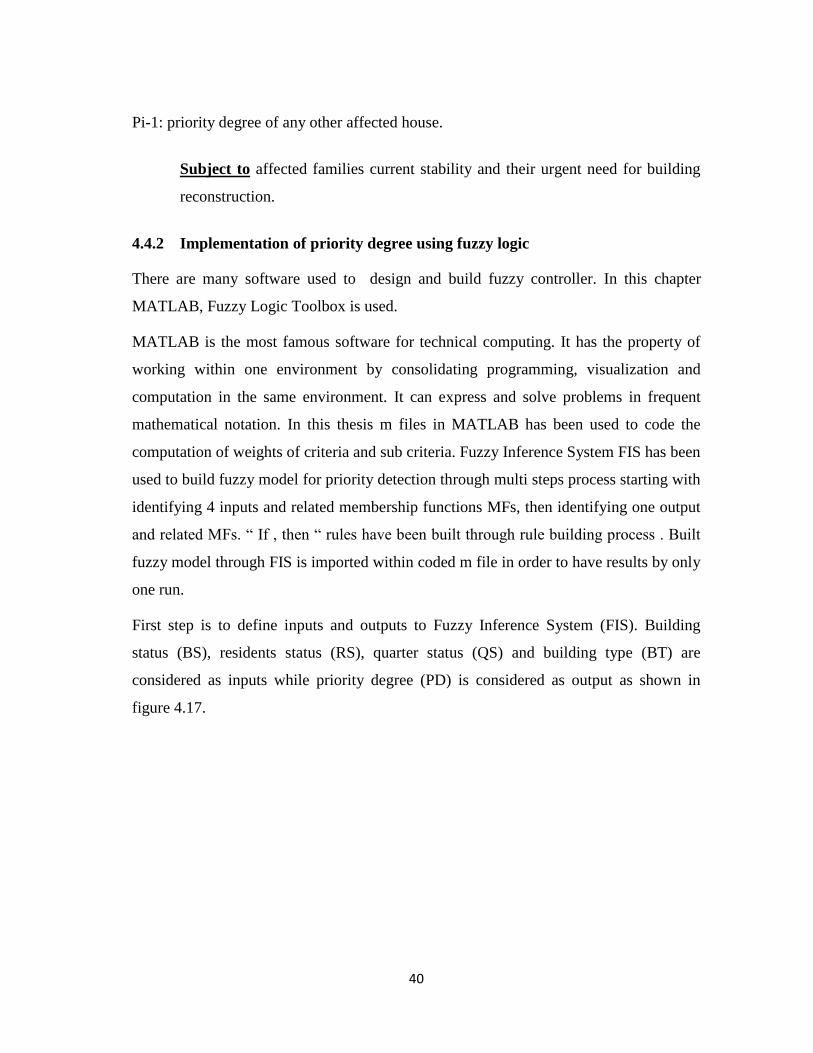
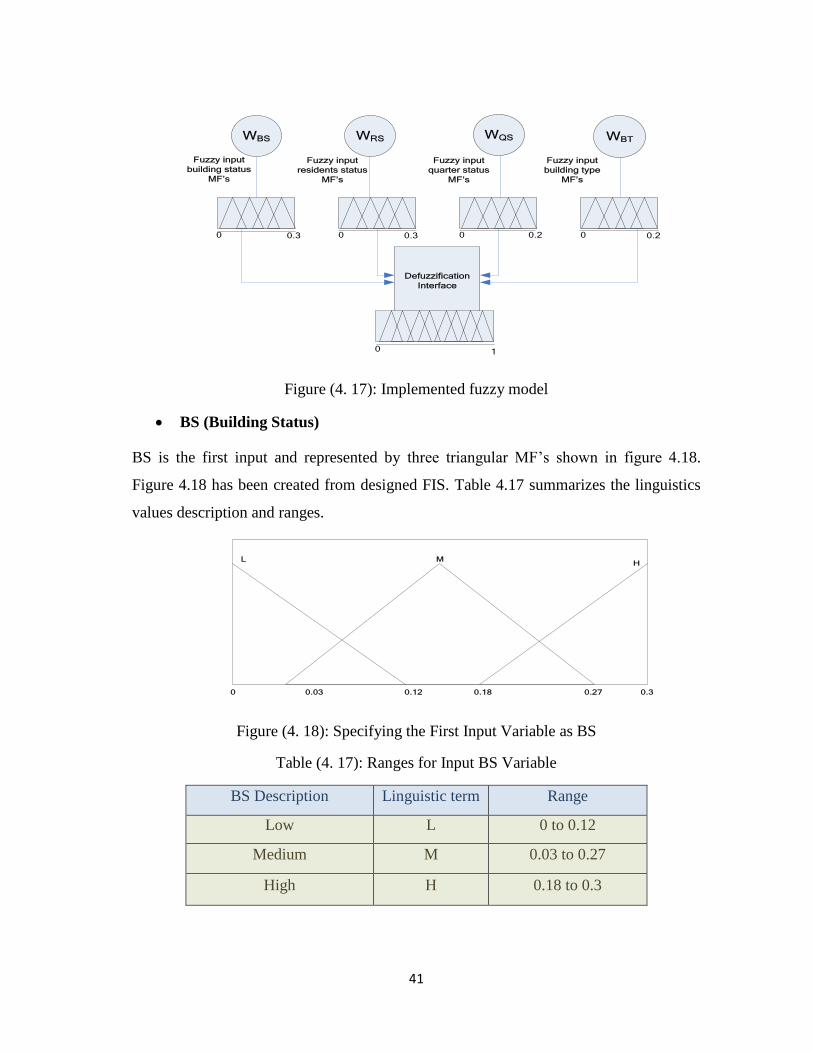
First step is to define inputs and outputs to Fuzzy Inference System (FIS). Building
status (BS), residents status (RS), quarter status (QS) and building type (BT) are
considered as inputs while priority degree (PD) is considered as output as shown in
figure 4.17.
41
Defuzzification
Interface
0
0
0 0 00.3 0.3
1
0.2 0.2
WBS WRS WQS WBT
Fuzzy input
building status
MF’s
Fuzzy input
residents status
MF’s
Fuzzy input
quarter status
MF’s
Fuzzy input
building type
MF’s
Figure (4. 17): Implemented fuzzy model
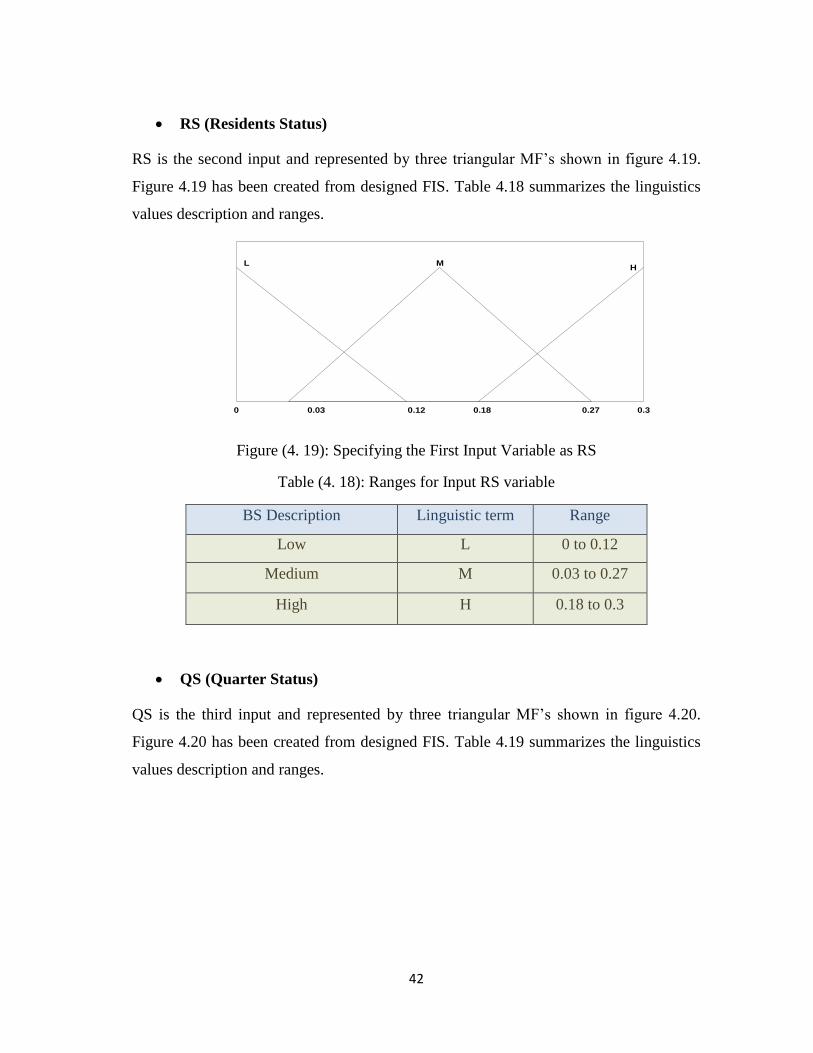
BS (Building Status)
BS is the first input and represented by three triangular MF’s shown in figure 4.18.
Figure 4.18 has been created from designed FIS. Table 4.17 summarizes the linguistics
values description and ranges.
0 0.03 0.12 0.18 0.27 0.3
L MH
Figure (4. 18): Specifying the First Input Variable as BS
Table (4. 17): Ranges for Input BS Variable
BS Description Linguistic term Range
Low L 0 to 0.12
Medium M 0.03 to 0.27
High H 0.18 to 0.3
42
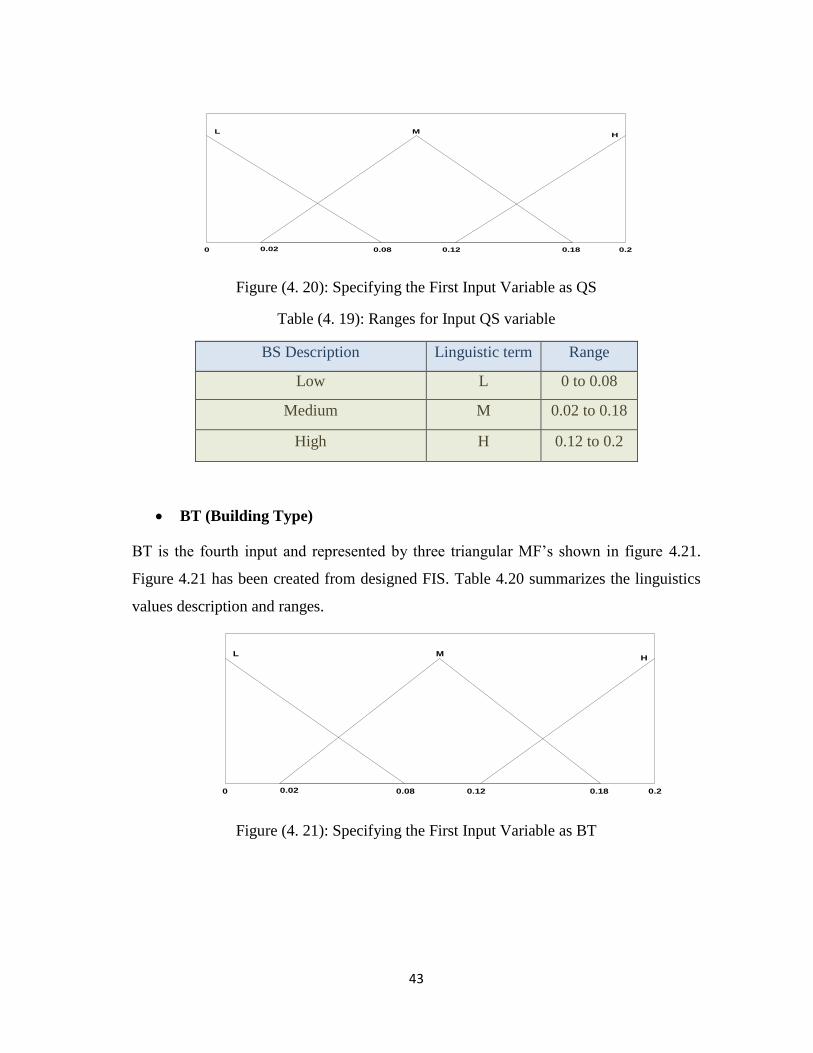
RS (Residents Status)
RS is the second input and represented by three triangular MF’s shown in figure 4.19.
Figure 4.19 has been created from designed FIS. Table 4.18 summarizes the linguistics
values description and ranges.
0 0.03 0.12 0.18 0.27 0.3
L MH
Figure (4. 19): Specifying the First Input Variable as RS
Table (4. 18): Ranges for Input RS variable
BS Description Linguistic term Range
Low L 0 to 0.12
Medium M 0.03 to 0.27
High H 0.18 to 0.3
QS (Quarter Status)
QS is the third input and represented by three triangular MF’s shown in figure 4.20.
Figure 4.20 has been created from designed FIS. Table 4.19 summarizes the linguistics
values description and ranges.
43
0 0.02 0.08 0.12 0.18 0.2
L MH
Figure (4. 20): Specifying the First Input Variable as QS
Table (4. 19): Ranges for Input QS variable
BS Description Linguistic term Range
Low L 0 to 0.08
Medium M 0.02 to 0.18
High H 0.12 to 0.2
BT (Building Type)
BT is the fourth input and represented by three triangular MF’s shown in figure 4.21.
Figure 4.21 has been created from designed FIS. Table 4.20 summarizes the linguistics
values description and ranges.
0 0.02 0.08 0.12 0.18 0.2
L MH
Figure (4. 21): Specifying the First Input Variable as BT
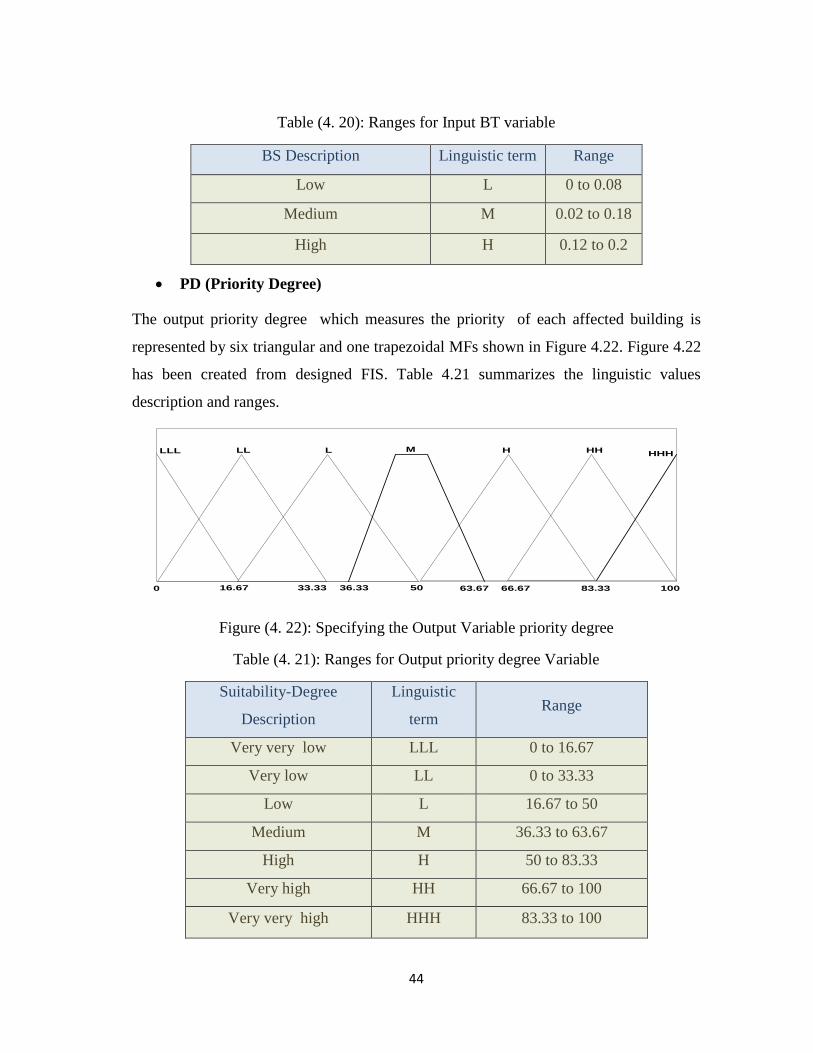
44
Table (4. 20): Ranges for Input BT variable
BS Description Linguistic term Range
Low L 0 to 0.08
Medium M 0.02 to 0.18
High H 0.12 to 0.2
PD (Priority Degree)
The output priority degree which measures the priority of each affected building is
represented by six triangular and one trapezoidal MFs shown in Figure 4.22. Figure 4.22
has been created from designed FIS. Table 4.21 summarizes the linguistic values
description and ranges.
0 16.67 36.33 63.67 83.33 100
LLL MHHHLL L H HH
33.33 50 66.67
Figure (4. 22): Specifying the Output Variable priority degree
Table (4. 21): Ranges for Output priority degree Variable
Suitability-Degree
Description
Linguistic
term Range
Very very low LLL 0 to 16.67
Very low LL 0 to 33.33
Low L 16.67 to 50
Medium M 36.33 to 63.67
High H 50 to 83.33
Very high HH 66.67 to 100
Very very high HHH 83.33 to 100

45
Affected buildings with highest priority degree are selected to be reconstructed first.
Priority degree value is evaluated by CENTROID Defuzzification depending upon the
inputs and the rules defined in fuzzy inference system . IF-Then operation is the rule
controller, 81 rules are written in FIS tool box.(Table B.1 in the APPENDIX B shows
the rules).

46
Chapter 5
Results and Analysis
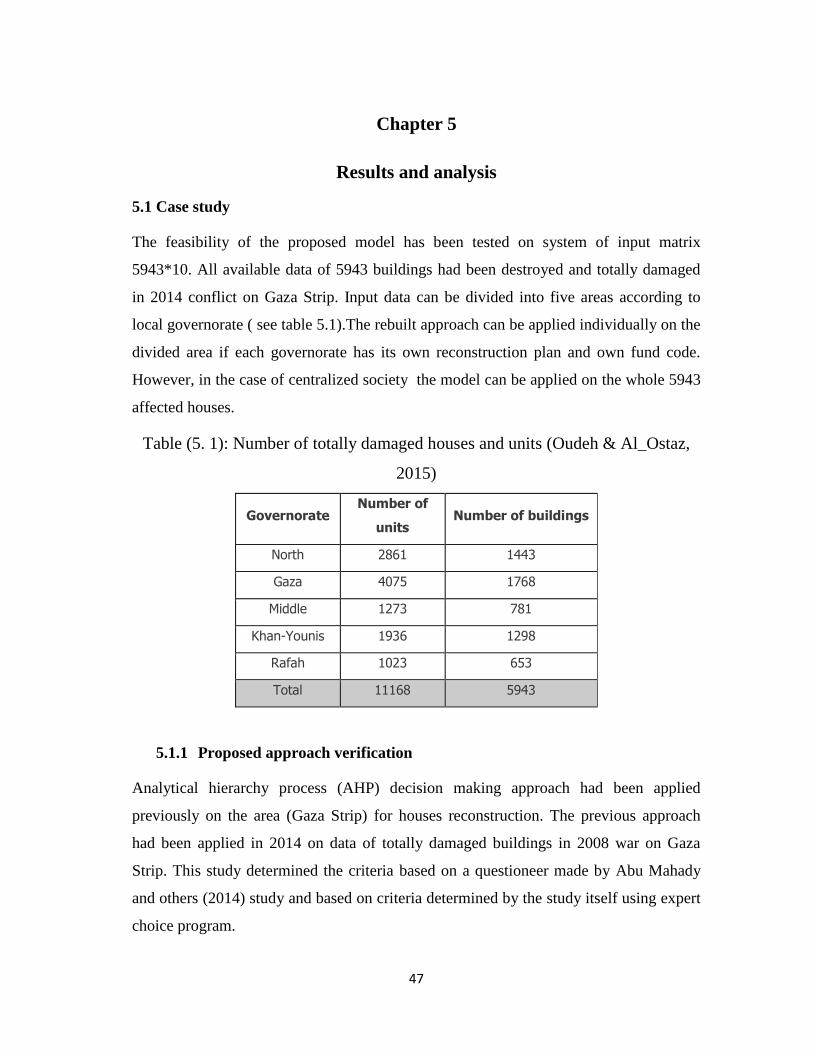
47
Chapter 5
Results and analysis
5.1 Case study
The feasibility of the proposed model has been tested on system of input matrix
5943*10. All available data of 5943 buildings had been destroyed and totally damaged
in 2014 conflict on Gaza Strip. Input data can be divided into five areas according to
local governorate ( see table 5.1).The rebuilt approach can be applied individually on the
divided area if each governorate has its own reconstruction plan and own fund code.
However, in the case of centralized society the model can be applied on the whole 5943
affected houses.
Table (5. 1): Number of totally damaged houses and units (Oudeh & Al_Ostaz,
2015)
Governorate Number of
units Number of buildings
North 2861 1443
Gaza 4075 1768
Middle 1273 781
Khan-Younis 1936 1298
Rafah 1023 653
Total 11168 5943
5.1.1 Proposed approach verification
Analytical hierarchy process (AHP) decision making approach had been applied
previously on the area (Gaza Strip) for houses reconstruction. The previous approach
had been applied in 2014 on data of totally damaged buildings in 2008 war on Gaza
Strip. This study determined the criteria based on a questioneer made by Abu Mahady
and others (2014) study and based on criteria determined by the study itself using expert
choice program.
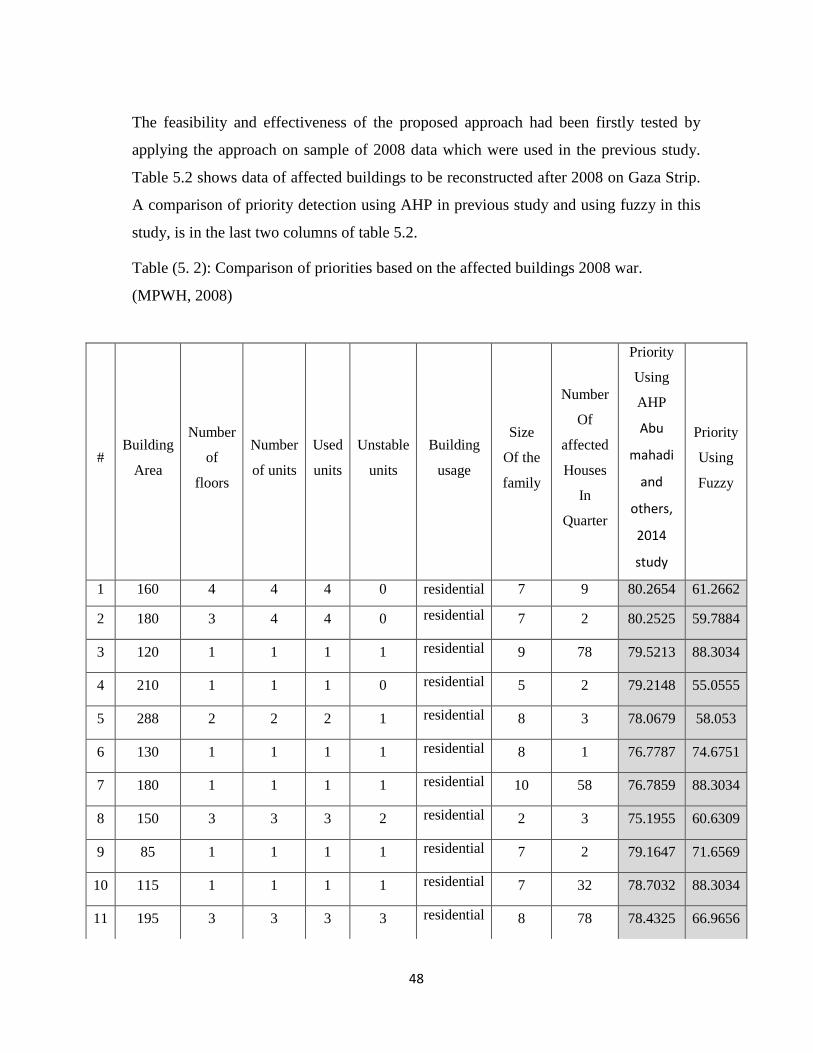
48
The feasibility and effectiveness of the proposed approach had been firstly tested by
applying the approach on sample of 2008 data which were used in the previous study.
Table 5.2 shows data of affected buildings to be reconstructed after 2008 on Gaza Strip.
A comparison of priority detection using AHP in previous study and using fuzzy in this
study, is in the last two columns of table 5.2.
Table (5. 2): Comparison of priorities based on the affected buildings 2008 war.
(MPWH, 2008)
# Building
Area
Number
of
floors
Number
of units
Used
units
Unstable
units
Building
usage
Size
Of the
family
Number
Of
affected
Houses
In
Quarter
Priority
Using
AHP
Abu
mahadi
and
others,
2014
study
Priority
Using
Fuzzy
1 160 4 4 4 0 residential 7 9 80.2654 61.2662
2 180 3 4 4 0 residential 7 2 80.2525 59.7884
3 120 1 1 1 1 residential 9 78 79.5213 88.3034
4 210 1 1 1 0 residential 5 2 79.2148 55.0555
5 288 2 2 2 1 residential 8 3 78.0679 58.053
6 130 1 1 1 1 residential 8 1 76.7787 74.6751
7 180 1 1 1 1 residential 10 58 76.7859 88.3034
8 150 3 3 3 2 residential 2 3 75.1955 60.6309
9 85 1 1 1 1 residential 7 2 79.1647 71.6569
10 115 1 1 1 1 residential 7 32 78.7032 88.3034
11 195 3 3 3 3 residential 8 78 78.4325 66.9656
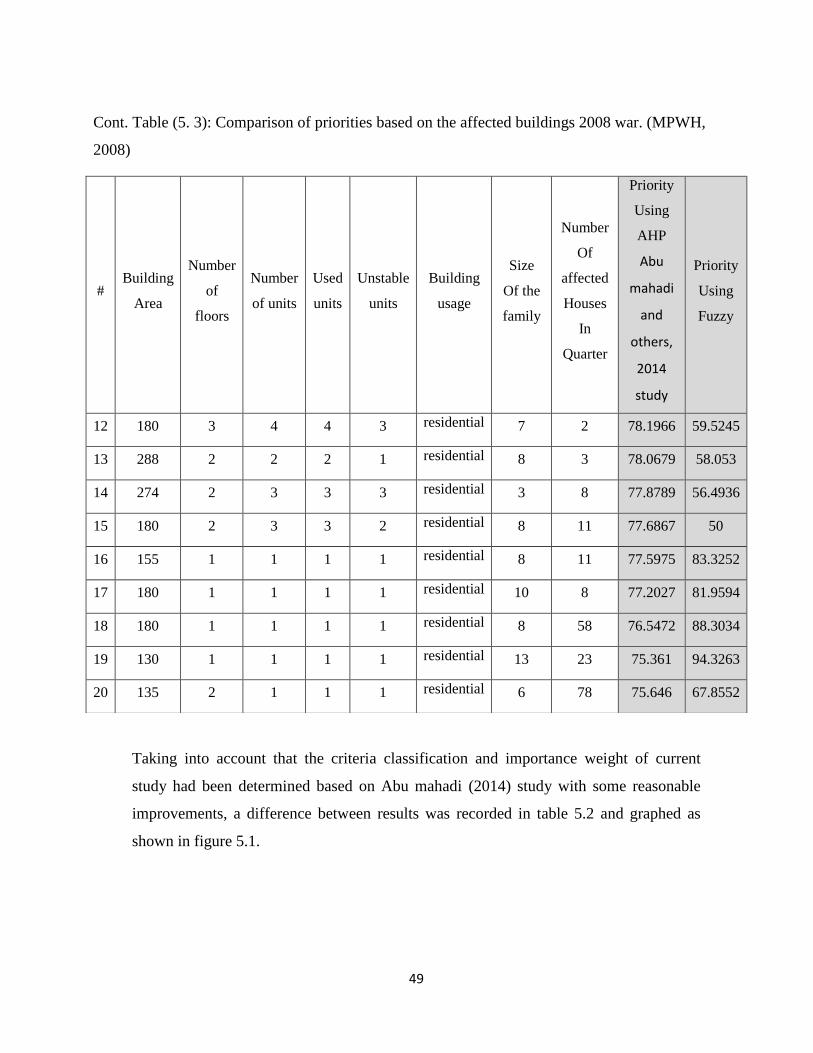
49
Taking into account that the criteria classification and importance weight of current
study had been determined based on Abu mahadi (2014) study with some reasonable
improvements, a difference between results was recorded in table 5.2 and graphed as
shown in figure 5.1.
Cont. Table (5. 3): Comparison of priorities based on the affected buildings 2008 war. (MPWH,
2008)
# Building
Area
Number
of
floors
Number
of units
Used
units
Unstable
units
Building
usage
Size
Of the
family
Number
Of
affected
Houses
In
Quarter
Priority
Using
AHP
Abu
mahadi
and
others,
2014
study
Priority
Using
Fuzzy
12 180 3 4 4 3 residential 7 2 78.1966 59.5245
13 288 2 2 2 1 residential 8 3 78.0679 58.053
14 274 2 3 3 3 residential 3 8 77.8789 56.4936
15 180 2 3 3 2 residential 8 11 77.6867 50
16 155 1 1 1 1 residential 8 11 77.5975 83.3252
17 180 1 1 1 1 residential 10 8 77.2027 81.9594
18 180 1 1 1 1 residential 8 58 76.5472 88.3034
19 130 1 1 1 1 residential 13 23 75.361 94.3263
20 135 2 1 1 1 residential 6 78 75.646 67.8552
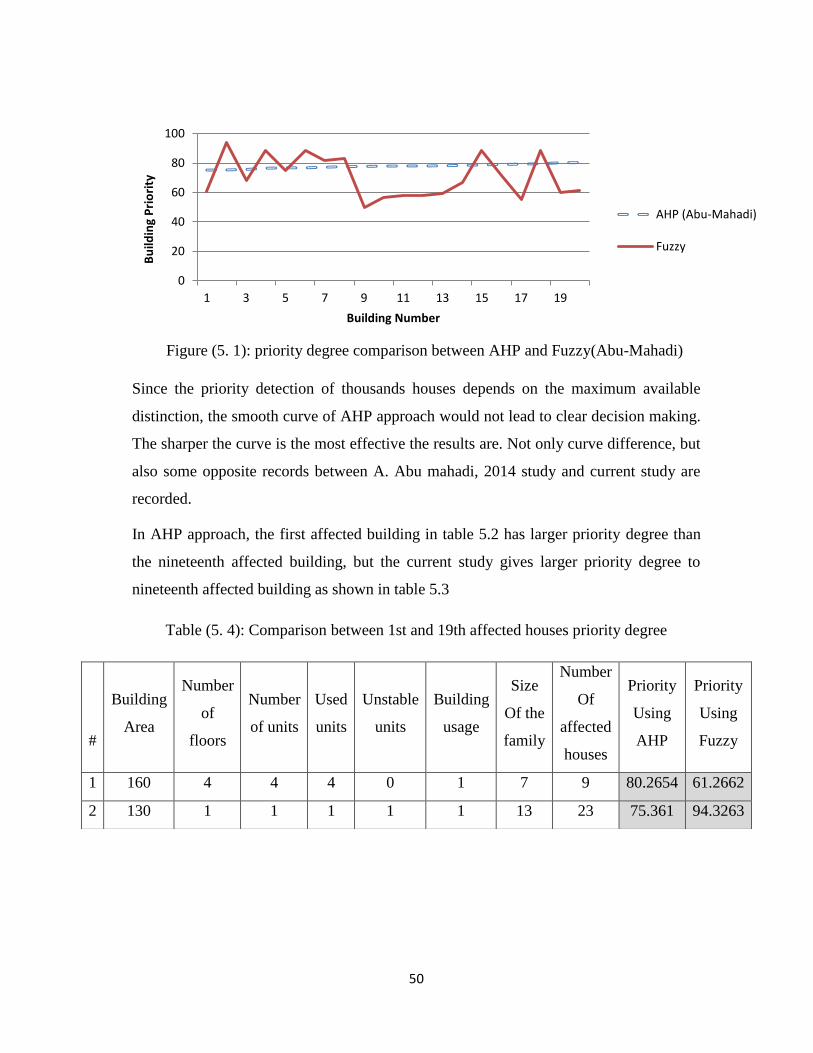
50
0
20
40
60
80
100
1 3 5 7 9 11 13 15 17 19
Bu
ildin
g P
rio
rity
Building Number
AHP (Abu-Mahadi)
Fuzzy
Since the priority detection of thousands houses depends on the maximum available
distinction, the smooth curve of AHP approach would not lead to clear decision making.
The sharper the curve is the most effective the results are. Not only curve difference, but
also some opposite records between A. Abu mahadi, 2014 study and current study are
recorded.
In AHP approach, the first affected building in table 5.2 has larger priority degree than
the nineteenth affected building, but the current study gives larger priority degree to
nineteenth affected building as shown in table 5.3
Table (5. 4): Comparison between 1st and 19th affected houses priority degree
#
Building
Area
Number
of
floors
Number
of units
Used
units
Unstable
units
Building
usage
Size
Of the
family
Number
Of
affected
houses
Priority
Using
AHP
Priority
Using
Fuzzy
1 160 4 4 4 0 1 7 9 80.2654 61.2662
2 130 1 1 1 1 1 13 23 75.361 94.3263
Figure (5. 1): priority degree comparison between AHP and Fuzzy(Abu-Mahadi)
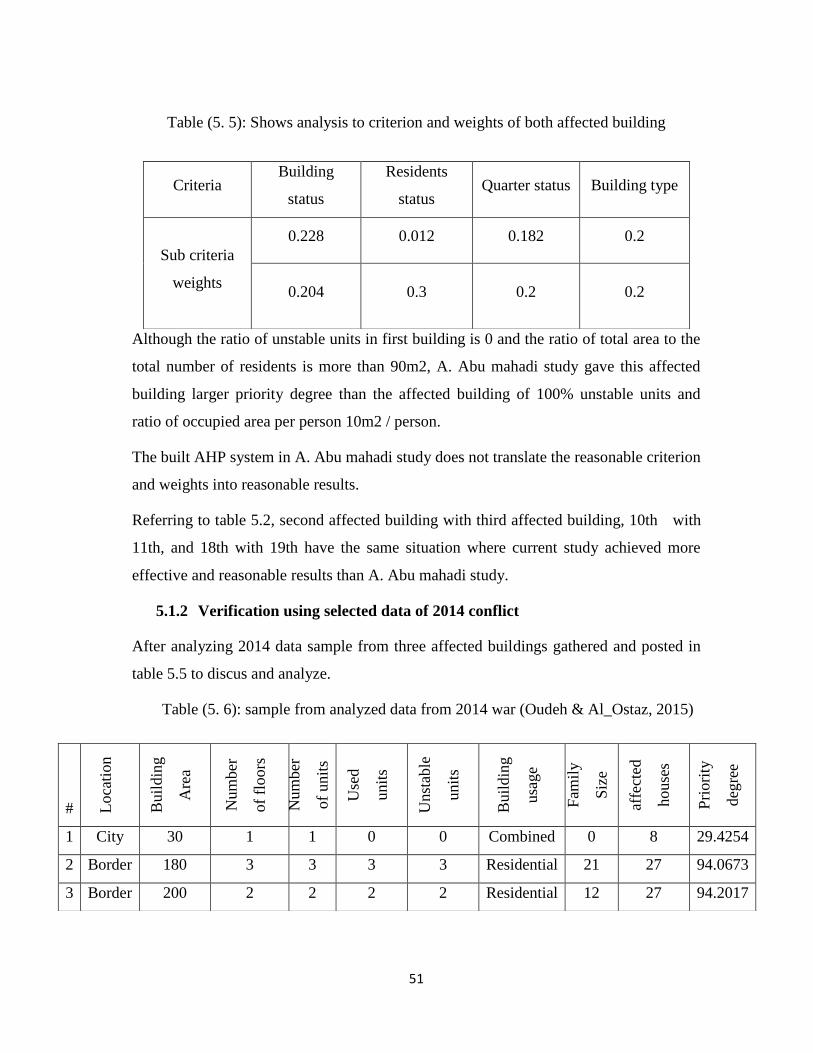
51
Table (5. 5): Shows analysis to criterion and weights of both affected building
Although the ratio of unstable units in first building is 0 and the ratio of total area to the
total number of residents is more than 90m2, A. Abu mahadi study gave this affected
building larger priority degree than the affected building of 100% unstable units and
ratio of occupied area per person 10m2 / person.
The built AHP system in A. Abu mahadi study does not translate the reasonable criterion
and weights into reasonable results.
Referring to table 5.2, second affected building with third affected building, 10th with
11th, and 18th with 19th have the same situation where current study achieved more
effective and reasonable results than A. Abu mahadi study.
5.1.2 Verification using selected data of 2014 conflict
After analyzing 2014 data sample from three affected buildings gathered and posted in
table 5.5 to discus and analyze.
Table (5. 6): sample from analyzed data from 2014 war (Oudeh & Al_Ostaz, 2015)
Criteria Building
status
Residents
status Quarter status Building type
Sub criteria
weights
0.228 0.012 0.182 0.2
0.204 0.3 0.2 0.2
# Loca
tion
Buil
din
g
Are
a
Num
ber
of
floors
Num
ber
of
unit
s
Use
d
unit
s
Unst
able
unit
s
Buil
din
g
usa
ge
Fam
ily
Siz
e
affe
cted
house
s
Pri
ori
ty
deg
ree
1 City 30 1 1 0 0 Combined 0 8 29.4254
2 Border 180 3 3 3 3 Residential 21 27 94.0673
3 Border 200 2 2 2 2 Residential 12 27 94.2017
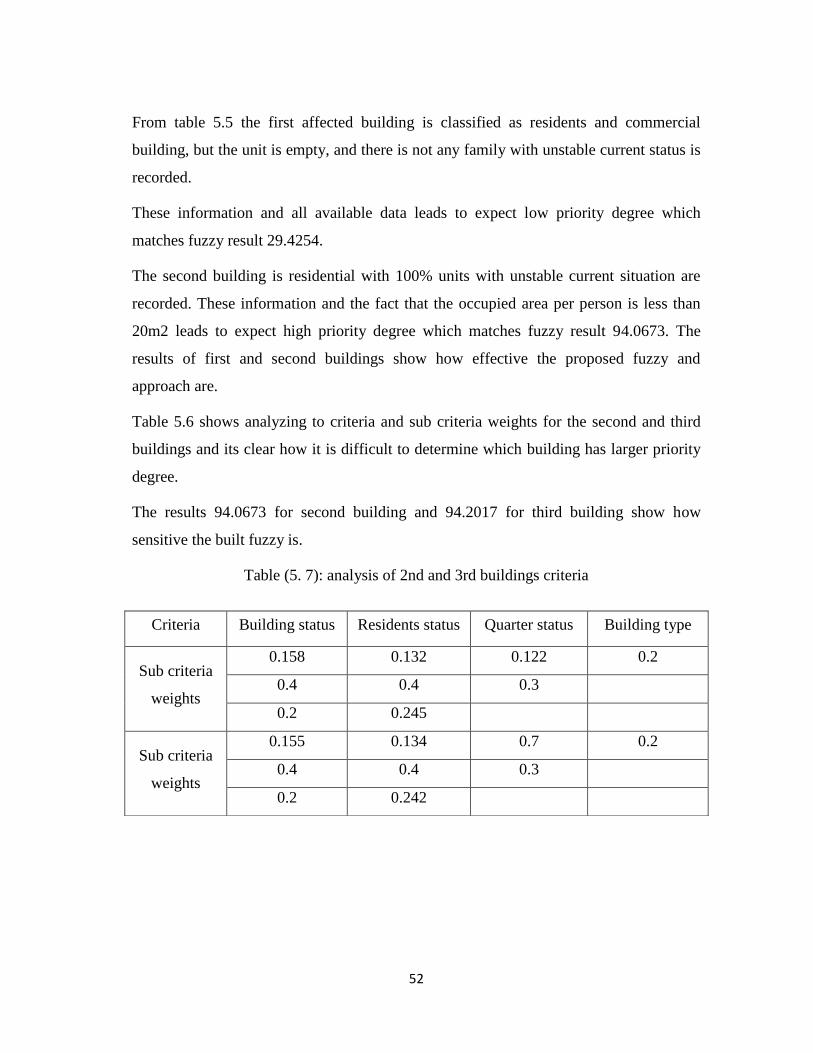
52
From table 5.5 the first affected building is classified as residents and commercial
building, but the unit is empty, and there is not any family with unstable current status is
recorded.
These information and all available data leads to expect low priority degree which
matches fuzzy result 29.4254.
The second building is residential with 100% units with unstable current situation are
recorded. These information and the fact that the occupied area per person is less than
20m2 leads to expect high priority degree which matches fuzzy result 94.0673. The
results of first and second buildings show how effective the proposed fuzzy and
approach are.
Table 5.6 shows analyzing to criteria and sub criteria weights for the second and third
buildings and its clear how it is difficult to determine which building has larger priority
degree.
The results 94.0673 for second building and 94.2017 for third building show how
sensitive the built fuzzy is.
Table (5. 7): analysis of 2nd and 3rd buildings criteria
Criteria Building status Residents status Quarter status Building type
Sub criteria
weights
0.158 0.132 0.122 0.2
0.4 0.4 0.3
0.2 0.245
Sub criteria
weights
0.155 0.134 0.7 0.2
0.4 0.4 0.3
0.2 0.242
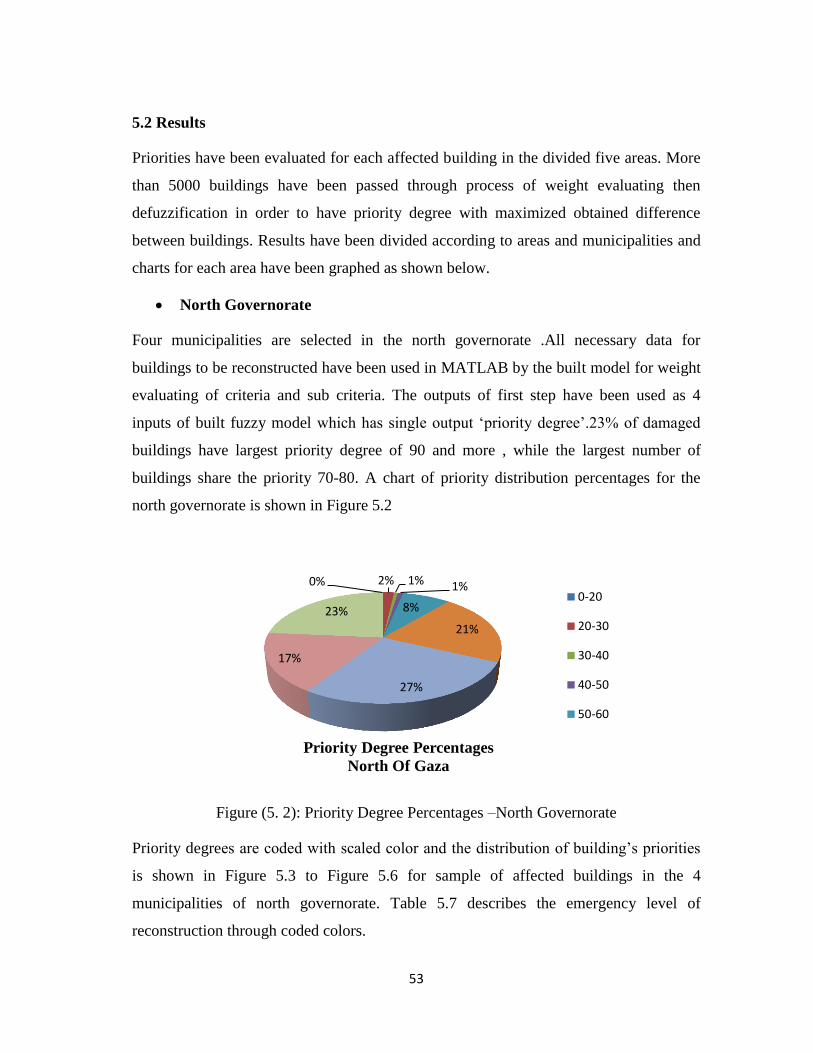
53
5.2 Results
Priorities have been evaluated for each affected building in the divided five areas. More
than 5000 buildings have been passed through process of weight evaluating then
defuzzification in order to have priority degree with maximized obtained difference
between buildings. Results have been divided according to areas and municipalities and
charts for each area have been graphed as shown below.
North Governorate
Four municipalities are selected in the north governorate .All necessary data for
buildings to be reconstructed have been used in MATLAB by the built model for weight
evaluating of criteria and sub criteria. The outputs of first step have been used as 4
inputs of built fuzzy model which has single output ‘priority degree’.23% of damaged
buildings have largest priority degree of 90 and more , while the largest number of
buildings share the priority 70-80. A chart of priority distribution percentages for the
north governorate is shown in Figure 5.2
Figure (5. 2): Priority Degree Percentages –North Governorate
Priority degrees are coded with scaled color and the distribution of building’s priorities
is shown in Figure 5.3 to Figure 5.6 for sample of affected buildings in the 4
municipalities of north governorate. Table 5.7 describes the emergency level of
reconstruction through coded colors.
0% 2% 1% 1%
8%
21%
27%
17%
23%
Priority Degree Percentages
North Of Gaza
0-20
20-30
30-40
40-50
50-60
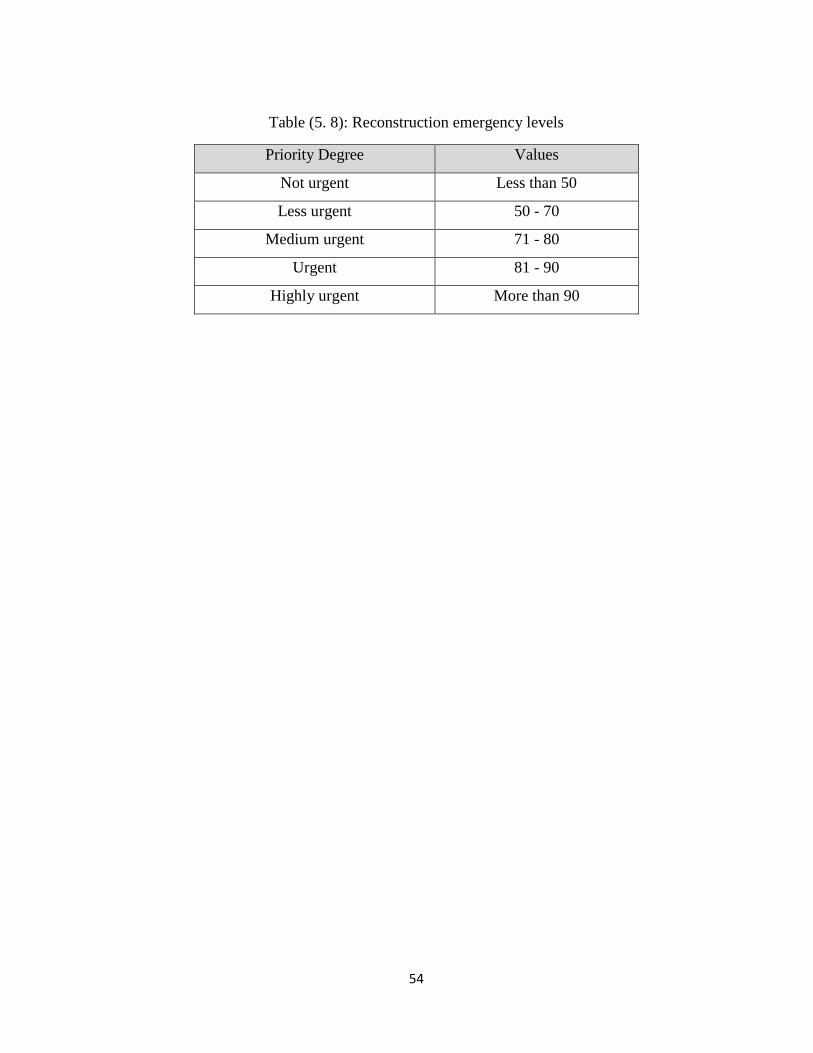
54
Table (5. 8): Reconstruction emergency levels
Priority Degree Values
Not urgent Less than 50
Less urgent 50 - 70
Medium urgent 71 - 80
Urgent 81 - 90
Highly urgent More than 90
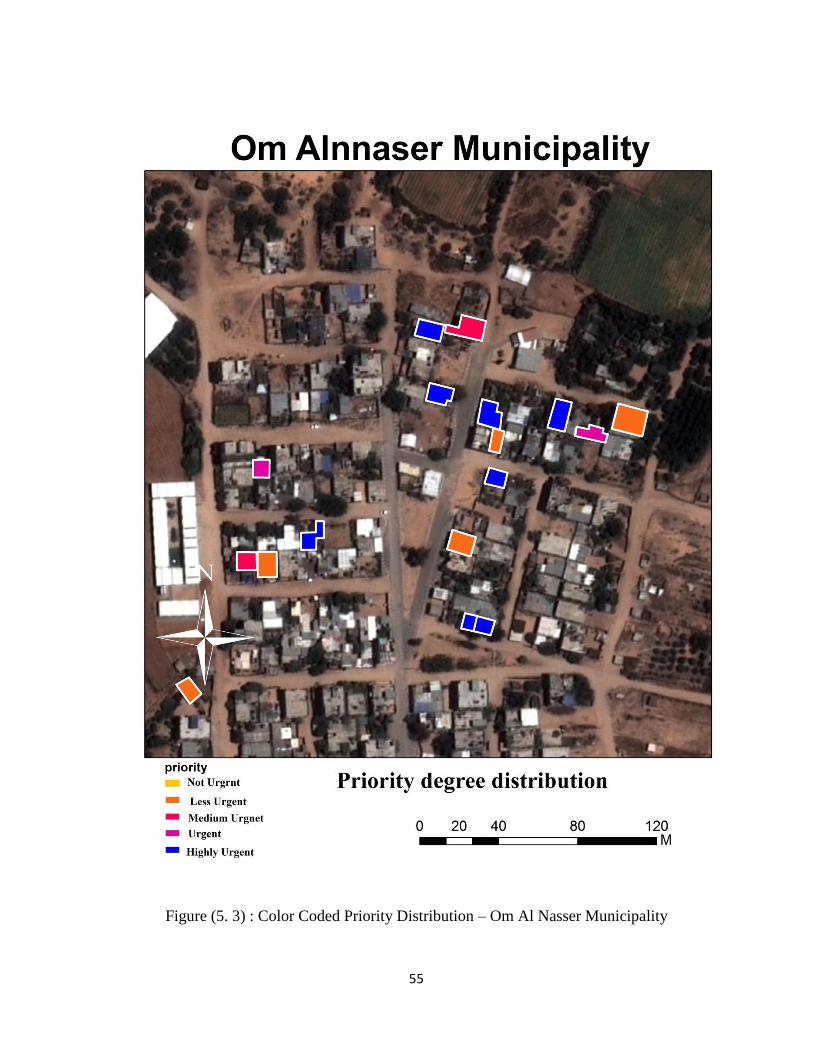
55
Figure (5. 3) : Color Coded Priority Distribution – Om Al Nasser Municipality
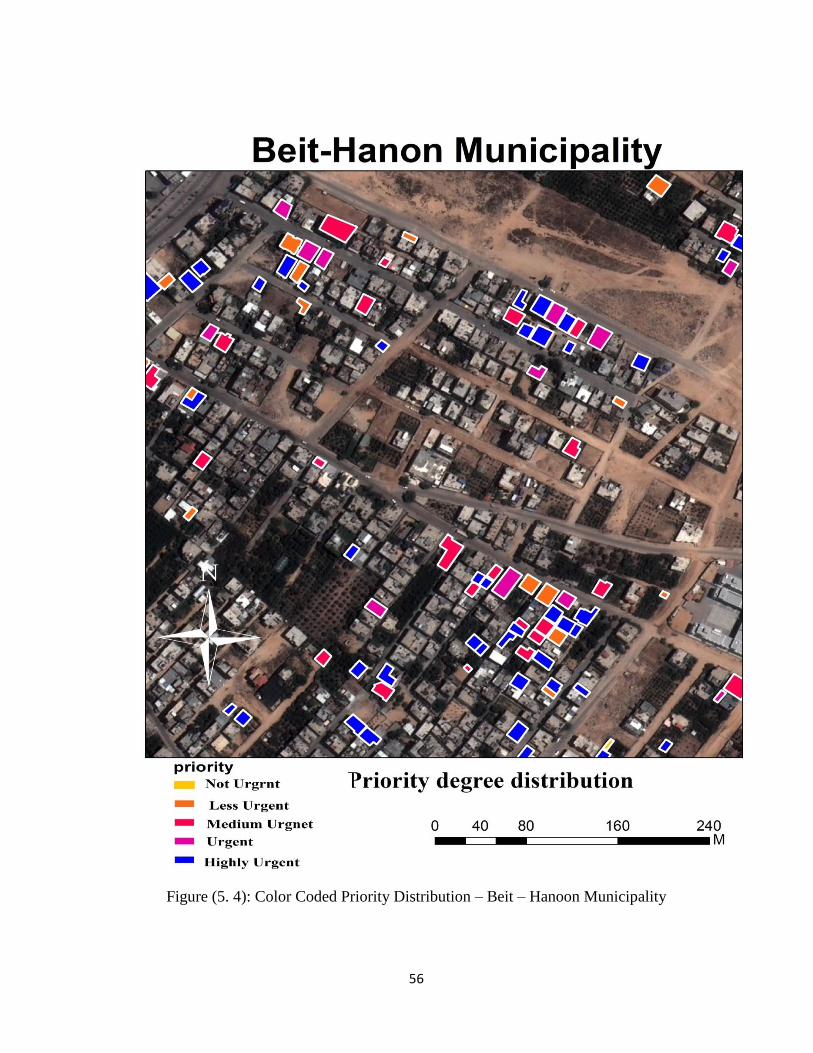
56
Figure (5. 4): Color Coded Priority Distribution – Beit – Hanoon Municipality
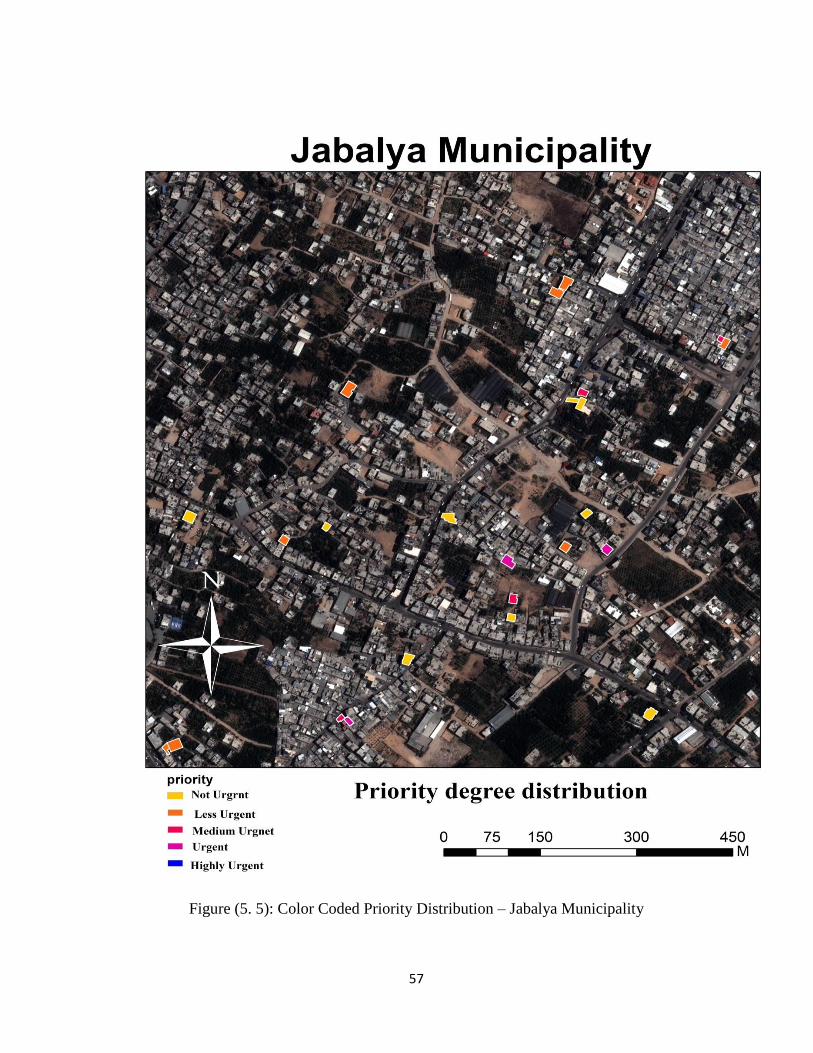
57
Figure (5. 5): Color Coded Priority Distribution – Jabalya Municipality
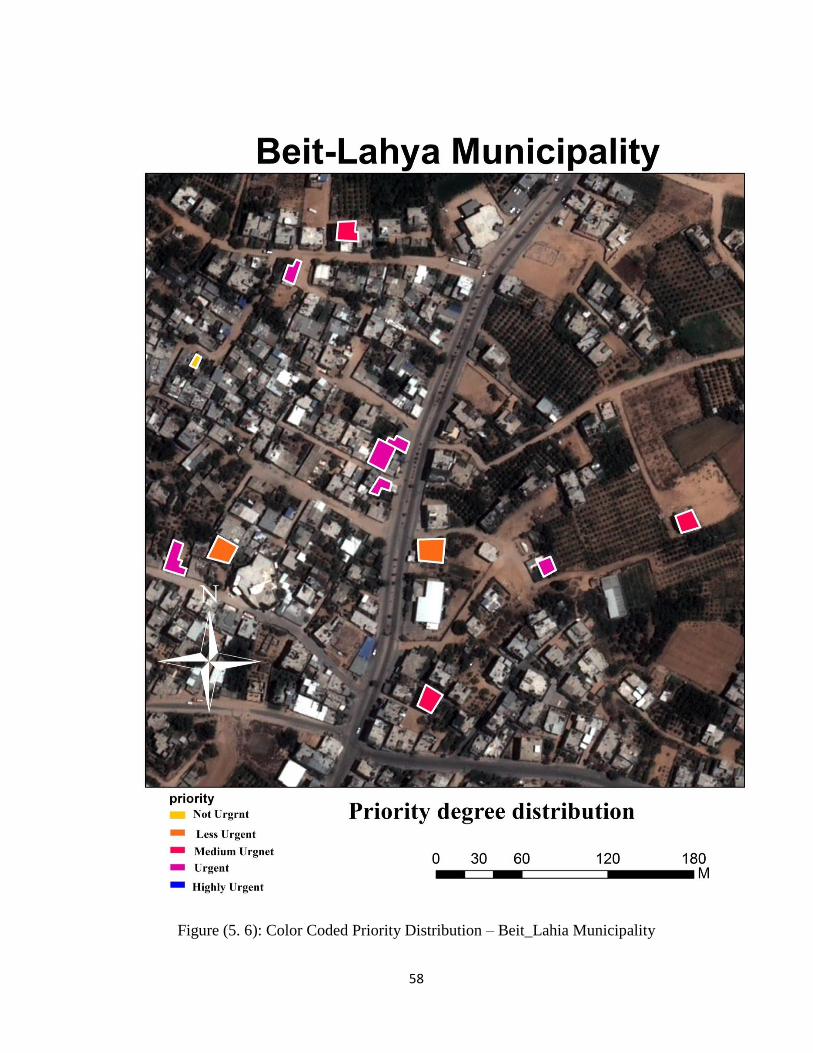
58
Figure (5. 6): Color Coded Priority Distribution – Beit_Lahia Municipality
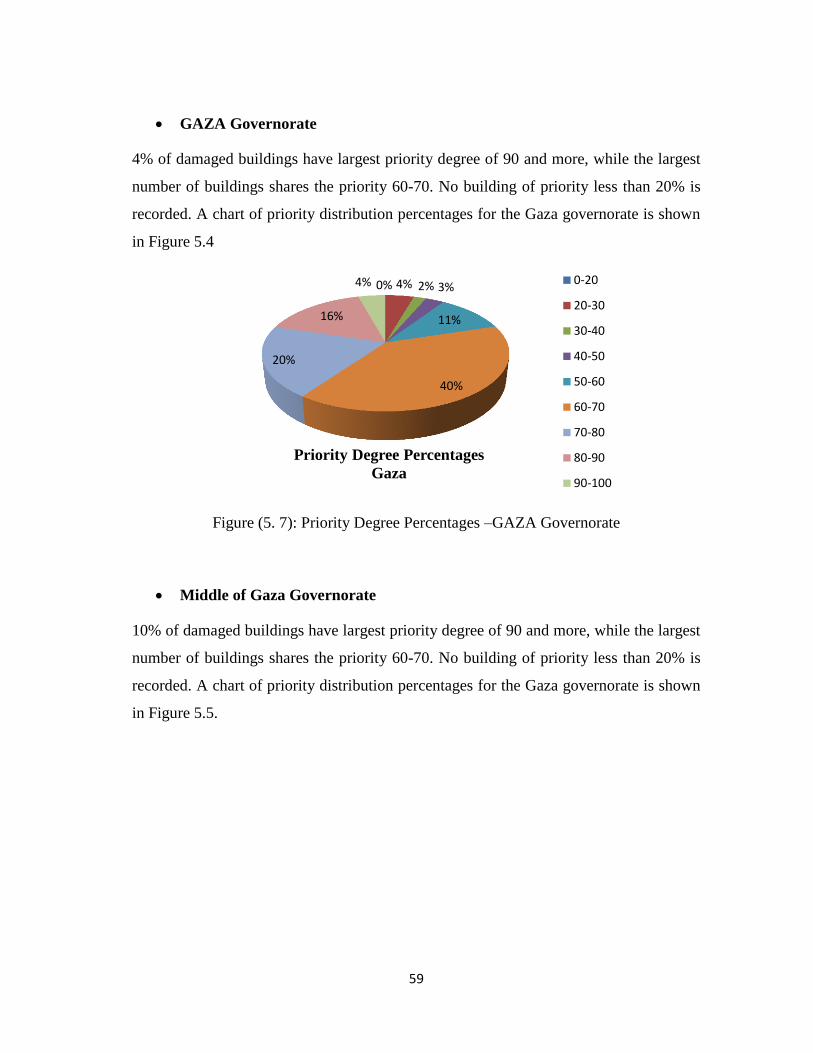
59
GAZA Governorate
4% of damaged buildings have largest priority degree of 90 and more, while the largest
number of buildings shares the priority 60-70. No building of priority less than 20% is
recorded. A chart of priority distribution percentages for the Gaza governorate is shown
in Figure 5.4
Figure (5. 7): Priority Degree Percentages –GAZA Governorate
Middle of Gaza Governorate
10% of damaged buildings have largest priority degree of 90 and more, while the largest
number of buildings shares the priority 60-70. No building of priority less than 20% is
recorded. A chart of priority distribution percentages for the Gaza governorate is shown
in Figure 5.5.
0% 4% 2% 3%
11%
40%
20%
16%
4%
Priority Degree Percentages
Gaza
0-20
20-30
30-40
40-50
50-60
60-70
70-80
80-90
90-100
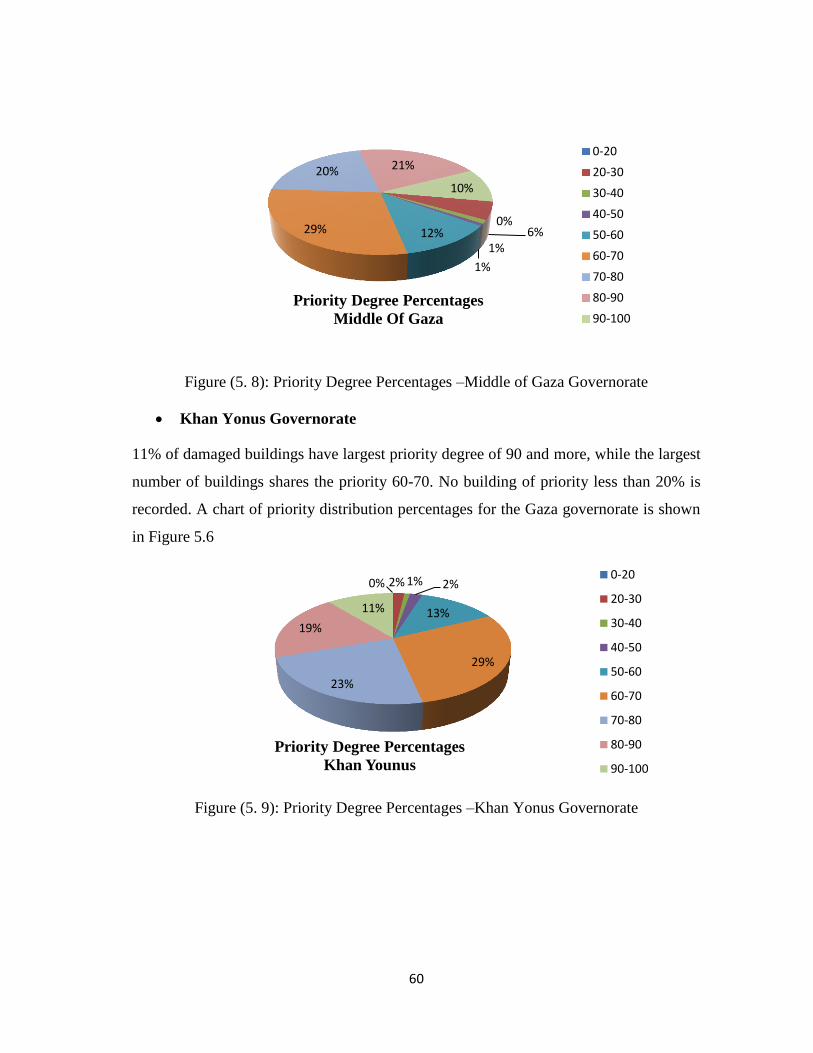
60
Figure (5. 8): Priority Degree Percentages –Middle of Gaza Governorate
Khan Yonus Governorate
11% of damaged buildings have largest priority degree of 90 and more, while the largest
number of buildings shares the priority 60-70. No building of priority less than 20% is
recorded. A chart of priority distribution percentages for the Gaza governorate is shown
in Figure 5.6
Figure (5. 9): Priority Degree Percentages –Khan Yonus Governorate
0% 6%
1%
1%
12% 29%
20% 21%
10%
Priority Degree Percentages
Middle Of Gaza
0-20
20-30
30-40
40-50
50-60
60-70
70-80
80-90
90-100
0% 2% 1% 2%
13%
29%
23%
19%
11%
Priority Degree Percentages
Khan Younus
0-20
20-30
30-40
40-50
50-60
60-70
70-80
80-90
90-100
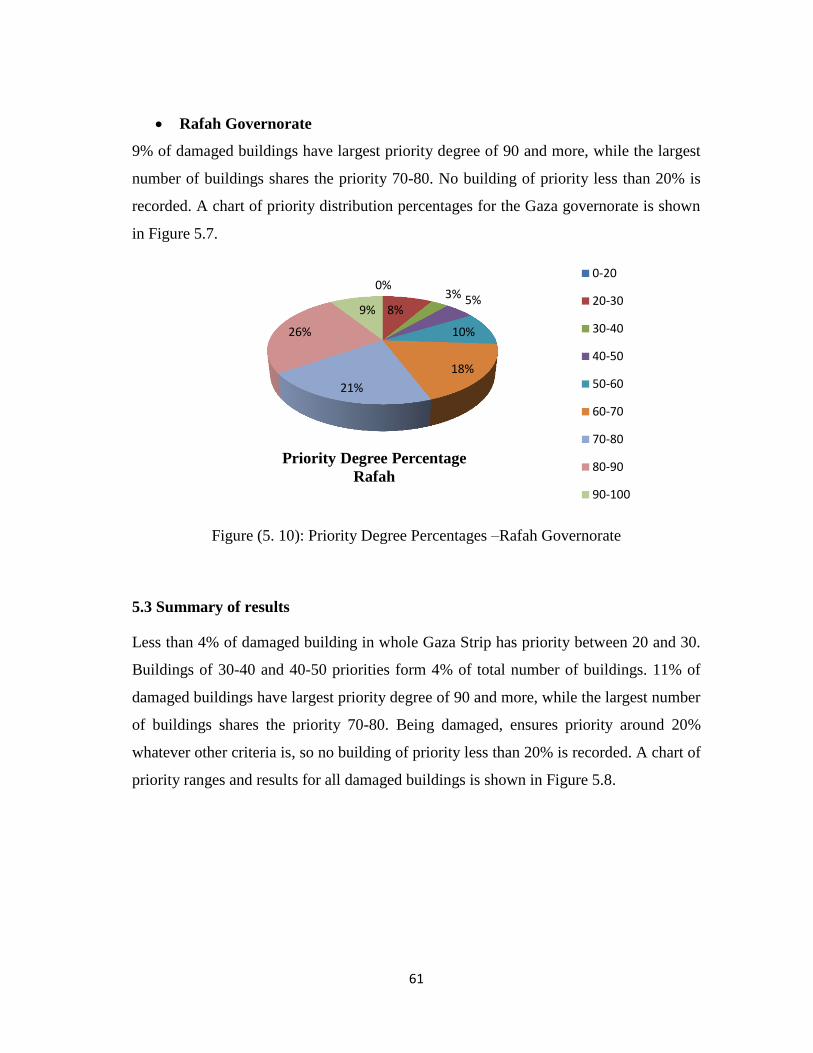
61
Rafah Governorate
9% of damaged buildings have largest priority degree of 90 and more, while the largest
number of buildings shares the priority 70-80. No building of priority less than 20% is
recorded. A chart of priority distribution percentages for the Gaza governorate is shown
in Figure 5.7.
Figure (5. 10): Priority Degree Percentages –Rafah Governorate
5.3 Summary of results
Less than 4% of damaged building in whole Gaza Strip has priority between 20 and 30.
Buildings of 30-40 and 40-50 priorities form 4% of total number of buildings. 11% of
damaged buildings have largest priority degree of 90 and more, while the largest number
of buildings shares the priority 70-80. Being damaged, ensures priority around 20%
whatever other criteria is, so no building of priority less than 20% is recorded. A chart of
priority ranges and results for all damaged buildings is shown in Figure 5.8.
0%
8% 3% 5%
10%
18%
21%
26%
9%
Priority Degree Percentage
Rafah
0-20
20-30
30-40
40-50
50-60
60-70
70-80
80-90
90-100
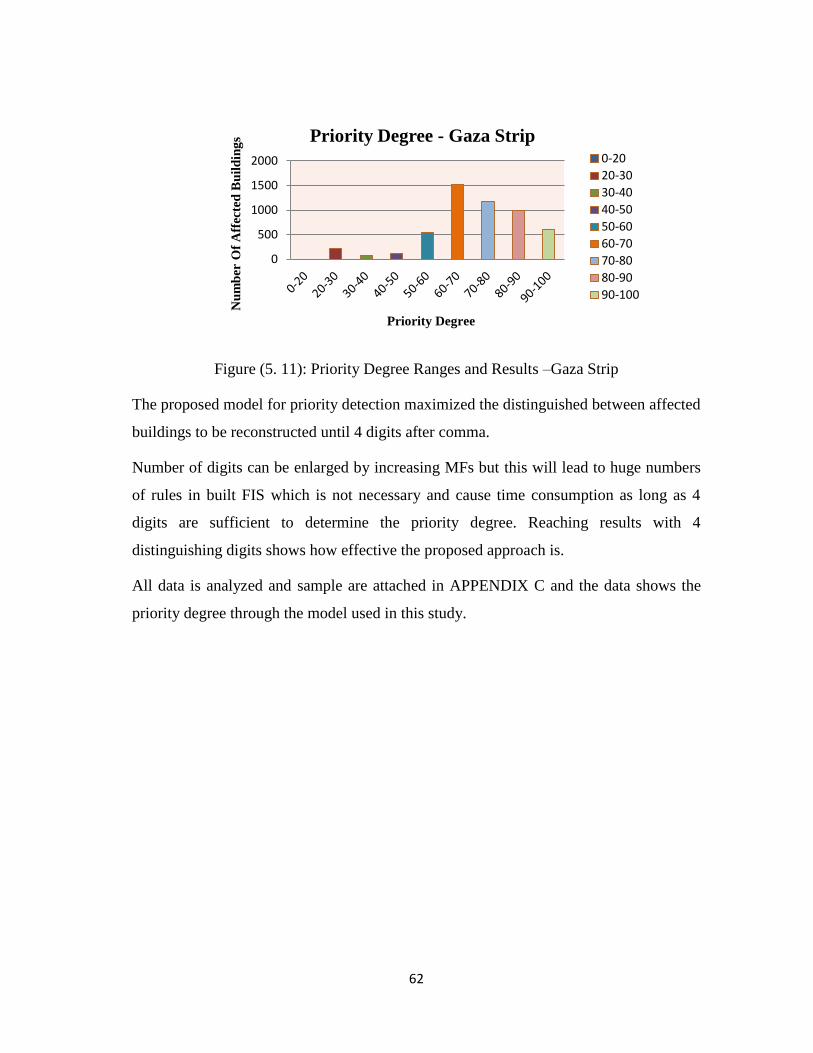
62
Figure (5. 11): Priority Degree Ranges and Results –Gaza Strip
The proposed model for priority detection maximized the distinguished between affected
buildings to be reconstructed until 4 digits after comma.
Number of digits can be enlarged by increasing MFs but this will lead to huge numbers
of rules in built FIS which is not necessary and cause time consumption as long as 4
digits are sufficient to determine the priority degree. Reaching results with 4
distinguishing digits shows how effective the proposed approach is.
All data is analyzed and sample are attached in APPENDIX C and the data shows the
priority degree through the model used in this study.
0
500
1000
1500
2000
Nu
mb
er O
f A
ffec
ted
Bu
ild
ing
s
Priority Degree
Priority Degree - Gaza Strip 0-20
20-30
30-40
40-50
50-60
60-70
70-80
80-90
90-100
63
Chapter 6
Conclusion and
Recommendations
64
Chapter 6
Conclusion and Recommendations
6.1 Introduction:
This study aims to provide a favorable approach to ensure stability and security of
houses reconstruction after disasters and can be divided into two axes:
1) As reconstruction process is restricted by many constraints and cannot be
achieved on all affected buildings at the same time , in this study a reasonable
weighing approach for each affected building is provided. Weights were given
taking into account all constraints and all relative families situations before and
after disaster.
2) Governments and decision makers are obsessed with fair consequence of
reconstruction. For this purpose they need plans and procedures in order to have
the optimal consequence of thousands of totally damaged buildings. This study
provides an effective model based on fuzzy logic model, unlike classical set
models, maximizes the difference between priorities of buildings.
6.2 Conclusions on the model:
This study tries to provide a model to provide such a fair priority distribution. Many
researchers studied reconstruction plans. Most of these researches relocate affected
people in different places in order to obtain modern style of the country. Modern style of
country cannot be taken into account neglecting the life style of affected people and
relocating their houses transfers them from active into inactive status.
This study firstly provides reasonable weights of each building and then fuzzy model
was built to evaluate priority degree of each building individually, subject to maximum
achievable difference between priorities.
All achieved results prove that the proposed approach is favorable, effective and can be
applied on area with complex conditions like Gaza Strip.
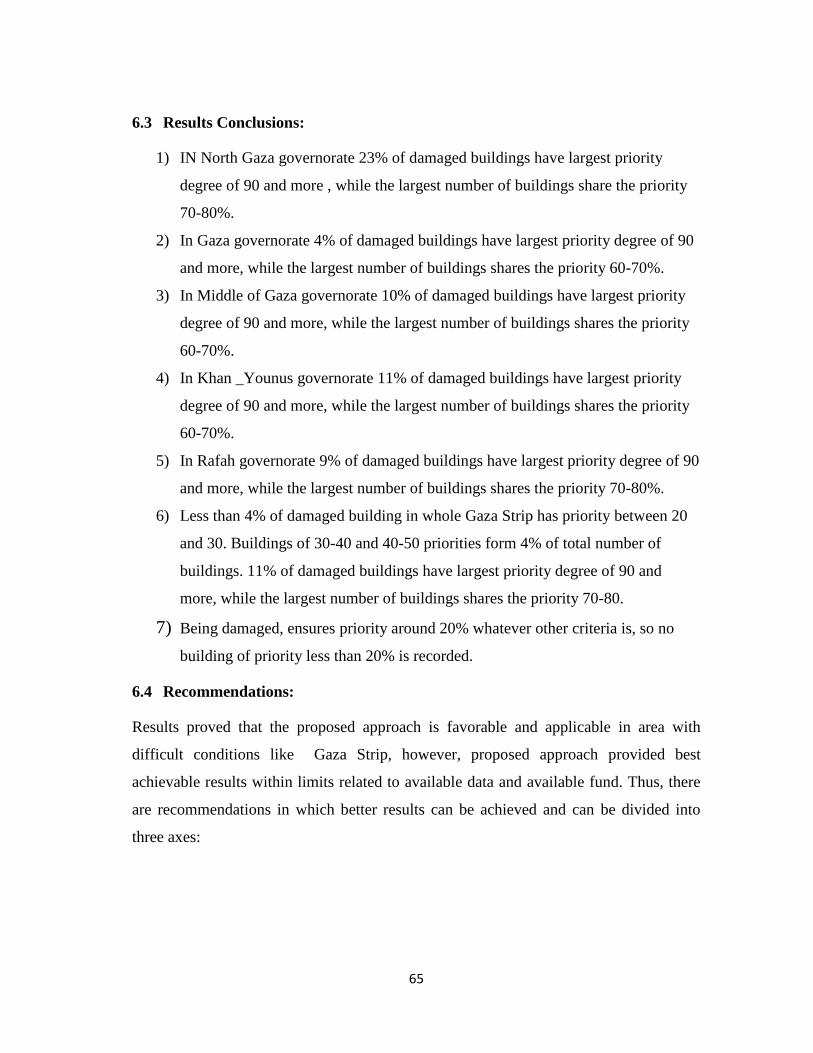
65
6.3 Results Conclusions:
1) IN North Gaza governorate 23% of damaged buildings have largest priority
degree of 90 and more , while the largest number of buildings share the priority
70-80%.
2) In Gaza governorate 4% of damaged buildings have largest priority degree of 90
and more, while the largest number of buildings shares the priority 60-70%.
3) In Middle of Gaza governorate 10% of damaged buildings have largest priority
degree of 90 and more, while the largest number of buildings shares the priority
60-70%.
4) In Khan _Younus governorate 11% of damaged buildings have largest priority
degree of 90 and more, while the largest number of buildings shares the priority
60-70%.
5) In Rafah governorate 9% of damaged buildings have largest priority degree of 90
and more, while the largest number of buildings shares the priority 70-80%.
6) Less than 4% of damaged building in whole Gaza Strip has priority between 20
and 30. Buildings of 30-40 and 40-50 priorities form 4% of total number of
buildings. 11% of damaged buildings have largest priority degree of 90 and
more, while the largest number of buildings shares the priority 70-80.
7) Being damaged, ensures priority around 20% whatever other criteria is, so no
building of priority less than 20% is recorded.
6.4 Recommendations:
Results proved that the proposed approach is favorable and applicable in area with
difficult conditions like Gaza Strip, however, proposed approach provided best
achievable results within limits related to available data and available fund. Thus, there
are recommendations in which better results can be achieved and can be divided into
three axes:
66
Improvement of data collection
Since units in last floors cannot be reconstructed before units in first floors even if their
priority degrees are larger , it is strongly recommended that for data to be collected for
buildings not for units. Gathering data of units to form building data was a kind of time
consumption in this study. Moreover, dealing with affected buildings within specific
governorates is recommended rather than dealing with it as single area of large number
of units. This leads to higher efficiency in controlling the process of reconstruction. Add
to this , it is worthwhile to collect data about the contribution of each building in
national income.
Centralizing fund
Most of provided funds were restricted and directed into specific units area. Its strongly
recommended to propose a methodology to donors in which all fund from all donors can
be controlled and directed from main insurance box according to plans driven by
specialists who are more capable to evaluate the situation.
Built model
MF’s of fuzzy inputs and output can be increased in order to get results with digits larger
than four, but this will lead to huge number of rules in built fuzzy model. Thus, a
necessity measuring system is recommended to make right decision of enlarging number
of rules according to number of buildings to be reconstructed. Moreover, a modification
in built model in which it can evaluate the cost of reconstructing buildings share the
same range of priority degrees is recommended. This can help in presenting fund
proposals.

67
References
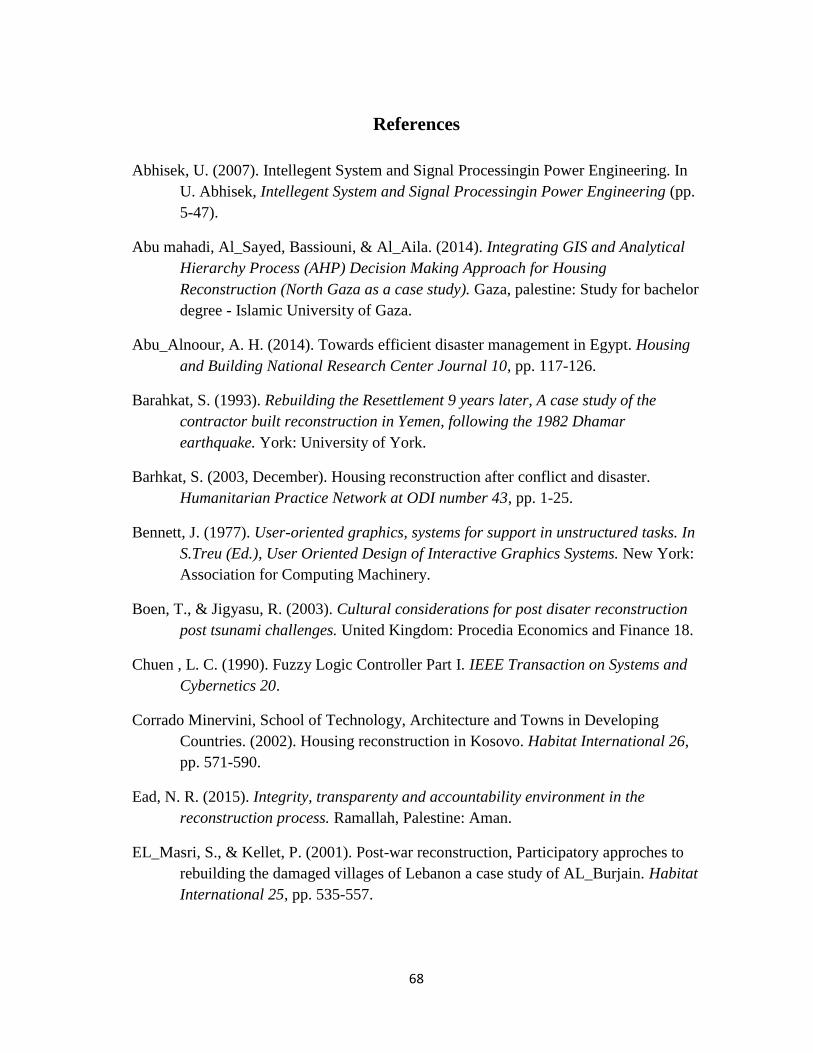
68
References
Abhisek, U. (2007). Intellegent System and Signal Processingin Power Engineering. In
U. Abhisek, Intellegent System and Signal Processingin Power Engineering (pp.
5-47).
Abu mahadi, Al_Sayed, Bassiouni, & Al_Aila. (2014). Integrating GIS and Analytical
Hierarchy Process (AHP) Decision Making Approach for Housing
Reconstruction (North Gaza as a case study). Gaza, palestine: Study for bachelor
degree - Islamic University of Gaza.
Abu_Alnoour, A. H. (2014). Towards efficient disaster management in Egypt. Housing
and Building National Research Center Journal 10, pp. 117-126.
Barahkat, S. (1993). Rebuilding the Resettlement 9 years later, A case study of the
contractor built reconstruction in Yemen, following the 1982 Dhamar
earthquake. York: University of York.
Barhkat, S. (2003, December). Housing reconstruction after conflict and disaster.
Humanitarian Practice Network at ODI number 43, pp. 1-25.
Bennett, J. (1977). User-oriented graphics, systems for support in unstructured tasks. In
S.Treu (Ed.), User Oriented Design of Interactive Graphics Systems. New York:
Association for Computing Machinery.
Boen, T., & Jigyasu, R. (2003). Cultural considerations for post disater reconstruction
post tsunami challenges. United Kingdom: Procedia Economics and Finance 18.
Chuen , L. C. (1990). Fuzzy Logic Controller Part I. IEEE Transaction on Systems and
Cybernetics 20.
Corrado Minervini, School of Technology, Architecture and Towns in Developing
Countries. (2002). Housing reconstruction in Kosovo. Habitat International 26,
pp. 571-590.
Ead, N. R. (2015). Integrity, transparenty and accountability environment in the
reconstruction process. Ramallah, Palestine: Aman.
EL_Masri, S., & Kellet, P. (2001). Post-war reconstruction, Participatory approches to
rebuilding the damaged villages of Lebanon a case study of AL_Burjain. Habitat
International 25, pp. 535-557.
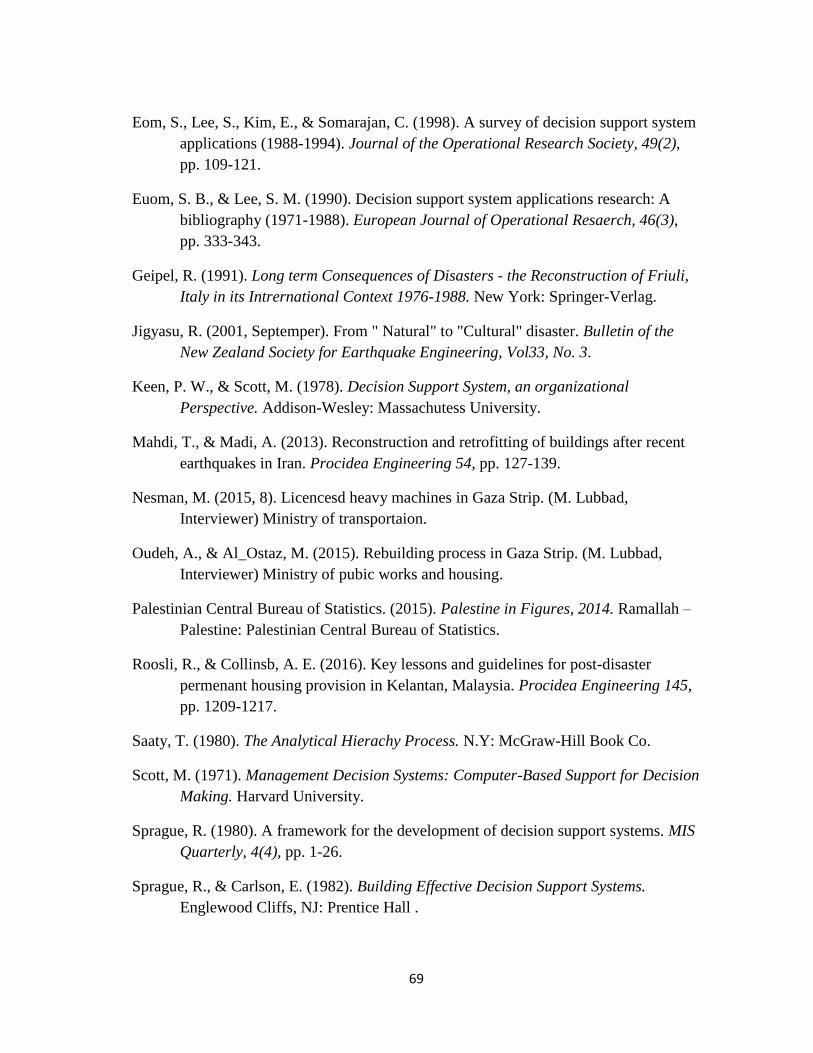
69
Eom, S., Lee, S., Kim, E., & Somarajan, C. (1998). A survey of decision support system
applications (1988-1994). Journal of the Operational Research Society, 49(2),
pp. 109-121.
Euom, S. B., & Lee, S. M. (1990). Decision support system applications research: A
bibliography (1971-1988). European Journal of Operational Resaerch, 46(3),
pp. 333-343.
Geipel, R. (1991). Long term Consequences of Disasters - the Reconstruction of Friuli,
Italy in its Intrernational Context 1976-1988. New York: Springer-Verlag.
Jigyasu, R. (2001, Septemper). From " Natural" to "Cultural" disaster. Bulletin of the
New Zealand Society for Earthquake Engineering, Vol33, No. 3.
Keen, P. W., & Scott, M. (1978). Decision Support System, an organizational
Perspective. Addison-Wesley: Massachutess University.
Mahdi, T., & Madi, A. (2013). Reconstruction and retrofitting of buildings after recent
earthquakes in Iran. Procidea Engineering 54, pp. 127-139.
Nesman, M. (2015, 8). Licencesd heavy machines in Gaza Strip. (M. Lubbad,
Interviewer) Ministry of transportaion.
Oudeh, A., & Al_Ostaz, M. (2015). Rebuilding process in Gaza Strip. (M. Lubbad,
Interviewer) Ministry of pubic works and housing.
Palestinian Central Bureau of Statistics. (2015). Palestine in Figures, 2014. Ramallah –
Palestine: Palestinian Central Bureau of Statistics.
Roosli, R., & Collinsb, A. E. (2016). Key lessons and guidelines for post-disaster
permenant housing provision in Kelantan, Malaysia. Procidea Engineering 145,
pp. 1209-1217.
Saaty, T. (1980). The Analytical Hierachy Process. N.Y: McGraw-Hill Book Co.
Scott, M. (1971). Management Decision Systems: Computer-Based Support for Decision
Making. Harvard University.
Sprague, R. (1980). A framework for the development of decision support systems. MIS
Quarterly, 4(4), pp. 1-26.
Sprague, R., & Carlson, E. (1982). Building Effective Decision Support Systems.
Englewood Cliffs, NJ: Prentice Hall .

70
Watson, H., & Sprague, R. (1989). Decision Support Systems: Putting Theory into
Practice (2nd ed.). Englewood Cliffs, NJ: Prentice Hall.
Yi, H., & Yang, J. (2014). Research trends of post disaster reconstruction: The past and
the future. Habitat International 42, pp. 21-24.

71
Appendices
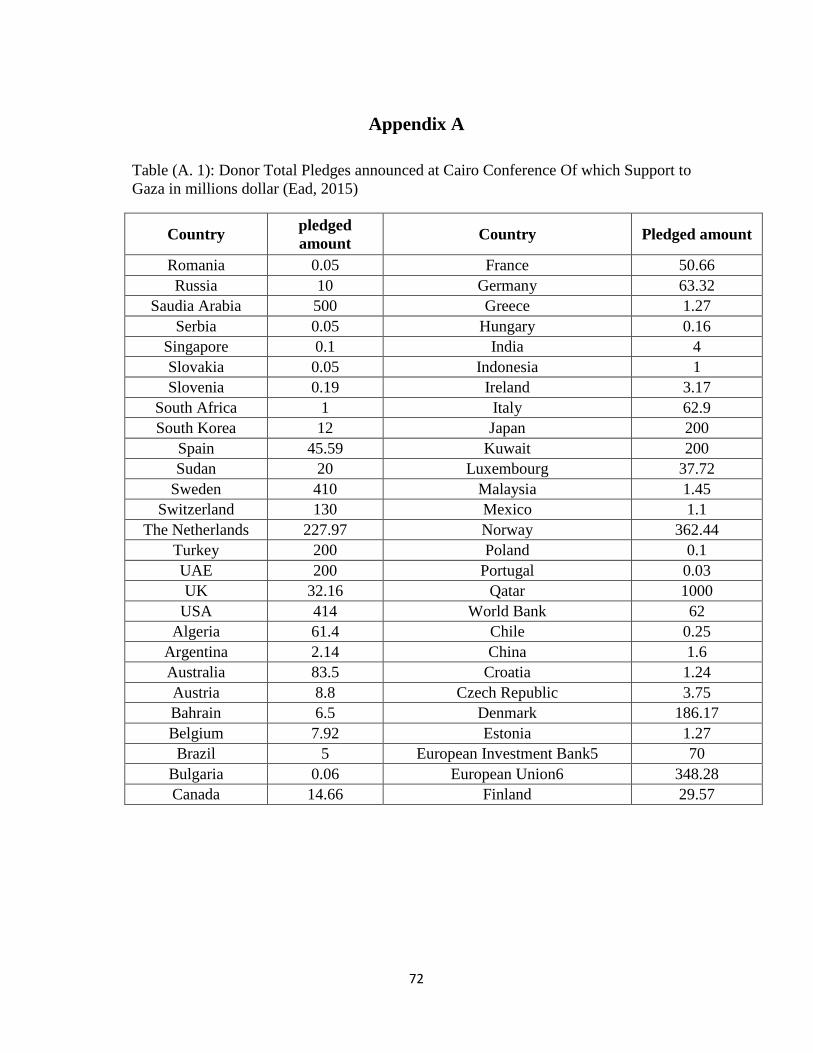
72
Appendix A
Table (A. 1): Donor Total Pledges announced at Cairo Conference Of which Support to
Gaza in millions dollar (Ead, 2015)
Country pledged
amount Country Pledged amount
Romania 0.05 France 50.66
Russia 10 Germany 63.32
Saudia Arabia 500 Greece 1.27
Serbia 0.05 Hungary 0.16
Singapore 0.1 India 4
Slovakia 0.05 Indonesia 1
Slovenia 0.19 Ireland 3.17
South Africa 1 Italy 62.9
South Korea 12 Japan 200
Spain 45.59 Kuwait 200
Sudan 20 Luxembourg 37.72
Sweden 410 Malaysia 1.45
Switzerland 130 Mexico 1.1
The Netherlands 227.97 Norway 362.44
Turkey 200 Poland 0.1
UAE 200 Portugal 0.03
UK 32.16 Qatar 1000
USA 414 World Bank 62
Algeria 61.4 Chile 0.25
Argentina 2.14 China 1.6
Australia 83.5 Croatia 1.24
Austria 8.8 Czech Republic 3.75
Bahrain 6.5 Denmark 186.17
Belgium 7.92 Estonia 1.27
Brazil 5 European Investment Bank5 70
Bulgaria 0.06 European Union6 348.28
Canada 14.66 Finland 29.57
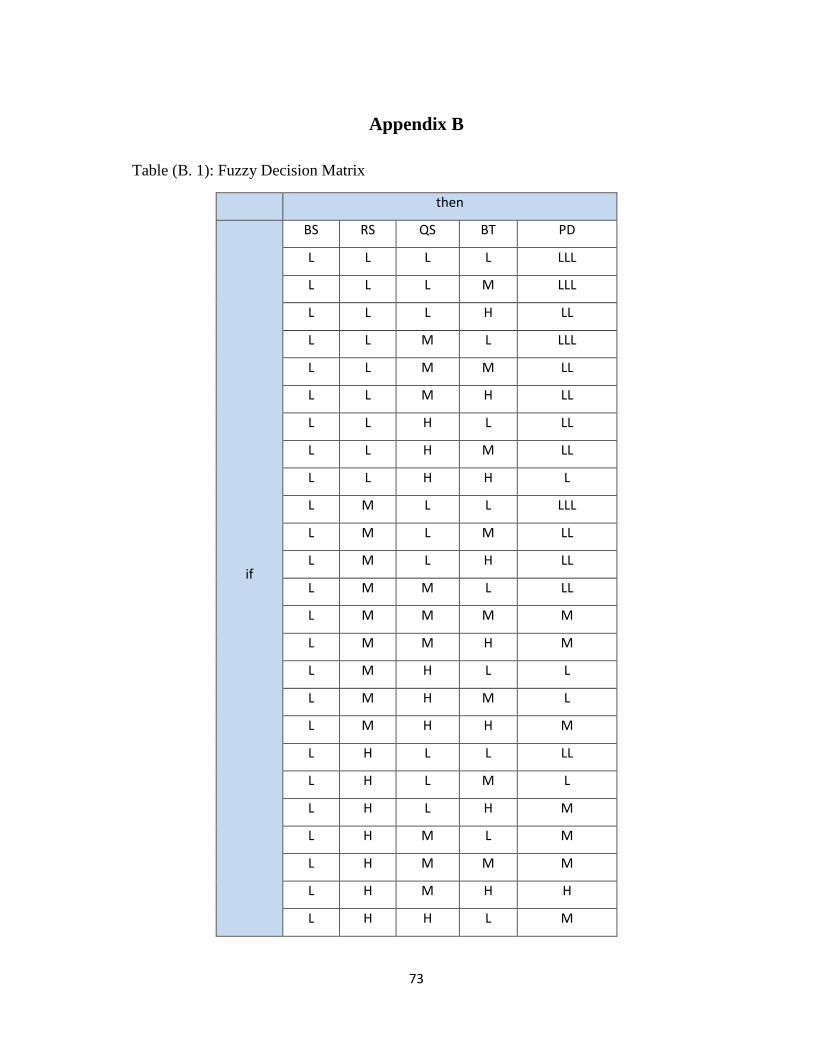
73
Appendix B
Table (B. 1): Fuzzy Decision Matrix
then
if
BS RS QS BT PD
L L L L LLL
L L L M LLL
L L L H LL
L L M L LLL
L L M M LL
L L M H LL
L L H L LL
L L H M LL
L L H H L
L M L L LLL
L M L M LL
L M L H LL
L M M L LL
L M M M M
L M M H M
L M H L L
L M H M L
L M H H M
L H L L LL
L H L M L
L H L H M
L H M L M
L H M M M
L H M H H
L H H L M
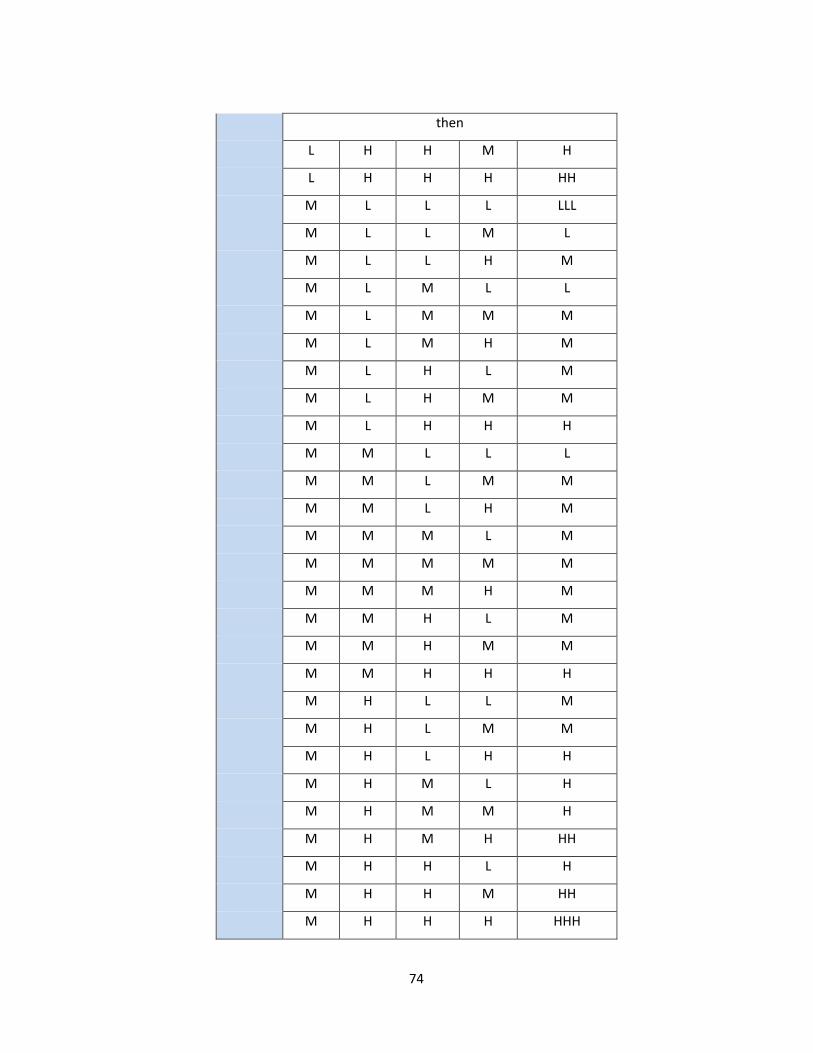
74
then
L H H M H
L H H H HH
M L L L LLL
M L L M L
M L L H M
M L M L L
M L M M M
M L M H M
M L H L M
M L H M M
M L H H H
M M L L L
M M L M M
M M L H M
M M M L M
M M M M M
M M M H M
M M H L M
M M H M M
M M H H H
M H L L M
M H L M M
M H L H H
M H M L H
M H M M H
M H M H HH
M H H L H
M H H M HH
M H H H HHH
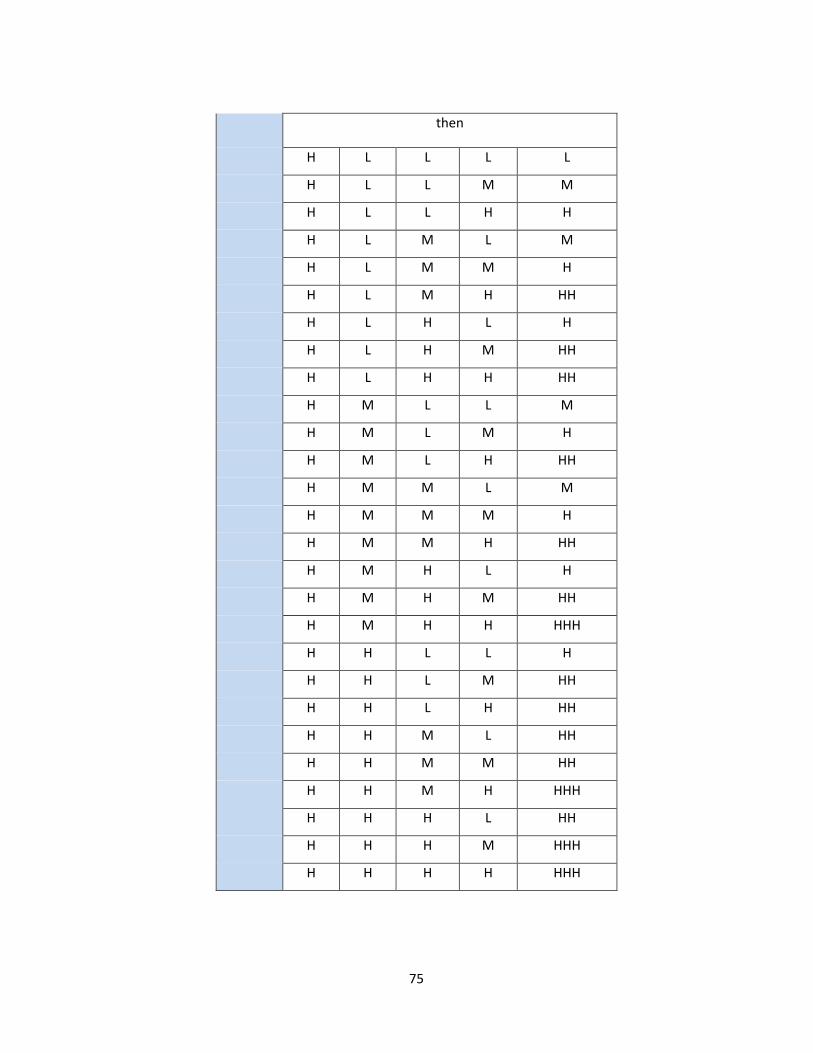
75
then
H L L L L
H L L M M
H L L H H
H L M L M
H L M M H
H L M H HH
H L H L H
H L H M HH
H L H H HH
H M L L M
H M L M H
H M L H HH
H M M L M
H M M M H
H M M H HH
H M H L H
H M H M HH
H M H H HHH
H H L L H
H H L M HH
H H L H HH
H H M L HH
H H M M HH
H H M H HHH
H H H L HH
H H H M HHH
H H H H HHH
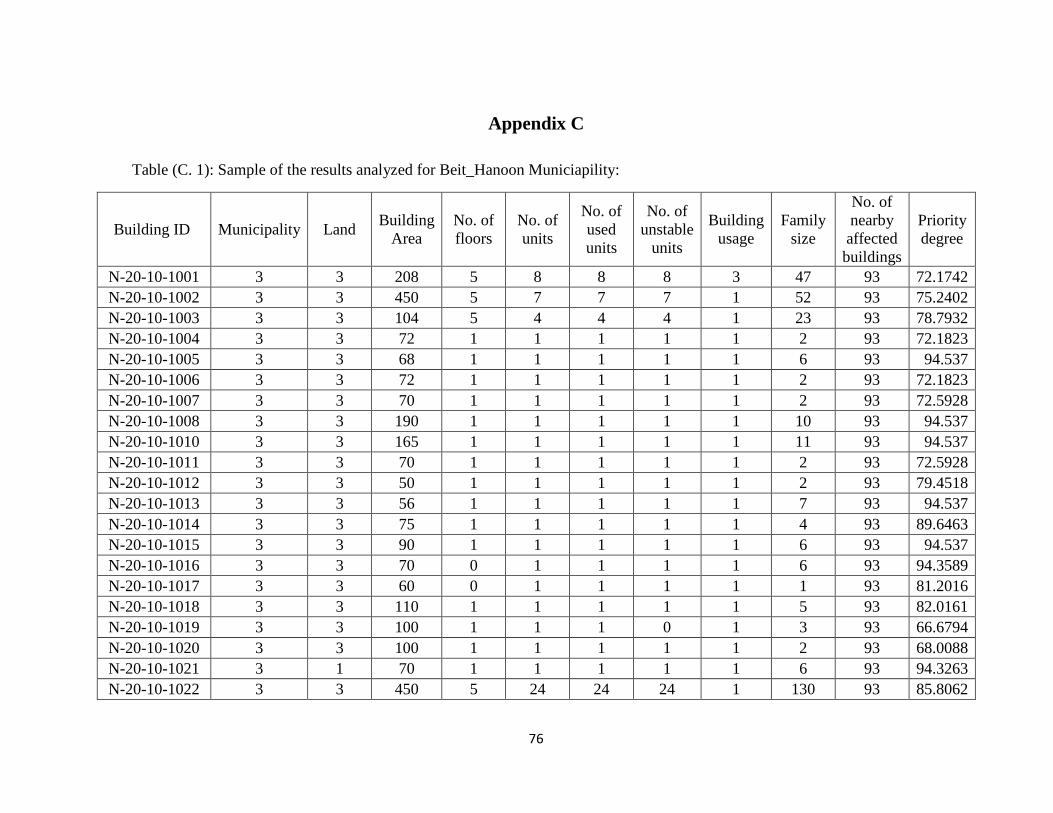
76
Appendix C
Table (C. 1): Sample of the results analyzed for Beit_Hanoon Municiapility:
Building ID Municipality Land Building
Area
No. of
floors
No. of
units
No. of
used
units
No. of
unstable
units
Building
usage
Family
size
No. of
nearby
affected
buildings
Priority
degree
N-20-10-1001 3 3 208 5 8 8 8 3 47 93 72.1742
N-20-10-1002 3 3 450 5 7 7 7 1 52 93 75.2402
N-20-10-1003 3 3 104 5 4 4 4 1 23 93 78.7932
N-20-10-1004 3 3 72 1 1 1 1 1 2 93 72.1823
N-20-10-1005 3 3 68 1 1 1 1 1 6 93 94.537
N-20-10-1006 3 3 72 1 1 1 1 1 2 93 72.1823
N-20-10-1007 3 3 70 1 1 1 1 1 2 93 72.5928
N-20-10-1008 3 3 190 1 1 1 1 1 10 93 94.537
N-20-10-1010 3 3 165 1 1 1 1 1 11 93 94.537
N-20-10-1011 3 3 70 1 1 1 1 1 2 93 72.5928
N-20-10-1012 3 3 50 1 1 1 1 1 2 93 79.4518
N-20-10-1013 3 3 56 1 1 1 1 1 7 93 94.537
N-20-10-1014 3 3 75 1 1 1 1 1 4 93 89.6463
N-20-10-1015 3 3 90 1 1 1 1 1 6 93 94.537
N-20-10-1016 3 3 70 0 1 1 1 1 6 93 94.3589
N-20-10-1017 3 3 60 0 1 1 1 1 1 93 81.2016
N-20-10-1018 3 3 110 1 1 1 1 1 5 93 82.0161
N-20-10-1019 3 3 100 1 1 1 0 1 3 93 66.6794
N-20-10-1020 3 3 100 1 1 1 1 1 2 93 68.0088
N-20-10-1021 3 1 70 1 1 1 1 1 6 93 94.3263
N-20-10-1022 3 3 450 5 24 24 24 1 130 93 85.8062
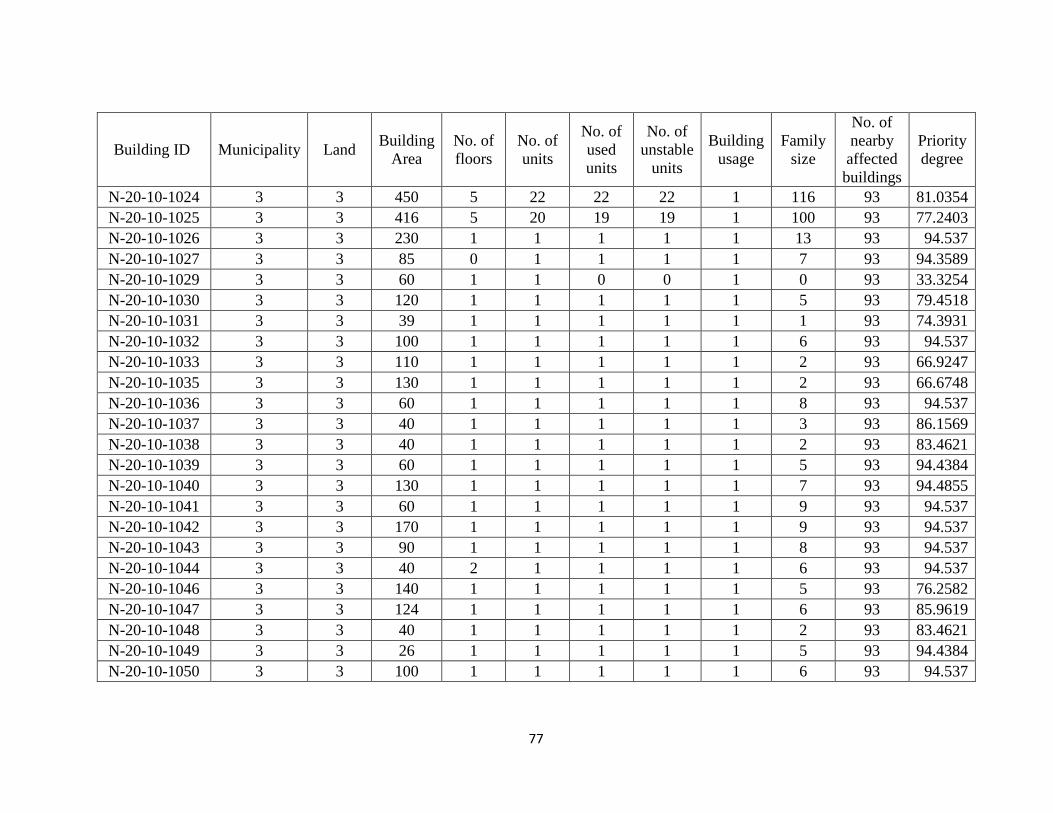
77
Building ID Municipality Land Building
Area
No. of
floors
No. of
units
No. of
used
units
No. of
unstable
units
Building
usage
Family
size
No. of
nearby
affected
buildings
Priority
degree
N-20-10-1024 3 3 450 5 22 22 22 1 116 93 81.0354
N-20-10-1025 3 3 416 5 20 19 19 1 100 93 77.2403
N-20-10-1026 3 3 230 1 1 1 1 1 13 93 94.537
N-20-10-1027 3 3 85 0 1 1 1 1 7 93 94.3589
N-20-10-1029 3 3 60 1 1 0 0 1 0 93 33.3254
N-20-10-1030 3 3 120 1 1 1 1 1 5 93 79.4518
N-20-10-1031 3 3 39 1 1 1 1 1 1 93 74.3931
N-20-10-1032 3 3 100 1 1 1 1 1 6 93 94.537
N-20-10-1033 3 3 110 1 1 1 1 1 2 93 66.9247
N-20-10-1035 3 3 130 1 1 1 1 1 2 93 66.6748
N-20-10-1036 3 3 60 1 1 1 1 1 8 93 94.537
N-20-10-1037 3 3 40 1 1 1 1 1 3 93 86.1569
N-20-10-1038 3 3 40 1 1 1 1 1 2 93 83.4621
N-20-10-1039 3 3 60 1 1 1 1 1 5 93 94.4384
N-20-10-1040 3 3 130 1 1 1 1 1 7 93 94.4855
N-20-10-1041 3 3 60 1 1 1 1 1 9 93 94.537
N-20-10-1042 3 3 170 1 1 1 1 1 9 93 94.537
N-20-10-1043 3 3 90 1 1 1 1 1 8 93 94.537
N-20-10-1044 3 3 40 2 1 1 1 1 6 93 94.537
N-20-10-1046 3 3 140 1 1 1 1 1 5 93 76.2582
N-20-10-1047 3 3 124 1 1 1 1 1 6 93 85.9619
N-20-10-1048 3 3 40 1 1 1 1 1 2 93 83.4621
N-20-10-1049 3 3 26 1 1 1 1 1 5 93 94.4384
N-20-10-1050 3 3 100 1 1 1 1 1 6 93 94.537
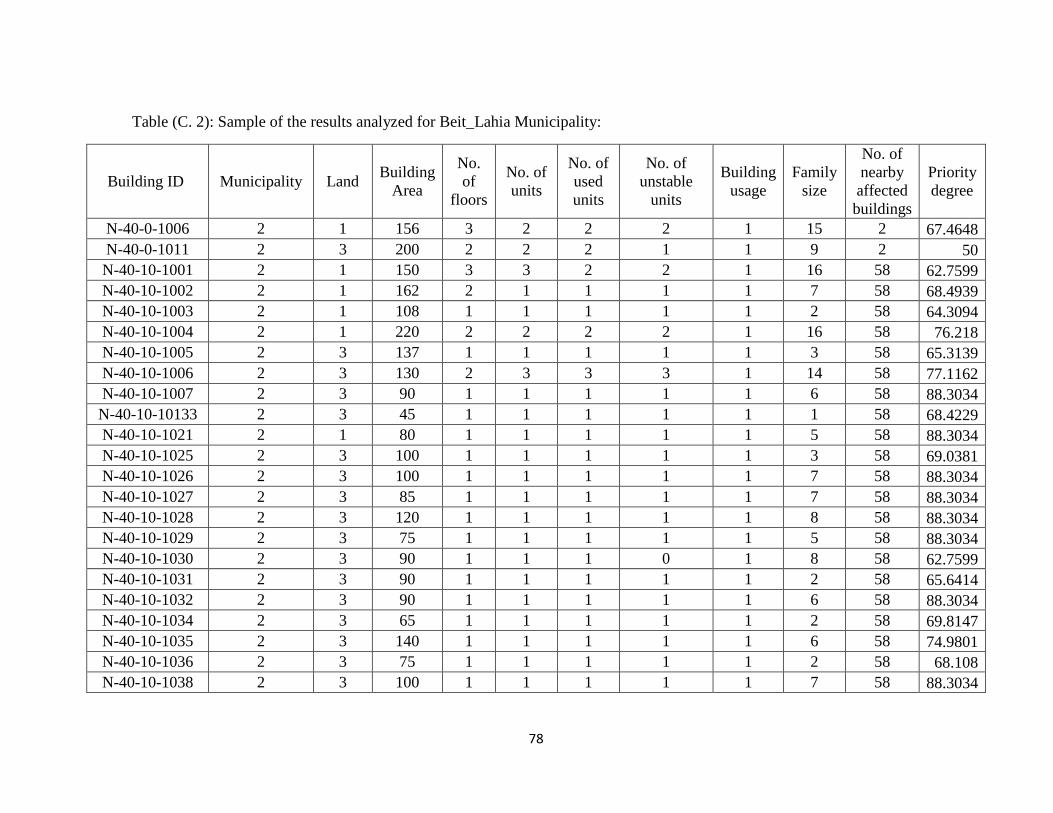
78
Table (C. 2): Sample of the results analyzed for Beit_Lahia Municipality:
Building ID Municipality Land Building
Area
No.
of
floors
No. of
units
No. of
used
units
No. of
unstable
units
Building
usage
Family
size
No. of
nearby
affected
buildings
Priority
degree
N-40-0-1006 2 1 156 3 2 2 2 1 15 2 67.4648
N-40-0-1011 2 3 200 2 2 2 1 1 9 2 50
N-40-10-1001 2 1 150 3 3 2 2 1 16 58 62.7599
N-40-10-1002 2 1 162 2 1 1 1 1 7 58 68.4939
N-40-10-1003 2 1 108 1 1 1 1 1 2 58 64.3094
N-40-10-1004 2 1 220 2 2 2 2 1 16 58 76.218
N-40-10-1005 2 3 137 1 1 1 1 1 3 58 65.3139
N-40-10-1006 2 3 130 2 3 3 3 1 14 58 77.1162
N-40-10-1007 2 3 90 1 1 1 1 1 6 58 88.3034
N-40-10-10133 2 3 45 1 1 1 1 1 1 58 68.4229
N-40-10-1021 2 1 80 1 1 1 1 1 5 58 88.3034
N-40-10-1025 2 3 100 1 1 1 1 1 3 58 69.0381
N-40-10-1026 2 3 100 1 1 1 1 1 7 58 88.3034
N-40-10-1027 2 3 85 1 1 1 1 1 7 58 88.3034
N-40-10-1028 2 3 120 1 1 1 1 1 8 58 88.3034
N-40-10-1029 2 3 75 1 1 1 1 1 5 58 88.3034
N-40-10-1030 2 3 90 1 1 1 0 1 8 58 62.7599
N-40-10-1031 2 3 90 1 1 1 1 1 2 58 65.6414
N-40-10-1032 2 3 90 1 1 1 1 1 6 58 88.3034
N-40-10-1034 2 3 65 1 1 1 1 1 2 58 69.8147
N-40-10-1035 2 3 140 1 1 1 1 1 6 58 74.9801
N-40-10-1036 2 3 75 1 1 1 1 1 2 58 68.108
N-40-10-1038 2 3 100 1 1 1 1 1 7 58 88.3034
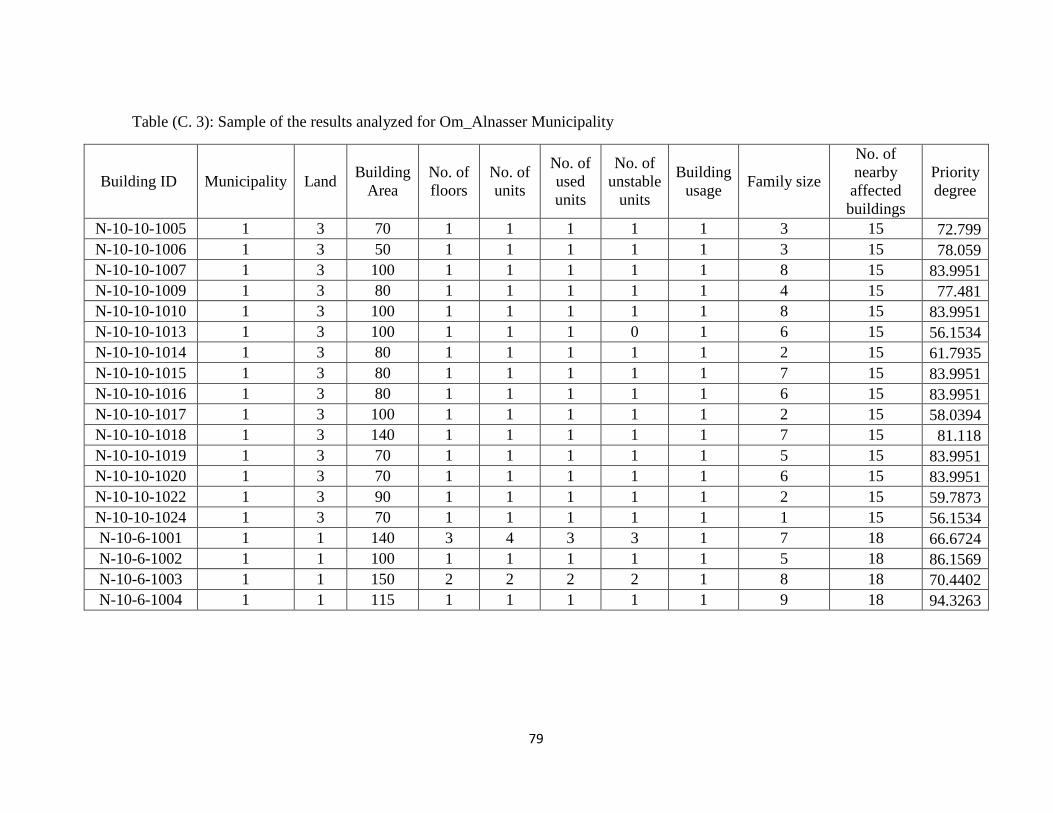
79
Table (C. 3): Sample of the results analyzed for Om_Alnasser Municipality
Building ID Municipality Land Building
Area
No. of
floors
No. of
units
No. of
used
units
No. of
unstable
units
Building
usage Family size
No. of
nearby
affected
buildings
Priority
degree
N-10-10-1005 1 3 70 1 1 1 1 1 3 15 72.799
N-10-10-1006 1 3 50 1 1 1 1 1 3 15 78.059
N-10-10-1007 1 3 100 1 1 1 1 1 8 15 83.9951
N-10-10-1009 1 3 80 1 1 1 1 1 4 15 77.481
N-10-10-1010 1 3 100 1 1 1 1 1 8 15 83.9951
N-10-10-1013 1 3 100 1 1 1 0 1 6 15 56.1534
N-10-10-1014 1 3 80 1 1 1 1 1 2 15 61.7935
N-10-10-1015 1 3 80 1 1 1 1 1 7 15 83.9951
N-10-10-1016 1 3 80 1 1 1 1 1 6 15 83.9951
N-10-10-1017 1 3 100 1 1 1 1 1 2 15 58.0394
N-10-10-1018 1 3 140 1 1 1 1 1 7 15 81.118
N-10-10-1019 1 3 70 1 1 1 1 1 5 15 83.9951
N-10-10-1020 1 3 70 1 1 1 1 1 6 15 83.9951
N-10-10-1022 1 3 90 1 1 1 1 1 2 15 59.7873
N-10-10-1024 1 3 70 1 1 1 1 1 1 15 56.1534
N-10-6-1001 1 1 140 3 4 3 3 1 7 18 66.6724
N-10-6-1002 1 1 100 1 1 1 1 1 5 18 86.1569
N-10-6-1003 1 1 150 2 2 2 2 1 8 18 70.4402
N-10-6-1004 1 1 115 1 1 1 1 1 9 18 94.3263