Embed Size (px)
Citation preview

2007 CALIFORNIA Standardized Testing and Reporting
PPoosstt--TTeesstt GGuuiiddee TTeecchhnniiccaall IInnffoorrmmaattiioonn
for STAR District and Test Site Coordinators
and Research Specialists
California Standards Tests California Achievement Tests, Sixth Edition Survey California Alternate Performance Assessments Standards-based Tests in Spanish
STAR Program
Contact Information STAR Technical Assistance Center 2731 Systron Drive Concord, CA 94518 Phone: 800-955-2954 Fax: 800-541-8455 [email protected] http://www.startest.org
Copyright © 2007 by the California Department of Education

STAR Program
August 2007 2007 STAR Post-Test Guide i © 2007 by the California Department of Education
Table of Contents Part I General Information ....................................................................................................................................1
Chapter I.1 New in 2007...................................................................................................................................2 Chapter I.2 Introduction...................................................................................................................................4
Purpose of the Reports and Using the Results ................................................................................................................ 4 Overview .......................................................................................................................................................................... 4 Types of Reports .............................................................................................................................................................. 5 Grades and Subjects Reported ........................................................................................................................................ 6 A Note About Accommodations and Modifications........................................................................................................... 7
Accommodations........................................................................................................................................................... 7 Modifications ................................................................................................................................................................. 7
Chapter I.3 Interpreting Reports.....................................................................................................................8 Equating and Scaling ....................................................................................................................................................... 8 Scale Scores for the STAR Program................................................................................................................................ 8
CST ............................................................................................................................................................................... 8 CAT/6 Survey ................................................................................................................................................................ 9 CAPA............................................................................................................................................................................. 9 STS ............................................................................................................................................................................... 9
Interpreting Scale Scores and Performance Levels to Evaluate Instructional Programs.................................................. 9 Interpreting Reporting Clusters ........................................................................................................................................ 9
CST and STS ................................................................................................................................................................ 9 Interpreting CAT/6 Survey Results ................................................................................................................................. 11
Chapter I.4 Comparing Results ....................................................................................................................13 Comparing CST Results................................................................................................................................................. 13
Comparing Scale Scores and Performance Levels for Groups ................................................................................... 14 Comparing Scale Scores and Performance Levels for Individual Students................................................................. 15
Comparing CAT/6 Survey Results ................................................................................................................................. 16 Comparing STS Results................................................................................................................................................. 16
Part II Report Descriptions.................................................................................................................................17 Chapter II.1 Report Descriptions ..................................................................................................................18
STAR CST-CAT/6 Survey, CAPA, and STS Printed Reports......................................................................................... 18 Viewing Report Samples ................................................................................................................................................ 24 Report Modes................................................................................................................................................................. 24
Chapter II.2 Summary Reports .....................................................................................................................25 STAR Student Master List Summary.............................................................................................................................. 25
Grade 4 Student Master List Summary Sample .......................................................................................................... 26 Grade 4 Student Master List Summary Sample .......................................................................................................... 30 Grade 10 Student Master List Summary Sample (Without CAPA) .............................................................................. 31
STAR Student Master List Summary: End-of-Course .................................................................................................... 32 End-of-Course Math Student Master List Summary Sample ....................................................................................... 33 Biology Student Master List Summary Sample ........................................................................................................... 36
STAR Subgroup Summary............................................................................................................................................. 37 Subgroup Summary Sample ....................................................................................................................................... 38 Descriptions of Subgroups .......................................................................................................................................... 41
STAR Group Summary: CAT/6 Survey .......................................................................................................................... 58 Group Summary Sample ............................................................................................................................................. 59
Chapter II.3 Individual Reports .....................................................................................................................62 STAR Student Record Label .......................................................................................................................................... 62
Student Record Label Samples................................................................................................................................... 63 STAR Student Master List.............................................................................................................................................. 66
Student Master List Samples....................................................................................................................................... 67 Master List Sample Records ....................................................................................................................................... 70
STAR Student Reports................................................................................................................................................... 72 Student Report for CST—Front Page, Top: Student Information, Grade 3 ................................................................. 73 Student Report for CSTs—Front Page, Bottom: Student’s Overall Results on the California Standards Tests, Grade 3.................................................................................................................................................................................... 74 Student Report for CSTs—Back Page, Top: Student’s Strengths and Needs, Grade 3.............................................. 75 Student Report for CST—Back Page, Bottom: Student’s California Reading List Number and National Comparison, Grade 3 ....................................................................................................................................................................... 77 Student Report for CSTs—Grade 4 Sample for Parents/Guardians............................................................................ 79 Student Report for CSTs—Grade 11 Sample for Parents/Guardians.......................................................................... 81 Student Report for CAPA—Front Page, Top: Student Information.............................................................................. 83 Student Report for CAPA—Front Page, Bottom: Student’s Results ............................................................................ 84
STAR Program
ii 2007 STAR Post-Test Guide August 2007 © 2007 by the California Department of Education
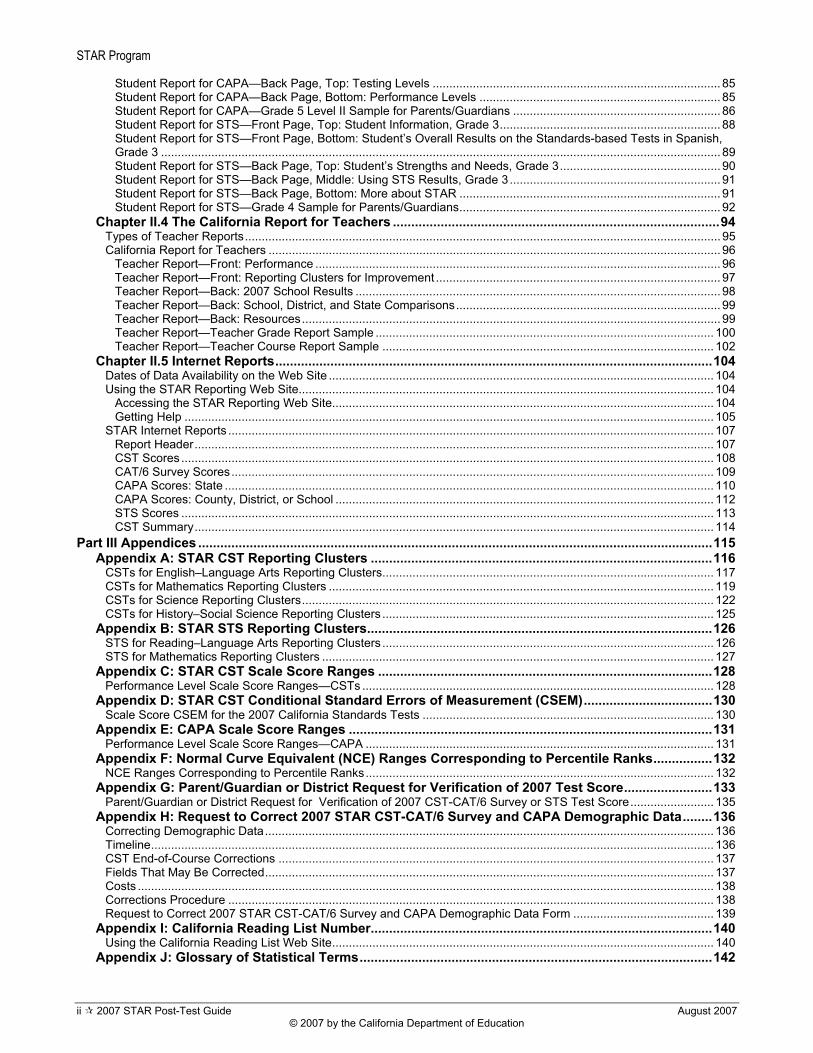
Student Report for CAPA—Back Page, Top: Testing Levels ...................................................................................... 85 Student Report for CAPA—Back Page, Bottom: Performance Levels ........................................................................ 85 Student Report for CAPA—Grade 5 Level II Sample for Parents/Guardians .............................................................. 86 Student Report for STS—Front Page, Top: Student Information, Grade 3.................................................................. 88 Student Report for STS—Front Page, Bottom: Student’s Overall Results on the Standards-based Tests in Spanish, Grade 3 ....................................................................................................................................................................... 89 Student Report for STS—Back Page, Top: Student’s Strengths and Needs, Grade 3................................................ 90 Student Report for STS—Back Page, Middle: Using STS Results, Grade 3 ............................................................... 91 Student Report for STS—Back Page, Bottom: More about STAR .............................................................................. 91 Student Report for STS—Grade 4 Sample for Parents/Guardians.............................................................................. 92
Chapter II.4 The California Report for Teachers .........................................................................................94 Types of Teacher Reports.............................................................................................................................................. 95 California Report for Teachers ....................................................................................................................................... 96
Teacher Report—Front: Performance ......................................................................................................................... 96 Teacher Report—Front: Reporting Clusters for Improvement ..................................................................................... 97 Teacher Report—Back: 2007 School Results ............................................................................................................. 98 Teacher Report—Back: School, District, and State Comparisons............................................................................... 99 Teacher Report—Back: Resources............................................................................................................................. 99 Teacher Report—Teacher Grade Report Sample ..................................................................................................... 100 Teacher Report—Teacher Course Report Sample ................................................................................................... 102
Chapter II.5 Internet Reports.......................................................................................................................104 Dates of Data Availability on the Web Site ................................................................................................................... 104 Using the STAR Reporting Web Site............................................................................................................................ 104
Accessing the STAR Reporting Web Site.................................................................................................................. 104 Getting Help .............................................................................................................................................................. 105
STAR Internet Reports ................................................................................................................................................. 107 Report Header........................................................................................................................................................... 107 CST Scores ............................................................................................................................................................... 108 CAT/6 Survey Scores................................................................................................................................................ 109 CAPA Scores: State .................................................................................................................................................. 110 CAPA Scores: County, District, or School ................................................................................................................. 112 STS Scores ............................................................................................................................................................... 113 CST Summary........................................................................................................................................................... 114
Part III Appendices ............................................................................................................................................115 Appendix A: STAR CST Reporting Clusters .............................................................................................116
CSTs for English–Language Arts Reporting Clusters................................................................................................... 117 CSTs for Mathematics Reporting Clusters ................................................................................................................... 119 CSTs for Science Reporting Clusters........................................................................................................................... 122 CSTs for History–Social Science Reporting Clusters ................................................................................................... 125
Appendix B: STAR STS Reporting Clusters..............................................................................................126 STS for Reading–Language Arts Reporting Clusters ................................................................................................... 126 STS for Mathematics Reporting Clusters ..................................................................................................................... 127
Appendix C: STAR CST Scale Score Ranges ...........................................................................................128 Performance Level Scale Score Ranges—CSTs ......................................................................................................... 128
Appendix D: STAR CST Conditional Standard Errors of Measurement (CSEM)...................................130 Scale Score CSEM for the 2007 California Standards Tests ....................................................................................... 130
Appendix E: CAPA Scale Score Ranges ...................................................................................................131 Performance Level Scale Score Ranges—CAPA ........................................................................................................ 131
Appendix F: Normal Curve Equivalent (NCE) Ranges Corresponding to Percentile Ranks................132 NCE Ranges Corresponding to Percentile Ranks........................................................................................................ 132
Appendix G: Parent/Guardian or District Request for Verification of 2007 Test Score........................133 Parent/Guardian or District Request for Verification of 2007 CST-CAT/6 Survey or STS Test Score......................... 135
Appendix H: Request to Correct 2007 STAR CST-CAT/6 Survey and CAPA Demographic Data........136 Correcting Demographic Data...................................................................................................................................... 136 Timeline........................................................................................................................................................................ 136 CST End-of-Course Corrections .................................................................................................................................. 137 Fields That May Be Corrected...................................................................................................................................... 137 Costs ............................................................................................................................................................................ 138 Corrections Procedure ................................................................................................................................................. 138 Request to Correct 2007 STAR CST-CAT/6 Survey and CAPA Demographic Data Form .......................................... 139
Appendix I: California Reading List Number.............................................................................................140 Using the California Reading List Web Site.................................................................................................................. 140
Appendix J: Glossary of Statistical Terms................................................................................................142

STAR Program
August 2007 2007 STAR Post-Test Guide iii © 2007 by the California Department of Education
List of Tables Table I.1 What’s New in 2007 .................................................................................................................................2 Table I.2 Reporting Matrix .......................................................................................................................................6 Table I.3 Hypothetical example of using CSTs to measure growth by comparing average scale scores ............14 Table I.4 Hypothetical example of using CSTs to measure growth by comparing percentages of students at proficient and above ..............................................................................................................................................15 Table II.1 2007 STAR CST-CAT/6 Survey, CAPA, and STS Printed Reports......................................................19 Table II.2 STAR Student Master List Summary Descriptions ...............................................................................27 Table II.3 STAR Student Master List Summary: End-of-Course Descriptions......................................................34 Table II.4 STAR Subgroup Summary Descriptions...............................................................................................39 Table II.5 Descriptions of Subgroups ....................................................................................................................41 Table II.6 Primary Disability Codes for Spring 2007 Administration .....................................................................54 Table II.7 STAR Group Summary: CAT/6 Survey Descriptions............................................................................60 Table II.8 STAR Student Record Label Descriptions............................................................................................63 Table II.9 STAR Student Master List Descriptions................................................................................................68 Table II.10 The Student Report for CSTs: Student Information Descriptions .......................................................73 Table II.11 The Student Report for CSTs: Student’s Overall Results Descriptions ..............................................75 Table II.12 The Student Report for CSTs: Student’s Strengths and Needs Descriptions ....................................77 Table II.13 The Student Report for CSTs: Student’s California Reading List Number and National Comparison Descriptions...........................................................................................................................................................78 Table II.14 The Student Report for CAPA: Student Information Descriptions ......................................................83 Table II.15 The Student Report for CAPA: Student’s Overall Results Descriptions .............................................84 Table II.16 The Student Report for STS: Student Information Descriptions .........................................................88 Table II.17 The Student Report for STS: Student’s Overall Results Descriptions ................................................89 Table II.18 The Student Report for STS: Student’s Strengths and Needs Descriptions ......................................90 Table II.19 Types of Teacher Reports...................................................................................................................95 Table II.20 STAR Teacher Report: Performance Section Descriptions................................................................96 Table II.21 STAR Teacher Report: Reporting Clusters for Improvement Section Descriptions ...........................97 Table II.22 STAR Teacher Report: 2007 School Results Section Descriptions ...................................................98 Table II.23 STAR Teacher Report: School, District, and State Comparisons Section Descriptions.....................99 Table II.24 Internet Report Header Descriptions.................................................................................................107 Table II.25 Internet CST Scores Report Descriptions.........................................................................................108 Table II.26 Internet CAT/6 Survey Scores Report Descriptions..........................................................................109 Table II.27 Internet CAPA State Report Descriptions .........................................................................................111 Table II.28 Internet CAPA County, District, or School Report Descriptions........................................................112 Table II.29 Internet STS Scores Report Descriptions .........................................................................................113 Table II.30 Internet CST Summary Report Descriptions.....................................................................................114
List of Figures Figure I.1 Sample Average Percent Correct Cluster Score ..................................................................................11

STAR Program
iv 2007 STAR Post-Test Guide August 2007 © 2007 by the California Department of Education
Post-Test Guide Acronyms and Initialisms API Academic Performance Index AYP Adequate Yearly Progress CAPA California Alternate Performance Assessment CAT/6 Survey California Achievement Test, Sixth Edition Survey CDE California Department of Education CRL California Reading List CSEM conditional standard error of measurement CST California Standards Test EAP Early Assessment Program EOC end-of-course EL English Learner ELA English–language arts IEP individualized education program I-FEP Initially–fluent English proficient NCE normal curve equivalent NPR National Percentile Rank NSLP National School Lunch Program PR percentile rank PR-S percentile rank-stanine RC reporting cluster R-FEP Reclassified–fluent English proficient RLA reading–language arts SD standard deviation SEM standard error of measurement SGID Student and Grade Identification sheet SS scale score SSID Statewide Student Identifier STAR Standardized Testing and Reporting STAR TAC STAR Technical Assistance Center STS Standards-based Tests in Spanish

PPaarrtt II GGeenneerraall IInnffoorrmmaattiioonn
Part I General Information

Part I General Information | Chapter I.1 New in 2007
2 2007 STAR Post-Test Guide August 2007 © 2007 by the California Department of Education
Chapter I.1 New in 2007 Table I.1 What’s New in 2007
Change Affected Report(s)
Standards-based Tests in Spanish (STS) are reported for students who took the grade 2, 3, or 4 test. Performance levels (Advanced, Proficient, et. al.) and scale scores are not reported this year.
- STAR Student Report for STS - STAR Student Record Label - Subgroup Summary reports - All grade-level reports on
which results for grades 2, 3, and 4 are presented, such as Student Master List.
Individual California Alternate Performance Assessment (CAPA) results are reported on a STAR Student Record Label.
- STAR Student Record Label
STAR Student Reports will arrive with the STAR district summary reports.
- STAR Student Report, CST, CAPA, STS
The STAR Student Report now includes the student’s number correct and percent correct for every reporting cluster in each test reported.
- STAR Student Report for CSTs
Students in grade 7 who were enrolled in an Algebra I course took the California Standards Test (CST) for Algebra I instead of the grade-level test.
- STAR Student Report for CSTs, Grade 7 students
- California Report for Teachers, Grade 7 teachers
- Student Record label, Grade 7 students
- Student Master List, Grade 7 - Student Master List Summary,
Grade 7
Students in grades 9, 10, and 11 who were enrolled in a world history course took the end-of-course (EOC) CST for World History. This CST was previously only taken by all students in grade 10.
- STAR Student Report for CSTs, Grades 9, 10, and 11
- Student Record label, Grades 9, 10, and 11
- Student Master List, Grades 9, 10, and 11
- Student Master List Summary EOC
Early Assessment Program (EAP) results will be included for students in Grade 11 who completed the EAP essay and answered multiple-choice questions in the CST for English–Language Arts, and/or answered questions in certain end-of-course CSTs for Mathematics.
- STAR Student Report for CSTs, Grade 11
The Roster of EAP Results will be shipped to districts with STAR summary reports.
- EAP Roster

Part I General Information | Chapter I.1 New in 2007
August 2007 2007 STAR Post-Test Guide 3 © 2007 by the California Department of Education
The term “State ID” has been replaced by “SSID” (Statewide Student Identifier).
- STAR Student Report, all tests
Student’s SSID has been added. - Student Master List - STAR Student Record Label
A line for the “number of students with scores” has been added to the CST, CAPA, STS, and California Achievement Tests, Sixth Edition Survey (CAT/6 Survey) reports.
- Student Master List Summary - Student Master List Summary:
EOC - Student Group Summary - Student Subgroup Summary - Internet Reporting
Users have the option to view an online CST Summary report that shows, for all CST subject areas tested, the percentage of students who scored proficient or advanced within the reporting population (state, county, district, or school).
- Internet Reporting
The student data file will be offered in ASCII text or XML formats.
- Student Data File
Students’ “Special Education Exit Date” is reported. - Student Data File
Student mobility information is no longer reported. - Student Data File
STS country of origin is reported. - Student Data File
Districts will be able to correct the SSID number during data corrections.
- Student Data File

Part I General Information | Chapter I.2 Introduction
4 2007 STAR Post-Test Guide August 2007 © 2007 by the California Department of Education
Chapter I.2 Introduction Purpose of the Reports and Using the Results
The results for tests within the Standardized Testing and Reporting (STAR) Program are used for three primary purposes: 1. Communicating students’ progress in attaining proficiency on the state’s academic
standards to students, parents/guardians, and teachers. In developing the legislation for the STAR Program, the Legislature recognized that school districts will conduct their own, ongoing diagnostic assessments and provide information of the results of these assessments to parents and teachers on a regular basis. The Legislature also recognized that local diagnostic assessment is the primary way in which to identify academic strengths and weaknesses (Education Code Section 60602).
2. Informing decisions, along with local assessment data, that teachers and administrators make about helping students improve achievement and about improving the educational program.
3. Providing data for state and federal accountability programs. These data are used to calculate each school and district’s Academic Performance Index (API) and Adequate Yearly Progress (AYP) to meet the requirements of the No Child Left Behind Act of 2001.
More about the STAR Program background can be found by visiting the STAR results Web site at http://star.cde.ca.gov/, clicking the STAR 2007 Test Results link, then clicking the Program Background link in the “More About STAR” section.
Overview The STAR Program consists of five components:
• California Standards Tests (CSTs) • California Achievement Tests, Sixth Edition Survey (CAT/6 Survey) • California Alternate Performance Assessment (CAPA) • Standards-based Tests in Spanish (STS) • Aprenda: La prueba de logros en español, Tercera edición (Aprenda 3)
The principal components of the STAR Program are the CSTs, the CAPA, and the STS. The CSTs measure student performance on California’s Content Standards and identify students who achieve at each performance level: advanced, proficient, basic, below basic, or far below basic. The state’s target is for all students to score proficient or advanced. The CSTs carry the most weight for calculating school and district APIs. Additionally, the CSTs for English–language arts (ELA) and mathematics (grades two through eight) are used in determining AYP that applies toward meeting the federal No Child Left Behind requirement to have all students score proficient or above by 2014. The CSTs include the following grade-level tests:
• English–Language Arts—Grades 2 through 11 • Mathematics—Grades 2 through 7 • Science—Grades 5, 8, and 10 • History–Social Science—Grades 8 and 11
Part I General Information | Chapter I.2 Introduction
August 2007 2007 STAR Post-Test Guide 5 © 2007 by the California Department of Education
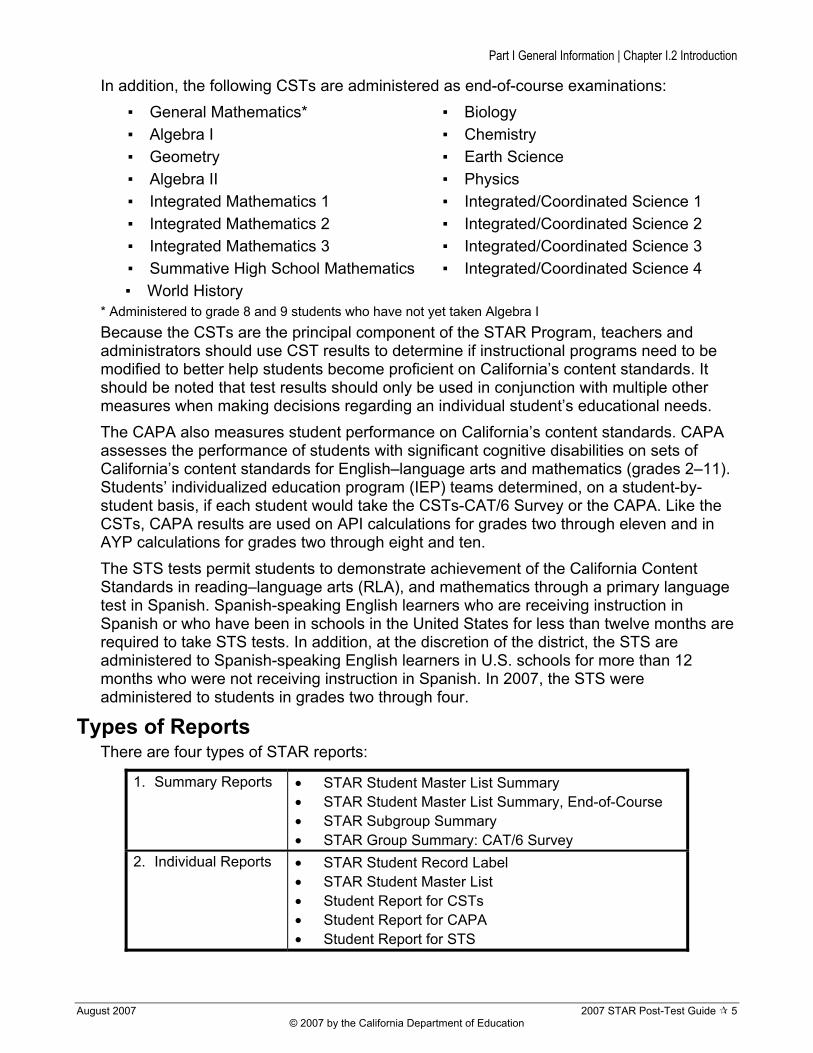
In addition, the following CSTs are administered as end-of-course examinations: ▪ General Mathematics* ▪ Algebra I ▪ Geometry ▪ Algebra II ▪ Integrated Mathematics 1 ▪ Integrated Mathematics 2 ▪ Integrated Mathematics 3 ▪ Summative High School Mathematics ▪ World History
▪ Biology ▪ Chemistry ▪ Earth Science ▪ Physics ▪ Integrated/Coordinated Science 1 ▪ Integrated/Coordinated Science 2 ▪ Integrated/Coordinated Science 3 ▪ Integrated/Coordinated Science 4
* Administered to grade 8 and 9 students who have not yet taken Algebra I Because the CSTs are the principal component of the STAR Program, teachers and administrators should use CST results to determine if instructional programs need to be modified to better help students become proficient on California’s content standards. It should be noted that test results should only be used in conjunction with multiple other measures when making decisions regarding an individual student’s educational needs. The CAPA also measures student performance on California’s content standards. CAPA assesses the performance of students with significant cognitive disabilities on sets of California’s content standards for English–language arts and mathematics (grades 2–11). Students’ individualized education program (IEP) teams determined, on a student-by-student basis, if each student would take the CSTs-CAT/6 Survey or the CAPA. Like the CSTs, CAPA results are used on API calculations for grades two through eleven and in AYP calculations for grades two through eight and ten. The STS tests permit students to demonstrate achievement of the California Content Standards in reading–language arts (RLA), and mathematics through a primary language test in Spanish. Spanish-speaking English learners who are receiving instruction in Spanish or who have been in schools in the United States for less than twelve months are required to take STS tests. In addition, at the discretion of the district, the STS are administered to Spanish-speaking English learners in U.S. schools for more than 12 months who were not receiving instruction in Spanish. In 2007, the STS were administered to students in grades two through four.
Types of Reports There are four types of STAR reports:
1. Summary Reports • STAR Student Master List Summary • STAR Student Master List Summary, End-of-Course • STAR Subgroup Summary • STAR Group Summary: CAT/6 Survey
2. Individual Reports • STAR Student Record Label • STAR Student Master List • Student Report for CSTs • Student Report for CAPA • Student Report for STS

Part I General Information | Chapter I.2 Introduction
6 2007 STAR Post-Test Guide August 2007 © 2007 by the California Department of Education
3. Teacher Reports • California Report for Teachers—Grade • California Report for Teachers—Course • California Report for Teachers—Group
4. Internet Reports • CST Scores (State, County, District, School) • CST Summary Scores (State, County, District, School) • CAPA Scores (State, County, District, School) • STS Scores (State, County, District, School) • CAT/6 Survey Scores (State, County, District, School)
Internet reports are accessible online at http://star.cde.ca.gov/ and available to everyone. All other reports are sent to the independent charter school, county, or to the district; the district forwards the appropriate reports to test sites or, in the case of STAR Student Reports, sends the reports to the students and forwards a copy to the student’s school or test site. Reports descriptions start on page 18.
Grades and Subjects Reported STAR results are reported for the tests students took. The matrix in Table I.2 shows, for each grade, the test results that may appear on a report. For example, results for the CST for English–Language Arts can appear on a report for any grade. Results for the STS for Reading–Language Arts would appear on a report that includes students in grade 2, 3, or 4 who had taken the STS, or on the individual reports for students who had taken the STS. Please note that in grade 7 a student would have taken either the grade-level CST for Mathematics or the end-of-course CST for Algebra I, but not both.
Table I.2 Reporting Matrix
Grade Enrolled Test Name 2 3 4 5 6 7 8 9 10 11
CST for English–Language Arts (grade level) CST for Mathematics (grade level) CST for Science (grade level) CST for History–Social Science (grade level) CST for EOC Mathematics CST for EOC Science CST for EOC History–Social Science CAT/6 Survey for Reading CAT/6 Survey for Language CAT/6 Survey for Spelling CAT/6 Survey for Mathematics STS for Reading–Language Arts STS for Mathematics CAPA for English–Language Arts (all levels, all grades) CAPA for Mathematics (all levels, all grades)

Part I General Information | Chapter I.2 Introduction
August 2007 2007 STAR Post-Test Guide 7 © 2007 by the California Department of Education
A Note About Accommodations and Modifications Accommodations are changes to the administration of a test that do not change what is being tested. Modifications, on the other hand, are changes to the administration of a test that change what is being tested. Scores with modifications are counted differently for accountability and aggregate reporting purposes. The Matrix of Test Variations, Accommodations, and Modifications for Administration of California Statewide Assessments may be found at http://www.cde.ca.gov/ta/tg/sa/documents/matrix5.doc. Examiners administering the CAPA build any required accommodations or modifications students need into the tasks. Therefore, use of accommodations or modifications is neither collected nor reported for CAPA.
Accommodations Accommodations are variations in the standardized administration of the tests that do not change the construct being measured. • Scores are reported in the same way as for nonaccommodated tests. If students used
accommodations, such as extra time for the CAT/6 Survey or a large-print version of any STAR test, these do not change what was tested. The students’ scores appear the same as those for students tested without accommodations.
• The Student Master List and Student Record Labels indicate if a student used accommodations.
Modifications Modifications change what is being tested and therefore change scores. If students used modifications, their scores were counted differently from nonmodified test scores on summary reports. Individual reports include the students’ actual scores. • The Student Master List and Student Record Labels indicate modifications if students
took the test using modifications. • On the CST summary reports, the students’ scores are counted as far below basic. • Scores are counted between the 1st and 19th NPR for the CAT/6 Survey Group
Summary Report.
Part I General Information | Chapter I.3 Interpreting Reports
8 2007 STAR Post-Test Guide August 2007 © 2007 by the California Department of Education
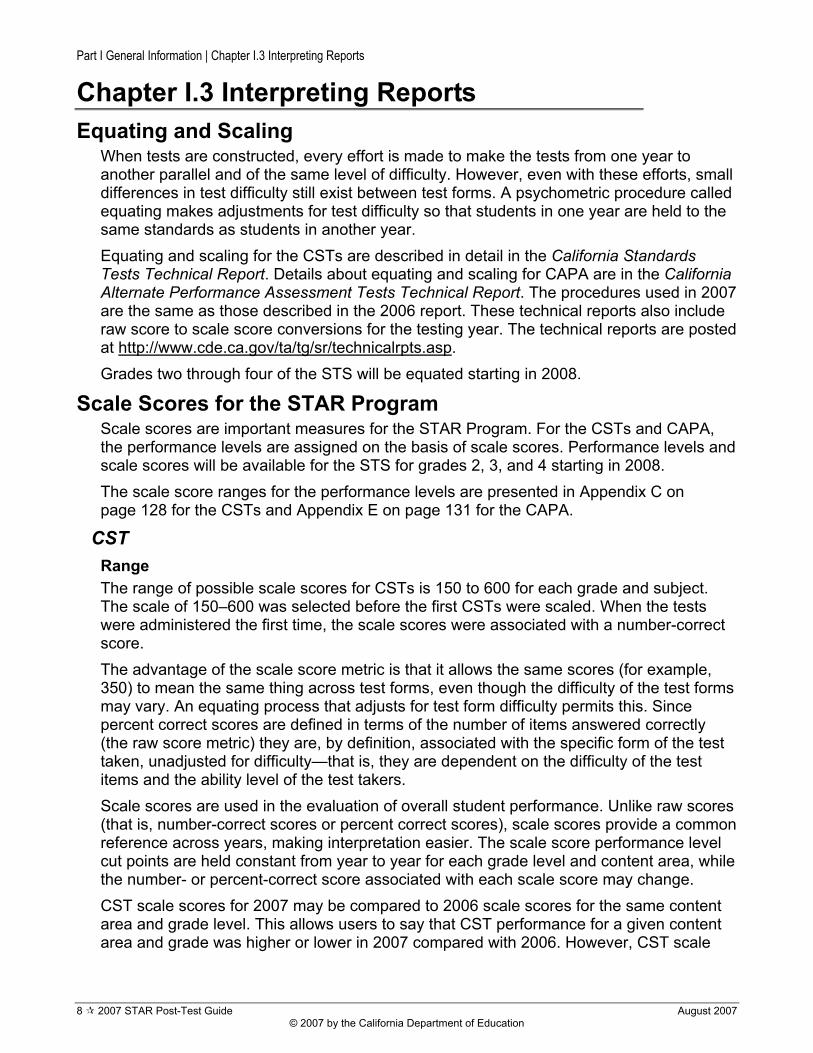
Chapter I.3 Interpreting Reports Equating and Scaling
When tests are constructed, every effort is made to make the tests from one year to another parallel and of the same level of difficulty. However, even with these efforts, small differences in test difficulty still exist between test forms. A psychometric procedure called equating makes adjustments for test difficulty so that students in one year are held to the same standards as students in another year. Equating and scaling for the CSTs are described in detail in the California Standards Tests Technical Report. Details about equating and scaling for CAPA are in the California Alternate Performance Assessment Tests Technical Report. The procedures used in 2007 are the same as those described in the 2006 report. These technical reports also include raw score to scale score conversions for the testing year. The technical reports are posted at http://www.cde.ca.gov/ta/tg/sr/technicalrpts.asp. Grades two through four of the STS will be equated starting in 2008.
Scale Scores for the STAR Program Scale scores are important measures for the STAR Program. For the CSTs and CAPA, the performance levels are assigned on the basis of scale scores. Performance levels and scale scores will be available for the STS for grades 2, 3, and 4 starting in 2008. The scale score ranges for the performance levels are presented in Appendix C on page 128 for the CSTs and Appendix E on page 131 for the CAPA.
CST Range The range of possible scale scores for CSTs is 150 to 600 for each grade and subject. The scale of 150–600 was selected before the first CSTs were scaled. When the tests were administered the first time, the scale scores were associated with a number-correct score. The advantage of the scale score metric is that it allows the same scores (for example, 350) to mean the same thing across test forms, even though the difficulty of the test forms may vary. An equating process that adjusts for test form difficulty permits this. Since percent correct scores are defined in terms of the number of items answered correctly (the raw score metric) they are, by definition, associated with the specific form of the test taken, unadjusted for difficulty—that is, they are dependent on the difficulty of the test items and the ability level of the test takers. Scale scores are used in the evaluation of overall student performance. Unlike raw scores (that is, number-correct scores or percent correct scores), scale scores provide a common reference across years, making interpretation easier. The scale score performance level cut points are held constant from year to year for each grade level and content area, while the number- or percent-correct score associated with each scale score may change. CST scale scores for 2007 may be compared to 2006 scale scores for the same content area and grade level. This allows users to say that CST performance for a given content area and grade was higher or lower in 2007 compared with 2006. However, CST scale

Part I General Information | Chapter I.3 Interpreting Reports
August 2007 2007 STAR Post-Test Guide 9 © 2007 by the California Department of Education
scores for the same content area may not be compared across grades because CST scale scores are not vertically scaled (scaled across grades). Performance Levels The CST performance levels are: advanced, proficient, basic, below basic, or far below basic. The goal in California is to have all students perform at proficient or advanced. For all CST content areas and grades, the proficient level is set at a minimum scale score of 350, and the basic level is set at a minimum scale score of 300. The minimum scale scores for below basic and advanced differ by content area and grade.
CAT/6 Survey The range of possible scale scores for the CAT/6 Survey is 1 to 999 for each subject and grade. Performance levels are not applied to the CAT/6 Survey because they are national norm-referenced tests.
CAPA Range The range of possible scale scores for CAPA is 15 to 60 for each grade and subject. Performance Levels The CAPA performance levels are: advanced, proficient, basic, below basic, or far below basic. For the CAPA, basic is set at 30 and proficient is set at 35.
STS Performance levels and scale scores will be available for the STS for grades 2, 3, and 4 starting in 2008. In 2007, only percent correct scores were reported for STS tests.
Interpreting Scale Scores and Performance Levels to Evaluate Instructional Programs
Teachers and administrators should not use CST results in isolation to make inferences about instructional needs. Anyone using CST results to identify strengths and weaknesses in instructional programs should be familiar with the cautions and procedures in the next section, Interpreting Reporting Clusters.
Interpreting Reporting Clusters CST and STS
Reporting cluster information for the CSTs and for the STS is included on Student Master Lists, Student Master List Summaries, the STAR Student Reports, and the California Report for Teachers, which is available for CSTs only. Depending on the report, the CST reporting cluster results are shown as percent correct, average percent correct, or diamonds placed relative to the percent correct band representing the range of scores for students who scored proficient on the total test. For STS, performance levels will not be available until 2008. Therefore, only percent correct or average percent correct information is reported for each reporting cluster for STS in 2007. Since cluster scores are constructed from test questions of like content, as a group, they may be easier or more difficult than the overall test form. Thus, percent correct values based on the cluster scores may even differ from the percent correct obtained for the total test. Because of this and the fact that unadjusted raw scores are used to compute the

Part I General Information | Chapter I.3 Interpreting Reports
10 2007 STAR Post-Test Guide August 2007 © 2007 by the California Department of Education
percent correct values, the cluster percent correct scores do not behave in the same way as do the scale scores and cannot be used to calculate the scale scores. CST reporting clusters and the number of items that comprise each are provided in Appendix A on page 116 of this guide. STS reporting clusters and the number of items that comprise each are provided in Appendix B on page 126. Reporting clusters can help teachers and instructional leaders pinpoint areas of student strengths and weaknesses. However, reporting clusters should be interpreted cautiously, and two very important limitations of CST and STS reporting clusters should always be kept in mind: 1. Reporting clusters are based on different numbers of questions, and in some cases,
the number of questions that makes up a reporting cluster may be quite small. The smaller number of questions results in scores that are less accurate than the overall test scores.
2. Reporting cluster scores may vary from year to year because the difficulty of the questions in the reporting clusters may vary. While the overall test scores are equated—to adjust for differences in difficulty from year to year—this is not done for the reporting clusters.
Two useful reference points for interpreting reporting clusters for the CSTs are the performance on the clusters for students statewide who scored at the lowest score for proficient, and students statewide who scored at the lowest score for advanced on the total test. ETS calculated the average percent correct scores for students who scored at these reference points on each CST. The averages for the two reference points, as well as the numbers of items in each reporting cluster for each CST, are provided in Appendix A. The average cluster performance of the proficient students is not provided as reference information for STS in 2007 as performance levels will only be available for the STS grades 2 to 4 starting in 2008. The charts in Figure I.1 on the next page provide an example of how considering the average percent correct for students statewide who received the lowest score for proficient and advanced helps in the interpretation of CST cluster scores for a class of students. The example uses CST for Geometry scores. The three vertical bars, in a grouping, show the average percent correct for a cluster score for 1) students statewide scoring at the lowest score for proficient, 2) students statewide scoring at the lowest score for advanced, and 3) the average percent correct for a hypothetical class of students in 2006 and 2007 (My Class 2007). Compared to the performance of students scoring just proficient or just advanced statewide in 2007, My Class 2007 performed better than statewide just-proficient students on Logic/Geom Proofs and Angle Relationships. They performed comparably with proficient students statewide on Trigonometry; performed less well than the proficient students statewide on Volume & Area, and performed better than proficient students statewide, but less well than advanced students statewide. Across all clusters, My Class 2007 performed less well than the just-advanced students statewide. Compared to the 2006 class, the 2007 class appears to have higher average scores in Angle Relationships and Trigonometry, lower average scores in Logic/Geom Proofs, and the same average score in Volume & Area. However, this information is misleading, because the percent correct values for 2007 and 2006 are not directly comparable. There is, however, a comparison that can be made which is helpful: the performance of a group of students may be compared to the performance of students statewide scoring proficient

Part I General Information | Chapter I.3 Interpreting Reports
August 2007 2007 STAR Post-Test Guide 11 © 2007 by the California Department of Education
or advanced. As an example of this valid comparison, in 2006, My Class fell below the statewide average of proficient students on Angle Relationships. However, in 2007, My Class average fell above the statewide average of just-proficient students. This suggests that My Class has made much progress in 2007 on Angle Relationships. As another example of a valid comparison, in the Volume & Area reporting cluster, My Class obtained the same average percent correct score in 2006 and 2007. However, in 2006, My Class performed slightly better than the statewide just-proficient students, while in 2007, My Class performed less well than the statewide just-proficient students. This indicates that My Class did not make progress from 2006 to 2007 on Volume & Area.
Figure I.1 Sample Average Percent Correct Cluster Score
0%10%20%30%40%50%60%70%80%90%
100%
Logic/GeomProofs
Volume & Area AngleRelationships
Trigonometry
Avg
% C
orre
ct
My Class 2006 Just Proficient Students 2006 Just Advanced Students 2006
0%10%20%30%40%50%60%70%80%90%
100%
Logic/GeomProofs
Volume & Area AngleRelationships
TrigonometryAv
g %
Cor
rect
My Class 2007 Just Proficient Students 2007 Just Advanced Students 2007
The average percent correct values for students scoring proficient and advanced can also be used to help interpret reporting cluster scores for individual students. That is, academic strengths and weaknesses of students can be suggested by comparing students’ percent correct scores for each reporting cluster to the average percent correct scores for the students statewide who scored proficient or advanced on the total test. Caution should be used in making these comparisons when the reporting cluster scores are based on relatively few items, for example, ten items or fewer. The average performance of students statewide who scored at the lowest proficient score and the lowest advanced score on the total tests is used for determining the average percent correct range for the CST reporting clusters on the STAR Student Report and the California Report for Teachers. Diamonds representing the percent correct for students (or average percent correct for groups of students) are compared to the average percent correct range that is represented by a horizontal bar on the reports. An explanation and example of this type of presentation on the STAR Student Report for CSTs can be found starting on page 75.
Interpreting CAT/6 Survey Results Because the CAT/6 Survey was normed using a national sample of students, it can be used to compare the performance of the California grade three and grade seven students taking it with that of a nationally representative sample of students for reading, language, spelling, and mathematics. The CAT/6 Survey results will contribute to the base API in 2007 and to the growth API between 2006 and 2007. National Percentile Ranks (NPR) for the Average Student CAT/6 Survey subgroup summary reports include an NPR that provides the relative standing of a “hypothetical average student” in comparison to the national normative sample. We refer to the hypothetical average student because the comparison is to a distribution of individual students rather than to groups of students. Thus, the NPR would
Part I General Information | Chapter I.3 Interpreting Reports
12 2007 STAR Post-Test Guide August 2007 © 2007 by the California Department of Education
be assigned for a single student who scored exactly at the group mean or average. For the CAT/6 Survey, the NPR for the average student is based on the average normal curve equivalent (NCE) for the group. The relationship between NCEs and NPRs is mathematical in nature. NCEs may be obtained by converting percentiles to normalized z-scores and making the transformation NCE = 50 + 21.06z. Appendix F on page 132 is based on this relationship, and provides the NCE intervals corresponding to each percentile rank as they are used by CTB/McGraw-Hill.

Part I General Information | Chapter I.4 Comparing Results
August 2007 2007 STAR Post-Test Guide 13 © 2007 by the California Department of Education
Chapter I.4 Comparing Results Comparing CST Results
When comparing results for the CSTs, compare results only within the same subject and grade, that is, grade two ELA compared to grade two ELA or grade six mathematics compared to grade six mathematics. No direct comparisons should be made between grades or between content areas. Two types of comparisons are possible:
1. Comparing the average scale score; or 2. Comparing the percentage of students scoring at each performance level.
The reviewer may compare results for the same grade and subject across years within a school, between schools, or between a school and its district, county, or the state. When making comparisons, the reviewer should consider comparing the percentage of students scoring proficient and advanced, since the state target is for all students to score at or above proficient. Comparisons may also be made by calculating the overall percentage of students within a school who scored proficient and advanced and comparing this to the overall percentage of students in another school, the district, the county, or the state who scored proficient or advanced. The CST Summary report, accessed at http://star.cde.ca.gov, provides this information for CST results for a selected reporting population. Information about this report is found on page 114. When making comparisons across years within a given grade and content area, it is important to understand that even when the number of students is the same, the group’s composition from year to year may be quite different if student mobility (transiency) is high. When comparisons are made across years they are actually a comparison of different groups of students with different traits taking different tests. And generally, there will be more variance in scores from year to year when small numbers of students are tested. While there may be a valid comparison to be made between students within grade and content area, it is not valid to subtract a student’s or class’s scale score received one year in a given subject from the scale score received the previous year in the same subject in order to show growth. While the scale scores on all CSTs look the same, they are independently scaled so that differences for the same students across years cannot be calculated using basic subtraction. Any comparison of groups between years should not be used for diagnostic, placement, or promotion or retention purposes. Decisions about promotion, retention, placement, or eligibility for special programs may use or include STAR Program results only in conjunction with multiple other measures including, but not limited to, locally administered tests, teacher recommendations, and grades.

Part I General Information | Chapter I.4 Comparing Results
14 2007 STAR Post-Test Guide August 2007 © 2007 by the California Department of Education
Comparing Scale Scores and Performance Levels for Groups An example of how group-level CST scale scores for 2007 may be compared to the 2006 scale scores for the same content area and grade is shown in Table I.3, below. In this table, hypothetical average CST scale scores for ELA are compared between 2006 and 2007 for the students in a particular school. Compared with average scale scores in 2006, these data indicate slightly higher scores in 2007 for grades 2, 4, and 6, a slightly lower score for grade 5, and a virtually identical score in grade 3. In addition to comparisons for all students, similar grade-by-grade comparisons of scale scores may be made for different subgroups of interest. However, because the ELA (and other test) scales are independent for each grade, it is not appropriate to calculate and compare average scale scores for the entire school or across grades.
Table I.3 Hypothetical example of using CSTs to measure growth by comparing average scale scores
2006 CST for ELA 2007 ELA for CST
Grade # Students Mean SS # Students Mean SS Difference
Grade 2 120 322.2 111 333.5 11.3
Grade 3 100 331.4 124 331.7 0.3
Grade 4 90 319.9 102 323.1 3.2
Grade 5 100 334.0 94 327.6 -6.4
Grade 6 120 323.5 98 328.1 4.6
Table I.4 on the next page provides a second hypothetical example of how group-level CST results may be compared. In this example, the percentages of students scoring at or above proficient in ELA are compared between 2007 and 2006 across grades for the same school. Comparisons between 2007 and 2006 in Table I.4 indicate the same trends as Table I.3: a slightly higher percentage of grade 2, 4, and 6 students scored at proficient or above, a slightly lower percentage of grade 5 students scored at proficient or above, and the same percentage of grade 3 students scored proficient or above. Note that Table I.4 also provides a comparison of overall results for the entire school. Because “proficient or above” in ELA is a standards-based classification, 2007 and 2006 results for the entire school may be calculated by averaging across grades. The resulting school-level averages may be compared from year to year. However, for each year, these school-level averages should be weighted to reflect the numbers of students in each grade. For example, the results for grades 2 and 6 carry more weight in the calculations for 2006, but grades 3 and 4 carry more weight in the calculations for 2007. While these examples have only made comparisons across one year, for program evaluation it is important that results be compared across a number of years to verify that the trend is stable.
A scale score is derived from a statistical proc-ess. It is not pos-sible to calculate a scale score by multiplying a stu-dent’s percent correct in a con-tent area by 600.

Part I General Information | Chapter I.4 Comparing Results
August 2007 2007 STAR Post-Test Guide 15 © 2007 by the California Department of Education
Table I.4 Hypothetical example of using CSTs to measure growth by comparing percentages of students at proficient and above
2006 CST for ELA 2007 CST for ELA
Grade # Students % Prof or Above # Students % Prof or Above Difference
Grade 2 120 31% 111 35% 4%
Grade 3 100 33% 124 33% 0%
Grade 4 90 29% 102 31% 2%
Grade 5 100 34% 94 32% -2%
Grade 6 120 31% 98 32% 1%
All Grades 530 32% 529 33% 1%
Comparing Scale Scores and Performance Levels for Individual Students
Standard 13.7 of the Standards for Educational and Psychological Testing states, “In educational settings, a decision or characterization that will have major impact on a student should not be made on the basis of a single test score. Other relevant information should be taken into account if it will enhance the overall validity of the decision.”1
Decisions about promotion, retention, placement, or eligibility for special programs may use or include California Standards Test (CST) results only in conjunction with multiple other measures including, but not limited to, locally administered tests, teacher recommendations, and grades.
In any test, one can assume that scores for an individual would vary if it were somehow possible to give the same test over and over again. For example, students may vary in their performance because of the way they are feeling on the day of the test or they may be especially lucky or unlucky when they guess at questions they do not know. This random variation in individual scores is quantified using a statistic called the standard error of measurement (SEM). There are several features of the SEM that are useful in interpreting scale scores:
• SEMs can help evaluate the accuracy of test scores. One can interpret the SEM for an individual as one would the standard deviation for a group of test scores: given a single score for a student, it can be assumed that if the student were to take the test over and over again, the student would score within one SEM of the observed score about 68 percent of the time and within two SEMs about 95 percent of the time.
• The SEM is not the same at all score levels. The conditional standard error of measurement (CSEM) indicates the SEM that is associated with a particular score level. That is, scale scores are more or less accurate at different points on the scale.
Appendix D on page 130 lists the CSEMs for each CST at the four performance level cut points: below basic, basic, proficient, and advanced. For each content area and grade, 1 1999, American Educational Research Association, American Psychological Association, and National Council on Measurement in Education.

Part I General Information | Chapter I.4 Comparing Results
16 2007 STAR Post-Test Guide August 2007 © 2007 by the California Department of Education
these tables include the scale score that corresponds to the performance level cut point. The CSEMs vary by content area/grade and by performance level. In general, the CSEMs are slightly lower at the basic and proficient levels, and slightly higher at the below basic and advanced levels.
Comparing CAT/6 Survey Results Since the CAT/6 Survey is unchanged from year to year, reviewers may compare the test results from year to year as well as between and among schools and/or districts for the tests administered during spring 2003, 2004, 2005, 2006, and 2007. When comparing CAT/6 Survey results, compare results only within the same subject. The most defensible comparison is the Percent of Students Scoring At or Above the 50th National Percentile Rank (NPR). This is the percentage of students in the group purported to have demonstrated achievement at or above grade level and tells you the percentage of students in the tested group that scored at or above the score achieved by half (50%) of the students in the national sample (norm group). If the percent of students that scored at or above the 50th NPR is greater than 50, the group performed better than the national sample. The percentages of students that scored at or above the 50th NPR can be compared between and among schools and school districts, as well as used to compare a school’s test results to those of its school district, county, or the state. The grade three or grade seven results can be compared from year to year, either by comparing within grade and subject the percentage of students scoring at or above the 50th NPR or by comparing the mean scale score from year to year. When making comparisons across years, it is important to understand that even when the number of students is the same, the group’s composition from year to year may be quite different if student mobility (transiency) is high. Generally there will be more variance in scores from year to year when small numbers of students are tested. Any comparison of groups between years should not be used for diagnostic, placement, or promotion or retention purposes. Decisions about promotion, retention, placement, or eligibility for special programs may use or include STAR Program results only in conjunction with multiple other measures including, but not limited to, locally administered tests, teacher recommendations, and grades.
Comparing STS Results Because this is the first year of administration for the STS, there is currently no data that would allow comparison. Once this data has become available—that is, when STS has been administered over a few years—STS results could be compared in the same ways and using the same methodologies that are used to compare CST results. Performance levels and scale scores will be available for the STS for grades 2, 3, and 4 starting in 2008.

PPaarrtt IIII RReeppoorrtt DDeessccrriippttiioonnss
Part II Report Descriptions

Part II Report Descriptions | Chapter II.1 Report Descriptions | STAR CST-CAT/6 Survey, CAPA, and STS Printed Reports
18 2007 STAR Post-Test Guide August 2007 © 2007 by the California Department of Education
Chapter II.1 Report Descriptions STAR CST-CAT/6 Survey, CAPA, and STS Printed Reports
Please note that the California Department of Education (CDE) does not keep or maintain the CST-CAT/6 Survey, CAPA, or STS reports. Reports are kept and maintained at the district and subordinate levels. California Standards Tests are criterion-referenced tests that measure students’ progress toward mastering California Content Standards in English–language arts, mathematics, science, and history–social science. The California Achievement Tests, Sixth Edition Survey, is a norm-referenced test battery. The tests are used to assess how the achievement of California students in grades 3 and 7 ranks against the achievement of national samples of students tested in these grades at about the same time of the school year. The California Alternate Performance Assessment is also criterion-referenced. It measures the progress of students with significant cognitive disabilities toward mastering sets of California’s content standards. Standards-based Tests in Spanish permit students to demonstrate achievement of the California Content Standards in reading–language arts and mathematics through primary language tests that are aligned to the standards.

Part II Report Descriptions | Chapter II.1 Report Descriptions
August 2007 2007 STAR Post-Test Guide 19 © 2007 by the California Department of Education
Table II.1 2007 STAR CST-CAT/6 Survey, CAPA, and STS Printed Reports
2007 STAR CST-CAT/6 SURVEY, CAPA, AND STS PRINTED REPORTS DESCRIPTION USE AND DISTRIBUTION Student Master List Summary (CST, CAPA, and STS) This report summarizes student results for CSTs, CAPA, and STS at the school, district, county, and state level for each grade. It does not include any individual student information. It does not include information on the CAT/6 Survey. For each CST and STS grade and CAPA level, the following data are summarized:
• By subject tested, number of students enrolled, number and percent of students tested, number and percent of valid scores, and number tested with scores
• Mean percent correct, mean scale score, and scale score standard deviation for each subject tested for CST1 and CAPA6
• Number and percentage of students scoring at each CST or CAPA performance level3
• For CSTs only, the number of items for each reporting cluster and the mean percent correct
• For the CSTs for grades 4 and 7 only, the Writing Application score
• For STS only, the percentage correct for each subject2 tested
Note: Summaries for specific CSTs for mathematics, science, and history–social science across grades are provided in the Student Master List Summary—End-of-Course (EOC) report.
This report is a resource for evaluators, researchers, teachers, parents/guardians, community members, and administrators. One copy is sent to the school and one to the district. This report is also produced for districts, counties, and the state. Note: The data on this report may be shared
with parents/guardians, community members, and the media only if the data are for 11 or more students.
Student Master List Summary – End-of-Course (CST) This report summarizes Student Master List information for end-of-course CSTs for mathematics, science, and history–social science across grades at the school, district, county, and state level. It does not include any individual student information. It does not include information on the CAT/6 Survey, CAPA, or STS. At grades 7–11, CSTs for end-of-course mathematics are given in the following subjects: Algebra I, Geometry, Algebra II, General Math (grades 8 and 9), Integrated Mathematics 1, 2, and 3, and Summative High School Math (grades 9–11). At grades 9–11, CSTs for end-
This report is a resource for evaluators, researchers, teachers, parents/guardians, community members, and administrators. One copy is sent to the school and one to the district. This report is also produced for districts, counties, and the state. Note: The data on this report may be shared
with parents/guardians, community members, and the media only if the data are for 11 or more students.
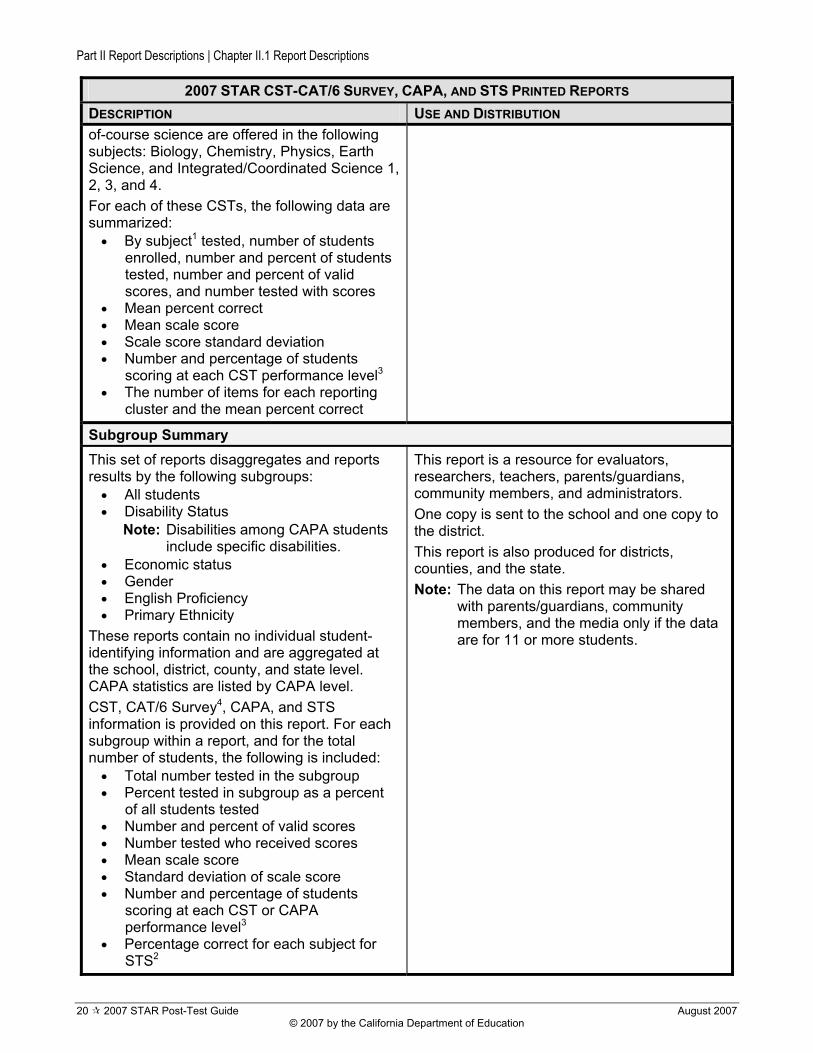
Part II Report Descriptions | Chapter II.1 Report Descriptions
20 2007 STAR Post-Test Guide August 2007 © 2007 by the California Department of Education
2007 STAR CST-CAT/6 SURVEY, CAPA, AND STS PRINTED REPORTS DESCRIPTION USE AND DISTRIBUTION of-course science are offered in the following subjects: Biology, Chemistry, Physics, Earth Science, and Integrated/Coordinated Science 1, 2, 3, and 4. For each of these CSTs, the following data are summarized:
• By subject1 tested, number of students enrolled, number and percent of students tested, number and percent of valid scores, and number tested with scores
• Mean percent correct • Mean scale score • Scale score standard deviation • Number and percentage of students
scoring at each CST performance level3 • The number of items for each reporting
cluster and the mean percent correct
Subgroup Summary This set of reports disaggregates and reports results by the following subgroups:
• All students • Disability Status
Note: Disabilities among CAPA students include specific disabilities.
• Economic status • Gender • English Proficiency • Primary Ethnicity
These reports contain no individual student-identifying information and are aggregated at the school, district, county, and state level. CAPA statistics are listed by CAPA level. CST, CAT/6 Survey4, CAPA, and STS information is provided on this report. For each subgroup within a report, and for the total number of students, the following is included:
• Total number tested in the subgroup • Percent tested in subgroup as a percent
of all students tested • Number and percent of valid scores • Number tested who received scores • Mean scale score • Standard deviation of scale score • Number and percentage of students
scoring at each CST or CAPA performance level3
• Percentage correct for each subject for STS2
This report is a resource for evaluators, researchers, teachers, parents/guardians, community members, and administrators. One copy is sent to the school and one copy to the district. This report is also produced for districts, counties, and the state. Note: The data on this report may be shared
with parents/guardians, community members, and the media only if the data are for 11 or more students.
Part II Report Descriptions | Chapter II.1 Report Descriptions
August 2007 2007 STAR Post-Test Guide 21 © 2007 by the California Department of Education
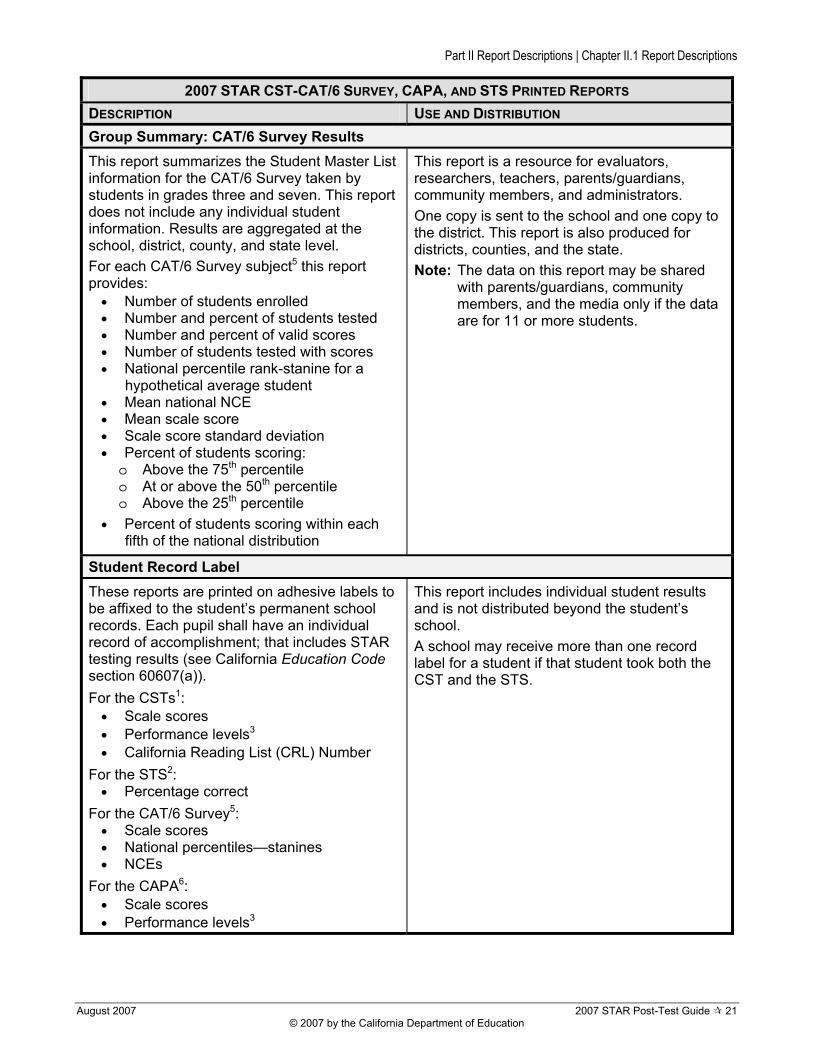
2007 STAR CST-CAT/6 SURVEY, CAPA, AND STS PRINTED REPORTS DESCRIPTION USE AND DISTRIBUTION Group Summary: CAT/6 Survey Results This report summarizes the Student Master List information for the CAT/6 Survey taken by students in grades three and seven. This report does not include any individual student information. Results are aggregated at the school, district, county, and state level. For each CAT/6 Survey subject5 this report provides:
• Number of students enrolled • Number and percent of students tested • Number and percent of valid scores • Number of students tested with scores • National percentile rank-stanine for a
hypothetical average student • Mean national NCE • Mean scale score • Scale score standard deviation • Percent of students scoring: o Above the 75th percentile o At or above the 50th percentile o Above the 25th percentile
• Percent of students scoring within each fifth of the national distribution
This report is a resource for evaluators, researchers, teachers, parents/guardians, community members, and administrators. One copy is sent to the school and one copy to the district. This report is also produced for districts, counties, and the state. Note: The data on this report may be shared
with parents/guardians, community members, and the media only if the data are for 11 or more students.
Student Record Label These reports are printed on adhesive labels to be affixed to the student’s permanent school records. Each pupil shall have an individual record of accomplishment; that includes STAR testing results (see California Education Code section 60607(a)). For the CSTs1:
• Scale scores • Performance levels3 • California Reading List (CRL) Number
For the STS2: • Percentage correct
For the CAT/6 Survey5: • Scale scores • National percentiles—stanines • NCEs
For the CAPA6: • Scale scores • Performance levels3
This report includes individual student results and is not distributed beyond the student’s school. A school may receive more than one record label for a student if that student took both the CST and the STS.

Part II Report Descriptions | Chapter II.1 Report Descriptions
22 2007 STAR Post-Test Guide August 2007 © 2007 by the California Department of Education
2007 STAR CST-CAT/6 SURVEY, CAPA, AND STS PRINTED REPORTS DESCRIPTION USE AND DISTRIBUTION Student Master List This report is an alphabetical roster of individual student results on the CSTs, the CAT/6 Survey, the CAPA, and the STS. For the CSTs:
• Percent correct for each reporting cluster within each subject1 tested
• A scale score and a performance level2 for each subject1 tested
• California Reading List number For the CAT/6 Survey4:
• Percentile ranks • Stanines • NCEs
For the CAPA: • A scale score and a performance level3 for
each subject6 tested For the STS:
• Percent correct for the subject2 tested • Percent correct for each reporting cluster
within each subject2 tested
This report provides administrators and teachers with a quick reference to third and seventh grade students’ CAT/6 Survey results; and all students’ CST, CAPA, and STS results within each grade or within each grade and year-round schedule at a school. Because this report includes individual student results, it is not distributed beyond the student’s school.
The STAR Student Report—CST-CAT/6 Survey A report for CSTs and CAT/6 Survey based on the tests the student took. For CSTs-CAT/6 Survey, this report provides parents/guardians and teachers with the student’s results in tables and graphs. For the CSTs:
• Scale scores • Performance levels3 • Number and percent correct in each
reporting cluster • Comparison of the student’s scores on
specific content areas (reporting clusters) to the range of scores of students statewide who scored at the lowest score for proficient to the lowest score for advanced on the total test
• Student’s California Reading List number For the CAT/6 Survey4:
• Percentiles by subject5 tested The report is formatted with the student’s mailing address positioned for use in windowed envelopes for mailing to parents/guardians if the district provided mailing addresses.
This report includes individual student results and is not distributed beyond parents/guardians and the student’s school. Two color copies of this report are provided for each student: One is for the student’s current teacher, and one is to be distributed to parents/ guardians by the district. For mailing, use a size 10 left-hand window envelope. Fold the report in thirds so that the address, if printed, will appear in the window.

Part II Report Descriptions | Chapter II.1 Report Descriptions
August 2007 2007 STAR Post-Test Guide 23 © 2007 by the California Department of Education
2007 STAR CST-CAT/6 SURVEY, CAPA, AND STS PRINTED REPORTS DESCRIPTION USE AND DISTRIBUTION The STAR Student Report—CAPA This report provides parents/guardians and teachers with the student’s results in tables and graphs. Data presented include:
• Scale scores • Performance levels3 • Descriptions of performance levels
The report is formatted with the student’s mailing address positioned for use in windowed envelopes for mailing to parents/guardians if the district provided mailing addresses.
This report includes individual student results and is not distributed beyond parents/guardians and the student’s school. Two copies of this report are provided for each student: One is for the student’s current teacher, and one is to be distributed to parents/ guardians by the district. For mailing, use a size 10 left-hand window envelope. Fold the report in thirds so that the address, if printed, will appear in the window.
The STAR Student Report—STS This report provides parents/guardians and teachers with the student’s percent correct results in tables and graphs and shows the percent correct by reporting cluster. The report is formatted with the student’s mailing address positioned for use in windowed envelopes for mailing to parents/guardians if the district provided mailing addresses. Because students who take the STS must also take the grade-level CSTs, students will likely receive two Student Reports.
This report includes individual student results and is not distributed beyond parents/guardians and the student’s school. Two copies of this report are provided for each student: One is for the student’s current teacher, and one is to be distributed to parents/ guardians by the district. For mailing, use size 10 left-hand window envelope. Fold the report in thirds so that the address, if printed, will appear in the window.
California Report for Teachers The purpose of this report is to make the results of last year’s CST more useful for instruction by addressing three questions:
• How did last year’s students perform on the CST?
• How did each group of students perform? • What additional resources are available?
There are separate reports for English–language arts and mathematics.
One copy of this report is provided to the teacher who had the class during the year the test was given if teacher information was included in Pre-ID files or coded on School and Grade Identification (SGID) sheets. Every school receives grade-level or end-of-course reports. Reports for individual teachers will be delivered in sealed envelopes. These are to be delivered only to the teacher whose name is on the envelope. Under no circumstances is the information in the reports to be used for teacher evaluation.
Legend 1 CST subjects tested are: English–language arts (grades 2–11), mathematics (grades 2–7), science (grades 5, 8, and
10), history–social science (grades 8 and 11), mathematics end-of-course (grades 7–11), science end-of-course (grades 9–11), and history–social science end-of-course (grades 9–11).
2 STS subjects tested are Reading–language arts and mathematics. 3 Performance levels are: advanced, proficient, basic, below basic, far below basic. 4 CAT/6 Survey is taken by students in grades 3 and 7 only. 5 CAT/6 Survey subjects tested are: reading, language, spelling, and mathematics. 6 CAPA subjects assessed are English–language arts and mathematics.
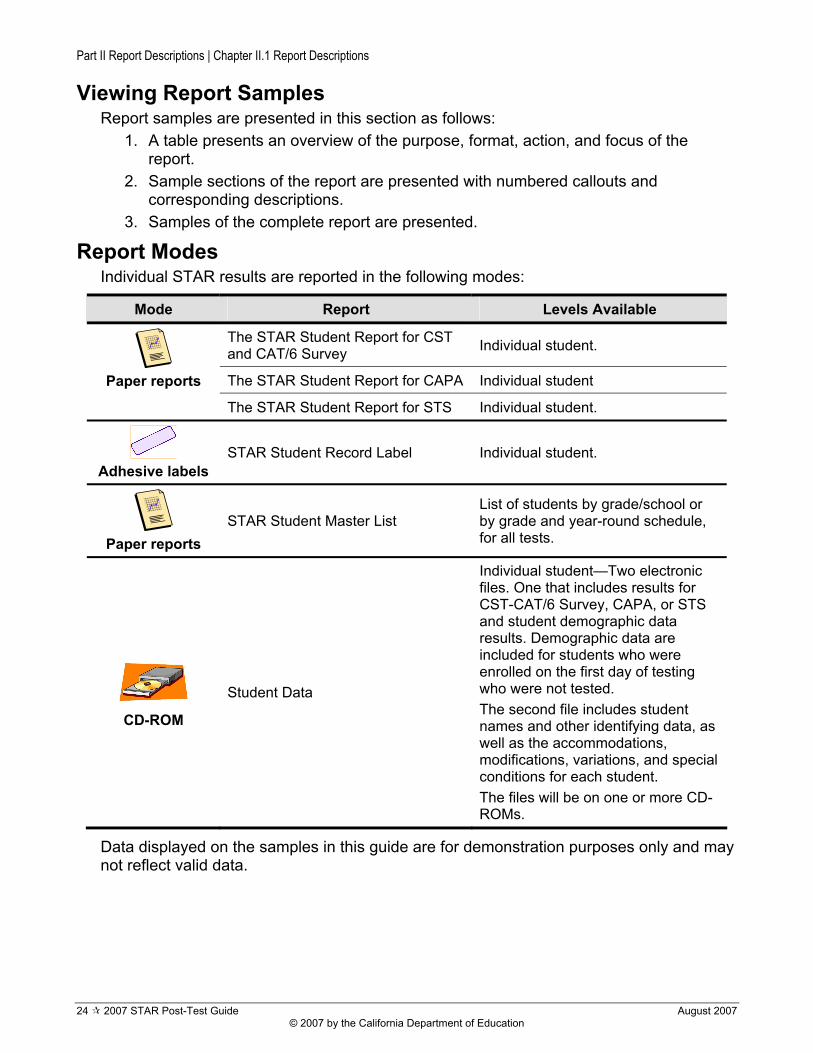
Part II Report Descriptions | Chapter II.1 Report Descriptions
24 2007 STAR Post-Test Guide August 2007 © 2007 by the California Department of Education
Viewing Report Samples Report samples are presented in this section as follows:
1. A table presents an overview of the purpose, format, action, and focus of the report.
2. Sample sections of the report are presented with numbered callouts and corresponding descriptions.
3. Samples of the complete report are presented.
Report Modes Individual STAR results are reported in the following modes:
Mode Report Levels Available
The STAR Student Report for CST and CAT/6 Survey Individual student.
The STAR Student Report for CAPA Individual student
Paper reports
The STAR Student Report for STS Individual student.
Adhesive labels STAR Student Record Label Individual student.
Paper reports
STAR Student Master List List of students by grade/school or by grade and year-round schedule, for all tests.
CD-ROM
Student Data
Individual student—Two electronic files. One that includes results for CST-CAT/6 Survey, CAPA, or STS and student demographic data results. Demographic data are included for students who were enrolled on the first day of testing who were not tested. The second file includes student names and other identifying data, as well as the accommodations, modifications, variations, and special conditions for each student. The files will be on one or more CD-ROMs.
Data displayed on the samples in this guide are for demonstration purposes only and may not reflect valid data.

Part II Report Descriptions | Chapter II.2 Summary Reports | STAR Student Master List Summary
August 2007 2007 STAR Post-Test Guide 25 © 2007 by the California Department of Education
Chapter II.2 Summary Reports STAR Student Master List Summary
Purpose To summarize performance of a group of students (grade within a school, district, county, or state) on the CSTs, the CAPA, and STS. Includes data for all students on the Student Master List.
Format A grade-level report for each grade in the school, district, or county. Results for all CSTs, CAPA, and the STS administered at each grade are on the report.
Action Test coordinators and school administrators should review for accuracy and completeness and use these results for reporting schoolwide results to school staff and the public.
Focus Summary of student performance on the CSTs and STS by grade and test, including performance on the reporting clusters. Summary of student performance on the CAPA by grade and CAPA level.
For the list of 2007 reporting clusters and number of questions for each, see Appendix A on page 116 for CST reporting clusters, and Appendix B on page 126 for STS reporting clusters.

Part
II Rep
ort D
escri
ption
s | C
hapte
r II.2
Sum
mary
Repo
rts | S
TAR
Stud
ent M
aster
List
Summ
ary
26
200
7 S
TAR
Pos
t-Tes
t Gui
de
A
ugus
t 200
7 ©
200
7 by
the
Cal
iforn
ia D
epar
tmen
t of E
duca
tion
Gra
de 4
Stu
dent
Mas
ter L
ist S
umm
ary
Sam
ple
1.
Num
ber
Enro
lled
3. P
erce
nt
Test
ed
2.
Num
ber
Test
ed
5.
Per
cent
V
alid
S
core
s
9.
Per
cent
age
(%)
6.
Num
ber T
este
d w
/Sco
res
10.
Perfo
rman
ce L
evel
s
11.
Mea
n Sc
ale
Scor
e
12.
Scal
e Sc
ore
Stan
dard
Dev
iatio
n
13.
Rep
ortin
g C
lust
ers
14.
Num
ber
Pos
sibl
e
15.
Mea
n P
erce
nt
Cor
rect
16.
Writ
ing
Appl
icat
ion
Per
cent
17
. W
ritin
g Ap
plic
atio
n Sc
ore
Cod
es
4.
Num
berV
alid
S
core
s
7.
Mea
n P
erce
nt
Cor
rect
8.
Num
ber (
#)

Part
II Rep
ort D
escri
ption
s | C
hapte
r II.2
Sum
mary
Repo
rts
Aug
ust 2
007
20
07 S
TAR
Pos
t-Tes
t Gui
de
27
© 2
007
by th
e C
alifo
rnia
Dep
artm
ent o
f Edu
catio
n
Tabl
e II.
2 ST
AR
Stu
dent
Mas
ter L
ist S
umm
ary
Des
crip
tions
1..
Num
ber E
nrol
led
For t
he s
ubje
ct, n
umbe
r of m
ultip
le-c
hoic
e an
swer
doc
umen
ts s
ubm
itted
min
us th
e nu
mbe
r of
ans
wer
doc
umen
ts c
oded
for s
tude
nt e
nrol
led
afte
r the
firs
t day
and
was
test
ed.
2..
Num
ber T
este
d Fo
r the
sub
ject
, num
ber o
f stu
dent
s th
at re
spon
ded
to a
ny q
uest
ions
on
the
test
or w
hose
an
swer
doc
umen
ts w
ere
code
d fo
r tes
ted
but m
arke
d no
ans
wer
s.
3..
Perc
ent T
este
d Fo
r the
sub
ject
, num
ber o
f stu
dent
s te
sted
, div
ided
by
the
num
ber o
f stu
dent
s en
rolle
d,
mul
tiplie
d by
100
, and
roun
ded
to th
e ne
ares
t ten
th. [
(Num
ber T
este
d / N
umbe
r Enr
olle
d)
*100
, rou
nded
to n
eare
st te
nth]
In
som
e ca
ses,
the
perc
ent t
este
d m
ay e
xcee
d 10
0.
4..
Num
ber V
alid
Sco
res
For t
he s
ubje
ct, n
umbe
r of s
tude
nts
test
ed a
t gra
de le
vel w
ho re
ceiv
ed a
sca
le s
core
and
pe
rform
ance
leve
l for
the
test
. For
agg
rega
te re
porti
ng a
nd a
ccou
ntab
ility
pur
pose
s, th
is
num
ber d
oes
not i
nclu
de:
• in
com
plet
e te
sts
• te
sts
take
n w
ith m
odifi
catio
ns
• st
uden
ts w
ith in
cons
iste
nt g
rade
s (te
st d
id n
ot m
atch
stu
dent
’s g
rade
leve
l)
5..
Perc
ent V
alid
Sco
res
For t
he s
ubje
ct, n
umbe
r of v
alid
sco
res,
div
ided
by
the
num
ber o
f stu
dent
s te
sted
, mul
tiplie
d by
100
, and
roun
ded
to th
e ne
ares
t who
le n
umbe
r. [(N
umbe
r Val
id S
core
s / N
umbe
r Tes
ted)
*
100,
roun
ded
to n
eare
st w
hole
num
ber]
6..
Num
ber T
este
d w
ith S
core
s Fo
r the
sub
ject
, num
ber o
f stu
dent
s w
ho to
ok C
STs
and
who
se te
stin
g re
sulte
d in
sco
res.
N
umbe
r inc
lude
s st
uden
ts w
ho te
sted
with
mod
ifica
tions
but
not
: •
inco
mpl
ete
test
s •
stud
ents
with
inco
nsis
tent
gra
des
(test
did
not
mat
ch s
tude
nt’s
gra
de le
vel)
• un
know
n E
OC
mat
h or
sci
ence
test
(stu
dent
did
not
mar
k w
hich
test
was
take
n)
7..
Mea
n Pe
rcen
t Cor
rect
Fo
r the
sub
ject
, sum
of a
ll th
e ra
w s
core
s fo
r val
id te
sts,
div
ided
by
the
num
ber o
f stu
dent
s w
ith v
alid
sco
res,
div
ided
by
the
num
ber o
f que
stio
ns o
n th
e te
st, m
ultip
lied
by 1
00, a
nd
roun
ded
to th
e ne
ares
t who
le n
umbe
r. {[(Σ
Raw
Sco
res
/ # o
f Val
id S
core
s) /
Tota
l Q
uest
ions
] * 1
00, r
ound
ed to
nea
rest
who
le n
umbe
r}
8..
Num
ber (
#)
For t
he s
ubje
ct, n
umbe
r of s
tude
nts’
sco
res
at e
ach
perfo
rman
ce le
vel.
Doe
s no
t app
ly to
S
TS.

Part
II Rep
ort D
escri
ption
s | C
hapte
r II.2
Sum
mary
Repo
rts
28
200
7 S
TAR
Pos
t-Tes
t Gui
de
A
ugus
t 200
7 ©
200
7 by
the
Cal
iforn
ia D
epar
tmen
t of E
duca
tion
9..
Perc
enta
ge (%
) Fo
r the
sub
ject
, per
cent
of s
tude
nts’
sco
res
at e
ach
perfo
rman
ce le
vel.
Doe
s no
t app
ly to
S
TS.
10..
Perf
orm
ance
Lev
els
One
of f
ive
rang
es o
f sca
le s
core
s: a
dvan
ced,
pro
ficie
nt, b
asic
, bel
ow b
asic
, or f
ar b
elow
ba
sic.
The
targ
et is
for a
ll st
uden
ts to
sco
re p
rofic
ient
or a
dvan
ced.
Doe
s no
t app
ly to
STS
. N
ote:
S
core
s fo
r stu
dent
s te
sted
with
mod
ifica
tions
are
cou
nted
in th
e fa
r bel
ow b
asic
leve
l fo
r agg
rega
te re
porti
ng a
nd a
ccou
ntab
ility
pur
pose
s on
ly.
11.
Mea
n Sc
ale
Scor
e Fo
r the
sub
ject
, ave
rage
of t
he v
alid
sca
le s
core
s fo
r the
gro
up o
f stu
dent
s. [(
Sum
of V
alid
S
core
s / N
umbe
r Val
id S
core
s)] (
The
scal
e sc
ore
for C
STs
is a
val
ue fr
om 1
50 to
600
, with
35
0 as
the
low
est s
core
for a
pro
ficie
nt p
erfo
rman
ce le
vel.
The
scal
e sc
ore
for C
AP
A is
a
valu
e fro
m 1
5 to
60,
with
35
as th
e lo
wes
t sco
re fo
r a p
rofic
ient
per
form
ance
leve
l.) D
oes
not
appl
y to
STS
.
12.
Scal
e Sc
ore
Stan
dard
D
evia
tion
Sta
ndar
d de
viat
ion
(SD
) of t
he s
cale
sco
res
for a
gro
up o
f stu
dent
s. T
he s
cale
sco
re S
D
indi
cate
s ho
w fa
r aw
ay s
cale
sco
res
are
from
the
scal
e sc
ore
mea
n. A
bout
68%
of t
he
scor
es w
ill b
e pl
us o
r min
us o
ne s
tand
ard
devi
atio
n fro
m th
e m
ean.
Abo
ut 9
5% o
f the
sco
res
will
be
with
in p
lus
or m
inus
two
stan
dard
dev
iatio
ns fr
om th
e m
ean.
Doe
s no
t app
ly to
STS
.
13.
Rep
ortin
g C
lust
ers
Nam
es o
f rep
ortin
g cl
uste
rs fo
r CS
Ts a
nd S
TS. T
hese
var
y by
gra
de a
nd s
ubje
ct. D
oes
not
appl
y to
CA
PA
.
14.
Num
ber P
ossi
ble
For t
he re
porti
ng c
lust
er, n
umbe
r of q
uest
ions
.
15.
Mea
n Pe
rcen
t Cor
rect
Fo
r the
repo
rting
clu
ster
, the
mea
n pe
rcen
t cor
rect
.
16.
Writ
ing
App
licat
ion
Perc
ent
For g
rade
s 4
and
7 C
ST
only
. Per
cent
of s
tude
nt s
core
s at
eac
h W
ritin
g A
pplic
atio
n S
core
(2
, 4, 6
, or 8
).
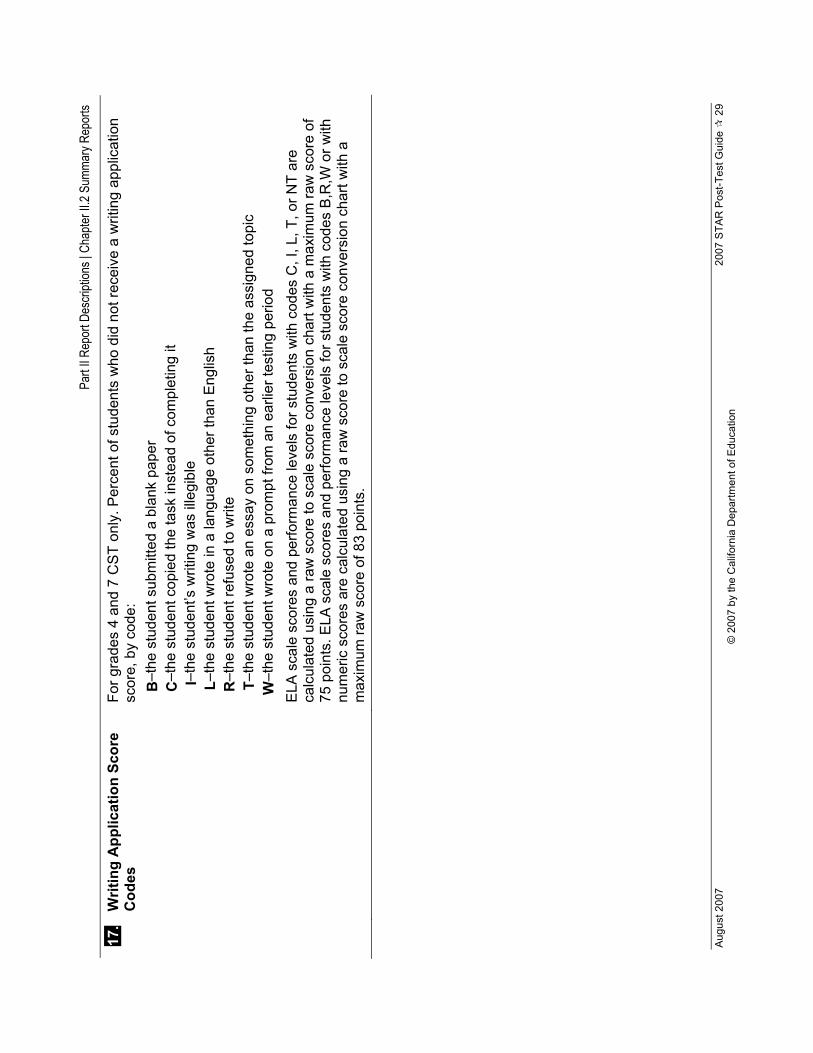
Part
II Rep
ort D
escri
ption
s | C
hapte
r II.2
Sum
mary
Repo
rts
Aug
ust 2
007
20
07 S
TAR
Pos
t-Tes
t Gui
de
29
© 2
007
by th
e C
alifo
rnia
Dep
artm
ent o
f Edu
catio
n
17.
Writ
ing
App
licat
ion
Scor
e C
odes
Fo
r gra
des
4 an
d 7
CS
T on
ly. P
erce
nt o
f stu
dent
s w
ho d
id n
ot re
ceiv
e a
writ
ing
appl
icat
ion
scor
e, b
y co
de:
B C I L R T W
–the
stu
dent
sub
mitt
ed a
bla
nk p
aper
–t
he s
tude
nt c
opie
d th
e ta
sk in
stea
d of
com
plet
ing
it –t
he s
tude
nt’s
writ
ing
was
ille
gibl
e –t
he s
tude
nt w
rote
in a
lang
uage
oth
er th
an E
nglis
h –t
he s
tude
nt re
fuse
d to
writ
e –t
he s
tude
nt w
rote
an
essa
y on
som
ethi
ng o
ther
than
the
assi
gned
topi
c –t
he s
tude
nt w
rote
on
a pr
ompt
from
an
earli
er te
stin
g pe
riod
ELA
sca
le s
core
s an
d pe
rform
ance
leve
ls fo
r stu
dent
s w
ith c
odes
C, I
, L, T
, or N
T ar
e ca
lcul
ated
usi
ng a
raw
sco
re to
sca
le s
core
con
vers
ion
char
t with
a m
axim
um ra
w s
core
of
75 p
oint
s. E
LA s
cale
sco
res
and
perfo
rman
ce le
vels
for s
tude
nts
with
cod
es B
,R,W
or w
ith
num
eric
sco
res
are
calc
ulat
ed u
sing
a ra
w s
core
to s
cale
sco
re c
onve
rsio
n ch
art w
ith a
m
axim
um ra
w s
core
of 8
3 po
ints
.
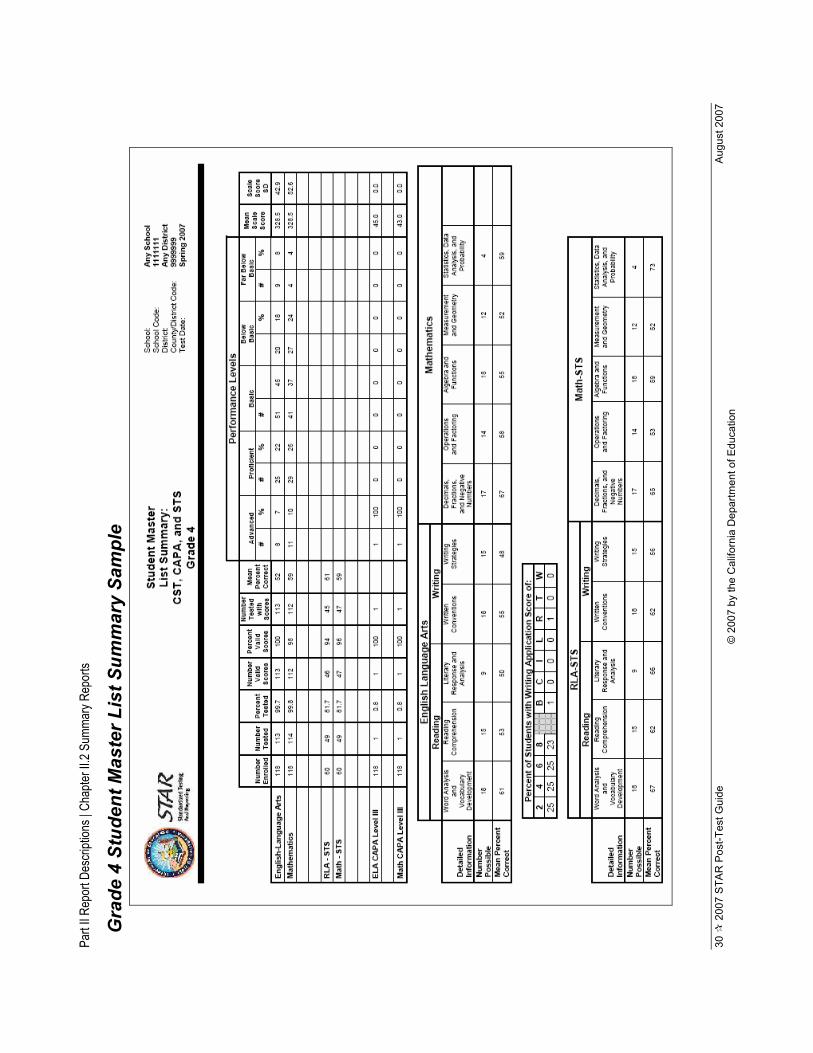
Part
II Rep
ort D
escri
ption
s | C
hapte
r II.2
Sum
mary
Repo
rts
30
200
7 S
TAR
Pos
t-Tes
t Gui
de
A
ugus
t 200
7 ©
200
7 by
the
Cal
iforn
ia D
epar
tmen
t of E
duca
tion
Gra
de 4
Stu
dent
Mas
ter L
ist S
umm
ary
Sam
ple

Part
II Rep
ort D
escri
ption
s | C
hapte
r II.2
Sum
mary
Repo
rts
Aug
ust 2
007
20
07 S
TAR
Pos
t-Tes
t Gui
de
31
© 2
007
by th
e C
alifo
rnia
Dep
artm
ent o
f Edu
catio
n
Gra
de 1
0 St
uden
t Mas
ter L
ist S
umm
ary
Sam
ple
(With
out C
APA
)
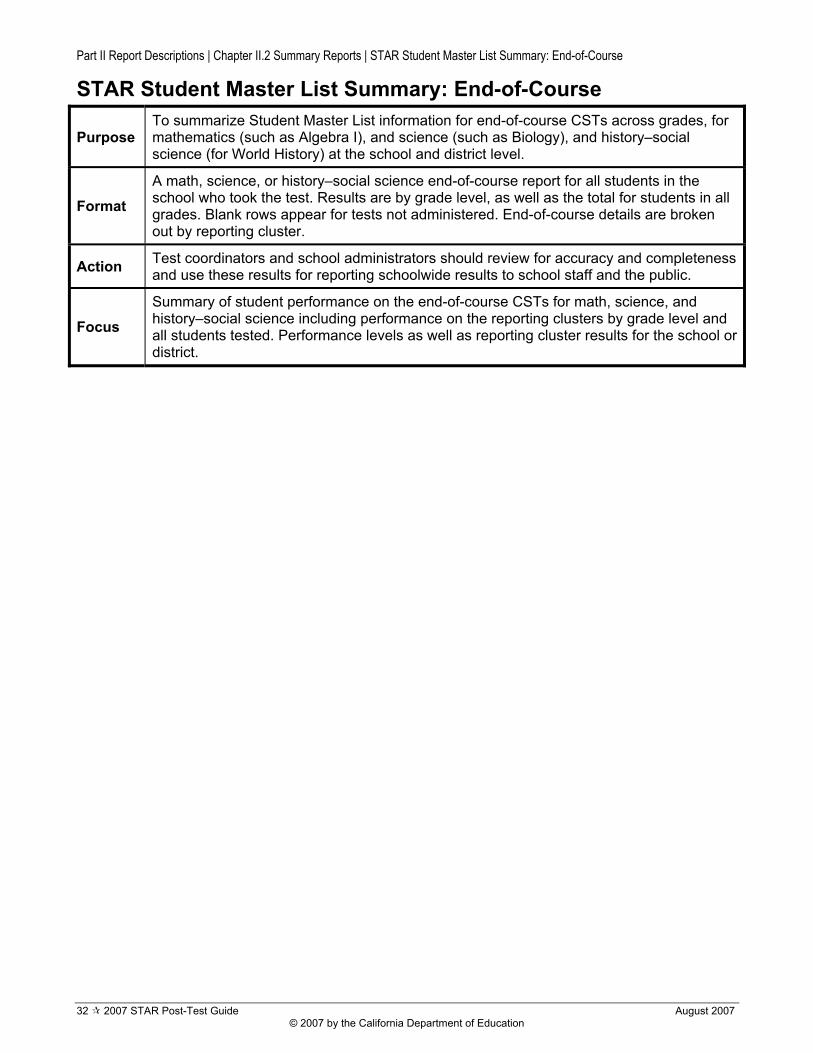
Part II Report Descriptions | Chapter II.2 Summary Reports | STAR Student Master List Summary: End-of-Course
32 2007 STAR Post-Test Guide August 2007 © 2007 by the California Department of Education
STAR Student Master List Summary: End-of-Course
Purpose To summarize Student Master List information for end-of-course CSTs across grades, for mathematics (such as Algebra I), and science (such as Biology), and history–social science (for World History) at the school and district level.
Format A math, science, or history–social science end-of-course report for all students in the school who took the test. Results are by grade level, as well as the total for students in all grades. Blank rows appear for tests not administered. End-of-course details are broken out by reporting cluster.
Action Test coordinators and school administrators should review for accuracy and completeness and use these results for reporting schoolwide results to school staff and the public.
Focus Summary of student performance on the end-of-course CSTs for math, science, and history–social science including performance on the reporting clusters by grade level and all students tested. Performance levels as well as reporting cluster results for the school or district.

Part
II Rep
ort D
escri
ption
s | C
hapte
r II.2
Sum
mary
Repo
rts | S
TAR
Stud
ent M
aster
List
Summ
ary:
End-
of-Co
urse
Aug
ust 2
007
20
07 S
TAR
Pos
t-Tes
t Gui
de
33
© 2
007
by th
e C
alifo
rnia
Dep
artm
ent o
f Edu
catio
n
End-
of-C
ours
e M
ath
Stud
ent M
aste
r Lis
t Sum
mar
y Sa
mpl
e
14.
Num
ber P
ossi
ble
15.
Mea
n P
erce
nt C
orre
ct
1.
Num
ber
Enro
lled
3. P
erce
nt T
este
d
2.
Num
ber
Test
ed
5.
Per
cent
V
alid
S
core
s
9.
Per
cent
age
(%)
6.
Num
ber T
este
d w
/Sco
res
10.
Perfo
rman
ce L
evel
s
11.
Mea
n Sc
ale
Scor
e
12.
Scal
e Sc
ore
Stan
dard
D
evia
tion
13.
Rep
ortin
g C
lust
ers
4.
Num
ber V
alid
S
core
s
7.
Mea
n P
erce
nt
Cor
rect
8.
Num
ber (
#)

Part
II Rep
ort D
escri
ption
s | C
hapte
r II.2
Sum
mary
Repo
rts
34
200
7 S
TAR
Pos
t-Tes
t Gui
de
A
ugus
t 200
7 ©
200
7 by
the
Cal
iforn
ia D
epar
tmen
t of E
duca
tion
Tabl
e II.
3 ST
AR
Stu
dent
Mas
ter L
ist S
umm
ary:
End
-of-C
ours
e D
escr
iptio
ns
1..
Num
ber E
nrol
led
For t
he g
rade
, num
ber o
f mul
tiple
-cho
ice
answ
er d
ocum
ents
sub
mitt
ed m
inus
the
num
ber o
f an
swer
doc
umen
ts c
oded
that
stu
dent
enr
olle
d af
ter t
he fi
rst d
ay a
nd w
as te
sted
.
2..
Num
ber T
este
d Fo
r the
sub
ject
, num
ber o
f stu
dent
s by
gra
de a
nd s
choo
l tha
t res
pond
ed to
any
que
stio
ns o
n th
e te
st o
r who
se a
nsw
er d
ocum
ents
wer
e co
ded
for t
este
d bu
t mar
ked
no a
nsw
ers.
3..
Perc
ent T
este
d Fo
r the
gra
de, n
umbe
r of s
tude
nts
test
ed, d
ivid
ed b
y th
e nu
mbe
r of s
tude
nts
enro
lled,
m
ultip
lied
by 1
00, a
nd ro
unde
d to
the
near
est t
enth
. [(N
umbe
r Tes
ted
/ Num
ber E
nrol
led)
*
100,
roun
ded
to n
eare
st te
nth]
4..
Num
ber V
alid
Sco
res
For t
he g
rade
, num
ber o
f stu
dent
s te
sted
who
rece
ived
a s
cale
sco
re a
nd p
erfo
rman
ce le
vel
for t
he te
st. F
or a
ggre
gate
repo
rting
and
acc
ount
abili
ty p
urpo
ses,
this
num
ber d
oes
not
incl
ude:
•
inco
mpl
ete
test
s •
test
s ta
ken
with
mod
ifica
tions
•
stud
ents
with
inco
nsis
tent
gra
des
(test
did
not
mat
ch s
tude
nt’s
gra
de le
vel)
• un
know
n E
OC
mat
h or
sci
ence
test
(stu
dent
did
not
mar
k w
hich
test
was
take
n)
5..
Perc
ent V
alid
Sco
res
For t
he g
rade
, num
ber o
f val
id s
core
s, d
ivid
ed b
y th
e nu
mbe
r of s
tude
nts
test
ed, m
ultip
lied
by
100,
and
roun
ded
to th
e ne
ares
t who
le n
umbe
r. [(N
umbe
r Val
id S
core
s / N
umbe
r Tes
ted)
*
100,
roun
ded
to n
eare
st w
hole
num
ber]
6..
Num
ber T
este
d w
ith
Scor
es
For t
he g
rade
and
sub
ject
, num
ber o
f stu
dent
s w
hose
test
ing
resu
lted
in s
core
s. N
umbe
r in
clud
es s
tude
nts
who
test
ed w
ith m
odifi
catio
ns b
ut n
ot:
• in
com
plet
e te
sts
• st
uden
ts w
ith in
cons
iste
nt g
rade
s (te
st d
id n
ot m
atch
stu
dent
’s g
rade
leve
l) •
unkn
own
EO
C m
ath
or s
cien
ce te
st (s
tude
nt d
id n
ot m
ark
whi
ch te
st w
as ta
ken)
7..
Mea
n Pe
rcen
t Cor
rect
Fo
r the
gra
de, s
um o
f all
the
raw
sco
res
for v
alid
test
s, d
ivid
ed b
y th
e nu
mbe
r of s
tude
nts
with
va
lid s
core
s, d
ivid
ed b
y th
e nu
mbe
r of q
uest
ions
on
the
test
, mul
tiplie
d by
100
, and
roun
ded
to th
e ne
ares
t who
le n
umbe
r. {[(Σ
Raw
sco
res
/ # o
f Val
id S
core
s) /
Tota
l Que
stio
ns] *
100
, ro
unde
d to
nea
rest
who
le n
umbe
r}
8..
Num
ber (
#)
For t
he g
rade
, num
ber o
f stu
dent
s’ s
core
s at
eac
h pe
rform
ance
leve
l.
9..
Perc
enta
ge (%
) Fo
r the
gra
de, p
erce
nt o
f stu
dent
s’ s
core
s at
eac
h pe
rform
ance
leve
l.

Part
II Rep
ort D
escri
ption
s | C
hapte
r II.2
Sum
mary
Repo
rts
Aug
ust 2
007
20
07 S
TAR
Pos
t-Tes
t Gui
de
35
© 2
007
by th
e C
alifo
rnia
Dep
artm
ent o
f Edu
catio
n
10..
Perf
orm
ance
Lev
els
One
of f
ive
rang
es o
f sca
le s
core
s: a
dvan
ced,
pro
ficie
nt, b
asic
, bel
ow b
asic
, or f
ar b
elow
ba
sic.
The
targ
et is
for a
ll st
uden
ts to
sco
re p
rofic
ient
or a
dvan
ced.
N
ote:
S
core
s fo
r stu
dent
s te
sted
with
mod
ifica
tions
are
cou
nted
in th
e fa
r bel
ow b
asic
leve
l fo
r agg
rega
te re
porti
ng a
nd a
ccou
ntab
ility
pur
pose
s on
ly.
11.
Mea
n Sc
ale
Scor
e Fo
r the
gra
de, a
vera
ge o
f the
val
id s
cale
sco
res
for t
he g
roup
of s
tude
nts.
[(S
um o
f Val
id
Sco
res
/ Num
ber V
alid
Sco
res)
] (Th
e sc
ale
scor
e is
a v
alue
from
150
to 6
00, w
ith 3
50 a
s th
e lo
wes
t sco
re fo
r a p
rofic
ient
per
form
ance
leve
l.)
12.
Scal
e Sc
ore
Stan
dard
D
evia
tion
Sta
ndar
d de
viat
ion
(SD
) of t
he s
cale
sco
res
for a
gro
up o
f stu
dent
s. T
he s
cale
sco
re S
D
indi
cate
s ho
w fa
r aw
ay s
cale
sco
res
are
from
the
scal
e sc
ore
mea
n. A
bout
68%
of t
he s
core
s w
ill b
e pl
us o
r min
us o
ne s
tand
ard
devi
atio
n fro
m th
e m
ean.
Abo
ut 9
5% o
f the
sco
res
will
be
with
in p
lus
or m
inus
two
stan
dard
dev
iatio
ns fr
om th
e m
ean.
13.
Rep
ortin
g C
lust
ers
Nam
es o
f rep
ortin
g cl
uste
rs. T
hese
var
y by
sub
ject
.
14.
Num
ber P
ossi
ble
For t
he re
porti
ng c
lust
er, n
umbe
r of q
uest
ions
.
15.
Mea
n Pe
rcen
t Cor
rect
Fo
r the
repo
rting
clu
ster
, mea
n pe
rcen
t cor
rect
.

Part
II Rep
ort D
escri
ption
s | C
hapte
r II.2
Sum
mary
Repo
rts
36
200
7 S
TAR
Pos
t-Tes
t Gui
de
A
ugus
t 200
7 ©
200
7 by
the
Cal
iforn
ia D
epar
tmen
t of E
duca
tion
Bio
logy
Stu
dent
Mas
ter L
ist S
umm
ary
Sam
ple

Part II Report Descriptions | Chapter II.2 Summary Reports | STAR Subgroup Summary
August 2007 2007 STAR Post-Test Guide 37 © 2007 by the California Department of Education
STAR Subgroup Summary
Purpose To allow schools and districts to look at results based on the following demographics: disability status, economic status, gender, English proficiency, and primary ethnicity, as required by Section 60643(a), (6), (7), and (8) of the California Education Code.
Format The report is sorted by subgroup in this order: All Students, Disability Status, Economic Status, Gender, English Proficiency, and Primary Ethnicity. Note: CAPA statistics on Disability Status are listed with specific disabilities.
Action Districts or schools should review to determine differences in scores between and among subgroups.
Focus Overall performance levels broken down by specific demographics for the CSTs, the CAT/6 Survey (grades 3 and 7 only), the CAPA, and STS (grades 2–4 only) at the individual school and district levels.

Part
II Rep
ort D
escri
ption
s | C
hapte
r II.2
Sum
mary
Repo
rts | S
TAR
Subg
roup
Sum
mary
38
200
7 S
TAR
Pos
t-Tes
t Gui
de
A
ugus
t 200
7 ©
200
7 by
the
Cal
iforn
ia D
epar
tmen
t of E
duca
tion
Subg
roup
Sum
mar
y Sa
mpl
e
3.
Per
cent
Tes
ted
in S
ubgr
oup
2.
Tota
l Tes
ted
5.
Per
cent
Val
id S
core
s
4.
Num
ber V
alid
S
core
s 6
. N
umbe
r Tes
ted
With
Sco
res
8.
Scal
e Sc
ore
Stan
dard
D
evia
tion
9.
Perfo
rman
ce L
evel
s
1.
Test
N
ame
7.
Mea
n Sc
ale
Scor
e
10.
Per
cent
Cor
rect

Part
II Rep
ort D
escri
ption
s | C
hapte
r II.2
Sum
mary
Repo
rts
Aug
ust 2
007
20
07 S
TAR
Pos
t-Tes
t Gui
de
39
© 2
007
by th
e C
alifo
rnia
Dep
artm
ent o
f Edu
catio
n
Tabl
e II.
4 ST
AR
Sub
grou
p Su
mm
ary
Des
crip
tions
1..
Test
Nam
e Th
e na
me
of th
e S
TAR
Pro
gram
test
bei
ng re
porte
d. A
list
ing
for C
STs
and
CA
PA
are
in
clud
ed fo
r all
grad
es. S
ubgr
oup
sum
mar
ies
for C
AT/
6 S
urve
y ar
e in
clud
ed in
repo
rts fo
r gr
ades
3 a
nd 7
. Sub
grou
p su
mm
arie
s fo
r STS
are
incl
uded
in re
ports
for g
rade
s 2,
3, a
nd 4
.
2..
Tota
l Tes
ted
For t
he s
ubgr
oup
and
subj
ect,
num
ber o
f stu
dent
s by
gra
de a
nd s
choo
l tha
t res
pond
ed to
any
qu
estio
ns o
n th
e te
st o
r who
se a
nsw
er d
ocum
ents
wer
e co
ded
for t
este
d bu
t mar
ked
no
answ
ers.
3..
Perc
ent T
este
d in
Su
bgro
up
For t
he s
ubgr
oup
and
subj
ect,
num
ber o
f stu
dent
s te
sted
in th
e su
bgro
up, d
ivid
ed b
y th
e to
tal
num
ber o
f stu
dent
s te
sted
, mul
tiplie
d by
100
, and
roun
ded
to th
e ne
ares
t who
le n
umbe
r. [(N
umbe
r Tes
ted
/ Num
ber E
nrol
led)
* 1
00, r
ound
ed to
nea
rest
who
le n
umbe
r]
4..
Num
ber V
alid
Sco
res
For t
he s
ubgr
oup
and
subj
ect,
num
ber o
f stu
dent
s te
sted
at g
rade
leve
l who
rece
ived
a s
cale
sc
ore
and
perfo
rman
ce le
vel f
or th
e te
st. A
s ap
plie
d to
the
CS
Ts, C
AT/
6 S
urve
y, a
nd S
TS, f
or
aggr
egat
e re
porti
ng a
nd a
ccou
ntab
ility
pur
pose
s, th
is n
umbe
r doe
s no
t inc
lude
: •
inco
mpl
ete
test
s •
test
s ta
ken
with
mod
ifica
tions
•
stud
ents
with
inco
nsis
tent
gra
des
(test
did
not
mat
ch s
tude
nt’s
gra
de le
vel)
• un
know
n E
OC
mat
h or
sci
ence
test
(stu
dent
did
not
mar
k w
hich
test
was
take
n)
5..
Perc
ent V
alid
Sco
res
For t
he s
ubgr
oup
and
subj
ect,
num
ber o
f val
id s
core
s, d
ivid
ed b
y th
e nu
mbe
r of s
tude
nts
test
ed, m
ultip
lied
by 1
00, a
nd ro
unde
d to
the
near
est w
hole
num
ber.
[(Num
ber V
alid
Sco
res
/ N
umbe
r Tes
ted)
* 1
00, r
ound
ed to
nea
rest
who
le n
umbe
r]
6..
Num
ber T
este
d w
ith
Scor
es
For t
he s
ubgr
oup
and
subj
ect,
num
ber o
f stu
dent
s w
hose
test
ing
resu
lted
in s
core
s. N
umbe
r in
clud
es s
tude
nts
who
test
ed w
ith m
odifi
catio
ns b
ut n
ot:
• in
com
plet
e te
sts
• st
uden
ts w
ith in
cons
iste
nt g
rade
s (te
st d
id n
ot m
atch
stu
dent
’s g
rade
leve
l) •
unkn
own
EO
C m
ath
or s
cien
ce te
st (s
tude
nt d
id n
ot m
ark
whi
ch te
st w
as ta
ken)
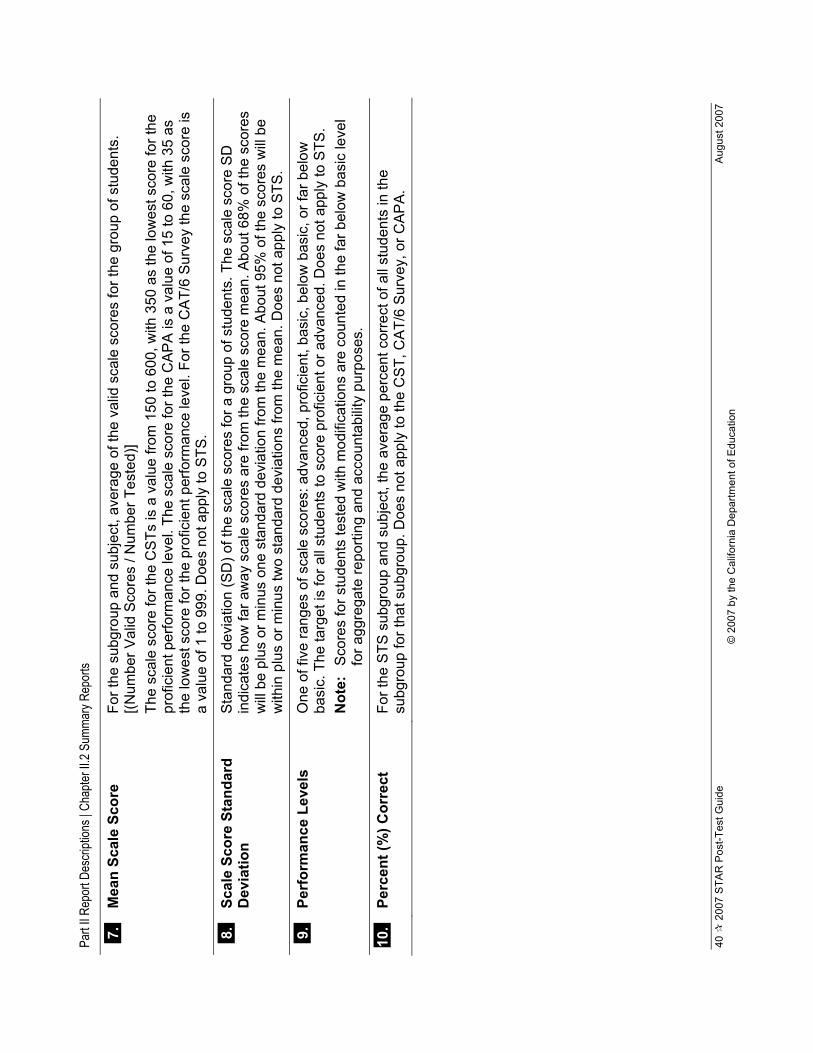
Part
II Rep
ort D
escri
ption
s | C
hapte
r II.2
Sum
mary
Repo
rts
40
200
7 S
TAR
Pos
t-Tes
t Gui
de
A
ugus
t 200
7 ©
200
7 by
the
Cal
iforn
ia D
epar
tmen
t of E
duca
tion
7..
Mea
n Sc
ale
Scor
e Fo
r the
sub
grou
p an
d su
bjec
t, av
erag
e of
the
valid
sca
le s
core
s fo
r the
gro
up o
f stu
dent
s.
[(Num
ber V
alid
Sco
res
/ Num
ber T
este
d)]
The
scal
e sc
ore
for t
he C
STs
is a
val
ue fr
om 1
50 to
600
, with
350
as
the
low
est s
core
for t
he
prof
icie
nt p
erfo
rman
ce le
vel.
The
scal
e sc
ore
for t
he C
AP
A is
a v
alue
of 1
5 to
60,
with
35
as
the
low
est s
core
for t
he p
rofic
ient
per
form
ance
leve
l. Fo
r the
CA
T/6
Sur
vey
the
scal
e sc
ore
is
a va
lue
of 1
to 9
99. D
oes
not a
pply
to S
TS.
8..
Scal
e Sc
ore
Stan
dard
D
evia
tion
Sta
ndar
d de
viat
ion
(SD
) of t
he s
cale
sco
res
for a
gro
up o
f stu
dent
s. T
he s
cale
sco
re S
D
indi
cate
s ho
w fa
r aw
ay s
cale
sco
res
are
from
the
scal
e sc
ore
mea
n. A
bout
68%
of t
he s
core
s w
ill b
e pl
us o
r min
us o
ne s
tand
ard
devi
atio
n fro
m th
e m
ean.
Abo
ut 9
5% o
f the
sco
res
will
be
with
in p
lus
or m
inus
two
stan
dard
dev
iatio
ns fr
om th
e m
ean.
Doe
s no
t app
ly to
STS
.
9..
Perf
orm
ance
Lev
els
One
of f
ive
rang
es o
f sca
le s
core
s: a
dvan
ced,
pro
ficie
nt, b
asic
, bel
ow b
asic
, or f
ar b
elow
ba
sic.
The
targ
et is
for a
ll st
uden
ts to
sco
re p
rofic
ient
or a
dvan
ced.
Doe
s no
t app
ly to
STS
. N
ote:
S
core
s fo
r stu
dent
s te
sted
with
mod
ifica
tions
are
cou
nted
in th
e fa
r bel
ow b
asic
leve
l fo
r agg
rega
te re
porti
ng a
nd a
ccou
ntab
ility
pur
pose
s.
10..
Perc
ent (
%) C
orre
ct
For t
he S
TS s
ubgr
oup
and
subj
ect,
the
aver
age
perc
ent c
orre
ct o
f all
stud
ents
in th
e su
bgro
up fo
r tha
t sub
grou
p. D
oes
not a
pply
to th
e C
ST,
CA
T/6
Sur
vey,
or C
AP
A.

Part
II Rep
ort D
escri
ption
s | C
hapte
r II.2
Sum
mary
Repo
rts
Aug
ust 2
007
20
07 S
TAR
Pos
t-Tes
t Gui
de
41
© 2
007
by th
e C
alifo
rnia
Dep
artm
ent o
f Edu
catio
n
Des
crip
tions
of S
ubgr
oups
Ta
ble
II.5
Des
crip
tions
of S
ubgr
oups
DES
CR
IPTI
ON
S O
F SU
BG
RO
UPS
SUB
GR
OU
P D
ESC
RIP
TIO
N
All
Stud
ents
CST
s A
ll St
uden
ts
Num
ber o
f stu
dent
s w
ith a
ny a
nsw
er o
n C
ST
ques
tions
.
CA
T/6
All
Stud
ents
N
umbe
r of s
tude
nts
with
any
ans
wer
on
CA
T/6
Sur
vey
ques
tions
.
CA
PA L
evel
I St
uden
ts
Num
ber o
f stu
dent
s w
ith C
AP
A L
evel
I an
swer
doc
umen
ts.
CA
PA L
evel
II S
tude
nts
Num
ber o
f stu
dent
s w
ith C
AP
A L
evel
II a
nsw
er d
ocum
ents
.
CA
PA L
evel
III S
tude
nts
Num
ber o
f stu
dent
s w
ith C
AP
A L
evel
III a
nsw
er d
ocum
ents
.
CA
PA L
evel
IV S
tude
nts
Num
ber o
f stu
dent
s w
ith C
AP
A L
evel
IV a
nsw
er d
ocum
ents
.
CA
PA L
evel
V S
tude
nts
Num
ber o
f stu
dent
s w
ith C
AP
A L
evel
V a
nsw
er d
ocum
ents
.
STS
All
Stud
ents
N
umbe
r of s
tude
nts
with
any
ans
wer
on
STS
que
stio
ns.
Stud
ents
with
Dis
abili
ties
See
Tab
le II
.6 o
n pa
ge 5
4 fo
r des
crip
tions
of p
rimar
y di
sabi
lity
code
s.
• A
utis
m
• D
eafn
ess
• D
eaf-b
lindn
ess
• E
mot
iona
l dis
turb
ance
• H
ard
of h
earin
g •
Men
tal r
etar
datio
n •
Mul
tiple
dis
abilit
ies
• O
rthop
edic
impa
irmen
t •
Oth
er h
ealth
impa
irmen
t •
Spe
cific
lear
ning
dis
abilit
y
• S
peec
h/la
ngua
ge im
pairm
ent
• Tr
aum
atic
bra
in in
jury
•
Vis
ual i
mpa
irmen
t
CST
Stu
dent
s w
ith N
o R
epor
ted
Dis
abili
ties
In th
e P
re-ID
file
or o
n th
e an
swer
doc
umen
t, th
e P
rimar
y D
isab
ility
was
co
ded
000.
CST
Stu
dent
s w
ith D
isab
ilitie
s In
the
Pre
-ID fi
le o
r on
the
answ
er d
ocum
ent,
the
Prim
ary
Dis
abili
ty fi
eld
cont
aine
d a
valid
Prim
ary
Dis
abili
ty c
ode.

Part
II Rep
ort D
escri
ption
s | C
hapte
r II.2
Sum
mary
Repo
rts
42
200
7 S
TAR
Pos
t-Tes
t Gui
de
A
ugus
t 200
7 ©
200
7 by
the
Cal
iforn
ia D
epar
tmen
t of E
duca
tion
DES
CR
IPTI
ON
S O
F SU
BG
RO
UPS
SUB
GR
OU
P D
ESC
RIP
TIO
N
CST
Stu
dent
s w
ith U
nkno
wn
Dis
abili
ty S
tatu
s In
the
Pre
-ID fi
le o
r on
the
answ
er d
ocum
ent,
the
Prim
ary
Dis
abili
ty c
ode
was
bla
nk o
r mul
tiple
resp
onse
s w
ere
give
n, o
r an
inva
lid p
rimar
y di
sabi
lity
code
was
mar
ked.
CA
T/6
Stud
ents
with
No
Rep
orte
d D
isab
ilitie
s In
the
Pre
-ID fi
le o
r on
the
answ
er d
ocum
ent,
Prim
ary
Dis
abili
ty w
as c
oded
00
0.
CA
T/6
Stud
ents
with
Dis
abili
ty
In th
e P
re-ID
file
or o
n th
e an
swer
doc
umen
t, th
e P
rimar
y D
isab
ility
fiel
d co
ntai
ned
a va
lid P
rimar
y D
isab
ility
cod
e.
CA
T/6
Stud
ents
with
Unk
now
n D
isab
ility
In
the
Pre
-ID fi
le o
r on
the
answ
er d
ocum
ent,
Prim
ary
Dis
abili
ty w
as le
ft bl
ank
or a
n in
valid
prim
ary
disa
bilit
y co
de w
as m
arke
d.
CA
PA (b
y C
APA
for e
ach
leve
l and
spe
cific
di
sabi
lity
as li
sted
in T
able
II.6
on
page
54)
In
the
Pre
-ID fi
le o
r on
the
answ
er d
ocum
ent,
the
Prim
ary
Dis
abili
ty fi
eld
cont
aine
d a
valid
Prim
ary
Dis
abili
ty c
ode.
STS
Stud
ents
with
No
Rep
orte
d D
isab
ilitie
s In
the
Pre
-ID fi
le o
r on
the
answ
er d
ocum
ent,
the
Prim
ary
Dis
abili
ty w
as
code
d 00
0.
STS
Stud
ents
with
Dis
abili
ties
In th
e P
re-ID
file
or o
n th
e an
swer
doc
umen
t, th
e P
rimar
y D
isab
ility
fiel
d co
ntai
ned
a va
lid P
rimar
y D
isab
ility
cod
e.
STS
Stud
ents
with
Unk
now
n D
isab
ility
Sta
tus
In th
e P
re-ID
file
or o
n th
e an
swer
doc
umen
t, th
e P
rimar
y D
isab
ility
cod
e w
as b
lank
or m
ultip
le re
spon
ses
wer
e gi
ven,
or a
n in
valid
prim
ary
disa
bilit
y co
de w
as m
arke
d.
Econ
omic
Sta
tus
CST
Stu
dent
s N
ot E
cono
mic
ally
Dis
adva
ntag
ed
The
Nat
iona
l Sch
ool L
unch
Pro
gram
(NS
LP) f
ield
was
cod
ed N
O o
n th
e an
swer
doc
umen
t or i
n th
e P
re-ID
file
, ind
icat
ing
that
the
stud
ent w
as n
ot
parti
cipa
ting
in fr
ee o
r red
uced
pric
e lu
nch,
or t
he P
aren
t Edu
catio
n Le
vel
was
gra
duat
e sc
hool
, col
lege
gra
duat
e, s
ome
colle
ge, h
igh
scho
ol g
radu
ate,
or
dec
lined
to s
tate
.

Part
II Rep
ort D
escri
ption
s | C
hapte
r II.2
Sum
mary
Repo
rts
Aug
ust 2
007
20
07 S
TAR
Pos
t-Tes
t Gui
de
43
© 2
007
by th
e C
alifo
rnia
Dep
artm
ent o
f Edu
catio
n
DES
CR
IPTI
ON
S O
F SU
BG
RO
UPS
SUB
GR
OU
P D
ESC
RIP
TIO
N
CST
Stu
dent
s Ec
onom
ical
ly D
isad
vant
aged
Th
e N
atio
nal S
choo
l Lun
ch P
rogr
am (N
SLP
) fie
ld w
as c
oded
YE
S o
n th
e an
swer
doc
umen
t or i
n th
e P
re-ID
file
, ind
icat
ing
that
the
stud
ent w
as
parti
cipa
ting
in fr
ee o
r red
uced
pric
e lu
nch,
or P
aren
t Edu
catio
n Le
vel w
as
not a
hig
h sc
hool
gra
duat
e.
CST
Stu
dent
s w
ith U
nkno
wn
Econ
omic
Sta
tus
On
the
answ
er d
ocum
ent,
the
Nat
iona
l Sch
ool L
unch
Pro
gram
(NS
LP) w
as
eith
er le
ft bl
ank
or w
as m
arke
d as
bot
h Y
ES
and
NO
and
Par
ent E
duca
tion
Leve
l was
oth
er th
an n
ot a
hig
h sc
hool
gra
duat
e.
or
In th
e P
re-ID
file
, the
NS
LP fi
eld
was
left
blan
k or
con
tain
ed a
n in
valid
cod
e.
CA
T/6
Stud
ents
Not
Eco
nom
ical
ly
Dis
adva
ntag
ed
The
Nat
iona
l Sch
ool L
unch
Pro
gram
(NS
LP) f
ield
was
cod
ed N
O o
n th
e an
swer
doc
umen
t or i
n th
e P
re-ID
file
, ind
icat
ing
that
the
stud
ent w
as n
ot
parti
cipa
ting
in fr
ee o
r red
uced
pric
e lu
nch,
or t
he P
aren
t Edu
catio
n Le
vel
was
gra
duat
e sc
hool
, col
lege
gra
duat
e, s
ome
colle
ge, h
igh
scho
ol g
radu
ate,
or
dec
lined
to s
tate
.
CA
T/6
Stud
ents
Eco
nom
ical
ly D
isad
vant
aged
Th
e N
atio
nal S
choo
l Lun
ch P
rogr
am (N
SLP
) fie
ld w
as c
oded
YE
S o
n th
e an
swer
doc
umen
t or i
n th
e P
re-ID
file
, ind
icat
ing
that
the
stud
ent w
as
parti
cipa
ting
in fr
ee o
r red
uced
pric
e lu
nch,
or P
aren
t Edu
catio
n Le
vel w
as
not a
hig
h sc
hool
gra
duat
e.
CA
T/6
Stud
ents
with
Unk
now
n Ec
onom
ic
Stat
us
On
the
answ
er d
ocum
ent,
the
Nat
iona
l Sch
ool L
unch
Pro
gram
(NS
LP) w
as
eith
er le
ft bl
ank
or w
as m
arke
d as
bot
h Y
ES
and
NO
and
Par
ent E
duca
tion
Leve
l was
oth
er th
an n
ot a
hig
h sc
hool
gra
duat
e.
or
In th
e P
re-ID
file
, the
NS
LP fi
eld
was
left
blan
k or
con
tain
ed a
n in
valid
cod
e.
CA
PA S
tude
nts
(by
CA
PA le
vel)
Not
Ec
onom
ical
ly D
isad
vant
aged
Th
e N
atio
nal S
choo
l Lun
ch P
rogr
am (N
SLP
) fie
ld w
as c
oded
NO
on
the
answ
er d
ocum
ent o
r in
the
Pre
-ID fi
le, i
ndic
atin
g th
at th
e st
uden
t was
not
pa
rtici
patin
g in
free
or r
educ
ed p
rice
lunc
h, o
r the
Par
ent E
duca
tion
Leve
l w
as g
radu
ate
scho
ol, c
olle
ge g
radu
ate,
som
e co
llege
, hig
h sc
hool
gra
duat
e,
or d
eclin
ed to
sta
te.

Part
II Rep
ort D
escri
ption
s | C
hapte
r II.2
Sum
mary
Repo
rts
44
200
7 S
TAR
Pos
t-Tes
t Gui
de
A
ugus
t 200
7 ©
200
7 by
the
Cal
iforn
ia D
epar
tmen
t of E
duca
tion
DES
CR
IPTI
ON
S O
F SU
BG
RO
UPS
SUB
GR
OU
P D
ESC
RIP
TIO
N
CA
PA S
tude
nts
(by
CA
PA le
vel)
Econ
omic
ally
D
isad
vant
aged
Th
e N
atio
nal S
choo
l Lun
ch P
rogr
am (N
SLP
) fie
ld w
as c
oded
YE
S o
n th
e an
swer
doc
umen
t or i
n th
e P
re-ID
file
, ind
icat
ing
that
the
stud
ent w
as
parti
cipa
ting
in fr
ee o
r red
uced
pric
e lu
nch,
or P
aren
t Edu
catio
n Le
vel w
as
not a
hig
h sc
hool
gra
duat
e.
CA
PA S
tude
nts
(by
CA
PA le
vel)
with
Unk
now
n Ec
onom
ic S
tatu
s O
n th
e an
swer
doc
umen
t, th
e N
atio
nal S
choo
l Lun
ch P
rogr
am (N
SLP
) was
ei
ther
left
blan
k or
was
mar
ked
as b
oth
YE
S a
nd N
O a
nd P
aren
t Edu
catio
n Le
vel w
as o
ther
than
not
a h
igh
scho
ol g
radu
ate.
or
In
the
Pre
-ID fi
le, t
he N
SLP
fiel
d w
as le
ft bl
ank
or c
onta
ined
an
inva
lid c
ode.
STS
Stud
ents
Not
Eco
nom
ical
ly D
isad
vant
aged
Th
e N
atio
nal S
choo
l Lun
ch P
rogr
am (N
SLP
) fie
ld w
as c
oded
NO
on
the
answ
er d
ocum
ent o
r in
the
Pre
-ID fi
le, i
ndic
atin
g th
at th
e st
uden
t was
not
pa
rtici
patin
g in
free
or r
educ
ed p
rice
lunc
h, o
r the
Par
ent E
duca
tion
Leve
l w
as g
radu
ate
scho
ol, c
olle
ge g
radu
ate,
som
e co
llege
, hig
h sc
hool
gra
duat
e,
or d
eclin
ed to
sta
te.
STS
Stud
ents
Eco
nom
ical
ly D
isad
vant
aged
Th
e N
atio
nal S
choo
l Lun
ch P
rogr
am (N
SLP
) fie
ld w
as c
oded
YE
S o
n th
e an
swer
doc
umen
t or i
n th
e P
re-ID
file
, ind
icat
ing
that
the
stud
ent w
as
parti
cipa
ting
in fr
ee o
r red
uced
pric
e lu
nch,
or P
aren
t Edu
catio
n Le
vel w
as
not a
hig
h sc
hool
gra
duat
e.
STS
Stud
ents
with
Unk
now
n Ec
onom
ic S
tatu
s O
n th
e an
swer
doc
umen
t, th
e N
atio
nal S
choo
l Lun
ch P
rogr
am (N
SLP
) was
ei
ther
left
blan
k or
was
mar
ked
as b
oth
YE
S a
nd N
O a
nd P
aren
t Edu
catio
n Le
vel w
as o
ther
than
not
a h
igh
scho
ol g
radu
ate.
or
In
the
Pre
-ID fi
le, t
he N
SLP
fiel
d w
as le
ft bl
ank
or c
onta
ined
an
inva
lid c
ode.

Part
II Rep
ort D
escri
ption
s | C
hapte
r II.2
Sum
mary
Repo
rts
Aug
ust 2
007
20
07 S
TAR
Pos
t-Tes
t Gui
de
45
© 2
007
by th
e C
alifo
rnia
Dep
artm
ent o
f Edu
catio
n
DES
CR
IPTI
ON
S O
F SU
BG
RO
UPS
SUB
GR
OU
P D
ESC
RIP
TIO
N
Gen
der
CST
Mal
e St
uden
ts
The
Gen
der f
ield
was
cod
ed M
ale
on th
e an
swer
doc
umen
t or i
n th
e P
re-ID
fil
e.
CST
Fem
ale
Stud
ents
Th
e G
ende
r fie
ld w
as c
oded
Fem
ale
on th
e an
swer
doc
umen
t or i
n th
e P
re-
ID fi
le.
CST
Stu
dent
s w
ith U
nkno
wn
Gen
der
On
the
answ
er d
ocum
ent,
the
Gen
der f
ield
was
eith
er le
ft bl
ank
or w
as
mar
ked
as b
oth
Mal
e an
d Fe
mal
e.
or
In th
e P
re-ID
file
, the
Gen
der f
ield
was
left
blan
k or
con
tain
ed a
n in
valid
co
de.
CA
T/6
Surv
ey M
ale
Stud
ents
Th
e G
ende
r fie
ld w
as c
oded
Mal
e on
the
answ
er d
ocum
ent o
r in
the
Pre
-ID
file.
CA
T/6
Surv
ey F
emal
e St
uden
ts
The
Gen
der f
ield
was
cod
ed F
emal
e on
the
answ
er d
ocum
ent o
r in
the
Pre
-ID
file
.
CA
T/6
Surv
ey S
tude
nts
with
Unk
now
n G
ende
r O
n th
e an
swer
doc
umen
t, th
e G
ende
r fie
ld w
as e
ither
left
blan
k or
was
m
arke
d as
bot
h M
ale
and
Fem
ale.
or
In
the
Pre
-ID fi
le, t
he G
ende
r fie
ld w
as le
ft bl
ank
or c
onta
ined
an
inva
lid
code
.
CA
PA M
ale
Stud
ents
(by
CA
PA le
vel)
The
Gen
der f
ield
was
cod
ed M
ale
on th
e an
swer
doc
umen
t or i
n th
e P
re-ID
fil
e.
CA
PA F
emal
e St
uden
ts (b
y C
APA
leve
l) Th
e G
ende
r fie
ld w
as c
oded
Fem
ale
on th
e an
swer
doc
umen
t or i
n th
e P
re-
ID fi
le.

Part
II Rep
ort D
escri
ption
s | C
hapte
r II.2
Sum
mary
Repo
rts
46
200
7 S
TAR
Pos
t-Tes
t Gui
de
A
ugus
t 200
7 ©
200
7 by
the
Cal
iforn
ia D
epar
tmen
t of E
duca
tion
DES
CR
IPTI
ON
S O
F SU
BG
RO
UPS
SUB
GR
OU
P D
ESC
RIP
TIO
N
CA
PA S
tude
nts
with
Unk
now
n G
ende
r (by
C
APA
leve
l) O
n th
e an
swer
doc
umen
t, th
e G
ende
r fie
ld w
as e
ither
left
blan
k or
was
m
arke
d as
bot
h M
ale
and
Fem
ale.
or
In
the
Pre
-ID fi
le, t
he G
ende
r fie
ld w
as le
ft bl
ank
or c
onta
ined
an
inva
lid
code
.
STS
Mal
e St
uden
ts
The
Gén
ero
field
was
cod
ed M
ascu
lino
on th
e an
swer
doc
umen
t or M
ale
in
the
Pre
-ID fi
le.
STS
Fem
ale
Stud
ents
Th
e G
éner
o fie
ld w
as c
oded
Fem
enin
o on
the
answ
er d
ocum
ent o
r Fem
ale
in th
e P
re-ID
file
.
STS
Stud
ents
with
Unk
now
n G
ende
r O
n th
e an
swer
doc
umen
t, th
e G
éner
o fie
ld w
as e
ither
left
blan
k or
was
m
arke
d as
bot
h M
ascu
lino
and
Fem
enin
o.
or
In th
e P
re-ID
file
, the
Gen
der f
ield
was
left
blan
k or
con
tain
ed a
n in
valid
co
de.
Engl
ish
Prof
icie
ncy
CST
Eng
lish
Onl
y an
d Fl
uent
Eng
lish
Prof
icie
nt
On
the
answ
er d
ocum
ent,
the
stud
ent’s
Eng
lish
Pro
ficie
ncy
field
was
m
arke
d E
nglis
h O
nly,
Initi
ally
–Flu
ent E
nglis
h P
rofic
ient
(I-F
EP),
or
Rec
lass
ified
–Flu
ent E
nglis
h P
rofic
ient
(R-F
EP
). or
In
the
Pre
-ID fi
le, 1
, 2, o
r 4 w
as e
nter
ed in
the
stud
ent’s
Eng
lish
Pro
ficie
ncy
field
.
CST
Eng
lish
Lear
ner
On
the
answ
er d
ocum
ent,
the
Stu
dent
’s E
nglis
h P
rofic
ienc
y fie
ld w
as
mar
ked
Eng
lish
Lear
ner.
or
In th
e P
re-ID
file
, 3 w
as e
nter
ed in
the
Stu
dent
’s E
nglis
h P
rofic
ienc
y fie
ld.

Part
II Rep
ort D
escri
ption
s | C
hapte
r II.2
Sum
mary
Repo
rts
Aug
ust 2
007
20
07 S
TAR
Pos
t-Tes
t Gui
de
47
© 2
007
by th
e C
alifo
rnia
Dep
artm
ent o
f Edu
catio
n
DES
CR
IPTI
ON
S O
F SU
BG
RO
UPS
SUB
GR
OU
P D
ESC
RIP
TIO
N
CST
Eng
lish
Lear
ner L
ess
Than
12
Mon
ths
On
the
answ
er d
ocum
ent,
the
Stu
dent
’s E
nglis
h P
rofic
ienc
y fie
ld w
as
mar
ked
Eng
lish
Lear
ner;
and
Eng
lish
Lear
ner (
EL)
in U
.S. S
choo
ls le
ss th
an
12 m
onth
s w
as a
lso
mar
ked.
or
In
the
Pre
-ID fi
le, t
he s
tude
nt’s
Eng
lish
Pro
ficie
ncy
field
had
a 3
and
Eng
lish
Lear
ner (
EL)
in U
.S. S
choo
ls le
ss th
an 1
2 m
onth
s ha
d a
Y.
CST
Eng
lish
Lear
ner 1
2 M
onth
s or
Mor
e O
n th
e an
swer
doc
umen
t, th
e S
tude
nt’s
Eng
lish
Pro
ficie
ncy
field
was
m
arke
d E
nglis
h Le
arne
r; an
d E
nglis
h Le
arne
r (E
L) in
U.S
. Sch
ools
less
than
12
mon
ths
was
left
blan
k.
or
In th
e P
re-ID
file
, the
Stu
dent
’s E
nglis
h P
rofic
ienc
y fie
ld h
ad a
3 a
nd E
nglis
h Le
arne
r (E
L) in
U.S
. Sch
ools
less
than
12
mon
ths
was
bla
nk.
CST
Stu
dent
s w
ith U
nkno
wn
Flue
ncy
On
the
answ
er d
ocum
ent,
the
Stu
dent
’s E
nglis
h P
rofic
ienc
y fie
ld w
as le
ft bl
ank
or m
ultip
le re
spon
ses
wer
e gi
ven.
or
In
the
Pre
-ID fi
le, t
he S
tude
nt’s
Eng
lish
Pro
ficie
ncy
field
was
bla
nk o
r co
ntai
ned
an in
valid
cod
e.
CA
T/6
Surv
ey E
nglis
h O
nly
and
Flue
nt-E
nglis
h Pr
ofic
ient
O
n th
e an
swer
doc
umen
t, th
e S
tude
nt’s
Eng
lish
Pro
ficie
ncy
field
was
m
arke
d E
nglis
h O
nly,
Initi
ally
–Flu
ent E
nglis
h P
rofic
ient
(I-F
EP),
or
Rec
lass
ified
–Flu
ent E
nglis
h P
rofic
ient
(R-F
EP
). or
In
the
Pre
-ID fi
le, 1
, 2, o
r 4 w
as e
nter
ed in
the
Stu
dent
’s E
nglis
h P
rofic
ienc
y fie
ld.
CA
T/6
Surv
ey E
nglis
h Le
arne
r O
n th
e an
swer
doc
umen
t, th
e S
tude
nt’s
Eng
lish
Pro
ficie
ncy
field
was
m
arke
d E
nglis
h Le
arne
r. or
In
the
Pre
-ID fi
le, 3
was
ent
ered
in th
e S
tude
nt’s
Eng
lish
Pro
ficie
ncy
field
.

Part
II Rep
ort D
escri
ption
s | C
hapte
r II.2
Sum
mary
Repo
rts
48
200
7 S
TAR
Pos
t-Tes
t Gui
de
A
ugus
t 200
7 ©
200
7 by
the
Cal
iforn
ia D
epar
tmen
t of E
duca
tion
DES
CR
IPTI
ON
S O
F SU
BG
RO
UPS
SUB
GR
OU
P D
ESC
RIP
TIO
N
CA
T/6
Surv
ey E
nglis
h Le
arne
r Les
s Th
an 1
2 M
onth
s O
n th
e an
swer
doc
umen
t, th
e S
tude
nt’s
Eng
lish
Pro
ficie
ncy
field
was
m
arke
d E
nglis
h Le
arne
r; an
d E
nglis
h Le
arne
r (E
L) in
U.S
. Sch
ools
less
than
12
mon
ths
was
als
o m
arke
d.
or
In th
e P
re-ID
file
, the
Stu
dent
’s E
nglis
h P
rofic
ienc
y fie
ld h
ad a
3 a
nd E
nglis
h Le
arne
r (E
L) in
U.S
. Sch
ools
less
than
12
mon
ths
had
a Y
.
CA
T/6
Surv
ey E
nglis
h Le
arne
r 12
Mon
ths
or
Mor
e O
n th
e an
swer
doc
umen
t, th
e S
tude
nt’s
Eng
lish
Pro
ficie
ncy
field
was
m
arke
d E
nglis
h Le
arne
r; an
d E
nglis
h Le
arne
r (E
L) in
U.S
. Sch
ools
less
than
12
mon
ths
was
left
blan
k.
or
In th
e P
re-ID
file
, the
Stu
dent
’s E
nglis
h P
rofic
ienc
y fie
ld h
ad a
3 a
nd E
nglis
h Le
arne
r (E
L) in
U.S
. Sch
ools
less
than
12
mon
ths
was
bla
nk.
CA
T/6
Stud
ents
with
Unk
now
n Fl
uenc
y O
n th
e an
swer
doc
umen
t, th
e S
tude
nt’s
Eng
lish
Pro
ficie
ncy
field
was
left
blan
k or
mul
tiple
resp
onse
s w
ere
give
n.
or
In th
e P
re-ID
file
, the
Stu
dent
’s E
nglis
h P
rofic
ienc
y fie
ld w
as b
lank
or
cont
aine
d an
inva
lid c
ode.
CA
PA (b
y C
APA
leve
l) En
glis
h O
nly
and
Flue
nt-
Engl
ish
Prof
icie
nt
On
the
answ
er d
ocum
ent,
the
Stu
dent
’s E
nglis
h P
rofic
ienc
y fie
ld w
as
mar
ked
Eng
lish
Onl
y, In
itial
ly–F
luen
t Eng
lish
Pro
ficie
nt (I
-FEP
), or
R
ecla
ssifi
ed–F
luen
t Eng
lish
Pro
ficie
nt (R
-FE
P).
or
In th
e P
re-ID
file
, 1, 2
, or 4
was
ent
ered
in th
e S
tude
nt’s
Eng
lish
Pro
ficie
ncy
field
.
CA
PA (b
y C
APA
leve
l) En
glis
h Le
arne
r O
n th
e an
swer
doc
umen
t, th
e S
tude
nt’s
Eng
lish
Pro
ficie
ncy
field
was
m
arke
d E
nglis
h Le
arne
r. or
In
the
Pre
-ID fi
le, 3
was
ent
ered
in th
e S
tude
nt’s
Eng
lish
Pro
ficie
ncy
field
.

Part
II Rep
ort D
escri
ption
s | C
hapte
r II.2
Sum
mary
Repo
rts
Aug
ust 2
007
20
07 S
TAR
Pos
t-Tes
t Gui
de
49
© 2
007
by th
e C
alifo
rnia
Dep
artm
ent o
f Edu
catio
n
DES
CR
IPTI
ON
S O
F SU
BG
RO
UPS
SUB
GR
OU
P D
ESC
RIP
TIO
N
CA
PA (b
y C
APA
leve
l) En
glis
h Le
arne
r Les
s Th
an 1
2 M
onth
s O
n th
e an
swer
doc
umen
t, th
e S
tude
nt’s
Eng
lish
Pro
ficie
ncy
field
was
m
arke
d E
nglis
h Le
arne
r; an
d E
nglis
h Le
arne
r (E
L) in
U.S
. Sch
ools
less
than
12
mon
ths
was
als
o m
arke
d.
or
In th
e P
re-ID
file
, the
Stu
dent
’s E
nglis
h P
rofic
ienc
y fie
ld h
ad a
3 a
nd E
nglis
h Le
arne
r (E
L) in
U.S
. Sch
ools
less
than
12
mon
ths
had
a Y
.
CA
PA (b
y C
APA
leve
l) En
glis
h Le
arne
r 12
Mon
ths
or M
ore
On
the
answ
er d
ocum
ent,
the
Stu
dent
’s E
nglis
h P
rofic
ienc
y fie
ld w
as
mar
ked
Eng
lish
Lear
ner a
nd E
nglis
h Le
arne
r (E
L) in
U.S
. Sch
ools
less
than
12
mon
ths
was
left
blan
k.
or
In th
e P
re-ID
file
, the
Stu
dent
’s E
nglis
h P
rofic
ienc
y fie
ld h
ad a
3 a
nd E
nglis
h Le
arne
r (E
L) in
U.S
. Sch
ools
less
than
12
mon
ths
was
bla
nk.
CA
PA S
tude
nts
(by
CA
PA le
vel)
with
Unk
now
n Fl
uenc
y O
n th
e an
swer
doc
umen
t, th
e S
tude
nt’s
Eng
lish
Pro
ficie
ncy
field
was
left
blan
k or
mul
tiple
resp
onse
s w
ere
give
n.
or
In th
e P
re-ID
file
, the
Stu
dent
’s E
nglis
h P
rofic
ienc
y fie
ld w
as b
lank
or
cont
aine
d an
inva
lid c
ode.
STS
Engl
ish
Lear
ner
On
the
answ
er d
ocum
ent,
the
Stu
dent
’s E
nglis
h P
rofic
ienc
y fie
ld w
as
mar
ked
Eng
lish
Lear
ner.
or
In th
e P
re-ID
file
, 3 w
as e
nter
ed in
the
Stu
dent
’s E
nglis
h P
rofic
ienc
y fie
ld.
STS
Engl
ish
Lear
ner L
ess
Than
12
Mon
ths
On
the
answ
er d
ocum
ent,
the
Stu
dent
’s E
nglis
h P
rofic
ienc
y fie
ld w
as
mar
ked
Eng
lish
Lear
ner;
and
Eng
lish
Lear
ner (
EL)
in U
.S. S
choo
ls le
ss th
an
12 m
onth
s w
as a
lso
mar
ked.
or
In
the
Pre
-ID fi
le, t
he s
tude
nt’s
Eng
lish
Pro
ficie
ncy
field
had
a 3
and
Eng
lish
Lear
ner (
EL)
in U
.S. S
choo
ls le
ss th
an 1
2 m
onth
s ha
d a
Y.
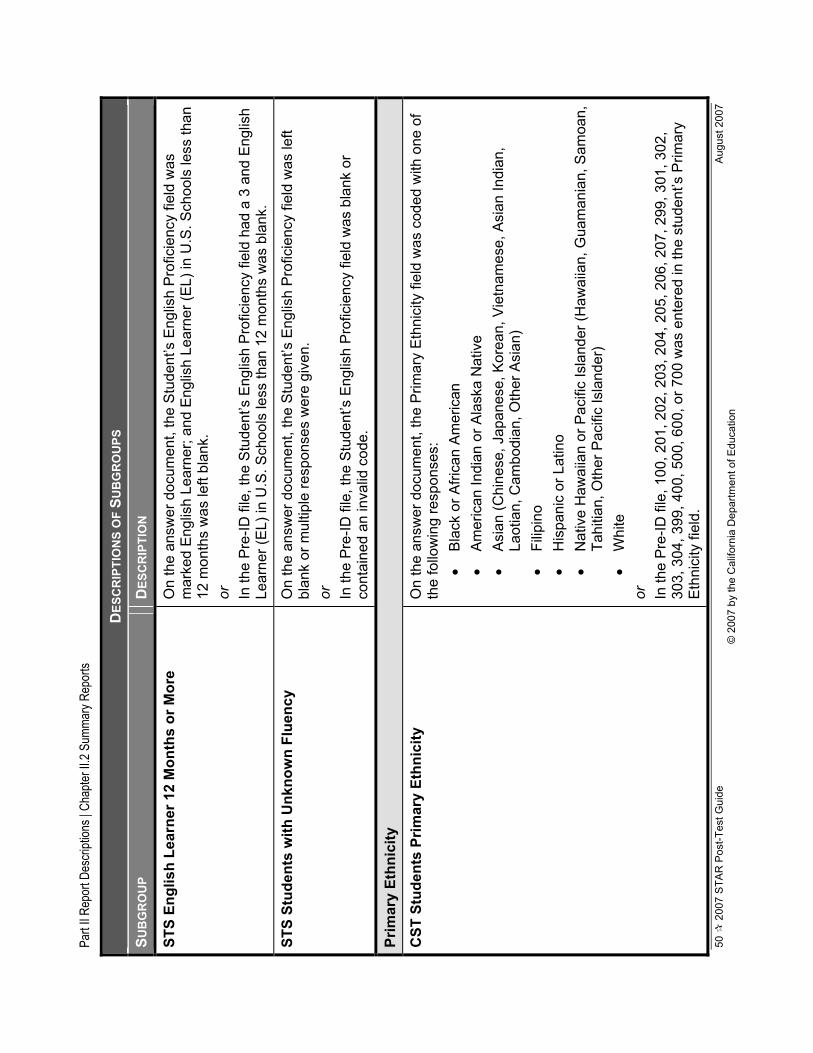
Part
II Rep
ort D
escri
ption
s | C
hapte
r II.2
Sum
mary
Repo
rts
50
200
7 S
TAR
Pos
t-Tes
t Gui
de
A
ugus
t 200
7 ©
200
7 by
the
Cal
iforn
ia D
epar
tmen
t of E
duca
tion
DES
CR
IPTI
ON
S O
F SU
BG
RO
UPS
SUB
GR
OU
P D
ESC
RIP
TIO
N
STS
Engl
ish
Lear
ner 1
2 M
onth
s or
Mor
e O
n th
e an
swer
doc
umen
t, th
e S
tude
nt’s
Eng
lish
Pro
ficie
ncy
field
was
m
arke
d E
nglis
h Le
arne
r; an
d E
nglis
h Le
arne
r (E
L) in
U.S
. Sch
ools
less
than
12
mon
ths
was
left
blan
k.
or
In th
e P
re-ID
file
, the
Stu
dent
’s E
nglis
h P
rofic
ienc
y fie
ld h
ad a
3 a
nd E
nglis
h Le
arne
r (E
L) in
U.S
. Sch
ools
less
than
12
mon
ths
was
bla
nk.
STS
Stud
ents
with
Unk
now
n Fl
uenc
y O
n th
e an
swer
doc
umen
t, th
e S
tude
nt’s
Eng
lish
Pro
ficie
ncy
field
was
left
blan
k or
mul
tiple
resp
onse
s w
ere
give
n.
or
In th
e P
re-ID
file
, the
Stu
dent
’s E
nglis
h P
rofic
ienc
y fie
ld w
as b
lank
or
cont
aine
d an
inva
lid c
ode.
Prim
ary
Ethn
icity
CST
Stu
dent
s Pr
imar
y Et
hnic
ity
On
the
answ
er d
ocum
ent,
the
Prim
ary
Eth
nici
ty fi
eld
was
cod
ed w
ith o
ne o
f th
e fo
llow
ing
resp
onse
s:
• B
lack
or A
frica
n A
mer
ican
•
Am
eric
an In
dian
or A
lask
a N
ativ
e •
Asi
an (C
hine
se, J
apan
ese,
Kor
ean,
Vie
tnam
ese,
Asi
an In
dian
, La
otia
n, C
ambo
dian
, Oth
er A
sian
) •
Filip
ino
• H
ispa
nic
or L
atin
o •
Nat
ive
Haw
aiia
n or
Pac
ific
Isla
nder
(Haw
aiia
n, G
uam
ania
n, S
amoa
n,
Tahi
tian,
Oth
er P
acifi
c Is
land
er)
• W
hite
or
In
the
Pre
-ID fi
le, 1
00, 2
01, 2
02, 2
03, 2
04, 2
05, 2
06, 2
07, 2
99, 3
01, 3
02,
303,
304
, 399
, 400
, 500
, 600
, or 7
00 w
as e
nter
ed in
the
stud
ent’s
Prim
ary
Eth
nici
ty fi
eld.

Part
II Rep
ort D
escri
ption
s | C
hapte
r II.2
Sum
mary
Repo
rts
Aug
ust 2
007
20
07 S
TAR
Pos
t-Tes
t Gui
de
51
© 2
007
by th
e C
alifo
rnia
Dep
artm
ent o
f Edu
catio
n
DES
CR
IPTI
ON
S O
F SU
BG
RO
UPS
SUB
GR
OU
P D
ESC
RIP
TIO
N
CST
Stu
dent
s D
eclin
ed to
Sta
te P
rimar
y Et
hnic
ity
On
the
answ
er d
ocum
ent,
the
Prim
ary
Eth
nici
ty fi
eld
was
mar
ked
Dec
lined
to
Sta
te.
or
999
was
ent
ered
in th
e st
uden
t’s P
rimar
y E
thni
city
fiel
d.
CST
Stu
dent
s U
nkno
wn
Prim
ary
Ethn
icity
O
n th
e an
swer
doc
umen
t, th
e P
rimar
y E
thni
city
fiel
d w
as le
ft bl
ank
or
mul
tiple
resp
onse
s w
ere
give
n.
or
In th
e P
re-ID
file
, the
Prim
ary
Eth
nici
ty fi
eld
was
bla
nk o
r con
tain
ed a
n in
valid
cod
e.
CA
T/6
Stud
ents
Prim
ary
Ethn
icity
O
n th
e an
swer
doc
umen
t, th
e P
rimar
y E
thni
city
fiel
d w
as c
oded
with
one
of
the
follo
win
g re
spon
ses:
•
Bla
ck o
r Afri
can
Am
eric
an
• A
mer
ican
Indi
an o
r Ala
ska
Nat
ive
• A
sian
(Chi
nese
, Jap
anes
e, K
orea
n, V
ietn
ames
e, A
sian
Indi
an,
Laot
ian,
Cam
bodi
an, O
ther
Asi
an)
• Fi
lipin
o •
His
pani
c or
Lat
ino
• N
ativ
e H
awai
ian
or P
acifi
c Is
land
er (H
awai
ian,
Gua
man
ian,
Sam
oan,
Ta
hitia
n, O
ther
Pac
ific
Isla
nder
) •
Whi
te
or
In th
e P
re-ID
file
, 100
, 201
, 202
, 203
, 204
, 205
, 206
, 207
, 299
, 301
, 302
, 30
3, 3
04, 3
99, 4
00, 5
00, 6
00, o
r 700
was
ent
ered
in th
e st
uden
t’s P
rimar
y E
thni
city
fiel
d.

Part
II Rep
ort D
escri
ption
s | C
hapte
r II.2
Sum
mary
Repo
rts
52
200
7 S
TAR
Pos
t-Tes
t Gui
de
A
ugus
t 200
7 ©
200
7 by
the
Cal
iforn
ia D
epar
tmen
t of E
duca
tion
DES
CR
IPTI
ON
S O
F SU
BG
RO
UPS
SUB
GR
OU
P D
ESC
RIP
TIO
N
CA
T/6
Stud
ents
Dec
lined
to S
tate
Prim
ary
Ethn
icity
O
n th
e an
swer
doc
umen
t, th
e P
rimar
y E
thni
city
fiel
d w
as m
arke
d D
eclin
ed
to S
tate
. or
99
9 w
as e
nter
ed in
the
stud
ent’s
Prim
ary
Eth
nici
ty fi
eld.
CA
T/6
Stud
ents
Unk
now
n Pr
imar
y Et
hnic
ity
On
the
answ
er d
ocum
ent,
the
Prim
ary
Eth
nici
ty fi
eld
was
left
blan
k or
m
ultip
le re
spon
ses
wer
e gi
ven.
or
In
the
Pre
-ID fi
le, t
he P
rimar
y E
thni
city
fiel
d w
as b
lank
or c
onta
ined
an
inva
lid c
ode.
CA
PA S
tude
nts
Prim
ary
Ethn
icity
O
n th
e an
swer
doc
umen
t, th
e P
rimar
y E
thni
city
fiel
d w
as c
oded
with
one
of
the
follo
win
g re
spon
ses:
•
Bla
ck o
r Afri
can
Am
eric
an
• A
mer
ican
Indi
an o
r Ala
ska
Nat
ive
• A
sian
(Chi
nese
, Jap
anes
e, K
orea
n, V
ietn
ames
e, A
sian
Indi
an,
Laot
ian,
Cam
bodi
an, O
ther
Asi
an)
• Fi
lipin
o •
His
pani
c or
Lat
ino
• N
ativ
e H
awai
ian
or P
acifi
c Is
land
er (H
awai
ian,
Gua
man
ian,
Sam
oan,
Ta
hitia
n, O
ther
Pac
ific
Isla
nder
) •
Whi
te
or
In th
e P
re-ID
file
, 100
, 201
, 202
, 203
, 204
, 205
, 206
, 207
, 299
, 301
, 302
, 30
3, 3
04, 3
99, 4
00, 5
00, 6
00, o
r 700
was
ent
ered
in th
e st
uden
t’s P
rimar
y E
thni
city
fiel
d.

Part
II Rep
ort D
escri
ption
s | C
hapte
r II.2
Sum
mary
Repo
rts
Aug
ust 2
007
20
07 S
TAR
Pos
t-Tes
t Gui
de
53
© 2
007
by th
e C
alifo
rnia
Dep
artm
ent o
f Edu
catio
n
DES
CR
IPTI
ON
S O
F SU
BG
RO
UPS
SUB
GR
OU
P D
ESC
RIP
TIO
N
CA
PA S
tude
nts
Dec
lined
to S
tate
Prim
ary
Ethn
icity
O
n th
e an
swer
doc
umen
t, th
e P
rimar
y E
thni
city
fiel
d w
as m
arke
d D
eclin
ed
to S
tate
. or
99
9 w
as e
nter
ed in
the
stud
ent’s
Prim
ary
Eth
nici
ty fi
eld.
CA
PA S
tude
nts
Unk
now
n Pr
imar
y Et
hnic
ity
On
the
answ
er d
ocum
ent,
the
Prim
ary
Eth
nici
ty fi
eld
was
left
blan
k or
m
ultip
le re
spon
ses
wer
e gi
ven.
or
In
the
Pre
-ID fi
le, t
he P
rimar
y E
thni
city
fiel
d w
as b
lank
or c
onta
ined
an
inva
lid c
ode.
STS
Stud
ents
Prim
ary
Ethn
icity
O
n th
e an
swer
doc
umen
t, th
e Id
entid
ad é
tnic
a fie
ld w
as c
oded
with
one
of
the
follo
win
g re
spon
ses:
•
afric
ano
amer
ican
o •
indi
o de
Am
éric
a, n
ativ
o de
Ala
ska:
•
asiá
tico
(chi
no, j
apon
és, c
orea
no, v
ietn
amita
, ind
io a
siát
ico,
la
osia
no, c
ambo
yano
, otro
asi
átic
o)
• fil
ipin
o •
hisp
ano
o la
tino
• na
tivo
haw
aian
o o
isle
ño p
acífi
co (n
ativ
o ha
wai
ano,
nat
ivo
de G
uam
, sa
moa
no, t
ahiti
ano,
otro
isle
ño p
acífi
co)
• bl
anco
or
In
the
Pre
-ID fi
le, 1
00, 2
01, 2
02, 2
03, 2
04, 2
05, 2
06, 2
07, 2
99, 3
01, 3
02,
303,
304
, 399
, 400
, 500
, 600
, or 7
00 w
as e
nter
ed in
the
stud
ent’s
Prim
ary
Eth
nici
ty fi
eld.

Part
II Rep
ort D
escri
ption
s | C
hapte
r II.2
Sum
mary
Repo
rts
54
200
7 S
TAR
Pos
t-Tes
t Gui
de
A
ugus
t 200
7 ©
200
7 by
the
Cal
iforn
ia D
epar
tmen
t of E
duca
tion
DES
CR
IPTI
ON
S O
F SU
BG
RO
UPS
SUB
GR
OU
P D
ESC
RIP
TIO
N
STS
Stud
ents
Dec
lined
to S
tate
Prim
ary
Ethn
icity
O
n th
e an
swer
doc
umen
t, th
e Id
entid
ad é
tnic
a fie
ld w
as m
arke
d D
ecid
ió n
o re
spon
der.
or
In th
e P
re-ID
file
, 999
was
ent
ered
in th
e st
uden
t’s P
rimar
y E
thni
city
fiel
d.
STS
Stud
ents
Unk
now
n Pr
imar
y Et
hnic
ity
On
the
answ
er d
ocum
ent,
the
Iden
tidad
étn
ica
field
was
left
blan
k or
m
ultip
le re
spon
ses
wer
e gi
ven.
or
In
the
Pre
-ID fi
le, t
he P
rimar
y E
thni
city
fiel
d w
as b
lank
or c
onta
ined
an
inva
lid c
ode.
Ta
ble
II.6
Prim
ary
Dis
abili
ty C
odes
for S
prin
g 20
07 A
dmin
istr
atio
n
Cod
e D
isab
ility
D
efin
ition
010
Men
tal R
etar
datio
n (M
R)
Men
tal R
etar
datio
n m
eans
sig
nific
antly
sub
aver
age
gene
ral i
ntel
lect
ual f
unct
ioni
ng
exis
ting
conc
urre
ntly
with
def
icits
in a
dapt
ive
beha
vior
, and
man
ifest
ed d
urin
g th
e de
velo
pmen
tal p
erio
d, w
hich
adv
erse
ly a
ffect
s a
child
’s e
duca
tiona
l per
form
ance
.
020
Har
d of
Hea
ring
(HH
) H
ard
of H
earin
g m
eans
a h
earin
g im
pairm
ent,
whe
ther
per
man
ent o
r flu
ctua
ting,
w
hich
adv
erse
ly a
ffect
s a
child
’s e
duca
tiona
l per
form
ance
but
whi
ch is
not
incl
uded
un
der t
he d
efin
ition
of “
deaf
” in
this
sec
tion.
030
Dea
fnes
s (D
EA
F)
Dea
fnes
s m
eans
a h
earin
g im
pairm
ent w
hich
is s
o se
vere
that
the
child
is im
paire
d in
pr
oces
sing
ling
uist
ic in
form
atio
n th
roug
h le
arni
ng, w
ith o
r with
out a
mpl
ifica
tion,
whi
ch
adve
rsel
y af
fect
s ed
ucat
iona
l per
form
ance
.
040
Spe
ech
or L
angu
age
Impa
irmen
t S
peec
h an
d La
ngua
ge Im
pairm
ent m
eans
a c
omm
unic
atio
n di
sord
er s
uch
as
stut
terin
g, im
paire
d ar
ticul
atio
n, la
ngua
ge im
pairm
ent,
or a
voi
ce im
pairm
ent,
whi
ch
adve
rsel
y af
fect
s a
child
’s e
duca
tiona
l per
form
ance
.
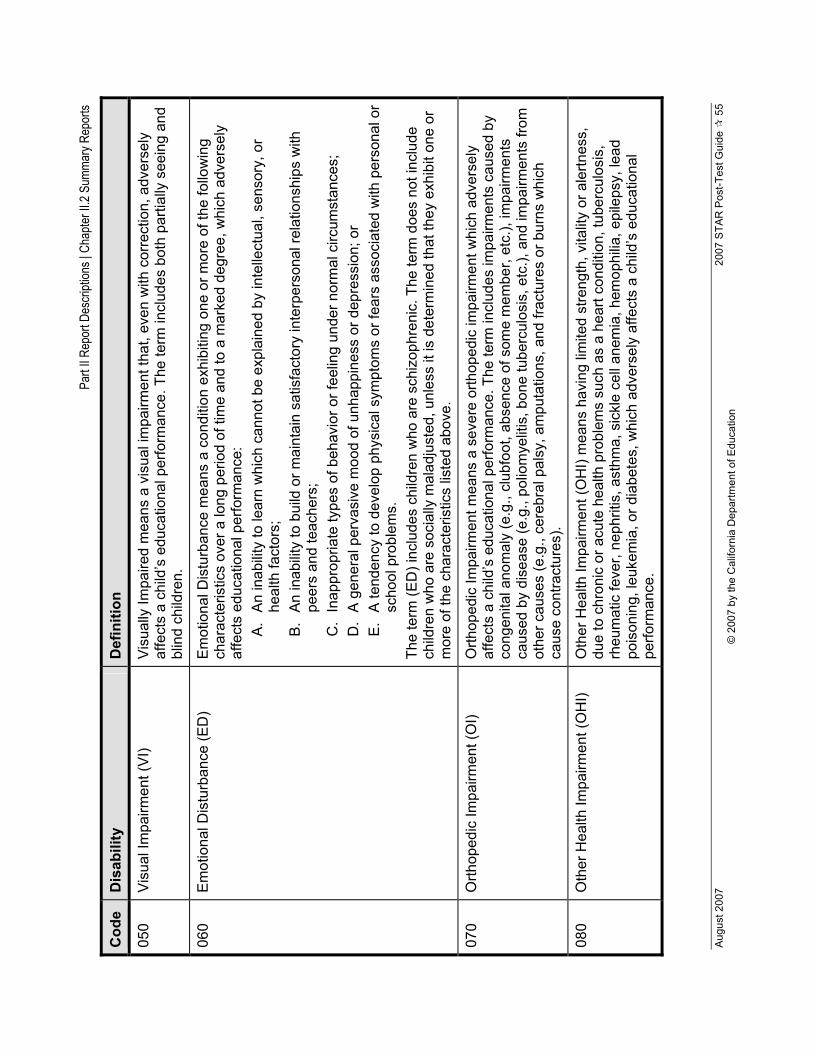
Part
II Rep
ort D
escri
ption
s | C
hapte
r II.2
Sum
mary
Repo
rts
Aug
ust 2
007
20
07 S
TAR
Pos
t-Tes
t Gui
de
55
© 2
007
by th
e C
alifo
rnia
Dep
artm
ent o
f Edu
catio
n
Cod
e D
isab
ility
D
efin
ition
050
Vis
ual I
mpa
irmen
t (V
I) V
isua
lly Im
paire
d m
eans
a v
isua
l im
pairm
ent t
hat,
even
with
cor
rect
ion,
adv
erse
ly
affe
cts
a ch
ild’s
edu
catio
nal p
erfo
rman
ce. T
he te
rm in
clud
es b
oth
parti
ally
see
ing
and
blin
d ch
ildre
n.
060
Em
otio
nal D
istu
rban
ce (E
D)
Em
otio
nal D
istu
rban
ce m
eans
a c
ondi
tion
exhi
bitin
g on
e or
mor
e of
the
follo
win
g ch
arac
teris
tics
over
a lo
ng p
erio
d of
tim
e an
d to
a m
arke
d de
gree
, whi
ch a
dver
sely
af
fect
s ed
ucat
iona
l per
form
ance
: A
. A
n in
abili
ty to
lear
n w
hich
can
not b
e ex
plai
ned
by in
telle
ctua
l, se
nsor
y, o
r he
alth
fact
ors;
B
. A
n in
abili
ty to
bui
ld o
r mai
ntai
n sa
tisfa
ctor
y in
terp
erso
nal r
elat
ions
hips
with
pe
ers
and
teac
hers
; C
. In
appr
opria
te ty
pes
of b
ehav
ior o
r fee
ling
unde
r nor
mal
circ
umst
ance
s;
D.
A g
ener
al p
erva
sive
moo
d of
unh
appi
ness
or d
epre
ssio
n; o
r E
. A
tend
ency
to d
evel
op p
hysi
cal s
ympt
oms
or fe
ars
asso
ciat
ed w
ith p
erso
nal o
r sc
hool
pro
blem
s.
The
term
(ED
) inc
lude
s ch
ildre
n w
ho a
re s
chiz
ophr
enic
. The
term
doe
s no
t inc
lude
ch
ildre
n w
ho a
re s
ocia
lly m
alad
just
ed, u
nles
s it
is d
eter
min
ed th
at th
ey e
xhib
it on
e or
m
ore
of th
e ch
arac
teris
tics
liste
d ab
ove.
070
Orth
oped
ic Im
pairm
ent (
OI)
Orth
oped
ic Im
pairm
ent m
eans
a s
ever
e or
thop
edic
impa
irmen
t whi
ch a
dver
sely
af
fect
s a
child
’s e
duca
tiona
l per
form
ance
. The
term
incl
udes
impa
irmen
ts c
ause
d by
co
ngen
ital a
nom
aly
(e.g
., cl
ubfo
ot, a
bsen
ce o
f som
e m
embe
r, et
c.),
impa
irmen
ts
caus
ed b
y di
seas
e (e
.g.,
polio
mye
litis
, bon
e tu
berc
ulos
is, e
tc.),
and
impa
irmen
ts fr
om
othe
r cau
ses
(e.g
., ce
rebr
al p
alsy
, am
puta
tions
, and
frac
ture
s or
bur
ns w
hich
ca
use
cont
ract
ures
).
080
Oth
er H
ealth
Impa
irmen
t (O
HI)
Oth
er H
ealth
Impa
irmen
t (O
HI)
mea
ns h
avin
g lim
ited
stre
ngth
, vita
lity
or a
lertn
ess,
du
e to
chr
onic
or a
cute
hea
lth p
robl
ems
such
as
a he
art c
ondi
tion,
tube
rcul
osis
, rh
eum
atic
feve
r, ne
phrit
is, a
sthm
a, s
ickl
e ce
ll an
emia
, hem
ophi
lia, e
pile
psy,
lead
po
ison
ing,
leuk
emia
, or d
iabe
tes,
whi
ch a
dver
sely
affe
cts
a ch
ild’s
edu
catio
nal
perfo
rman
ce.

Part
II Rep
ort D
escri
ption
s | C
hapte
r II.2
Sum
mary
Repo
rts
56
200
7 S
TAR
Pos
t-Tes
t Gui
de
A
ugus
t 200
7 ©
200
7 by
the
Cal
iforn
ia D
epar
tmen
t of E
duca
tion
Cod
e D
isab
ility
D
efin
ition
090
Spe
cific
Lea
rnin
g D
isab
ility
(SLD
) S
peci
fic L
earn
ing
Dis
abili
ty m
eans
a d
isor
der i
n on
e or
mor
e of
the
basi
c ps
ycho
logi
cal p
roce
sses
invo
lved
in u
nder
stan
ding
or i
n us
ing
lang
uage
, spo
ken
or
writ
ten,
whi
ch m
ay m
anife
st it
self
in a
n im
perfe
ct a
bilit
y to
list
en, t
hink
, spe
ak, r
ead,
w
rite,
spe
ll, o
r to
do m
athe
mat
ical
cal
cula
tions
. The
term
incl
udes
suc
h co
nditi
ons
as
perc
eptu
al h
andi
caps
, bra
in in
jury
, min
imal
bra
in d
ysfu
nctio
n, d
ysle
xia,
and
de
velo
pmen
tal a
phas
ia. T
he te
rm d
oes
not i
nclu
de c
hild
ren
who
hav
e le
arni
ng
prob
lem
s th
at a
re p
rimar
ily th
e re
sult
of v
isua
l, he
arin
g, o
r mot
or h
andi
caps
, of m
enta
l re
tard
atio
n, o
f em
otio
nal d
istu
rban
ce, o
r of e
nviro
nmen
tal,
cultu
ral,
or e
cono
mic
di
sadv
anta
ge.
100
Dea
f-Blin
dnes
s (D
B)
Dea
f-Blin
dnes
s m
eans
con
com
itant
hea
ring
and
visu
al im
pairm
ents
, the
com
bina
tion
of w
hich
cau
ses
such
sev
ere
com
mun
icat
ion
and
othe
r dev
elop
men
tal a
nd
educ
atio
nal p
robl
ems
that
they
can
not b
e ac
com
mod
ated
in s
peci
al e
duca
tion
prog
ram
s so
lely
for d
eaf o
r blin
d ch
ildre
n.
110
Mul
tiple
Dis
abili
ties
(MD
) M
ultip
le D
isab
ilitie
s m
eans
con
com
itant
impa
irmen
ts (s
uch
as m
enta
l ret
arda
tion,
bl
indn
ess,
orth
oped
ic im
pairm
ent,
etc.
) the
com
bina
tion
of w
hich
cau
ses
such
sev
ere
educ
atio
nal p
robl
ems
that
they
can
not b
e ac
com
mod
ated
in s
peci
al e
duca
tion
prog
ram
s so
lely
for o
ne o
f the
impa
irmen
ts. T
he te
rm d
oes
not i
nclu
de d
eaf-b
lind
child
ren.
120
Aut
ism
(AU
T)
Aut
ism
mea
ns a
dev
elop
men
tal d
isab
ility
sig
nific
antly
affe
ctin
g ve
rbal
and
non
-ver
bal
com
mun
icat
ion
and
soci
al in
tera
ctio
n, g
ener
ally
evi
dent
bef
ore
age
thre
e, th
at
adve
rsel
y af
fect
s ed
ucat
iona
l per
form
ance
. Cha
ract
eris
tics
of a
utis
m in
clud
e:
irreg
ular
ities
and
impa
irmen
ts in
com
mun
icat
ion,
eng
agem
ent i
n re
petit
ive
activ
ities
an
d st
ereo
type
d m
ovem
ents
, res
ista
nce
to e
nviro
nmen
tal c
hang
e or
cha
nge
in d
aily
ro
utin
es, a
nd u
nusu
al re
spon
ses
to s
enso
ry e
xper
ienc
es. T
he te
rm d
oes
not i
nclu
de
child
ren
with
cha
ract
eris
tics
of th
e di
sabi
lity
serio
us e
mot
iona
l dis
turb
ance
(SE
D).
If a
child
man
ifest
s ch
arac
teris
tics
of th
e di
sabi
lity
cate
gory
“aut
ism
” afte
r age
thre
e, th
at
child
stil
l cou
ld b
e di
agno
sed
as h
avin
g “a
utis
m” i
f the
crit
eria
in th
e ab
ove
para
grap
h ar
e sa
tisfie
d.

Part
II Rep
ort D
escri
ption
s | C
hapte
r II.2
Sum
mary
Repo
rts
Aug
ust 2
007
20
07 S
TAR
Pos
t-Tes
t Gui
de
57
© 2
007
by th
e C
alifo
rnia
Dep
artm
ent o
f Edu
catio
n
Cod
e D
isab
ility
D
efin
ition
130
Trau
mat
ic B
rain
Inju
ry (T
BI)
Trau
mat
ic B
rain
Inju
ry m
eans
an
inju
ry to
the
brai
n ca
used
by
an e
xter
nal p
hysi
cal
forc
e or
by
an in
tern
al o
ccur
renc
e su
ch a
s st
roke
or a
neur
ysm
, res
ultin
g in
tota
l or
parti
al fu
nctio
nal d
isab
ility
or p
sych
osoc
ial m
alad
just
men
t tha
t adv
erse
ly a
ffect
s ed
ucat
iona
l per
form
ance
. The
term
incl
udes
ope
n or
clo
sed
head
inju
ries
resu
lting
in
mild
, mod
erat
e, o
r sev
ere
impa
irmen
ts in
one
or m
ore
area
s, in
clud
ing
cogn
ition
; la
ngua
ge m
emor
y; a
ttent
ion;
reas
onin
g; a
bstra
ct th
inki
ng; j
udgm
ent;
prob
lem
-sol
ving
; se
nsor
y, p
erce
ptua
l and
mot
or a
bilit
ies;
psy
chos
ocia
l beh
avio
r; ph
ysic
al fu
nctio
ns;
info
rmat
ion
proc
essi
ng; a
nd s
peec
h. T
he te
rm d
oes
not i
nclu
de b
rain
inju
ries
that
are
co
ngen
ital o
r deg
ener
ativ
e, o
r bra
in in
jurie
s in
duce
d by
birt
h tra
uma.

Part II Report Descriptions | Chapter II.2 Summary Reports | STAR Group Summary: CAT/6 Survey
58 2007 STAR Post-Test Guide August 2007 © 2007 by the California Department of Education
STAR Group Summary: CAT/6 Survey
Purpose To summarize the Student Master List information for the CAT/6 Survey tests, only administered to students taking the grade 3 and grade 7 tests.
Format Summary of student performance on the tests in the CAT/6 Survey battery. Includes performance within national percentile rank ranges. A graph showing the percentile rank for a hypothetical average student is presented.
Action Test site coordinators and school administrators should review for accuracy and completeness and use these results for reporting schoolwide results to school staff and the public.
Focus CAT/6 Survey results for the school or district.

Part
II Rep
ort D
escri
ption
s | C
hapte
r II.2
Sum
mary
Repo
rts | S
TAR
Grou
p Sum
mary:
CAT
/6 Su
rvey
Aug
ust 2
007
20
07 S
TAR
Pos
t-Tes
t Gui
de
59
© 2
007
by th
e C
alifo
rnia
Dep
artm
ent o
f Edu
catio
n
Gro
up S
umm
ary
Sam
ple
1.
Num
ber
Enro
lled
3.
Per
cent
Tes
ted
5.
Per
cent
Val
id S
core
s
8.
Mea
n N
CE
2.
Num
ber T
este
d 4
. N
umbe
r Val
id S
core
s
7.
Nat
iona
l PR
-S
11.
Per
cent
Sco
ring
(Qua
rtile
s)
10.
Scal
e Sc
ore
Stan
dard
D
evia
tion
9.
Scal
e Sc
ore
Mea
n
12.
Per
cent
Sco
ring
(Fift
hs)
13.
Nat
iona
l Per
cent
ile R
ank
6.
Num
ber T
este
d w
/Sco
res

Part
II Rep
ort D
escri
ption
s | C
hapte
r II.2
Sum
mary
Repo
rts
60
200
7 S
TAR
Pos
t-Tes
t Gui
de
A
ugus
t 200
7 ©
200
7 by
the
Cal
iforn
ia D
epar
tmen
t of E
duca
tion
Tabl
e II.
7 ST
AR
Gro
up S
umm
ary:
CA
T/6
Surv
ey D
escr
iptio
ns
1..
Num
ber E
nrol
led
For t
he s
ubje
ct, n
umbe
r of m
ultip
le-c
hoic
e an
swer
doc
umen
ts s
ubm
itted
, min
us th
e nu
mbe
r of
answ
er d
ocum
ents
cod
ed th
at s
tude
nt e
nrol
led
afte
r the
firs
t day
and
was
test
ed.
2..
Num
ber T
este
d Fo
r the
sub
ject
, num
ber o
f thi
rd o
r sev
enth
gra
de s
tude
nts
that
resp
onde
d to
any
que
stio
ns o
n th
e te
st o
r who
se a
nsw
er d
ocum
ents
wer
e co
ded
for t
este
d bu
t mar
ked
no a
nsw
ers.
3..
Perc
ent T
este
d Fo
r the
sub
ject
, num
ber o
f stu
dent
s te
sted
, div
ided
by
the
num
ber o
f stu
dent
s en
rolle
d,
mul
tiplie
d by
100
, and
roun
ded
to th
e ne
ares
t ten
th. [
(Num
ber T
este
d / N
umbe
r Enr
olle
d) *
100
, ro
unde
d to
nea
rest
tent
h]
4..
Num
ber V
alid
Sco
res
For t
he s
ubje
ct, n
umbe
r of s
tude
nts
that
rece
ived
a s
cale
sco
re, p
erce
ntile
, sta
nine
, and
nor
mal
cu
rve
equi
vale
nt. F
or a
ggre
gate
repo
rting
and
acc
ount
abili
ty p
urpo
ses,
this
num
ber d
oes
not
incl
ude:
•
inco
mpl
ete
test
s •
test
s ta
ken
with
mod
ifica
tions
•
stud
ents
with
inco
nsis
tent
gra
des
(test
did
not
mat
ch s
tude
nt’s
gra
de le
vel)
5..
Perc
ent V
alid
Sco
res
For t
he s
ubje
ct, n
umbe
r of v
alid
sco
res,
div
ided
by
the
num
ber o
f stu
dent
s te
sted
, mul
tiplie
d by
10
0, a
nd ro
unde
d to
the
near
est w
hole
num
ber.
[(Num
ber V
alid
Sco
res
/ Num
ber T
este
d) *
100
, ro
unde
d to
nea
rest
who
le n
umbe
r]
6..
Num
ber T
este
d w
ith
Scor
es
For t
he g
roup
and
sub
ject
, num
ber o
f stu
dent
s w
hose
test
ing
resu
lted
in s
core
s. N
umbe
r in
clud
es s
tude
nts
who
test
ed w
ith m
odifi
catio
ns b
ut n
ot:
• in
com
plet
e te
sts
• st
uden
ts w
ith in
cons
iste
nt g
rade
s (te
st d
id n
ot m
atch
stu
dent
’s g
rade
leve
l)
7..
Nat
iona
l Per
cent
ile
Ran
k-St
anin
e (P
R-S
) PR
(Nat
iona
l Per
cent
ile R
ank)
: The
per
cent
age
of s
core
s in
the
norm
gro
up o
f stu
dent
s in
a
natio
nal s
ampl
e w
ho te
sted
in th
e sa
me
grad
e at
a c
ompa
rabl
e tim
e of
the
scho
ol y
ear t
hat f
ell
at o
r bel
ow th
is s
tude
nt’s
sco
re.
S (S
tani
ne):
A s
tand
ard
scor
e ra
ngin
g fro
m 1
to 9
. Sta
nine
s of
1, 2
, and
3 a
re c
onsi
dere
d be
low
av
erag
e, s
tani
nes
of 4
, 5, a
nd 6
ave
rage
, and
sta
nine
s of
7, 8
, and
9 a
bove
ave
rage
.
8..
Mea
n N
orm
al C
urve
Eq
uiva
lent
(NC
E)
Ave
rage
NC
E fo
r all
stud
ents
with
in th
e gr
oup.
Thi
s is
a v
alue
from
1 to
99
that
is b
ased
on
an
equa
l int
erva
l sca
le.
9..
Scal
e Sc
ore
Mea
n Fo
r the
sub
ject
, ave
rage
of t
he v
alid
sca
le s
core
s fo
r the
gro
up o
f stu
dent
s. [(
Sum
of V
alid
S
core
s / N
umbe
r Val
id S
core
s)]

Part
II Rep
ort D
escri
ption
s | C
hapte
r II.2
Sum
mary
Repo
rts
Aug
ust 2
007
20
07 S
TAR
Pos
t-Tes
t Gui
de
61
© 2
007
by th
e C
alifo
rnia
Dep
artm
ent o
f Edu
catio
n
10..
Scal
e Sc
ore
Stan
dard
D
evia
tion
Sta
ndar
d de
viat
ion
(SD
) of t
he s
cale
sco
res
for a
gro
up o
f stu
dent
s. T
he s
cale
sco
re S
D
indi
cate
s ho
w fa
r aw
ay s
cale
sco
res
are
from
the
scal
e sc
ore
mea
n. M
ost s
cale
sco
res
(abo
ut
68%
) will
be
with
in o
ne S
D o
f the
mea
n. V
ery
few
sca
le s
core
s (a
bout
5%
) will
be
mor
e th
an tw
o S
Ds
away
from
the
mea
n.
11.
Perc
ent S
corin
g (Q
uart
iles)
Fo
r eac
h su
bjec
t, th
e pe
rcen
t of s
tude
nts’
sco
res
that
fell
abov
e ea
ch q
uarti
le.
Per
cent
of s
tude
nts
scor
ing
abov
e th
e 75
th n
atio
nal p
erce
ntile
. P
erce
nt o
f stu
dent
s sc
orin
g at
or a
bove
the
50th n
atio
nal p
erce
ntile
. P
erce
nt o
f stu
dent
s sc
orin
g ab
ove
the
25th n
atio
nal p
erce
ntile
.
12.
Perc
ent S
corin
g (F
ifths
) Fo
r eac
h su
bjec
t, th
e pe
rcen
t of s
tude
nts’
sco
res
that
fell
with
in e
ach
fifth
of t
he d
istri
butio
n.
Whe
n pe
rcen
tiles
are
gro
uped
into
five
equ
al c
ateg
orie
s, th
ey a
re c
alle
d fif
ths.
Fou
r qui
ntile
s—20
th, 4
0th, 6
0th, a
nd 8
0th—
divi
de th
e sc
ores
into
the
five
grou
ps. T
he p
erce
ntile
rang
es fr
om th
e hi
ghes
t fift
h of
the
dist
ribut
ion
to th
e lo
wes
t are
: S
tude
nt s
core
s be
twee
n th
e 80
th to
99th
per
cent
iles
Stu
dent
sco
res
betw
een
the
60th to
79th
per
cent
iles
Stu
dent
sco
res
betw
een
the
40th to
59th
per
cent
iles
Stu
dent
sco
res
betw
een
the
20th to
39th
per
cent
iles
Stu
dent
sco
res
betw
een
the
1st to
19th
per
cent
iles
13.
Nat
iona
l Per
cent
ile
Ran
k G
raph
sho
win
g th
e N
atio
nal P
R (p
erce
ntile
rank
) for
Rea
ding
, Lan
guag
e, M
athe
mat
ics,
and
S
pelli
ng.

Part II Report Descriptions | Chapter II.3 Individual Reports | STAR Student Record Label
62 2007 STAR Post-Test Guide August 2007 © 2007 by the California Department of Education
Chapter II.3 Individual Reports STAR Student Record Label
Purpose To allow schools to comply with Section 60607(a) of the California Education Code that requires results for tests within the STAR Program to be part of the student’s permanent record.
Format Student record labels are printed five per sheet, one label per student per test. A student who took both the CSTs and the STS may have two student record labels.
Action Schools should affix this label to the individual student’s permanent school records.
Focus Student’s overall test results.

Part
II Rep
ort D
escri
ption
s | C
hapte
r II.3
Indiv
idual
Repo
rts | S
TAR
Stud
ent R
ecor
d Lab
el
Aug
ust 2
007
20
07 S
TAR
Pos
t-Tes
t Gui
de
63
© 2
007
by th
e C
alifo
rnia
Dep
artm
ent o
f Edu
catio
n
Stud
ent R
ecor
d La
bel S
ampl
es
Sam
ples
—C
ST a
nd S
TS
Ta
ble
II.8
STA
R S
tude
nt R
ecor
d La
bel D
escr
iptio
ns
1..
Stud
ent n
ame
Stu
dent
’s n
ame.
2..
Stud
ent C
RL
Num
ber
Cal
iforn
ia R
eadi
ng L
ist (
CR
L) N
umbe
r tha
t is
base
d on
the
stud
ent’s
mos
t rec
ent C
ST
for E
LA
scor
e an
d m
ay b
e us
ed to
obt
ain
a lis
t of b
ooks
that
may
be
appr
opria
te fo
r the
stu
dent
to re
ad
base
d on
the
stud
ent’s
test
sco
re. D
oes
not a
pply
to S
TS o
r CA
PA
. See
App
endi
x I o
n pa
ge 1
40
for m
ore
info
rmat
ion
on th
e C
RL
Num
ber.
3..
Stud
ent i
dent
ifica
tion
Info
rmat
ion
abou
t a s
tude
nt in
clud
ing
grad
e en
rolle
d, te
st d
ate,
dat
e of
birt
h, s
choo
l, an
d di
stric
t w
here
the
test
was
take
n.
4..
STA
R te
st n
ame
Nam
e of
the
STA
R te
st fo
r whi
ch th
e re
sults
are
repo
rted.
5..
Test
con
tent
are
a S
ubje
ct o
f tes
t tak
en.
1.
Stu
dent
nam
e
2.
Stu
dent
CR
L N
umbe
r
3.
Stu
dent
iden
tific
atio
n 5
. Te
st c
onte
nt a
rea
8.
Per
form
ance
Lev
el9.
Tes
t con
tent
are
a (C
AT/
6 S
urve
y)
10.
Scal
e Sc
ore
(CA
T/6
Sur
vey) 12
. N
atio
nal
Nor
mal
Cur
ve
Equi
vale
nt
7.
Scal
e Sc
ore
4.
STA
R te
st n
ame
6.
Acc
omm
odat
ion
or
Mod
ifica
tion
11.
Nat
iona
l P
erce
ntile
R
ank-
Sta
nine
13.
Per
cent
Cor
rect
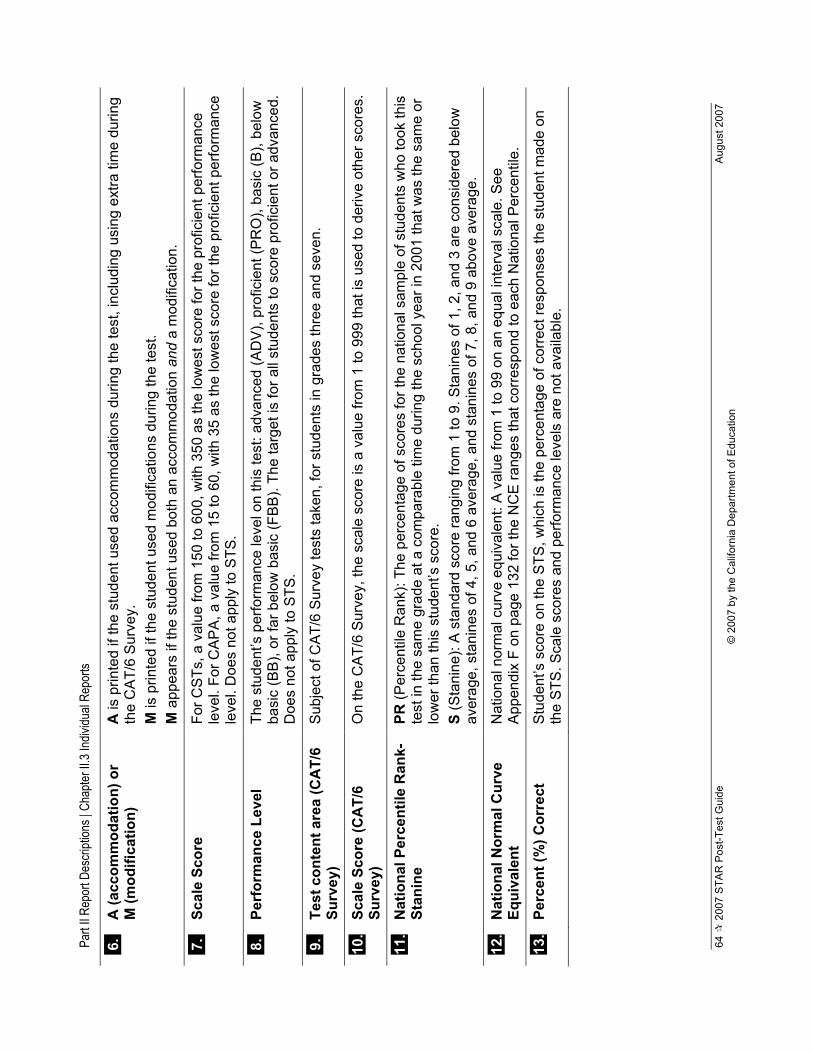
Part
II Rep
ort D
escri
ption
s | C
hapte
r II.3
Indiv
idual
Repo
rts
64
200
7 S
TAR
Pos
t-Tes
t Gui
de
A
ugus
t 200
7 ©
200
7 by
the
Cal
iforn
ia D
epar
tmen
t of E
duca
tion
6..
A (a
ccom
mod
atio
n) o
r M
(mod
ifica
tion)
A
is p
rinte
d if
the
stud
ent u
sed
acco
mm
odat
ions
dur
ing
the
test
, inc
ludi
ng u
sing
ext
ra ti
me
durin
g th
e C
AT/
6 S
urve
y.
M is
prin
ted
if th
e st
uden
t use
d m
odifi
catio
ns d
urin
g th
e te
st.
M a
ppea
rs if
the
stud
ent u
sed
both
an
acco
mm
odat
ion
and
a m
odifi
catio
n.
7..
Scal
e Sc
ore
For C
STs
, a v
alue
from
150
to 6
00, w
ith 3
50 a
s th
e lo
wes
t sco
re fo
r the
pro
ficie
nt p
erfo
rman
ce
leve
l. Fo
r CA
PA
, a v
alue
from
15
to 6
0, w
ith 3
5 as
the
low
est s
core
for t
he p
rofic
ient
per
form
ance
le
vel.
Doe
s no
t app
ly to
STS
.
8..
Perf
orm
ance
Lev
el
The
stud
ent’s
per
form
ance
leve
l on
this
test
: adv
ance
d (A
DV
), pr
ofic
ient
(PR
O),
basi
c (B
), be
low
ba
sic
(BB
), or
far b
elow
bas
ic (F
BB
). Th
e ta
rget
is fo
r all
stud
ents
to s
core
pro
ficie
nt o
r adv
ance
d.
Doe
s no
t app
ly to
STS
.
9..
Test
con
tent
are
a (C
AT/
6 Su
rvey
) S
ubje
ct o
f CA
T/6
Sur
vey
test
s ta
ken,
for s
tude
nts
in g
rade
s th
ree
and
seve
n.
10.
Scal
e Sc
ore
(CA
T/6
Surv
ey)
On
the
CA
T/6
Sur
vey,
the
scal
e sc
ore
is a
val
ue fr
om 1
to 9
99 th
at is
use
d to
der
ive
othe
r sco
res.
11.
Nat
iona
l Per
cent
ile R
ank-
Stan
ine
PR (P
erce
ntile
Ran
k): T
he p
erce
ntag
e of
sco
res
for t
he n
atio
nal s
ampl
e of
stu
dent
s w
ho to
ok th
is
test
in th
e sa
me
grad
e at
a c
ompa
rabl
e tim
e du
ring
the
scho
ol y
ear i
n 20
01 th
at w
as th
e sa
me
or
low
er th
an th
is s
tude
nt’s
sco
re.
S (S
tani
ne):
A s
tand
ard
scor
e ra
ngin
g fro
m 1
to 9
. Sta
nine
s of
1, 2
, and
3 a
re c
onsi
dere
d be
low
av
erag
e, s
tani
nes
of 4
, 5, a
nd 6
ave
rage
, and
sta
nine
s of
7, 8
, and
9 a
bove
ave
rage
.
12.
Nat
iona
l Nor
mal
Cur
ve
Equi
vale
nt
Nat
iona
l nor
mal
cur
ve e
quiv
alen
t: A
val
ue fr
om 1
to 9
9 on
an
equa
l int
erva
l sca
le. S
ee
App
endi
x F
on p
age
132
for t
he N
CE
rang
es th
at c
orre
spon
d to
eac
h N
atio
nal P
erce
ntile
.
13.
Perc
ent (
%) C
orre
ct
Stu
dent
’s s
core
on
the
STS
, whi
ch is
the
perc
enta
ge o
f cor
rect
resp
onse
s th
e st
uden
t mad
e on
th
e S
TS. S
cale
sco
res
and
perfo
rman
ce le
vels
are
not
ava
ilabl
e.

Part
II Rep
ort D
escri
ption
s | C
hapte
r II.3
Indiv
idual
Repo
rts
Aug
ust 2
007
20
07 S
TAR
Pos
t-Tes
t Gui
de
65
© 2
007
by th
e C
alifo
rnia
Dep
artm
ent o
f Edu
catio
n
CST
for G
rade
3 S
ampl
e
C
ST fo
r Gra
de 1
0 Sa
mpl
e
C
APA
Sam
ple
ST
S fo
r Gra
de 4
Sam
ple

Part II Report Descriptions | Chapter II.3 Individual Reports | STAR Student Master List
66 2007 STAR Post-Test Guide August 2007 © 2007 by the California Department of Education
STAR Student Master List
Purpose To provide school administrators with a single list of all students and their scores for a grade, or year-round schedule within a grade, at a school.
Format
Student names are printed in alphabetical order within each grade, by last name, first name, and middle initial. Tests are listed in the following order:
• CST scores and CAT/6 Survey scores (grades 3 and 7) • CAPA scores • STS scores (grades 2, 3, and 4 only)
If scores are not available, a reason code is printed.
Action This report can be used by school administrators to look up student results. The report may be used to scan the students’ scores to assist in the identification of students for further evaluation to participate in special or intervention programs.
Focus Individual student performance on the CST-CAT/6 Survey, CAPA, and STS, including performance on the reporting clusters for CSTs and STS.
For the list of 2007 CST reporting clusters and number of questions for each, see Appendix A on page 116. For the list of 2007 STS reporting clusters and number of questions for each, see Appendix B on page 126. Writing Applications Standards Scores for Grades 4 and 7 Writing Applications is one of six reporting clusters for the Grade 4 and 7 California English–Language Arts Standards Tests. Like the other five English–language arts reporting clusters, there is no scale score, performance level, or passing score for the Writing Applications reporting cluster. Writing scores should not be isolated for individual students or groups of students on this or any other reporting cluster to determine a performance level or “passing” score or to use these scores to make any placement decisions. The overall English–language arts tests are equated from year to year to account for differences in the difficulty levels of the tests. The reporting clusters are not equated from year to year. Since there are no adjustments for differences in the difficulty levels of individual reporting clusters from year to year, comparing the results for individual reporting clusters from one year to the next is inappropriate. This means that there should be no year-to-year comparisons of the Writing Applications reporting cluster scores. To score an individual student’s writing test, a single rater gives the student’s response a score of 1–4. The rating is then doubled, so that the student receives a writing score of 2, 4, 6, or 8. The writing score is added to the ELA multiple-choice score (possible 75) for a total possible raw score of 83. Generally, ELA scale scores for grade 4 and grade 7 students are derived based on this 83-point scale for raw scores. If a student’s writing test cannot be scored, a 75-point raw score scale may be used. STS Scores Because this is the first operational test for the STS there are no scale scores or performance levels available for students who took this test. Instead, the STS scores are presented as percents correct.

Part
II Rep
ort D
escri
ption
s | C
hapte
r II.3
Indiv
idual
Repo
rts | S
TAR
Stud
ent M
aster
List
Aug
ust 2
007
20
07 S
TAR
Pos
t-Tes
t Gui
de
67
© 2
007
by th
e C
alifo
rnia
Dep
artm
ent o
f Edu
catio
n
Stud
ent M
aste
r Lis
t Sam
ples
C
ST a
nd S
TS
7.
STA
R te
st n
ame
2.
Stu
dent
In
form
atio
n
1.
Stu
dent
CR
L
8 .
Acc
omm
odat
ion
or M
odifi
catio
n 4
. Sc
ale
Scor
e
3.
Per
form
ance
Lev
el
9.
Rep
ortin
g cl
uste
r per
cent
cor
rect
6.
Writ
ing
test
sco
re (R
C6)
12.
Nat
iona
l Nor
mal
C
urve
Equ
ival
ent
11.
Nat
iona
l Per
cent
ile
Ran
k-S
tani
ne
5.
Rep
ortin
g cl
uste
r nam
e
10.
Test
con
tent
are
a (C
AT/
6 S
urve
y)
7.
STA
R te
st n
ame
13.
Test
con
tent
ar
ea (C
ST, S
TS)

Part
II Rep
ort D
escri
ption
s | C
hapte
r II.3
Indiv
idual
Repo
rts
68
200
7 S
TAR
Pos
t-Tes
t Gui
de
A
ugus
t 200
7 ©
200
7 by
the
Cal
iforn
ia D
epar
tmen
t of E
duca
tion
Tabl
e II.
9 ST
AR
Stu
dent
Mas
ter L
ist D
escr
iptio
ns
1..
Stud
ent C
RL
Cal
iforn
ia R
eadi
ng L
ist (
CR
L) N
umbe
r tha
t is
base
d on
the
stud
ent’s
mos
t rec
ent C
ST
for
ELA
sco
re a
nd m
ay b
e us
ed to
obt
ain
a lis
t of b
ooks
that
may
be
appr
opria
te fo
r the
stu
dent
to
read
bas
ed o
n th
e st
uden
t’s te
st s
core
. See
App
endi
x I o
n pa
ge 1
40 fo
r mor
e in
form
atio
n on
the
CR
L N
umbe
r. D
oes
not a
pply
to S
TS o
r CA
PA
.
2..
Stud
ent I
nfor
mat
ion
Stu
dent
’s n
ame,
SS
ID n
umbe
r, an
d da
te o
f birt
h.
3..
Perf
orm
ance
Lev
el (P
erf
Levl
) Th
e st
uden
t’s p
erfo
rman
ce le
vel o
n th
is te
st: a
dvan
ced
(AD
V),
prof
icie
nt (P
RO
), ba
sic
(B),
belo
w b
asic
(BB
), or
far b
elow
bas
ic (F
BB
). Th
e ta
rget
is fo
r all
stud
ents
to s
core
pro
ficie
nt o
r ad
vanc
ed. D
oes
not a
pply
to S
TS.
4..
Scal
e Sc
ore
(SS)
Fo
r CS
Ts, a
val
ue fr
om 1
50 to
600
, with
350
as
the
low
est s
core
for t
he p
rofic
ient
pe
rform
ance
leve
l. Fo
r CA
PA
, a v
alue
from
15
to 6
0, w
ith 3
5 as
the
low
est s
core
for t
he
prof
icie
nt p
erfo
rman
ce le
vel.
Doe
s no
t app
ly to
STS
.
5..
Rep
ortin
g cl
uste
r nam
e R
epor
ting
clus
ter f
or c
onte
nt a
rea
take
n. D
oes
not a
pply
to C
AP
A.
6..
Writ
ing
test
sco
re (R
C6)
W
ritin
g A
pplic
atio
ns S
tand
ards
Sco
re fo
r gra
de 4
or g
rade
7 w
ould
app
ear h
ere
unde
r the
title
“W
ritin
g A
pp.”
Pos
sibl
e w
ritin
g sc
ore
is 2
, 4, 6
, or 8
. If n
o w
ritin
g sc
ore
is a
vaila
ble,
one
of
thes
e le
tters
will
app
ear:
C I L T B R W NT–t
he s
tude
nt c
opie
d th
e ta
sk in
stea
d of
com
plet
ing
it –t
he s
tude
nt’s
writ
ing
was
ille
gibl
e –t
he s
tude
nt w
rote
in a
lang
uage
oth
er th
an E
nglis
h –t
he s
tude
nt w
rote
an
essa
y on
som
ethi
ng o
ther
than
the
assi
gned
topi
c –t
he s
tude
nt s
ubm
itted
a b
lank
pap
er
–the
stu
dent
refu
sed
to w
rite
–the
stu
dent
wro
te o
n a
prom
pt fr
om a
n ea
rlier
test
ing
perio
d —
not t
aken
7..
STA
R te
st n
ame
Nam
e of
the
STA
R te
st fo
r whi
ch th
e re
sults
are
repo
rted.
8..
A (a
ccom
mod
atio
n) o
r M
(mod
ifica
tion)
A
app
ears
if th
e st
uden
t use
d an
acc
omm
odat
ion
on th
e sp
ecifi
ed C
ST,
incl
udin
g us
ing
extra
tim
e du
ring
the
CA
T/6
Sur
vey.
M
app
ears
if th
e st
uden
t use
d a
mod
ifica
tion
on th
e sp
ecifi
ed C
ST-
CA
T/6
Sur
vey
or S
TS.
M a
ppea
rs if
the
stud
ent u
sed
both
an
acco
mm
odat
ion
and
a m
odifi
catio
n.
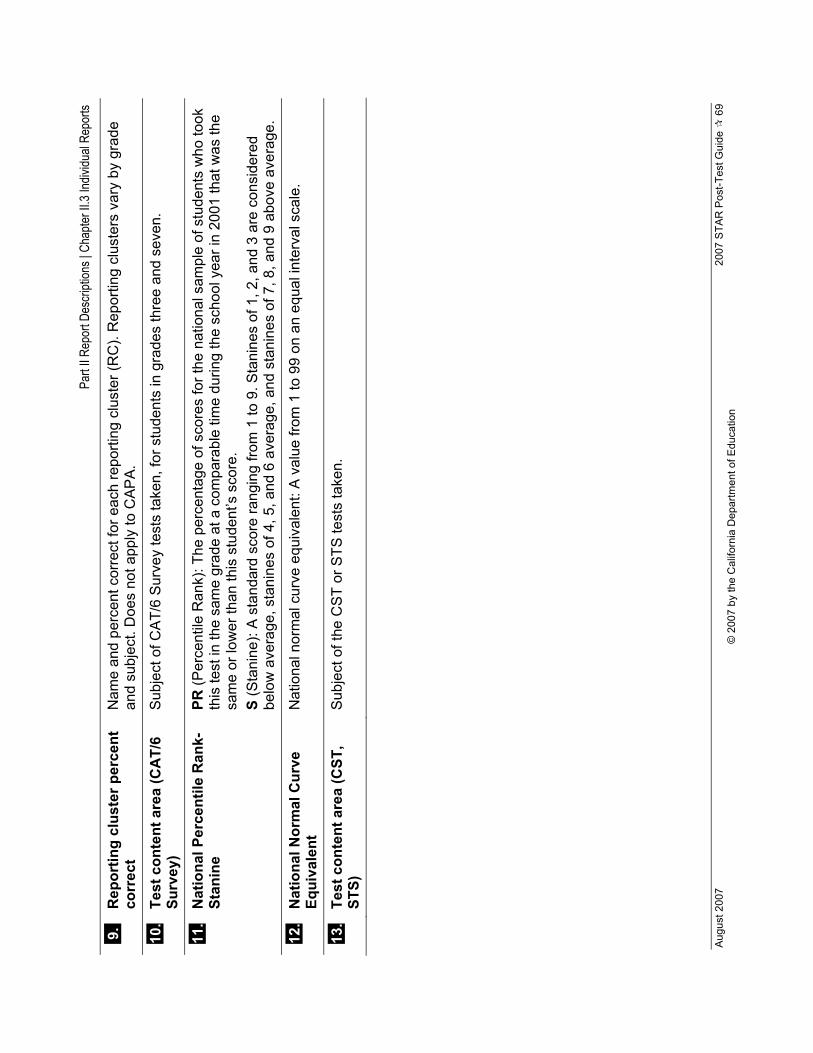
Part
II Rep
ort D
escri
ption
s | C
hapte
r II.3
Indiv
idual
Repo
rts
Aug
ust 2
007
20
07 S
TAR
Pos
t-Tes
t Gui
de
69
© 2
007
by th
e C
alifo
rnia
Dep
artm
ent o
f Edu
catio
n
9..
Rep
ortin
g cl
uste
r per
cent
co
rrec
t N
ame
and
perc
ent c
orre
ct fo
r eac
h re
porti
ng c
lust
er (R
C).
Rep
ortin
g cl
uste
rs v
ary
by g
rade
an
d su
bjec
t. D
oes
not a
pply
to C
AP
A.
10.
Test
con
tent
are
a (C
AT/
6 Su
rvey
) S
ubje
ct o
f CA
T/6
Sur
vey
test
s ta
ken,
for s
tude
nts
in g
rade
s th
ree
and
seve
n.
11.
Nat
iona
l Per
cent
ile R
ank-
Stan
ine
PR (P
erce
ntile
Ran
k): T
he p
erce
ntag
e of
sco
res
for t
he n
atio
nal s
ampl
e of
stu
dent
s w
ho to
ok
this
test
in th
e sa
me
grad
e at
a c
ompa
rabl
e tim
e du
ring
the
scho
ol y
ear i
n 20
01 th
at w
as th
e sa
me
or lo
wer
than
this
stu
dent
’s s
core
. S
(Sta
nine
): A
sta
ndar
d sc
ore
rang
ing
from
1 to
9. S
tani
nes
of 1
, 2, a
nd 3
are
con
side
red
belo
w a
vera
ge, s
tani
nes
of 4
, 5, a
nd 6
ave
rage
, and
sta
nine
s of
7, 8
, and
9 a
bove
ave
rage
.
12.
Nat
iona
l Nor
mal
Cur
ve
Equi
vale
nt
Nat
iona
l nor
mal
cur
ve e
quiv
alen
t: A
val
ue fr
om 1
to 9
9 on
an
equa
l int
erva
l sca
le.
13.
Test
con
tent
are
a (C
ST,
STS)
S
ubje
ct o
f the
CS
T or
STS
test
s ta
ken.

Part
II Rep
ort D
escri
ption
s | C
hapte
r II.3
Indiv
idual
Repo
rts
70
200
7 S
TAR
Pos
t-Tes
t Gui
de
A
ugus
t 200
7 ©
200
7 by
the
Cal
iforn
ia D
epar
tmen
t of E
duca
tion
Mas
ter L
ist S
ampl
e R
ecor
ds
CST
for G
rade
3
CST
for G
rade
10

Part
II Rep
ort D
escri
ption
s | C
hapte
r II.3
Indiv
idual
Repo
rts
Aug
ust 2
007
20
07 S
TAR
Pos
t-Tes
t Gui
de
71
© 2
007
by th
e C
alifo
rnia
Dep
artm
ent o
f Edu
catio
n
CA
PA
ST
S fo
r Gra
de 4
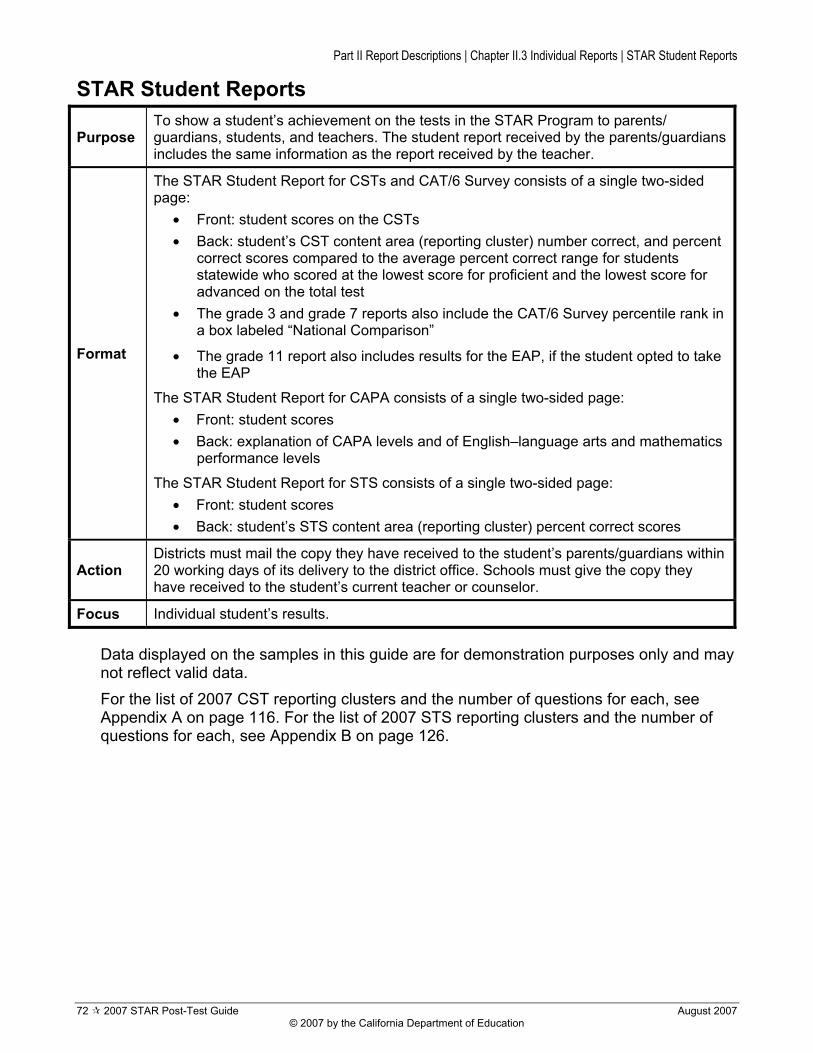
Part II Report Descriptions | Chapter II.3 Individual Reports | STAR Student Reports
72 2007 STAR Post-Test Guide August 2007 © 2007 by the California Department of Education
STAR Student Reports
Purpose To show a student’s achievement on the tests in the STAR Program to parents/ guardians, students, and teachers. The student report received by the parents/guardians includes the same information as the report received by the teacher.
Format
The STAR Student Report for CSTs and CAT/6 Survey consists of a single two-sided page:
• Front: student scores on the CSTs • Back: student’s CST content area (reporting cluster) number correct, and percent
correct scores compared to the average percent correct range for students statewide who scored at the lowest score for proficient and the lowest score for advanced on the total test
• The grade 3 and grade 7 reports also include the CAT/6 Survey percentile rank in a box labeled “National Comparison”
• The grade 11 report also includes results for the EAP, if the student opted to take the EAP
The STAR Student Report for CAPA consists of a single two-sided page: • Front: student scores • Back: explanation of CAPA levels and of English–language arts and mathematics
performance levels
The STAR Student Report for STS consists of a single two-sided page: • Front: student scores • Back: student’s STS content area (reporting cluster) percent correct scores
Action Districts must mail the copy they have received to the student’s parents/guardians within 20 working days of its delivery to the district office. Schools must give the copy they have received to the student’s current teacher or counselor.
Focus Individual student’s results.
Data displayed on the samples in this guide are for demonstration purposes only and may not reflect valid data. For the list of 2007 CST reporting clusters and the number of questions for each, see Appendix A on page 116. For the list of 2007 STS reporting clusters and the number of questions for each, see Appendix B on page 126.
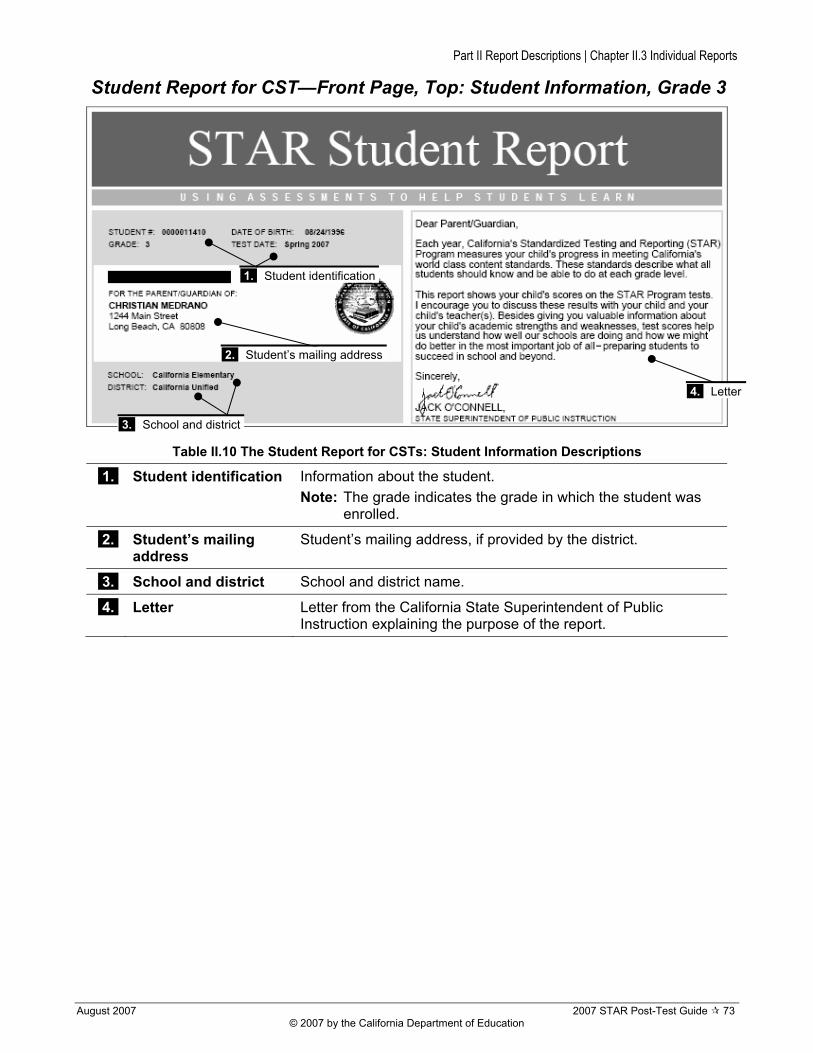
Part II Report Descriptions | Chapter II.3 Individual Reports
August 2007 2007 STAR Post-Test Guide 73 © 2007 by the California Department of Education
Student Report for CST—Front Page, Top: Student Information, Grade 3
Table II.10 The Student Report for CSTs: Student Information Descriptions
1.. Student identification Information about the student. Note: The grade indicates the grade in which the student was
enrolled.
2.. Student’s mailing address
Student’s mailing address, if provided by the district.
3.. School and district School and district name.
4.. Letter Letter from the California State Superintendent of Public Instruction explaining the purpose of the report.
4. Letter
1. Student identification
2. Student’s mailing address
3. School and district

Part II Report Descriptions | Chapter II.3 Individual Reports
74 2007 STAR Post-Test Guide August 2007 © 2007 by the California Department of Education
Student Report for CSTs—Front Page, Bottom: Student’s Overall Results on the California Standards Tests, Grade 3
1. Overall results
2. STAR results
3. How to use these results

Part II Report Descriptions | Chapter II.3 Individual Reports
August 2007 2007 STAR Post-Test Guide 75 © 2007 by the California Department of Education
Table II.11 The Student Report for CSTs: Student’s Overall Results Descriptions
1.. Overall results Student’s overall results on the CSTs. The vertical bars represent the scale score for each subject and show how close the student’s performance is to the state target of proficient or advanced. The number at the top of each bar shows the scale score for each subject. English–language arts and mathematics are included in grades 2–11. History–social science is included in grades 8, 9, 10, and 11. Science is included in grades 5, 8, 9, 10, and 11. Please note that a scale score is derived from a statistical process. It is not possible to calculate a scale score by multiplying a student’s percent correct across content areas by 600. If the student did not take one or more of these tests or if a score was unable to be reported, this is noted as one of the following: • Your child did not take a California Standards Test in this
subject. (Printed when student was absent, not tested by parent/guardian request, or not given a test for any other reason.)
• Test not scored because student did not answer a sufficient number of questions to produce a score.
• Test not scored because test grade did not match student’s grade. (The grade on the School and Grade Identification [SGID] sheet was different from the answer document grade level.)
• Test not scored because test name was not marked on answer document. (The student took an end-of-course test in mathematics [grades 7–11] or science [grades 9–11] but the test name—Algebra I, Geometry, etc.—was not marked.)
2.. STAR results Lists Web addresses to find complete STAR results or the School Accountability Report Cards.
3.. How to use these results
Gives context for interpreting the results, and suggests ways that parents/guardians can use the results to help their child succeed in school.
Student Report for CSTs—Back Page, Top: Student’s Strengths and Needs, Grade 3
This section of the report breaks down the subject areas into content areas (reporting clusters). The tables show how the student performed in each reporting cluster for each test taken. The bar (▬) represents the average percent correct range for students statewide who scored proficient on the total test. The student’s diamond (♦) represents the student’s percent correct for that content area (reporting cluster). The position of the diamonds on the table shows the relationship of the student’s percent correct to the scores of students statewide who achieved proficient on the total test. There are no scale scores or performance levels for the reporting clusters. There are four types of student reports. Each type is based on the number of subjects for which California Standards Tests are required.
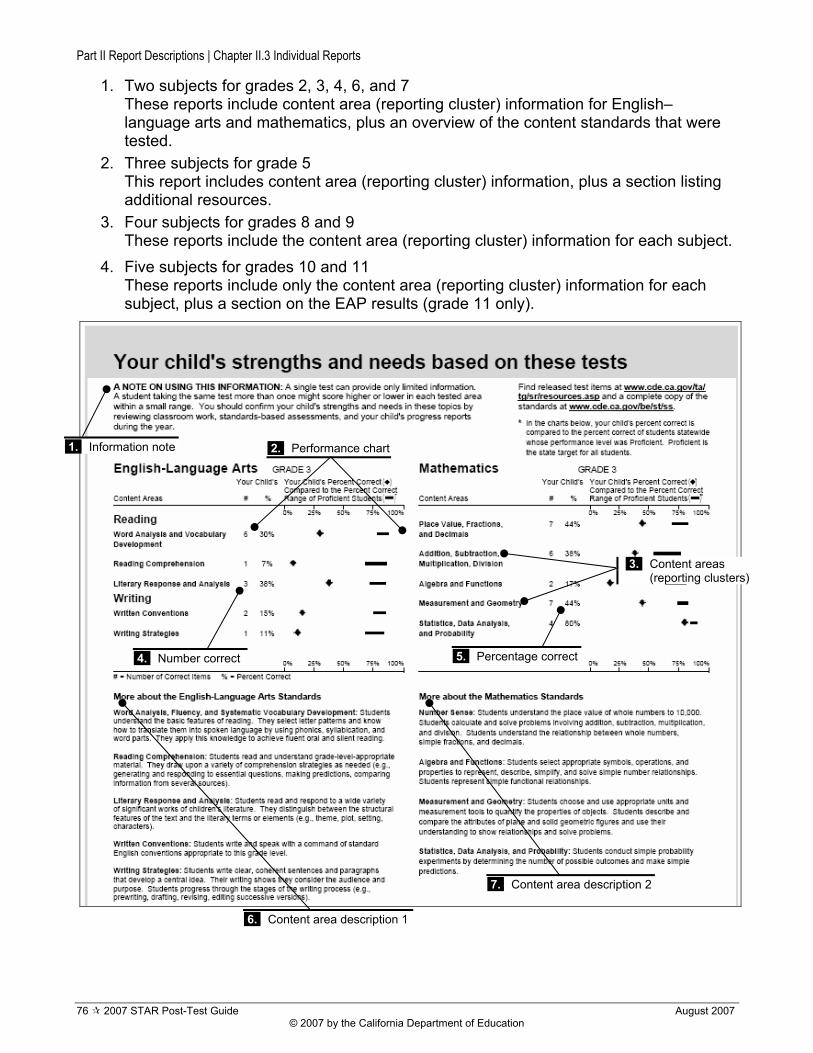
Part II Report Descriptions | Chapter II.3 Individual Reports
76 2007 STAR Post-Test Guide August 2007 © 2007 by the California Department of Education
1. Two subjects for grades 2, 3, 4, 6, and 7 These reports include content area (reporting cluster) information for English–language arts and mathematics, plus an overview of the content standards that were tested.
2. Three subjects for grade 5 This report includes content area (reporting cluster) information, plus a section listing additional resources.
3. Four subjects for grades 8 and 9 These reports include the content area (reporting cluster) information for each subject.
4. Five subjects for grades 10 and 11 These reports include only the content area (reporting cluster) information for each subject, plus a section on the EAP results (grade 11 only).
1. Information note 2. Performance chart
3. Content areas (reporting clusters)
6. Content area description 1
7. Content area description 2
4. Number correct 5. Percentage correct
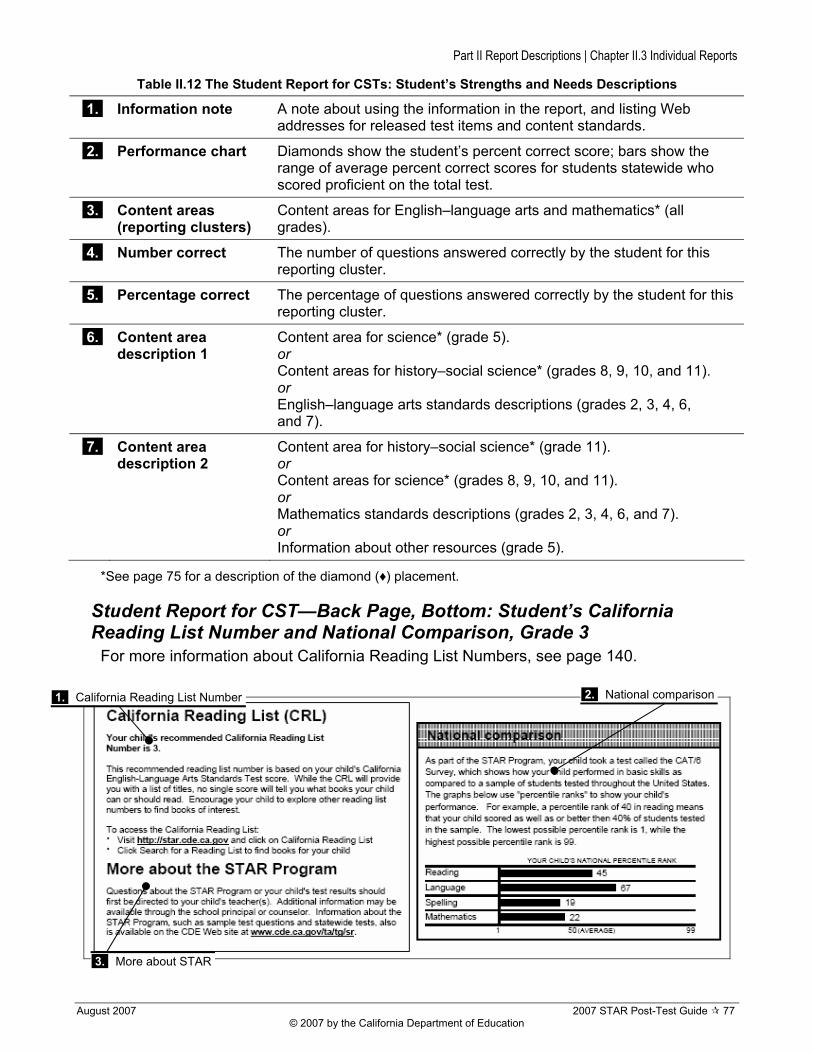
Part II Report Descriptions | Chapter II.3 Individual Reports
August 2007 2007 STAR Post-Test Guide 77 © 2007 by the California Department of Education
Table II.12 The Student Report for CSTs: Student’s Strengths and Needs Descriptions
1.. Information note A note about using the information in the report, and listing Web addresses for released test items and content standards.
2.. Performance chart Diamonds show the student’s percent correct score; bars show the range of average percent correct scores for students statewide who scored proficient on the total test.
3.. Content areas (reporting clusters)
Content areas for English–language arts and mathematics* (all grades).
4.. Number correct The number of questions answered correctly by the student for this reporting cluster.
5.. Percentage correct The percentage of questions answered correctly by the student for this reporting cluster.
6.. Content area description 1
Content area for science* (grade 5). or Content areas for history–social science* (grades 8, 9, 10, and 11). or English–language arts standards descriptions (grades 2, 3, 4, 6, and 7).
7.. Content area description 2
Content area for history–social science* (grade 11). or Content areas for science* (grades 8, 9, 10, and 11). or Mathematics standards descriptions (grades 2, 3, 4, 6, and 7). or Information about other resources (grade 5).
*See page 75 for a description of the diamond (♦) placement.
Student Report for CST—Back Page, Bottom: Student’s California Reading List Number and National Comparison, Grade 3
For more information about California Reading List Numbers, see page 140.
1. California Reading List Number 2. National comparison
3. More about STAR

Part II Report Descriptions | Chapter II.3 Individual Reports
78 2007 STAR Post-Test Guide August 2007 © 2007 by the California Department of Education
Table II.13 The Student Report for CSTs: Student’s California Reading List Number and National Comparison Descriptions
1.. California Reading List Number
California Reading List Number that is based on the student’s CST ELA score. Parents/guardians may use the student’s grade and the CRL number to visit the STAR Web site at http://star.cde.ca.gov, and click on the link California Reading List to obtain titles of books that the student should be able to read independently. See Appendix I: California Reading List Number on page 140 for more information about using the California Reading List Web site.
2.. National comparison Students in grades three and seven took the CAT/6 Survey. This box reports the CAT/6 Survey national percentile attained by the student. The national percentile is shown as a graphical representation of the percentage of students in the national norm group whose scores fell at or below the student’s score on the CAT/6 Survey.
3.. More about STAR Provides information about how parents/guardians may acquire more information about the STAR Program. If the student is in a grade other than grade 3, 7, or 10, this section is to the right of the CRL section:
For students in Grade 11, this section also presents information about the California State University’s Early Assessment Program (EAP) and results for the EAP, if the student took the EAP. If the student did not participate in EAP the status will say, “Not Applicable.” Additional information regarding EAP can be found at www.calstate.edu/eap:

Part II Report Descriptions | Chapter II.3 Individual Reports
August 2007 2007 STAR Post-Test Guide 79 © 2007 by the California Department of Education
Student Report for CSTs—Grade 4 Sample for Parents/Guardians Sample front

Part II Report Descriptions | Chapter II.3 Individual Reports
80 2007 STAR Post-Test Guide August 2007 © 2007 by the California Department of Education
Sample back
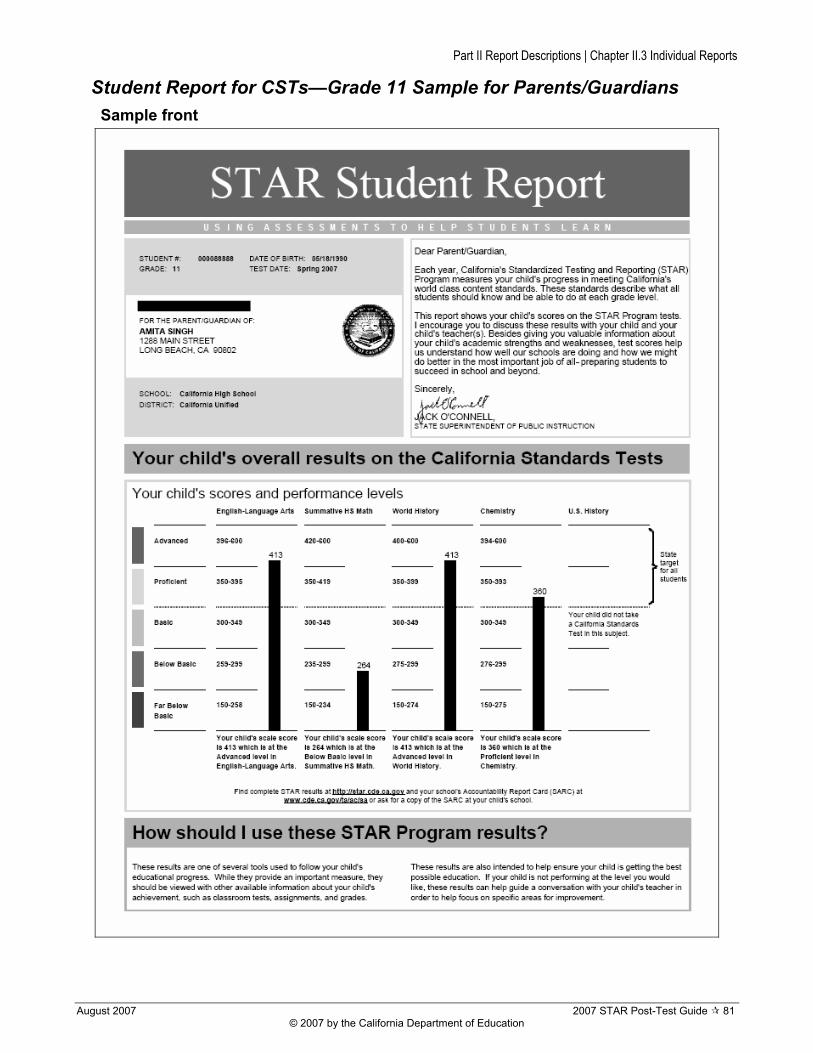
Part II Report Descriptions | Chapter II.3 Individual Reports
August 2007 2007 STAR Post-Test Guide 81 © 2007 by the California Department of Education
Student Report for CSTs—Grade 11 Sample for Parents/Guardians Sample front

Part II Report Descriptions | Chapter II.3 Individual Reports
82 2007 STAR Post-Test Guide August 2007 © 2007 by the California Department of Education
Sample back

Part II Report Descriptions | Chapter II.3 Individual Reports
August 2007 2007 STAR Post-Test Guide 83 © 2007 by the California Department of Education
Student Report for CAPA—Front Page, Top: Student Information
Table II.14 The Student Report for CAPA: Student Information Descriptions
1.. Student identification Information about the student: student identification number, birth date, test date, grade, and CAPA Level. CAPA levels are based on grade except for Level I, which covers all grades for students with the most severe cognitive disabilities. The other CAPA levels are:
Level II: Grades 2–3 Level III: Grades 4–5 Level IV: Grades 6–8 Level V: Grades 9–11
2.. Student’s mailing address
Student’s mailing address, if provided by the district.
3.. School and district Name of the school and school district where the child was tested.
4.. Letter Letter from the California State Superintendent of Public Instruction explaining the purpose of the report.
4. Letter
1. Student identification
2. Student’s mailing address
3. School and district

Part II Report Descriptions | Chapter II.3 Individual Reports
84 2007 STAR Post-Test Guide August 2007 © 2007 by the California Department of Education
Student Report for CAPA—Front Page, Bottom: Student’s Results
Table II.15 The Student Report for CAPA: Student’s Overall Results Descriptions
1.. Student’s results This shows the student’s overall results on the CAPA. The vertical bars represent the scale score for each subject and show how close the student’s score is to the state target of proficient. The number at the top of each bar indicates the scale score for each subject (English–language arts and mathematics). If the student did not take one or both of these assessments or if a score was unable to be reported, this is noted.
2.. STAR results Lists Web addresses to find complete STAR results or the School Accountability Report Cards.
3.. How to use these results
Gives context for interpreting the results, and suggests that parents/guardians might discuss the results with the student’s teacher.
3. How to use these results
2. STAR results
1. Student’s results

Part II Report Descriptions | Chapter II.3 Individual Reports
August 2007 2007 STAR Post-Test Guide 85 © 2007 by the California Department of Education
Student Report for CAPA—Back Page, Top: Testing Levels This section of the report explains the CAPA testing levels and their corresponding grade levels.
Student Report for CAPA—Back Page, Bottom: Performance Levels
Table III.1. The Student Report for CAPA: Performance Level Descriptions
1.. English–Language Arts
2.. Mathematics
Describes what students should be able to do based on the performance level they achieved. The descriptions are different for each CAPA level.
1. ELA performance levels 2. Math performance levels

Part II Report Descriptions | Chapter II.3 Individual Reports
86 2007 STAR Post-Test Guide August 2007 © 2007 by the California Department of Education
Student Report for CAPA—Grade 5 Level II Sample for Parents/Guardians
Sample front
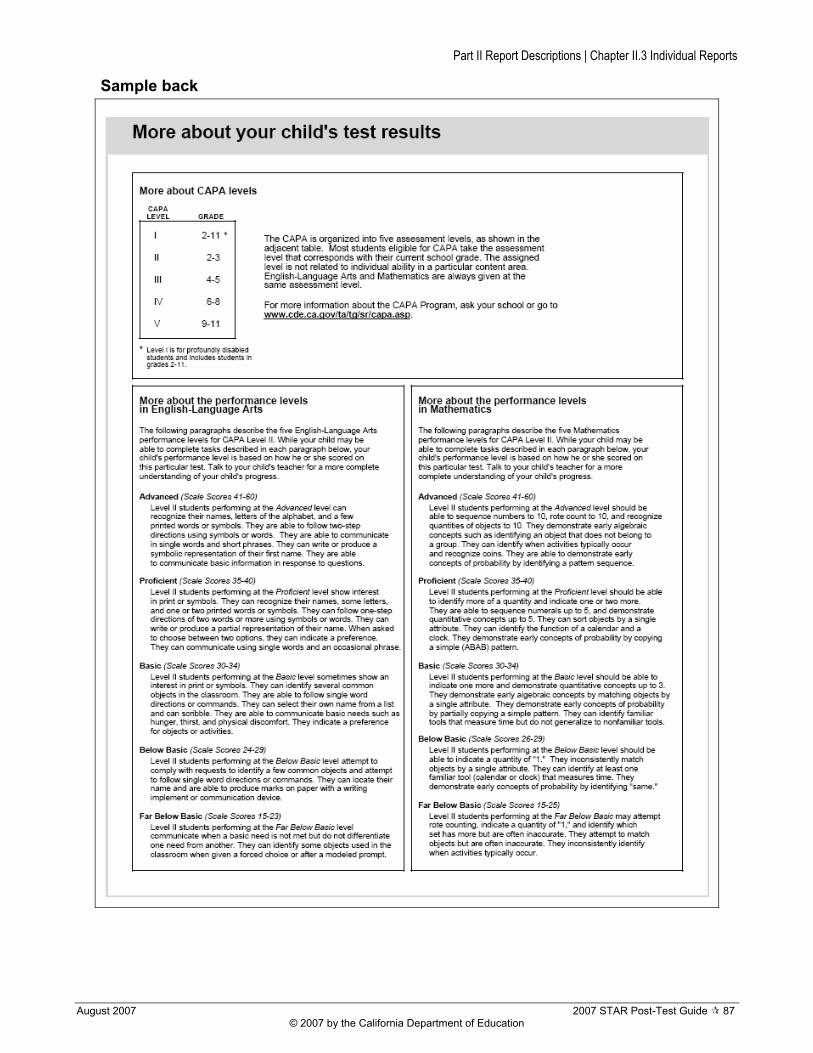
Part II Report Descriptions | Chapter II.3 Individual Reports
August 2007 2007 STAR Post-Test Guide 87 © 2007 by the California Department of Education
Sample back
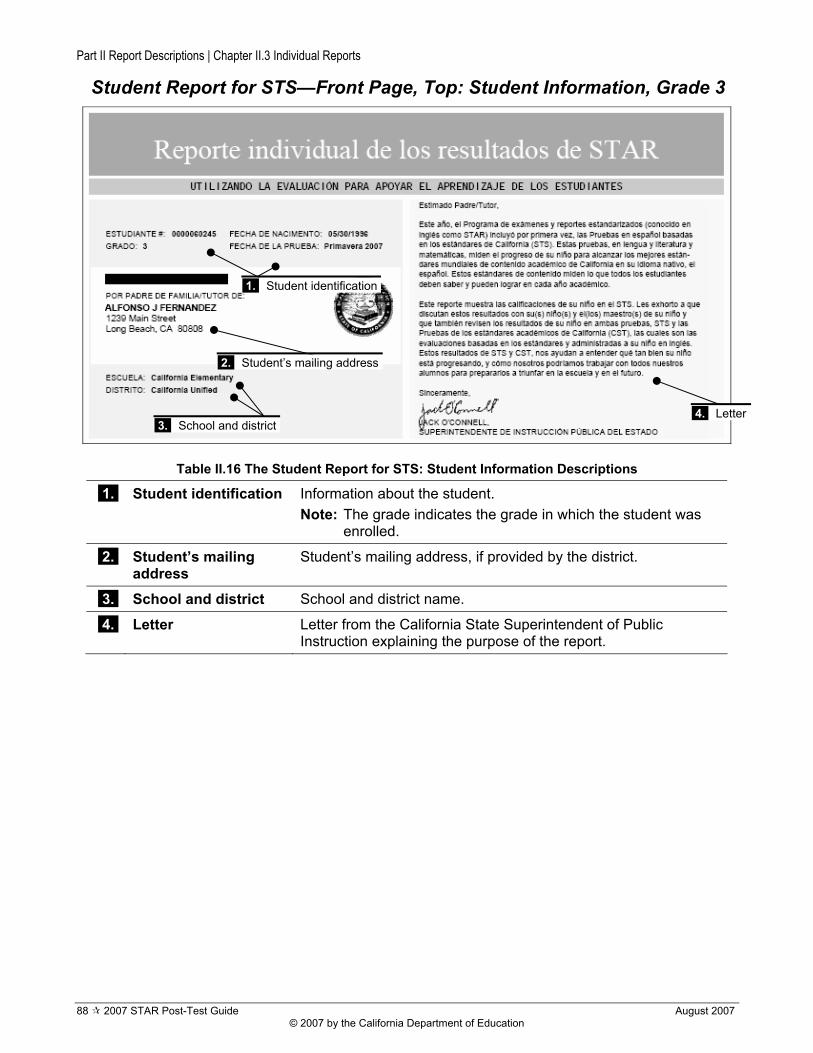
Part II Report Descriptions | Chapter II.3 Individual Reports
88 2007 STAR Post-Test Guide August 2007 © 2007 by the California Department of Education
Student Report for STS—Front Page, Top: Student Information, Grade 3
Table II.16 The Student Report for STS: Student Information Descriptions
1.. Student identification Information about the student. Note: The grade indicates the grade in which the student was
enrolled.
2.. Student’s mailing address
Student’s mailing address, if provided by the district.
3.. School and district School and district name.
4.. Letter Letter from the California State Superintendent of Public Instruction explaining the purpose of the report.
4. Letter
1. Student identification
2. Student’s mailing address
3. School and district

Part II Report Descriptions | Chapter II.3 Individual Reports
August 2007 2007 STAR Post-Test Guide 89 © 2007 by the California Department of Education
Student Report for STS—Front Page, Bottom: Student’s Overall Results on the Standards-based Tests in Spanish, Grade 3
Table II.17 The Student Report for STS: Student’s Overall Results Descriptions
1.. Overall results Student’s overall results on the STS. The vertical bars represent the percentage correct for reading–language arts and mathematics.If the student did not take one or more of these tests or if a score was unable to be reported, this is noted as one of the following: • Your child did not take the Standards-based Test in Spanish in
this subject. (Appears when student was absent, not tested by parent/guardian request, or not given a test for any other reason.)
• Test not scored because student did not answer a sufficient number of questions to produce a score.
• Test not scored because test grade did not match student’s grade. (The grade on the School and Grade Identification [SGID] sheet was different from the test booklet or answer document grade level.)
1. Overall results

Part II Report Descriptions | Chapter II.3 Individual Reports
90 2007 STAR Post-Test Guide August 2007 © 2007 by the California Department of Education
Student Report for STS—Back Page, Top: Student’s Strengths and Needs, Grade 3
This section of the report breaks down the subject areas into content areas (reporting clusters). The tables show how the student performed in each reporting cluster for each test taken. The student’s diamond (♦) represents the student’s percent correct for that content area (reporting cluster). The position of the diamonds on the table shows where on the percentage graph the student scored. There are no scale scores or performance levels for the reporting clusters. The STAR Student Report for STS includes reporting on the two subjects on which the student was tested, reading–language arts and mathematics. It includes the content area (reporting cluster) information for these content areas.
Table II.18 The Student Report for STS: Student’s Strengths and Needs Descriptions
1.. Performance chart Diamonds show the student’s percent correct score.
2.. Content areas (reporting clusters)
Content areas for reading–language arts and mathematics (all grades).
3.. Percentage correct The percentage of questions answered correctly by the student for this reporting cluster.
1. Performance chart
2. Content areas (reporting clusters)
3. Percentage correct

Part II Report Descriptions | Chapter II.3 Individual Reports
August 2007 2007 STAR Post-Test Guide 91 © 2007 by the California Department of Education
Student Report for STS—Back Page, Middle: Using STS Results, Grade 3
This section gives context for interpreting the results, and suggests ways that parents/ guardians can use the results to help their child succeed in school.
Student Report for STS—Back Page, Bottom: More about STAR
This section provides information about how parents/guardians may acquire more information about the STAR Program.

Part II Report Descriptions | Chapter II.3 Individual Reports
92 2007 STAR Post-Test Guide August 2007 © 2007 by the California Department of Education
Student Report for STS—Grade 4 Sample for Parents/Guardians Sample front
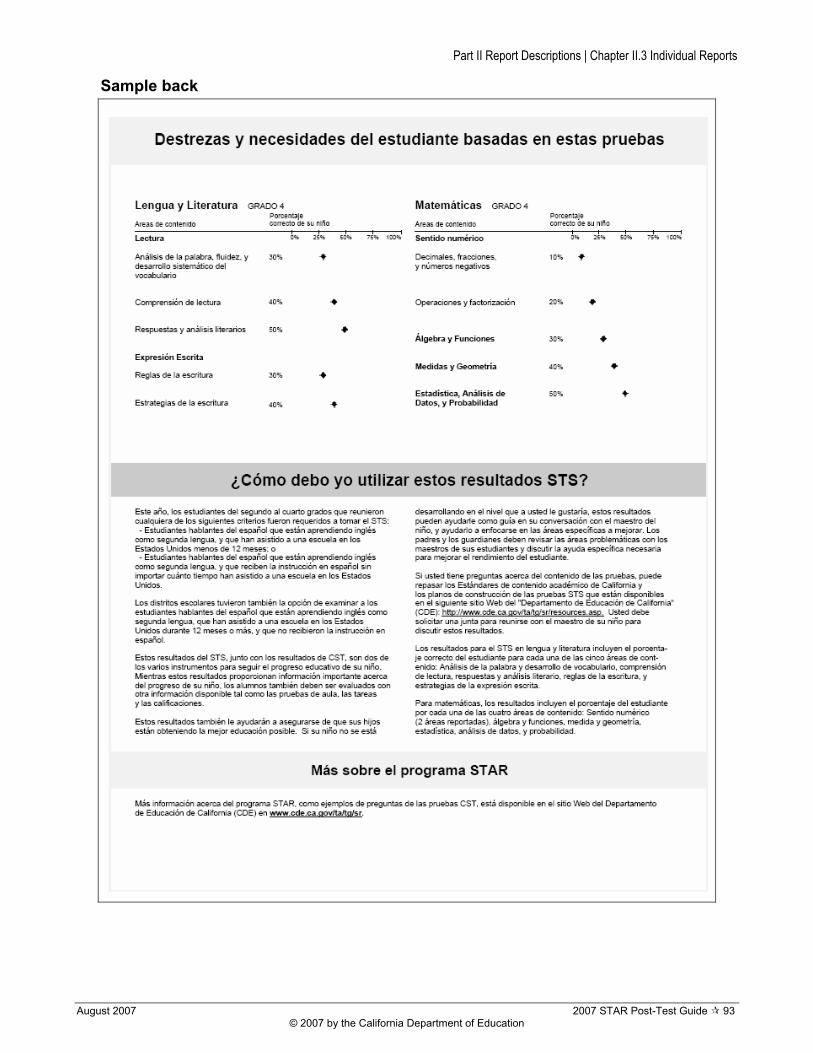
Part II Report Descriptions | Chapter II.3 Individual Reports
August 2007 2007 STAR Post-Test Guide 93 © 2007 by the California Department of Education
Sample back

Part II Report Descriptions | Chapter II.4 The California Report for Teachers
94 2007 STAR Post-Test Guide August 2007 © 2007 by the California Department of Education
Chapter II.4 The California Report for Teachers All teachers should receive grade-level or course-appropriate reports for what they teach. Only teachers identified on a School and Grade Identification (SGID) sheet or Pre-ID file will receive grade-level or course reports individualized for their 2006–07 class(es).
Purpose
To provide teachers a summary of results for their previous year’s class(es) on the CSTs for English–Language Arts and Mathematics—teacher reports are not available for science or history–social science, or for CAPA or STS. Teachers may use the report in conjunction with other information to evaluate the effectiveness of their instructional programs.
Format
There are separate reports for the California English–Language Arts and Mathematics Standards Tests. Reports are printed for individual teachers if:
• Teacher names were included for students in the district Pre-ID file, or • Student answer documents were packaged for scoring by teacher and the
teacher’s name was marked on an SGID or header sheet. A teacher name on the SGID sheet takes precedence over the teacher’s name in the Pre-ID file. Reports are printed by grade level or math course for distribution to the appropriate teachers.
Action
District STAR coordinators will receive teacher reports prepackaged by school. Do not open the packages. Distribute the packages to the schools for school administrators to distribute the reports to teachers. Reports for individual teachers will be in sealed envelopes addressed to the teachers. The envelopes are to be given only to the teachers to whom they are addressed. Multiple copies of grade-level and mathematics end-of-course reports are also provided. These are to be distributed to all teachers who taught the grade or course during the 2006–07 school year. Additional copies of the grade-level and mathematics end-of-course reports may be made, if needed.
Focus Reporting clusters that may need focused attention, changes in scores from the previous year, and comparison of scores for various subgroups.
Users may notice slight differences between reports that are distributed to schools and teachers, and those that are shown in this guide. Data displayed on the samples in this guide are for demonstration purposes only and may not reflect valid data. The percentages in the report may be different from last year’s teacher reports or other numbers that have been made public because of rounding or changes in demographic data. Any reports that include results for ten or fewer students are confidential and should be distributed only to teachers who taught the grade-level or math course. For the list of 2007 CST reporting clusters and number of questions for each, see Appendix A on page 116. Note: District STAR coordinators will receive these reports during September/October
and should forward the packages to schools immediately. Test site coordinators should not open the envelopes. Whenever possible, reports for individual teachers should be forwarded to teachers who have left the school. All reports that cannot be forwarded to teachers are to be returned to the district STAR coordinator.

Part II Report Descriptions | Chapter II.4 The California Report for Teachers
August 2007 2007 STAR Post-Test Guide 95 © 2007 by the California Department of Education
Types of Teacher Reports Table II.19 Types of Teacher Reports
Type California Standards: English–Language Arts (ELA) California Standards: Mathematics
Based on SGID “Teacher, Counselor, or Group name” returned with answer documents or teacher name from the Pre-ID file. If teacher names were included in the district’s Pre-ID file and different names were coded on the SGID, the name on the SGID was used.
Based on SGID “Teacher, Counselor, or Group name” returned with answer documents or teacher name from the Pre-ID file. If teacher names were included in the district’s Pre-ID file and different names were coded on the SGID, the name on the SGID was used.
Distribute sealed envelopes only to teacher, counselor, or group to whom each report is addressed.
Distribute sealed envelopes only to teacher, counselor, or group to whom each report is addressed.
Group
Example: Ms. Brown’s fourth grade. Example: Ms. Brown’s fourth grade.
All schools will receive these reports. All schools will receive these reports.
If there is no SGID by group, teacher, or counselor or names in the Pre-ID file, or if the superintendent opted not to receive reports by teacher, the school will receive only grade-level reports.
If there is no SGID by group, teacher, or counselor or names in the Pre-ID file, or if the superintendent opted not to receive reports by teacher, the school will receive only grade-level/math course reports.
Administrators should distribute ELA grade-level reports to teachers who taught the grade level or English last year.
Administrators should distribute mathematics grade-level reports to teachers who taught the grade level last year or course reports to teachers who taught the mathematics course last year.
Schools receive one grade report for every 20 students, grades 2–3; one grade report for every 30 students, grades 4–11.
Schools receive one grade report for every 20 students, grades 2–3; one grade or course report for every 30 students, grades 4–11.
Grade or
Course
Example: All grade-7 students at Buena Vista Middle School.
Example: All grade-7 students at Buena Vista Middle School.

Part II Report Descriptions | Chapter II.4 The California Report for Teachers
96 2007 STAR Post-Test Guide August 2007 © 2007 by the California Department of Education
California Report for Teachers Teacher Report—Front: Performance
The box that asks “How did last year’s students perform on the CST?” indicates the total number of students in the group. Then it shows how the students performed on each reporting cluster.
Table II.20 STAR Teacher Report: Performance Section Descriptions
1.. Reporting Cluster Reporting cluster names for the grade.
2.. Number of Items Number of questions in each reporting cluster.
3.. Average Percent Correct
For the reporting cluster, the average percent correct by: statewide, district, and your students. {[(Σ Raw scores / # of students in the group) / Σ Total Number of questions] * 100, rounded to nearest whole number}
4.. District Students Results that include data for all schools in the district including all charter schools that tested as part of the district.
5.. Proficient Range For the reporting cluster, the average percent correct for students statewide whose scale scores were between 350 (proficient) and the highest scale score for proficient on the total test (CST for ELA or Math). The range shown in this example for the cluster Literary Response and Analysis is 64–77%. The average percent correct for a reporting cluster in Appendix A may show that the statewide average percent correct is 64% for students who scored 350 on the total test. Subtracting one from the statewide average percent correct for students who had the lowest score for advanced on the total test—for example, 78%—gives the average percent correct of 77% (78–1=77) for students who had the highest score for proficient on the total test.
1. Reporting Cluster 2. Number of Items
4. District Students
5. Proficient Range
3. Average Percent Correct
6. Your Students’ Percent Correct

Part II Report Descriptions | Chapter II.4 The California Report for Teachers
August 2007 2007 STAR Post-Test Guide 97 © 2007 by the California Department of Education
6.. Your Students’ Percent Correct
The diamond symbol shows your students’ average percent correct for this reporting cluster compared to the bar that represents the average percent correct range for students statewide who scored proficient on the total test. Example: On Writing Strategies, the average percent correct for “Your Students” is 83%. In comparison, the range for students statewide who scored proficient on the total CST for ELA is between 47 and 65%. In the sample in this section, your students performed better on Writing Strategies than students statewide who scored proficient on the CST for ELA.
Teacher Report—Front: Reporting Clusters for Improvement This section reviews the reporting clusters and provides an overview of a particular reporting cluster.
Table II.21 STAR Teacher Report: Reporting Clusters for Improvement Section Descriptions
1.. Overview of the reporting clusters
This section of the report gives an overview of the reporting clusters for this grade level and content area.
2.. Focus on a selected reporting cluster
This section lists the content standards for the reporting cluster based on the reporting cluster score that is lowest in relation to the lowest average percent correct for students statewide who scored proficient on the total test. For example, if the statewide cluster A average percent correct is between 60 and 75 and a teacher’s students had an average percent correct of 40, there is a difference of 20 percentage points in the average percent correct (60–40=20). If the statewide average percent correct for cluster B is between 75
1. Overview… 2. Focus…

Part II Report Descriptions | Chapter II.4 The California Report for Teachers
98 2007 STAR Post-Test Guide August 2007 © 2007 by the California Department of Education
and 85% and a teacher’s students scored 50%, there is a 25% difference in the average percent correct (75–50=25). Cluster B would be the subject of the “Focus on...” section. However, please note that the focus calculation also takes the number of items in the cluster into account, so the cluster with the largest difference in average percent correct might not be the subject selected for the Focus.
Teacher Report—Back: 2007 School Results This section shows the percentage of students in the school who scored within each performance level for all students and subgroups of students.
Table II.22 STAR Teacher Report: 2007 School Results Section Descriptions
1.. Performance Standards
The five performance levels and the scale score range for each: advanced, proficient, basic, below basic, or far below basic. The target for all students is to score proficient or advanced. (The scale score is a value from 150 to 600, with 350 as the lowest score for a proficient performance level.)
2.. All Percent of all students tested in group, grade, or class that scored at each performance level.
3.. Subgroups Percent of students for specific subgroups that scored at each performance level.
4.. Total Number of Students
Total number of students in the grade or group.
1. Performance Standards
2. All
3. Subgroups
4. Total Number of Students

Part II Report Descriptions | Chapter II.4 The California Report for Teachers
August 2007 2007 STAR Post-Test Guide 99 © 2007 by the California Department of Education
Teacher Report—Back: School, District, and State Comparisons Use this part of the report to compare the percent of students and subgroups of students in the school that scored proficient and advanced with the district and state results for two years.
Table II.23 STAR Teacher Report: School, District, and State Comparisons Section Descriptions
1.. Groups Percent of students within the subgroup that scored proficient and advanced by school, district, and state.
2.. All Percent of proficient and advanced scores in the grade-level or math course by school, district, and state.
Teacher Report—Back: Resources The bottom portion of page 2 lists additional resources for teachers.
1. Groups
2. All

Part II Report Descriptions | Chapter II.4 The California Report for Teachers
100 2007 STAR Post-Test Guide August 2007 © 2007 by the California Department of Education
Teacher Report—Teacher Grade Report Sample Teacher Grade Report, Page 1 Note: The percentages on this page of the report may be different from last year’s
teacher reports or other numbers that have been made public on the Internet and other places because of rounding or changes in demographic data.

Part II Report Descriptions | Chapter II.4 The California Report for Teachers
August 2007 2007 STAR Post-Test Guide 101 © 2007 by the California Department of Education
Teacher Grade Report, Page 2 Note: The percentages on this page of the report may be different from last year’s
teacher reports or other numbers that have been made public on the Internet and other places because of rounding or changes in demographic data.

Part II Report Descriptions | Chapter II.4 The California Report for Teachers
102 2007 STAR Post-Test Guide August 2007 © 2007 by the California Department of Education
Teacher Report—Teacher Course Report Sample Teacher Course Report, Page 1 Note: The percentages on this page of the report may be different from last year’s
teacher reports or other numbers that have been made public on the Internet and other places because of rounding or changes in demographic data.

Part II Report Descriptions | Chapter II.4 The California Report for Teachers
August 2007 2007 STAR Post-Test Guide 103 © 2007 by the California Department of Education
Teacher Course Report, Page 2 Note: The percentages on this page of the report may be different from last year’s
teacher reports or other numbers that have been made public on the Internet and other places because of rounding or changes in demographic data.

Part II Report Descriptions | Chapter II.5 Internet Reports
104 2007 STAR Post-Test Guide August 2007 © 2007 by the California Department of Education
Chapter II.5 Internet Reports Internet reports summarize performance for various aggregations of students. The Internet reports include summary data by grade and test for schools, districts, counties, and the state. The data reported should match the final summary reports each school, district, and county received. Separate reports are available for each test series:
• CST: percentages of students scoring at each performance level • CAT/6 Survey: percentages of students scoring at or above specific quartiles for
grades 3 and 7 only • CAPA: percentages of students scoring at each performance level • STS: average percent correct for students in grades 2–4 who took the STS • Summary of the percentage of students who performed at proficient or advanced
within a specified testing population The Web site address is http://star.cde.ca.gov/.
Note: A link to Aprenda 3 reports is available at this address, but Aprenda 3 reports are not covered in this documentation.
Dates of Data Availability on the Web Site The Internet report scores will change three times to reflect scoring updates.
August 15, 2007 First preliminary Internet file
This posting will include results for student tests that were received for scoring by July 1. Results for schools and districts that were not received for scoring by July 1 will not be included.
September Second preliminary Internet file
This posting adds reports for districts/ schools processed during August.
December Final Internet file This final posting includes demographic corrections districts made to original student data files. These corrections have no impact on the results for all students. Subgroup reports may be affected by the corrections.
Using the STAR Reporting Web Site Accessing the STAR Reporting Web Site
1. Go to http://star.cde.ca.gov/. Note that this page includes information about the browser requirements for accessing the reports.
2. Click the link STAR 2007 Test Results in the “2007 STAR Test Results” section. The California STAR Program home page opens.
3. Read and use the information provided on this Web page and on the pages accessed by the links and buttons on this Web page to obtain information about the history of the Program, grades and subjects tested, comparing results, etc.

Part II Report Descriptions | Chapter II.5 Internet Reports
August 2007 2007 STAR Post-Test Guide 105 © 2007 by the California Department of Education
Getting Help The STAR Help page contains brief procedures for viewing and printing reports, downloading research files, and explanations of the scores that are reported. Be sure to click Help for complete instructions for using the STAR Reporting Web site. Viewing Reports To access reports to view and/or print: 1. Click the Test Results button in the navigation bar on the left of the California STAR
Program home page. The report search fields open.
2. In the Select a Test drop-down list, click the down arrow and select the test for the
report. Choices are CST, CAT/6 Survey, CAPA, STS, and CST Summary. 3. Select a county from the County drop-down list. Or, for the state report, go to step 6. 4. Select a district from the District drop-down list. This list is not populated until a county
has been selected. 5. Select a school from the School drop-down list. This list is not populated until a district
has been selected. 6. Click the down arrow and select the group from the Group drop-down list. Choices are:
• All Students • Disabilities • Economic Status • English-Language Fluency
• Ethnicity • Gender • Parent Education • Special Program Participation
7. Click the down arrow to select a subgroup from the Sub-Group drop-down list. For example, if “Disabilities” was selected then the option to select from this drop-down is “Student with Disability.” However, if the group selected was “All Students,” there are no items to select.
8. Click the View Report button. The report appears below the search fields. Notes: • There may be a brief delay after selecting a parameter from a drop-down list (like
County) while the report search fields refresh and repopulate with data based on the parameter that was just set.
• The list of charter schools for which results are available may be viewed by clicking the View Charter School List link under the School drop-down list on the right side of the screen.
Part II Report Descriptions | Chapter II.5 Internet Reports
106 2007 STAR Post-Test Guide August 2007 © 2007 by the California Department of Education
Printing Reports To print the displayed report: 1. Click the Print Report button located on the right side at the top or bottom of the
report. The print window for the browser opens. 2. Set the print orientation in the browser to Landscape. 3. Click Print. The report is printed on the assigned printer. Downloading Research Files Research files contain results from the 2007 administration of the STAR Program. Each file contains the same information presented in the Test Results section of the reporting site and is provided to allow for more complex analyses and customized reporting of the data. To download research files: 1. Click the Download Research File button. The list of available research files appears
on the page. 2. Click the Research File Download Instructions, Formats, File Layouts, and Usage link
to access the research file layouts. Available research files are located under the “Research Files” explanatory section.
3. Click a link to select the file to download. The browser’s “File Download” dialog box opens.
4. Follow the prompts to download the file to the computer.

Part II Report Descriptions | Chapter II.5 Internet Reports
August 2007 2007 STAR Post-Test Guide 107 © 2007 by the California Department of Education
STAR Internet Reports
Purpose To provide public access to the STAR results for:
• State • Counties
• Districts • Schools
Format Internet reports are in landscape format. Be sure to set the browser’s print option to landscape orientation.
Action Review STAR results online.
Focus Percentages of students scoring within each performance level for CSTs and CAPA; percent correct for students who have taken the STS; and percentages of students scoring at or above specific quartiles for CAT/6 Survey.
Data displayed in the samples in this guide are for demonstration purposes only and may not reflect valid data.
Report Header
Table II.24 Internet Report Header Descriptions
1.. Group Identifies the group selected for reporting. In the example, “All Students” was selected from the drop-down list.
2.. Total Enrollment on First Day of Testing
Number of multiple-choice answer documents (grades 4–11) plus CST booklets (grades 2 and 3) submitted minus the number of answer documents coded that student enrolled after the first day.
3.. Total Number Tested For the test, number of students that responded to any questions on any test.
4.. Total Number Tested in Selected Subgroup
Number of students tested in the selected subgroup.
5.. Identifying Information
Identifying information on the selected test, including: • County name • District name • School name • CDS code
6.. Test Name Name of the selected test—in the sample, “California Standards Test Scores.”
1. Group 2. Total Enrollment…
3. Total Number Tested
4. Total…Subgroup
5. Identifying Information
6. Test Name

Part II Report Descriptions | Chapter II.5 Internet Reports
108 2007 STAR Post-Test Guide August 2007 © 2007 by the California Department of Education
CST Scores
Note: Data displayed are for demonstration purposes only and may not reflect valid data.
Table II.25 Internet CST Scores Report Descriptions
1.. Grades Grades tested. EOC (End-of-Course) shows totals for high school science and mathematics for all grades in the school, district, county, or state in which students were tested.
2.. Reported Enrollment
Number of multiple-choice answer documents (grades 4–11) or CST booklets (grades 2 and 3) for each grade submitted, minus the number of answer documents or test booklets coded that student enrolled after the first day.
3.. Students Tested Number of students tested, whether or not they received a score.
4.. Percent of Enrollment
Number of students tested in each grade, divided by the number enrolled in the grade, multiplied by 100, and rounded to the nearest whole number.
5.. Subject Subject of the test taken.
6.. Performance Levels Percentage of student scores at each performance level. Performance levels are: advanced, proficient, basic, below basic, or far below basic. The target is for all students to score proficient or advanced.
7.. Students with Scores
Number of students who took CSTs and whose testing resulted in scores. Number includes students who tested with modifications but not:
• incomplete tests • students with inconsistent grades (test did not match student’s
grade level) • unknown EOC math or science test (student did not mark which
test was taken)
1. Grades
2. Reported Enrollment
5. Subject
3. Students Tested
4. Percent of Enrollment
8. Mean Scale Score
6. Performance Levels
7. Students with Scores

Part II Report Descriptions | Chapter II.5 Internet Reports
August 2007 2007 STAR Post-Test Guide 109 © 2007 by the California Department of Education
8.. Mean Scale Score For the test, average of the valid scale scores for the group of students. [(Sum of Valid Scores / Number Valid Scores)] (The CST scale score is a value from 150 to 600 with 350 as the lowest score at the proficient performance level for all grades and subjects.)
CAT/6 Survey Scores
Note: Data displayed are for demonstration purposes only and may not reflect valid data.
Table II.26 Internet CAT/6 Survey Scores Report Descriptions
1.. Grades Grades tested. CAT/6 Survey is only administered to students in grades 3 and 7.
2.. Reported Enrollment Number of CST booklets for grade 3 or multiple-choice answer documents for grade 7 submitted, minus the number of answer documents or test booklets coded that student enrolled after the first day.
3.. NPR for “Avg.” Student Score
National Percentile Rank (NPR) for a hypothetical average student in this school, district, county, or the state.
2. Reported Enrollment
5. Students Tested
3. NPR for “Avg.”…
8. Mean Scale Score
6. Percent Scoring…
7. Students with Scores
1. Grades
4. CAT/6 Subject

Part II Report Descriptions | Chapter II.5 Internet Reports
110 2007 STAR Post-Test Guide August 2007 © 2007 by the California Department of Education
4.. CAT/6 Subject Subject of test taken. Note that students completed a reading/ language test with the results reported as separate reading and language scores.
5.. Students Tested Number of students tested, whether or not they received a score.
6.. Percent Scoring above 25th, at or above 50th, and above 75th National Percentiles
Percentages are calculated as the {[number of students with percentile ranks within the range divided by the total number of students with valid scores on the CAT/6 Survey] * 100, rounded to the nearest whole number}.
7.. Students with Scores Number of students who took the CAT/6 Survey and whose testing resulted in scores. Number includes students who tested with modifications but not:
• incomplete tests • students with inconsistent grades (test did not match
student’s grade level)
8.. Mean Scale Score Average of scale scores for the group of students. On the CAT/6 Survey, the scale score is a value from 1 to 999 that is used to derive other scores.
CAPA Scores: State CAPA Internet reports at the state level are different from the Internet reports at the county, district, and school levels.
• The state report includes a separate table for Level I students.
• The state report shows each grade and performance level.
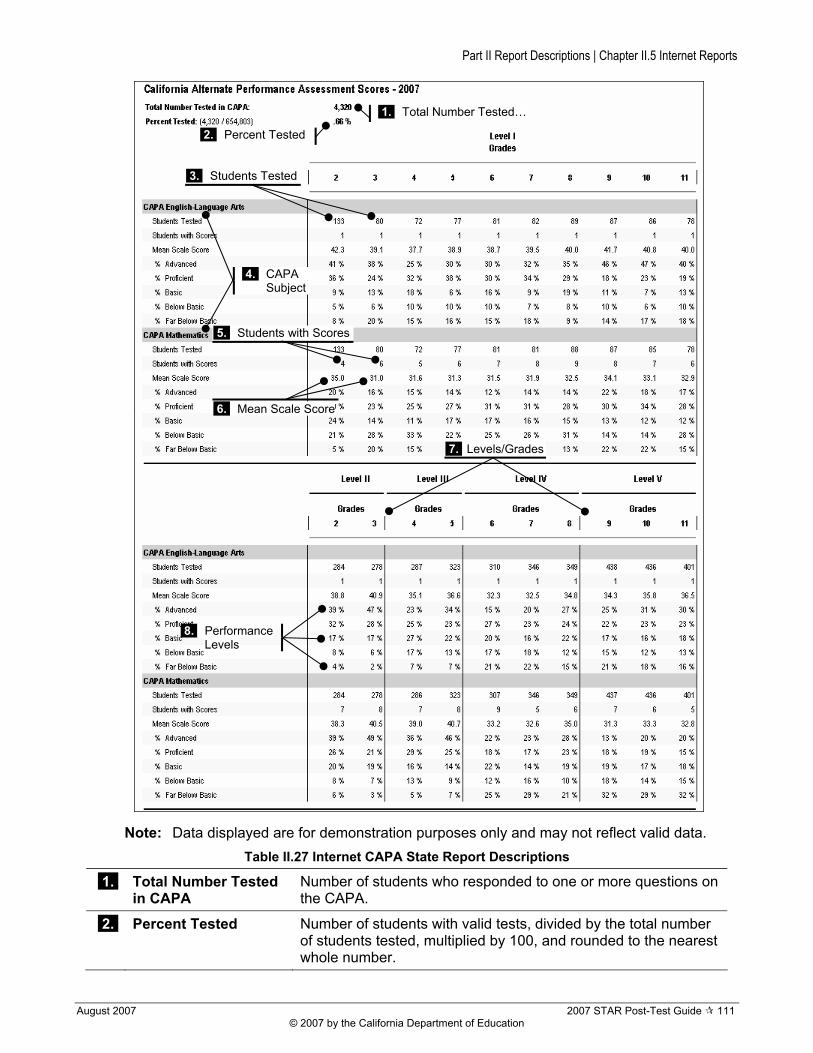
Part II Report Descriptions | Chapter II.5 Internet Reports
August 2007 2007 STAR Post-Test Guide 111 © 2007 by the California Department of Education
Note: Data displayed are for demonstration purposes only and may not reflect valid data.
Table II.27 Internet CAPA State Report Descriptions
1.. Total Number Tested in CAPA
Number of students who responded to one or more questions on the CAPA.
2.. Percent Tested Number of students with valid tests, divided by the total number of students tested, multiplied by 100, and rounded to the nearest whole number.
7. Levels/Grades
1. Total Number Tested…
2. Percent Tested
4. CAPA Subject
3. Students Tested
6. Mean Scale Score
8. Performance Levels
5. Students with Scores

Part II Report Descriptions | Chapter II.5 Internet Reports
112 2007 STAR Post-Test Guide August 2007 © 2007 by the California Department of Education
3.. Students Tested Number of students taking this assessment.
4.. CAPA Subject Subject assessed.
5.. Students with Scores Number of students who took the CAPA and whose testing resulted in scores. Number includes students who tested with modifications but not:
• incomplete tests • students with inconsistent grades (test did not match
student’s grade level)
6.. Mean Scale Score Average of scale scores for the group of students. (The scale score is a value from 15 to 60, with 35 as the lowest score for a proficient performance level for all grades/levels and both subjects.)
7.. Levels/Grades The report is sorted in order by CAPA Assessment Level from Level I to Level V. Within each CAPA level, scores are reported by grade for state reports and by CAPA level for schools, districts, and counties.
8.. Performance Levels Percentage of students scoring at each performance level. Performance levels are: advanced, proficient, basic, below basic, or far below basic. The target is for all students to score proficient or advanced.
CAPA Scores: County, District, or School
Note: Data displayed are for demonstration purposes only and may not reflect valid data.
Table II.28 Internet CAPA County, District, or School Report Descriptions
1.. Levels/Grades The report is sorted in order by CAPA Level from Level I to Level V.
2.. Students Tested Number of students taking this assessment.
3.. CAPA Subject Subject assessed.
1. Levels/Grades
3. CAPA Subject
2. Students Tested
4. Mean Scale Score
6. Percent ...Proficient
5. Students with Scores

Part II Report Descriptions | Chapter II.5 Internet Reports
August 2007 2007 STAR Post-Test Guide 113 © 2007 by the California Department of Education
4.. Mean Scale Score Average of scale scores for the group of students. (The scale score is a value from 15 to 60, with 35 as the lowest score for a proficient performance level.)
5.. Students with Scores
Number of students who took the CAPA and whose testing resulted in scores. Number includes students who tested with modifications but not:
• incomplete tests • students with inconsistent grades (test did not match student’s
grade level)
6.. Percent At or Above Proficient
Percent of students whose scores are at or above proficient for the subject tested. The target is for all students to score proficient or advanced.
STS Scores
Note: Data displayed are for demonstration purposes only and may not reflect valid data.
Table II.29 Internet STS Scores Report Descriptions
1.. Grades Grades tested. (In 2007, only grades 2, 3, and 4 were tested.)
2.. Reported Enrollment Number of multiple-choice answer documents (grade 4) or STS booklets (grades 2 and 3) for each grade submitted, minus the number of answer documents and test booklets coded that student enrolled after the first day.
3.. Students Tested Number of students tested, whether or not they received a score.
4.. Percent of Enrollment
Number of students tested in each grade, divided by the number enrolled in the grade, multiplied by 100, and rounded to the nearest whole number.
5.. Subject Subject of the test taken.
2. Reported Enrollment 3. Students
Tested 4. Percent of
Enrollment
7. Average Percent Correct
6. Students With Scores
1. Grades
5. Subject
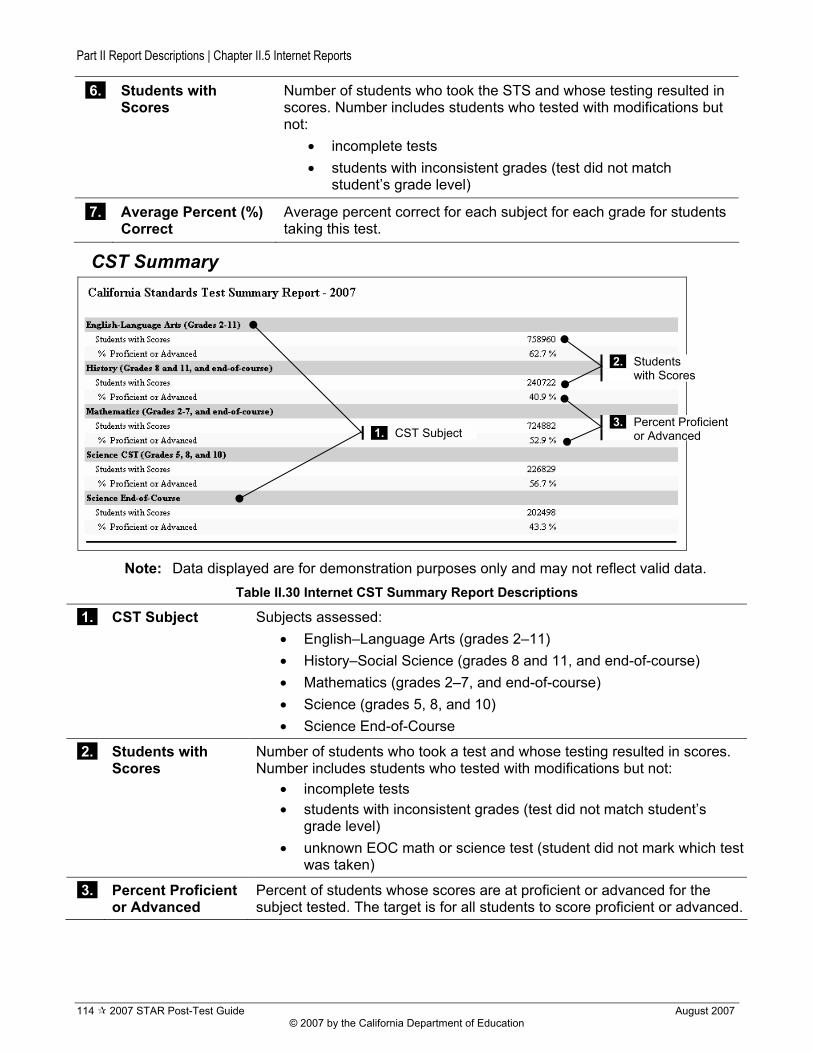
Part II Report Descriptions | Chapter II.5 Internet Reports
114 2007 STAR Post-Test Guide August 2007 © 2007 by the California Department of Education
6.. Students with Scores
Number of students who took the STS and whose testing resulted in scores. Number includes students who tested with modifications but not:
• incomplete tests • students with inconsistent grades (test did not match
student’s grade level)
7.. Average Percent (%) Correct
Average percent correct for each subject for each grade for students taking this test.
CST Summary
Note: Data displayed are for demonstration purposes only and may not reflect valid data.
Table II.30 Internet CST Summary Report Descriptions
1.. CST Subject Subjects assessed: • English–Language Arts (grades 2–11) • History–Social Science (grades 8 and 11, and end-of-course) • Mathematics (grades 2–7, and end-of-course) • Science (grades 5, 8, and 10) • Science End-of-Course
2.. Students with Scores
Number of students who took a test and whose testing resulted in scores. Number includes students who tested with modifications but not:
• incomplete tests • students with inconsistent grades (test did not match student’s
grade level) • unknown EOC math or science test (student did not mark which test
was taken)
3.. Percent Proficient or Advanced
Percent of students whose scores are at proficient or advanced for the subject tested. The target is for all students to score proficient or advanced.
1. CST Subject
2. Students with Scores
3. Percent Proficient or Advanced

PPaarrtt IIIIII AAppppeennddiicceess
Part III Appendices

Part III Appendices | Appendix A: STAR CST Reporting Clusters
116 2007 STAR Post-Test Guide August 2007 © 2007 by the California Department of Education
Appendix A: STAR CST Reporting Clusters The tables in this appendix present the reporting clusters, the number of items in each reporting cluster, and the average percent correct for a sample of students statewide for the 2007 CSTs. The last three columns of each table, labeled “All,” “Minimally Proficient,” and “Minimally Advanced,” provide the expected average percent correct scores on each cluster for a representative sample of the state’s students, as well as the average percent correct for a representative sample of the state’s students who scored at the lowest score for proficient and at the lowest score for advanced on the CSTs (that is, for proficient, a sample of students statewide who obtained a scale score of exactly 350 or the lowest reported scale score above 350; and for advanced, a sample of students statewide who scored at the lowest score for advanced). Because the goal for the state is for all students to score at the proficient level or above, a useful benchmark for interpreting cluster scores is the performance on the cluster for students who scored between minimally proficient and minimally advanced on the total test. These average percent correct values provide information about the relative difficulty of different clusters, which is important to take into account when considering the performance of students in the school or district.

Part III Appendices | Appendix A: STAR CST Reporting Clusters
August 2007 2007 STAR Post-Test Guide 117 © 2007 by the California Department of Education
CSTs for English–Language Arts Reporting Clusters CALIFORNIA ENGLISH–LANGUAGE ARTS STANDARDS TESTS
Number of Questions for 2007 Reporting Clusters and the Average Percent Correct on Each Reporting Cluster
Avg % Correct Statewide
Grade Reporting Cluster No. of
Questions All Minimally Proficient
Minimally Advanced
Grade 2 Word Analysis and Vocabulary Development 22 68 73 88
Reading Comprehension 15 62 67 84
Literary Response and Analysis 6 65 69 88
Written Conventions 14 65 71 91
Writing Strategies 8 57 59 77
Grade 3 Word Analysis and Vocabulary Development 20 67 76 88
Reading Comprehension 15 59 68 87
Literary Response and Analysis 8 65 77 93
Written Conventions 13 63 72 87
Writing Strategies 9 57 68 85
Grade 4 Word Analysis and Vocabulary Development 18 69 73 85
Reading Comprehension 15 61 62 80
Literary Response and Analysis 9 64 67 83
Written Conventions 18 60 62 76
Writing Strategies 15 57 56 76
Writing Applications 1 (8 points) 53 52 57
Grade 5 Word Analysis and Vocabulary Development 14 66 73 87
Reading Comprehension 16 56 58 76
Literary Response and Analysis 12 67 74 87
Written Conventions 17 63 69 81
Writing Strategies 16 55 57 77
Grade 6 Word Analysis and Vocabulary Development 13 63 69 84
Reading Comprehension 17 54 57 74
Literary Response and Analysis 12 58 63 78
Written Conventions 16 62 68 81
Writing Strategies 17 57 63 83

Part III Appendices | Appendix A: STAR CST Reporting Clusters
118 2007 STAR Post-Test Guide August 2007 © 2007 by the California Department of Education
CALIFORNIA ENGLISH–LANGUAGE ARTS STANDARDS TESTS
Number of Questions for 2007 Reporting Clusters and the Average Percent Correct on Each Reporting Cluster
Avg % Correct Statewide
Grade Reporting Cluster No. of
Questions All Minimally Proficient
Minimally Advanced
Grade 7 Word Analysis and Vocabulary Development 11 65 71 84
Reading Comprehension 18 61 66 83
Literary Response and Analysis 13 57 60 78
Written Conventions 16 60 64 79
Writing Strategies 17 59 64 82
Writing Applications 1 (8 points) 67 67 78
Grade 8 Word Analysis and Vocabulary Development 9 67 73 85
Reading Comprehension 18 64 70 84
Literary Response and Analysis 15 60 65 82
Written Conventions 16 60 66 79
Writing Strategies 17 61 67 84
Grade 9 Word Analysis and Vocabulary Development 8 59 63 76
Reading Comprehension 18 64 66 83
Literary Response and Analysis 16 65 69 85
Written Conventions 13 60 63 78
Writing Strategies 20 54 54 71
Grade 10 Word Analysis and Vocabulary Development 8 65 74 85
Reading Comprehension 18 59 69 84
Literary Response and Analysis 16 58 65 81
Written Conventions 13 64 73 83
Writing Strategies 20 61 73 86
Grade 11 Word Analysis and Vocabulary Development 8 63 74 85
Reading Comprehension 19 56 65 80
Literary Response and Analysis 17 54 60 75
Written Conventions 9 65 79 90
Writing Strategies 22 62 75 87

Part III Appendices | Appendix A: STAR CST Reporting Clusters
August 2007 2007 STAR Post-Test Guide 119 © 2007 by the California Department of Education
CSTs for Mathematics Reporting Clusters CALIFORNIA MATHEMATICS STANDARDS TESTS
Number of Questions for 2007 Reporting Clusters and the Average Percent Correct on Each Reporting Cluster
Avg % Correct Statewide
Grade/ Test Reporting Cluster
No. of Questions All
Minimally Proficient
Minimally Advanced
GRADE-LEVEL MATHEMATICS Grade 2 Place Value, Addition, and Subtraction 15 74 75 89
Multiplication, Division, and Fractions 23 74 74 87
Algebra and Functions 6 73 71 90
Measurement and Geometry 14 76 77 88
Statistics, Data Analysis, and Probability 7 71 69 83
Grade 3 Place Value, Fractions, and Decimals 16 74 75 88
Addition, Subtraction, Multiplication, Division 16 70 69 87
Algebra and Functions 12 72 72 89
Measurement and Geometry 16 75 75 86
Statistics, Data Analysis, and Probability 5 83 88 95
Grade 4 Decimals, Fractions, and Negative Numbers 17 74 75 87
Operations and Factoring 14 71 72 89
Algebra and Functions 18 76 79 91
Measurement and Geometry 12 67 66 82
Statistics, Data Analysis, and Probability 4 72 73 86
Grade 5 Estimation, Percents, and Factoring 12 61 60 84
Operations with Fractions and Decimals 17 61 63 83
Algebra and Functions 17 65 69 87
Measurement and Geometry 15 60 61 81
Statistics, Data Analysis, and Probability 4 74 79 95
Grade 6 Ratios, Proportions, Percentages, Negative Fractions 15 57 60 84
Operations and Problem Solving with Fractions 10 65 70 89
Algebra and Functions 19 67 74 89
Measurement and Geometry 10 53 55 80
Statistics, Data Analysis, and Probability 11 53 57 78

Part III Appendices | Appendix A: STAR CST Reporting Clusters
120 2007 STAR Post-Test Guide August 2007 © 2007 by the California Department of Education
CALIFORNIA MATHEMATICS STANDARDS TESTS
Number of Questions for 2007 Reporting Clusters and the Average Percent Correct on Each Reporting Cluster
Avg % Correct Statewide
Grade/ Test Reporting Cluster
No. of Questions All
Minimally Proficient
Minimally Advanced
Grade 7 Rational Numbers 14 58 65 85
Exponents, Powers, and Roots 8 50 54 77
Quantitative Relationships and Evaluating Expressions 10 63 71 83
Multistep Problems, Graphing, and Functions 15 52 58 77
Measurement and Geometry 13 57 63 83
Statistics, Data Analysis, and Probability 5 61 71 86
END-OF-COURSE MATHEMATICS General Math
Rational Numbers 14 49 63 84
Exponents, Powers, and Roots 10 42 55 82
Quantitative Relationships and Evaluating Expressions 11 55 70 83
Multistep Problems, Graphing, and Functions 10 48 64 83
Measurement and Geometry 11 42 57 75
Statistics, Data Analysis, and Probability 9 54 71 81
Algebra I Number Properties, Operations, and Linear Equations 17 54 73 87
Graphing and Systems of Linear Equations 14 44 59 83
Quadratics and Polynomials 21 44 55 79
Functions and Rational Expressions 13 37 45 70
Geometry Logic and Geometric Proofs 23 58 73 90
Volume and Area Formulas 11 51 66 86
Angle Relationships, Constructions, and Lines 16 48 62 84
Trigonometry 15 52 67 84
Algebra II Polynomials and Rational Expressions 19 60 74 90
Quadratics, Conics, and Complex Numbers 17 50 59 80
Exponents and Logarithms 15 52 65 82
Series, Combinatorics, Probability and Statistics 14 44 52 71
Summative High School Math Algebra I 18 73 78 91
Geometry 19 69 72 88
Algebra II 23 70 74 90
Probability and Statistics 5 62 64 81

Part III Appendices | Appendix A: STAR CST Reporting Clusters
August 2007 2007 STAR Post-Test Guide 121 © 2007 by the California Department of Education
CALIFORNIA MATHEMATICS STANDARDS TESTS
Number of Questions for 2007 Reporting Clusters and the Average Percent Correct on Each Reporting Cluster
Avg % Correct Statewide
Grade/ Test Reporting Cluster
No. of Questions All
Minimally Proficient
Minimally Advanced
Integrated Math 1 Number Properties, Operations, and Linear Equations 15 49 72 87
Graphing 9 41 64 84
Quadratics and Polynomials 14 38 61 81
Functions and Rational Expressions 7 36 60 81
Geometry 20 31 54 77
Integrated Math 2 Algebra I 20 39 66 84
Logic and Geometric Proofs 22 40 67 85
Angle Relationships, Constructions, and Lines 8 36 64 84
Trigonometry 10 39 67 85
Algebra II/Probability and Statistics 5 36 63 83
Integrated Math 3 Geometry 5 43 69 85
Polynomials and Rational Expressions 19 42 65 84
Quadratics, Conics, and Complex Numbers 17 40 64 82
Exponents and Logarithms 15 41 67 85
Series, Combinatorics, Probability and Statistics 9 30 53 75

Part III Appendices | Appendix A: STAR CST Reporting Clusters
122 2007 STAR Post-Test Guide August 2007 © 2007 by the California Department of Education
CSTs for Science Reporting Clusters CALIFORNIA SCIENCE STANDARDS TESTS
Number of Questions for 2007 Reporting Clusters and the Average Percent Correct on Each Reporting Cluster
Avg % Correct Statewide
Grade/ Test Reporting Cluster
No. of Questions All
Minimally Proficient
Minimally Advanced
GRADE-LEVEL SCIENCE Grade 5 Science (Grades 4 and 5 Standards) Physical Science, Grade 5 11 63 72 86
Physical Science, Grade 4 8 65 74 90
Life Science, Grade 5 13 60 68 86
Life Science, Grade 4 9 64 75 91
Earth Science, Grade 5 11 58 66 78
Earth Science, Grade 4 8 51 56 80
Grade 8 Science Motion 8 58 62 74
Forces, Density, and Buoyancy 13 58 64 76
Structure of Matter and Periodic Table 16 53 56 72
Earth in the Solar System 7 61 65 78
Reactions and the Chemistry of Living Systems 10 52 55 68
Investigation and Experimentation 6 57 62 74
Grade 10 Life Science Cell Biology 10 51 57 78
Genetics 12 53 60 77
Physiology 10 58 68 83
Ecology 11 58 71 85
Evolution 11 53 64 84
Investigation and Experimentation 6 61 72 84
END-OF-COURSE SCIENCE Biology Cell Biology 9 52 56 76
Genetics 18 55 62 78
Ecology and Evolution 16 54 63 82
Physiology 11 60 70 84
Investigation and Experimentation 6 57 68 82
Chemistry Atomic and Molecular Structure 8 66 76 89
Chemical Bonds, Biochemistry 9 63 72 84
Kinetics, Thermodynamics 14 56 64 81
Chemical Reactions 13 52 61 78

Part III Appendices | Appendix A: STAR CST Reporting Clusters
August 2007 2007 STAR Post-Test Guide 123 © 2007 by the California Department of Education
CALIFORNIA SCIENCE STANDARDS TESTS
Number of Questions for 2007 Reporting Clusters and the Average Percent Correct on Each Reporting Cluster
Avg % Correct Statewide
Grade/ Test Reporting Cluster
No. of Questions All
Minimally Proficient
Minimally Advanced
Conservation of Matter and Stoichiometry 10 57 67 86
Investigation and Experimentation 6 67 82 90
Earth Science Astronomy and Cosmology 12 54 67 82
Solid Earth 14 55 70 83
The Earth’s Energy 28 49 64 84
Investigation and Experimentation 6 56 72 87
Physics Motion and Forces 12 60 66 81
Conservation of Energy and Momentum 12 55 62 77
Heat and Thermodynamics 9 64 74 86
Waves 10 59 67 81
Electric and Magnetic Phenomena 11 54 59 76
Investigation and Experimentation 6 60 67 79
Integrated/Coordinated 1 Biology/Life Sciences 10 49 72 86
Chemistry 15 41 57 75
Earth Sciences 17 53 77 87
Physics 12 37 53 76
Investigation and Experimentation 6 51 79 89
Integrated/Coordinated 2 Biology/Life Sciences 15 47 67 82
Chemistry 6 38 73 87
Earth Sciences 15 46 65 82
Physics 18 34 67 81
Investigation and Experimentation 6 41 71 86
Integrated/Coordinated 3 Biology/Life Sciences 16 38 56 75
Chemistry 23 32 65 81
Earth Sciences 7 45 64 82
Physics 8 31 53 71
Investigation and Experimentation 6 45 70 85

Part III Appendices | Appendix A: STAR CST Reporting Clusters
124 2007 STAR Post-Test Guide August 2007 © 2007 by the California Department of Education
CALIFORNIA SCIENCE STANDARDS TESTS
Number of Questions for 2007 Reporting Clusters and the Average Percent Correct on Each Reporting Cluster
Avg % Correct Statewide
Grade/ Test Reporting Cluster
No. of Questions All
Minimally Proficient
Minimally Advanced
Integrated/Coordinated 4 Biology/Life Sciences 13 46 65 81
Chemistry 10 37 67 82
Earth Sciences 15 43 63 81
Physics 16 38 71 85
Investigation and Experimentation 6 41 67 82

Part III Appendices | Appendix A: STAR CST Reporting Clusters
August 2007 2007 STAR Post-Test Guide 125 © 2007 by the California Department of Education
CSTs for History–Social Science Reporting Clusters CALIFORNIA HISTORY–SOCIAL SCIENCE STANDARDS TESTS
Number of Questions for 2007 Reporting Clusters and the Average Percent Correct on Each Reporting Cluster
Avg % Correct Statewide
Grade/ Test Reporting Cluster
No. of Questions All
Minimally Proficient
Minimally Advanced
Grade 8 (Grades 6, 7, 8 Standards) World History and Geography: Ancient Civilizations 16 52 59 75
Late Antiquity and the Middle Ages 14 51 61 76
Renaissance/Reformation 10 50 56 75
U.S. Constitution and the Early Republic 22 52 61 77
Civil War and Its Aftermath 13 52 62 77
Grade 11 (U.S. History) Foundations of American Political and Social Thought 10 52 60 77
Industrialization and the U.S. Role as a World Power 13 51 58 77
United States Between the World Wars 12 51 60 75
World War II and Foreign Affairs 12 51 60 80
Post-World War II Domestic Issues 13 51 62 75
END-OF-COURSE HISTORY–SOCIAL SCIENCE World History
Development of Modern Political Thought 13 51 63 75
Industrial Expansion and Imperialism 10 53 63 77
Causes and Effects of the First World War 14 50 62 77
Causes and Effects of the Second World War 13 51 63 80
International Developments in the Post-World War II Era 10 45 56 74
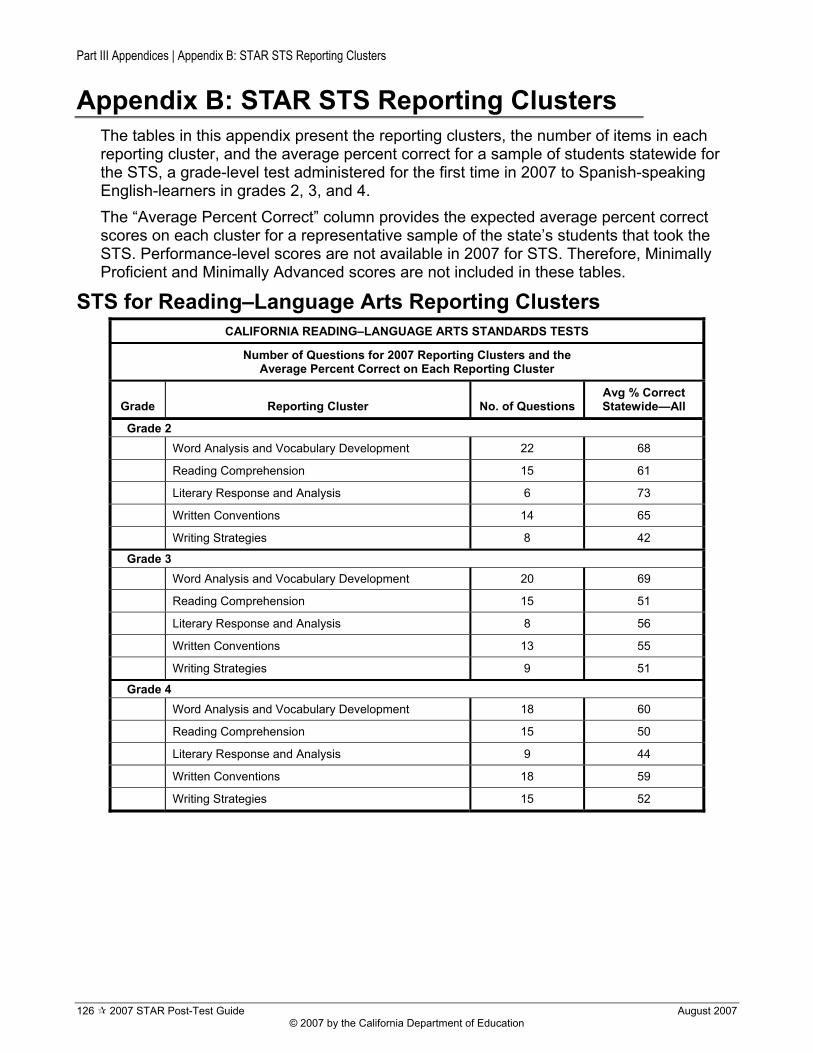
Part III Appendices | Appendix B: STAR STS Reporting Clusters
126 2007 STAR Post-Test Guide August 2007 © 2007 by the California Department of Education
Appendix B: STAR STS Reporting Clusters The tables in this appendix present the reporting clusters, the number of items in each reporting cluster, and the average percent correct for a sample of students statewide for the STS, a grade-level test administered for the first time in 2007 to Spanish-speaking English-learners in grades 2, 3, and 4. The “Average Percent Correct” column provides the expected average percent correct scores on each cluster for a representative sample of the state’s students that took the STS. Performance-level scores are not available in 2007 for STS. Therefore, Minimally Proficient and Minimally Advanced scores are not included in these tables.
STS for Reading–Language Arts Reporting Clusters CALIFORNIA READING–LANGUAGE ARTS STANDARDS TESTS
Number of Questions for 2007 Reporting Clusters and the Average Percent Correct on Each Reporting Cluster
Grade Reporting Cluster No. of Questions Avg % Correct Statewide—All
Grade 2 Word Analysis and Vocabulary Development 22 68
Reading Comprehension 15 61
Literary Response and Analysis 6 73
Written Conventions 14 65
Writing Strategies 8 42
Grade 3 Word Analysis and Vocabulary Development 20 69
Reading Comprehension 15 51
Literary Response and Analysis 8 56
Written Conventions 13 55
Writing Strategies 9 51
Grade 4 Word Analysis and Vocabulary Development 18 60
Reading Comprehension 15 50
Literary Response and Analysis 9 44
Written Conventions 18 59
Writing Strategies 15 52

Part III Appendices | Appendix B: STAR STS Reporting Clusters
August 2007 2007 STAR Post-Test Guide 127 © 2007 by the California Department of Education
STS for Mathematics Reporting Clusters CALIFORNIA MATHEMATICS STANDARDS TESTS
Number of Questions for 2007 Reporting Clusters and the Average Percent Correct on Each Reporting Cluster
Grade/ Test Reporting Cluster No. of Questions
Avg % Correct Statewide—All
Grade 2 Place Value, Addition, and Subtraction 15 67
Multiplication, Division, and Fractions 23 66
Algebra and Functions 6 63
Measurement and Geometry 14 75
Statistics, Data Analysis, and Probability 7 71
Grade 3 Place Value, Fractions, and Decimals 16 66
Addition, Subtraction, Multiplication, Division 16 69
Algebra and Functions 12 63
Measurement and Geometry 14 71
Statistics, Data Analysis, and Probability 5 76
Grade 4 Decimals, Fractions, and Negative Numbers 17 66
Operations and Factoring 14 57
Algebra and Functions 18 63
Measurement and Geometry 12 60
Statistics, Data Analysis, and Probability 4 54

Part III Appendices | Appendix C: STAR CST Scale Score Ranges
128 2007 STAR Post-Test Guide August 2007 © 2007 by the California Department of Education
Appendix C: STAR CST Scale Score Ranges Performance Level Scale Score Ranges—CSTs Content
Area Grade/Test Far Below
Basic Below Basic Basic Proficient Advanced
English–Language Arts
2 150 – 261 262 – 299 300 – 349 350 – 401 402 – 600
3 150 – 258 259 – 299 300 – 349 350 – 401 402 – 600
4 150 – 268 269 – 299 300 – 349 350 – 392 393 – 600
5 150 – 270 271 – 299 300 – 349 350 – 394 395 – 600
6 150 – 267 268 – 299 300 – 349 350 – 393 394 – 600
7 150 – 262 263 – 299 300 – 349 350 – 400 401 – 600
8 150 – 265 266 – 299 300 – 349 350 – 394 395 – 600
9 150 – 264 265 – 299 300 – 349 350 – 396 397 – 600
10 150 – 262 263 – 299 300 – 349 350 – 391 392 – 600
11 150 – 258 259 – 299 300 – 349 350 – 395 396 – 600
Mathematics
2 150 – 235 236 – 299 300 – 349 350 – 413 414 – 600
3 150 – 235 236 – 299 300 – 349 350 – 413 414 – 600
4 150 – 244 245 – 299 300 – 349 350 – 400 401 – 600
5 150 – 247 248 – 299 300 – 349 350 – 429 430 – 600
6 150 – 252 253 – 299 300 – 349 350 – 414 415 – 600
7 150 – 256 257 – 299 300 – 349 350 – 413 414 – 600
General Mathematics 150 – 256 257 – 299 300 – 349 350 – 413 414 – 600
Note: The General Mathematics Standards Test assesses grade 8 and 9 students’ knowledge of California’s Grade 6 and 7 Mathematics Content Standards. Students who are not yet in Algebra I or who are taking the first year of a two-year Algebra I course take this test.
Algebra I 150 – 252 253 – 299 300 – 349 350 – 427 428 – 600
Geometry 150 – 246 247 – 299 300 – 349 350 – 417 418 – 600
Algebra II 150 – 256 257 – 299 300 – 349 350 – 415 416 – 600
Summative High School Mathematics 150 – 234 235 – 299 300 – 349 350 – 419 420 –600
Integrated Mathematics 1 150 – 248 249 – 299 300 – 349 350 – 424 425 – 600
Integrated Mathematics 2 150 – 257 258 – 299 300 – 349 350 – 417 418 – 600
Integrated Mathematics 3 150 – 251 252 – 299 300 – 349 350 – 427 428 – 600
Part III Appendices | Appendix C: STAR CST Scale Score Ranges
August 2007 2007 STAR Post-Test Guide 129 © 2007 by the California Department of Education
Content Area Grade/Test
Far Below Basic
Below Basic Basic Proficient Advanced
Science
Grade 5 Grade 4 – 5 Standards 150 267 268 299 300 349 350 409 410 600
Grade 8 Science 150 – 252 253 – 299 300 – 349 350 – 402 403 – 600
Grade 10 Life Science 150 – 268 269 – 299 300 – 349 350 – 398 399 – 600
Earth Science 150 – 276 277 – 299 300 – 349 350 – 392 393 – 600
Biology 150 – 275 276 – 299 300 – 349 350 – 393 394 – 600
Chemistry 150 – 275 276 – 299 300 – 349 350 – 393 394 – 600
Physics 150 – 275 276 – 299 300 – 349 350 – 392 393 – 600
Integrated/Coordinated Science 1 150 – 276 277 – 299 300 – 349 350 – 389 390 – 600
Integrated/Coordinated Science 2 150 – 277 278 – 299 300 – 349 350 – 390 391 – 600
Integrated/Coordinated Science 3 150 – 275 276 – 299 300 – 349 350 – 390 391 – 600
Integrated/Coordinated Science 4 150 – 275 276 – 299 300 – 349 350 – 396 397 – 600
History–Social Science
Grade 8 Grade 6–8 Standards 150 – 270 271 – 299 300 – 349 350 – 395 396 – 600
Grade 11 United States History 150 – 269 270 – 299 300 – 349 350 – 400 401 – 600
World History 150 – 274 275 – 299 300 – 349 350 – 399 400 – 600

Part III Appendices | Appendix D: STAR CST Conditional Standard Errors of Measurement (CSEM)
130 2007 STAR Post-Test Guide August 2007 © 2007 by the California Department of Education
Appendix D: STAR CST Conditional Standard Errors of Measurement (CSEM) Scale Score CSEM for the 2007 California Standards Tests
Below Basic Basic Proficient Advanced Subject Area Test Name Min SS CSEM Min SS CSEM Min SS CSEM Min SS CSEM
2 262 14 300 13 350 14 402 18 3 259 15 300 14 350 16 402 20
*4 269 13 300 13 350 13 393 15 5 271 13 300 13 350 13 395 15 6 268 13 300 13 350 13 394 15
*7 263 15 300 13 350 14 401 16 8 266 15 300 14 350 14 395 17 9 265 15 300 13 350 14 397 17
10 263 13 300 13 350 14 392 16
English–Language Arts
11 259 15 300 14 350 15 396 18 * Including writing prompt
2 236 18 300 17 350 19 414 25 3 236 17 300 17 350 18 414 23 4 245 15 300 13 350 15 401 20 5 248 19 300 18 350 19 430 23 6 253 17 300 15 350 16 415 20 7 257 17 300 16 350 17 414 20
General Mathematics 257 17 300 16 350 17 414 20 Algebra I 253 20 300 18 350 18 428 22 Geometry 247 17 300 15 350 16 418 21 Algebra II 257 18 300 18 350 18 416 22
High School Mathematics 235 17 300 16 350 18 420 25 Integrated Mathematics 1 249 20 300 19 350 19 425 23 Integrated Mathematics 2 258 20 300 18 350 17 418 20
Mathematics
Integrated Mathematics 3 252 22 300 20 350 20 428 23
5 268 16 300 16 350 17 410 21 8 253 24 300 23 350 23 403 25 10 269 16 300 15 350 16 399 19
Biology 276 15 300 13 350 13 394 16 Chemistry 276 14 300 13 350 14 394 17
Earth Science 277 14 300 14 350 14 393 17
Science
Physics 276 14 300 14 350 14 393 16
8 271 16 300 15 350 15 396 17 World History 275 17 300 18 350 17 400 20 History–Social
Science 11 270 19 300 18 350 17 401 20
Note: CSEMs for Integrated Science are not included.

Part III Appendices | Appendix E: CAPA Scale Score Ranges
August 2007 2007 STAR Post-Test Guide 131 © 2007 by the California Department of Education
Appendix E: CAPA Scale Score Ranges Performance Level Scale Score Ranges—CAPA
Content Area Level Far Below
Basic Below Basic Basic Proficient Advanced
English–Language Arts
I 15 – 25 26 – 29 30 – 34 35 – 45 46 – 60
II 15 – 23 24 – 29 30 – 34 35 – 40 41 – 60
III 15 – 22 23 – 29 30 – 34 35 – 40 41 – 60
IV 15 – 24 25 – 29 30 – 34 35 – 40 41 – 60
V 15 – 24 25 – 29 30 – 34 35 – 41 42 – 60
Mathematics
I 15 – 20 21 – 29 30 – 34 35 – 42 43 – 60
II 15 – 25 26 – 29 30 – 34 35 – 40 41 – 60
III 15 – 24 25 – 29 30 – 34 35 – 42 43 – 60
IV 15 – 25 26 – 29 30 – 34 35 – 40 41 – 60
V 15 – 26 27 – 29 30 – 34 35 – 40 41 – 60

Part III Appendices | Appendix F: Normal Curve Equivalent (NCE) Ranges Corresponding to Percentile Ranks
132 2007 STAR Post-Test Guide August 2007 © 2007 by the California Department of Education
Appendix F: Normal Curve Equivalent (NCE) Ranges Corresponding to Percentile Ranks NCE Ranges Corresponding to Percentile Ranks
NCE Range
Percentile Rank
NCE Range
Percentile Rank
NCE Range
Percentile Rank
NCE Range
Percentile Rank
0.1 – 4.2 1 36.2 – 36.7 26 50.3 – 50.7 51 64.6 – 65.2 76
4.3 – 8.7 2 36.8 – 37.4 27 50.8 – 51.3 52 65.3 – 65.9 77
8.8 – 11.8 3 37.5 – 38.0 28 51.4 – 51.8 53 66.0 – 66.6 78
11.9 – 14.2 4 38.1 – 38.6 29 51.9 – 52.3 54 66.7 – 67.3 79
14.3 – 16.3 5 38.7 – 39.2 30 52.4 – 52.9 55 67.4 – 68.1 80
16.4 – 18.1 6 39.3 – 39.8 31 53.0 – 53.4 56 68.2 – 68.8 81
18.2 – 19.6 7 39.9 – 40.4 32 53.5 – 53.9 57 68.9 – 69.6 82
19.7 – 21.0 8 40.5 – 41.0 33 54.0 – 54.5 58 69.7 – 70.5 83
21.1 – 22.3 9 41.1 – 41.5 34 54.6 – 55.0 59 70.6 – 71.3 84
22.4 – 23.5 10 41.6 – 42.1 35 55.1 – 55.6 60 71.4 – 72.2 85
23.6 – 24.7 11 42.2 – 42.7 36 55.7 – 56.1 61 72.3 – 73.2 86
24.8 – 25.7 12 42.8 – 43.2 37 56.2 – 56.7 62 73.3 – 74.2 87
25.8 – 26.7 13 43.3 – 43.8 38 56.8 – 57.2 63 74.3 – 75.2 88
26.8 – 27.7 14 43.9 – 44.3 39 57.3 – 57.8 64 75.3 – 76.4 89
27.8 – 28.6 15 44.4 – 44.9 40 57.9 – 58.4 65 76.5 – 77.6 90
28.7 – 29.4 16 45.0 – 45.4 41 58.5 – 58.9 66 77.7 – 78.9 91
29.5 – 30.3 17 45.5 – 46.0 42 59.0 – 59.5 67 79.0 – 80.3 92
30.4 – 31.1 18 46.1 – 46.5 43 59.6 – 60.1 68 80.4 – 81.8 93
31.2 – 31.8 19 46.6 – 47.0 44 60.2 – 60.7 69 81.9 – 83.6 94
31.9 – 32.6 20 47.1 – 47.6 45 60.8 – 61.3 70 83.7 – 85.7 95
32.7 – 33.3 21 47.7 – 48.1 46 61.4 – 61.9 71 85.8 – 88.1 96
33.4 – 34.0 22 48.2 – 48.6 47 62.0 – 62.5 72 88.2 – 91.2 97
34.1 – 34.7 23 48.7 – 49.2 48 62.6 – 63.2 73 91.3 – 95.7 98
34.8 – 35.4 24 49.3 – 49.7 49 63.3 – 63.8 74 95.8 – 99.9 99
35.5 – 36.1 25 49.8 – 50.2 50 63.9 – 64.5 75

Part III Appendices | Appendix G: Parent/Guardian or District Request for Verification of 2007 Test Score
August 2007 2007 STAR Post-Test Guide 133 © 2007 by the California Department of Education
Appendix G: Parent/Guardian or District Request for Verification of 2007 Test Score
Parents/guardians or district STAR coordinators may question 2007 CST, CAT/6 Survey, or STS scores for individual students. The following directions and the “Parent/Guardian or District Request for Verification of 2007 CST-CAT/6 Survey or STS Test Score” form on page 135 are to be used to request having the tests rescored. Parents/guardians or district STAR coordinators may request and pay for having multiple-choice tests for any content area or grade hand scored and/or writing tests rescored. The charge for hand scoring a multiple-choice test is $52, whether the parent/guardian or district STAR coordinator requests that one or all multiple-choice content areas be hand scored. The charge for rescoring a writing test is $90. The parent/guardian or district STAR coordinator is responsible for submitting a completed “Parent/Guardian or District Request for Verification of 2007 CST-CAT/6 Survey or STS Test Score” form with a certified check or money order to cover the cost(s). The cost(s) will be fully refunded if the test score is changed as a result of the verification. Requests must be received by October 12, 2007, because answer documents are scheduled to be destroyed on November 1, 2007. The process to request hand-scored verification of a 2007 test score is: 1. The STAR test site coordinator or a school administrator should complete Section A of
the “Parent/Guardian or District Request for Verification of 2007 Test Score” form on page 135. a. If the request is to have the multiple-choice test hand scored, the content area(s)
should be specified by the requestor. If tests are not specified, all tests the student took will be hand scored. The charge is the same whether the request is for one or all multiple-choice content areas to be hand scored.
b. If the request is to have the Grade 4 or 7 Writing Applications Standards component rescored, the STAR test site coordinator or an administrator is responsible for verifying that the student’s overall California English–Language Arts Standards Test score is basic (scale score of 300 through 349) and that a change in the Writing Applications score may result in changing the student’s overall ELA score to proficient. Use the following table to determine if an increase in the student’s Writing Applications score might change the overall California English–Language Arts Standards Test score to proficient. Please keep in mind that the numerical increase in the raw score for the CST for ELA will translate into a larger-than-two-point increase in scale scores. For example, a student in grade 4 must have a scale score for ELA of at least 345 with an expected increase of two in the Writing score to have a possible score change of basic to proficient.
Part III Appendices | Appendix G: Parent/Guardian or District Request for Verification of 2007 Test Score
134 2007 STAR Post-Test Guide August 2007 © 2007 by the California Department of Education
CST for Grade 4 ELA Scale Score
CST for Grade 7 ELA Scale Score
Minimum Increase Required in Writing Score to Change
ELA Score to Proficient 346 346 +2 339 339 +4 333 332 +6
2. If the parent/guardian is the requestor, ensure that a school administrator signs the form.
3. If the parent/guardian is the requestor, meet with the parent/guardian to explain that the parent/guardian is responsible for: a. Paying all cost(s) associated with having the student’s score verified. The cost(s)
will be refunded if the student’s score changes as a result of the verification. b. Completing Section B of the form. c. Mailing the form with a certified check or money order to ETS at the address
printed on the form. 4. If the district STAR coordinator is the requestor, the district is responsible for:
a. Paying all cost(s) associated with having the student’s score verified. The cost(s) will be refunded if the student’s score changes as a result of the verification.
b. Completing Section B of the form. c. Mailing the form with a certified check or money order to ETS at the address
printed on the form. ETS will send the results of the score verification to the parent/guardian and the district.
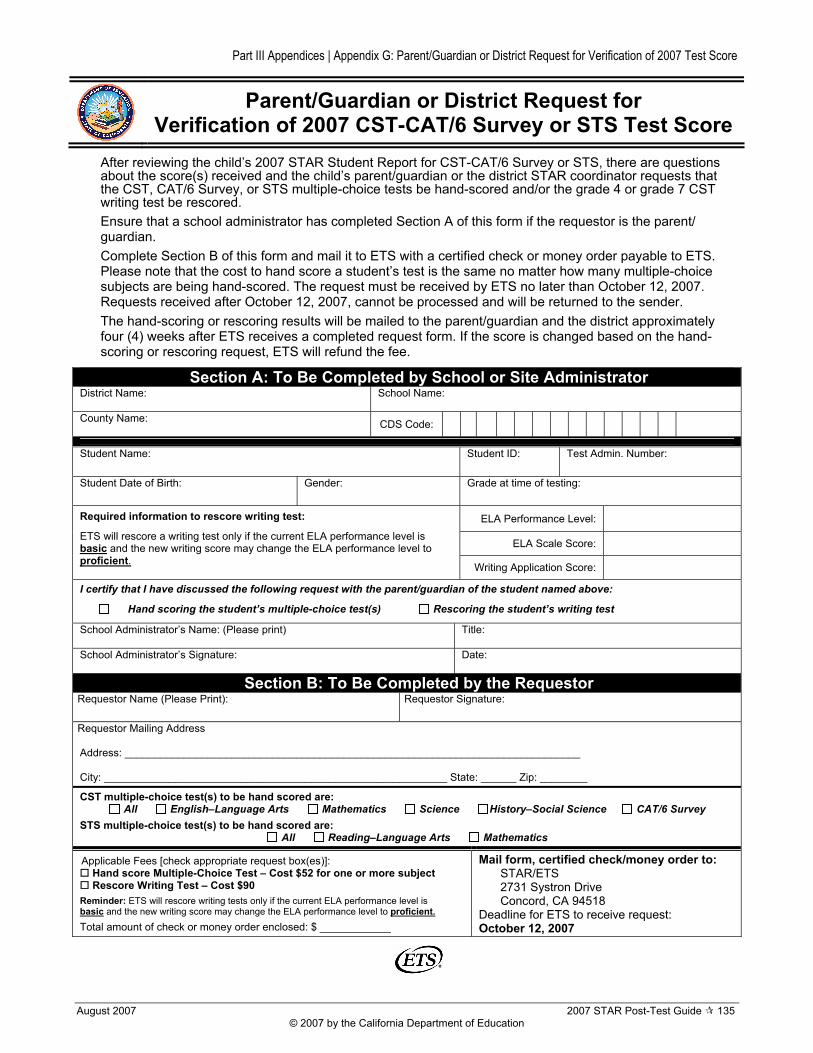
Part III Appendices | Appendix G: Parent/Guardian or District Request for Verification of 2007 Test Score
August 2007 2007 STAR Post-Test Guide 135 © 2007 by the California Department of Education
Parent/Guardian or District Request for Verification of 2007 CST-CAT/6 Survey or STS Test Score
After reviewing the child’s 2007 STAR Student Report for CST-CAT/6 Survey or STS, there are questions about the score(s) received and the child’s parent/guardian or the district STAR coordinator requests that the CST, CAT/6 Survey, or STS multiple-choice tests be hand-scored and/or the grade 4 or grade 7 CST writing test be rescored. Ensure that a school administrator has completed Section A of this form if the requestor is the parent/ guardian. Complete Section B of this form and mail it to ETS with a certified check or money order payable to ETS. Please note that the cost to hand score a student’s test is the same no matter how many multiple-choice subjects are being hand-scored. The request must be received by ETS no later than October 12, 2007. Requests received after October 12, 2007, cannot be processed and will be returned to the sender. The hand-scoring or rescoring results will be mailed to the parent/guardian and the district approximately four (4) weeks after ETS receives a completed request form. If the score is changed based on the hand-scoring or rescoring request, ETS will refund the fee.
Section A: To Be Completed by School or Site Administrator District Name:
School Name:
County Name: CDS Code:
Student Name:
Student ID:
Test Admin. Number:
Student Date of Birth:
Gender:
Grade at time of testing:
ELA Performance Level:
ELA Scale Score:
Required information to rescore writing test:
ETS will rescore a writing test only if the current ELA performance level is basic and the new writing score may change the ELA performance level to proficient. Writing Application Score:
I certify that I have discussed the following request with the parent/guardian of the student named above:
Hand scoring the student’s multiple-choice test(s) Rescoring the student’s writing test
School Administrator’s Name: (Please print)
Title:
School Administrator’s Signature:
Date:
Section B: To Be Completed by the Requestor Requestor Name (Please Print):
Requestor Signature:
Requestor Mailing Address Address: _____________________________________________________________________________ City: __________________________________________________________ State: ______ Zip: ________
CST multiple-choice test(s) to be hand scored are: All English–Language Arts Mathematics Science History–Social Science CAT/6 Survey
STS multiple-choice test(s) to be hand scored are: All Reading–Language Arts Mathematics
Applicable Fees [check appropriate request box(es)]: Hand score Multiple-Choice Test – Cost $52 for one or more subject Rescore Writing Test – Cost $90
Reminder: ETS will rescore writing tests only if the current ELA performance level is basic and the new writing score may change the ELA performance level to proficient. Total amount of check or money order enclosed: $ ____________
Mail form, certified check/money order to:
STAR/ETS 2731 Systron Drive Concord, CA 94518
Deadline for ETS to receive request: October 12, 2007

Part III Appendices | Appendix H: Request to Correct 2007 STAR CST-CAT/6 Survey and CAPA Demographic Data
136 2007 STAR Post-Test Guide August 2007 © 2007 by the California Department of Education
Appendix H: Request to Correct 2007 STAR CST-CAT/6 Survey and CAPA Demographic Data Correcting Demographic Data
During August, the California Department of Education (CDE) distributed Academic Accountability (API/AYP) Data Review Report information to districts and gave districts access to a data review Web site. Districts opting to correct data errors for the CSTs, CAT/6 Survey, and the CAPA are to submit a “Request to Correct 2007 STAR (CST-CAT/6 Survey and CAPA) Demographic Data” to the ETS STAR Technical Assistance Center. Use the form to indicate that the district will be submitting information to:
• Correct student demographic data • Match fourth and seventh grade writing tests with multiple-choice tests • Match third grade CST and CAT/6 Survey results • Correct the identification of “unknown” or mislabeled CSTs for math (grades 7–11)
or science (grades 9–11) and have them scored or rescored The district may correct any of the allowed demographic data fields for a test administration. (See “Fields That May Be Corrected.”) Please note that:
• The corrected data will be re-aggregated and re-posted on the Internet during December.
• The corrected data will be forwarded to the CDE. • The district may request reprints of Summary Reports, Student Record Labels, and
student data on CD. • STS test data is not available for correction. Because students who took the STS
also took the CST, their student data is available for correction.
Timeline Beginning of August 2007 Forms available to request demographic data corrections
Early to mid-September 2007 First day for districts to enter corrections
October 12, 2007 Last day for ETS to receive “Request to Correct STAR … 2007 Demographic Data” form
October 31, 2007 Last day for districts to enter corrections
This is the district’s primary opportunity to correct these data. ETS will give Internet STAR Management System access to districts requesting the service. Records for all administrations will be available for correction, but districts will only be charged for the records within administration periods for which changes are made. The following services and associated fees are for the CST-CAT/6 Survey and the CAPA. The costs include corrections for one or more data fields. The cost per student applies to all students tested in the district for each administration period for which corrections are being made, including students with no corrections.

Part III Appendices | Appendix H: Request to Correct 2007 STAR CST-CAT/6 Survey and CAPA Demographic Data
August 2007 2007 STAR Post-Test Guide 137 © 2007 by the California Department of Education
CST End-of-Course Corrections Each mathematics and science end-of-course test has a code that identifies the course for the test. This code identifies the appropriate answer key to be used for machine scoring. If this code was incorrect or missing from answer documents, tests were either incorrectly scored or not scored at all. The district can change the code to correctly identify the end-of-course mathematics or science test taken.
• The end-of-course tests will be re-scored using the correct key. • The district may request reprints of Summary Reports and Student Record Labels. • The district may request reports of the individual students’ scale scores and
performance levels.
Fields That May Be Corrected Update rules will be included with the Demographic Data Correction File Layout for CST-CAT/6 Survey and CAPA in the Demographic Data Corrections Manual. The CDE will distribute Academic Accountability (API/AYP) Data Review Report information to districts and give districts access to a data review Web site. Districts opting to correct data errors for the CSTs, CAT/6 Survey, and the CAPA are to submit a “Request to Correct 2007 STAR CST-CAT/6 Survey and CAPA Demographic Data” form to the STAR Technical Assistance Center (STAR TAC). Use this form, which is found on page 139, to indicate that the district will be submitting information to:
• Correct student demographic data • Match grades four or seven writing tests with multiple-choice tests • Match grade three CST and CAT/6 Survey results • Correct the identification of “unknown” or mislabeled CSTs for mathematics
(grades 7–11) or science (grades 9–11) and have them scored or rescored The lists that follow include information about correctable and noncorrectable data in the district’s Student Data File. Districts also have the option of correcting fields that are not specifically listed.
Fields used for API and/or AYP calculations that may be corrected are:
Demographic fields that may not be corrected are:
• SSID • County/District Code of Residence for students with IEPs • Special Testing Conditions, except for certain fields • Student’s English Proficiency • English Learner Date First Enrolled in U.S. School • R-FEP students in grades 5–11 scored PRO or ADV 3
years on CST for ELA • N.S.L.P. • Primary Disability (3-digit primary disability code; 000=no
reported disability) • Primary Ethnicity • Parent Education Level • Attends Nonpublic School • Modifications Used • Special Conditions • District of Residence • Adult Testing Irregularities
• County District School Code • District Name • School Name • School Code • Grade Level of Test Taken* (* Enrollment
grade may be changed.) • Braille

Part III Appendices | Appendix H: Request to Correct 2007 STAR CST-CAT/6 Survey and CAPA Demographic Data
138 2007 STAR Post-Test Guide August 2007 © 2007 by the California Department of Education
Fields used for API and/or AYP calculations that may be corrected are:
• Inappropriate Test Preparation • CBEDS Enrollment—District • CBEDS Enrollment—School • CST Mathematics Test Taken • CST Science Test Taken • CAPA Level
Costs • $630 set-up fee for CST-CAT/6 Survey and CAPA • $ .16 per student for every student with or without corrections in the administration
period(s) for which corrections are made The district can order reports to be reprinted with the corrected data. Order reports by test administration. The cost per student is charged for CST-CAT/6 Survey and CAPA students tested within the administration.
Report Cost per Student Student Reports (CST, CAPA, STS) (paper) ** $1.50 Student Reports (CST, CAPA, STS) (DVD-ROM) ** $0.25 Student Record Label ** $0.80 Student Master List ** $0.60 Group Summary CAT/6 Survey, District level $0.85 Group Summary CAT/6 Survey, School level $0.85 Student Master List Summary, District level $0.60 Student Master List Summary, School level $0.60 Subgroup Summaries $0.85 Student Master List Summary: CST End-of-Course Results(mathematics, science, and history–social science)
$0.60
Student Data File on CD-ROM $0.32 ** Order these reports only if the district STAR coordinator will forward the reports to the schools where the students were tested. Do not order them for district office use. Reports cannot be ordered for individual students.
Corrections Procedure 1. Complete and mail the appropriate “Request to Correct 2007
STAR…Demographic Data” to the ETS STAR Technical Assistance Center by October 11, 2007, or fax the request by October 12, 2007.
2. When the district’s file is available for corrections, a STAR TAC representative will contact the district STAR coordinator with a username and password to access the STAR Management System Demographic Data Corrections module.
3. After receiving the username and password, login to the STAR Management System (visit http://www.startest.org and click the External Links button on the left navigation bar, then click the appropriate link in the “STAR Management System” section) to correct individual student records online or to download and correct the entire file.
IMPORTANT If downloading and correcting the entire file, use text file (.txt) format only. Do not edit data in Microsoft Excel or any other ap-plication that could potentially reformat the data. Be sure to upload the entire cor-rected text file (.txt), including the header and trailer records. Do not change the se-quence of any of the records in the file.

Part III Appendices | Appendix H: Request to Correct 2007 STAR CST-CAT/6 Survey and CAPA Demographic Data
August 2007 2007 STAR Post-Test Guide 139 © 2007 by the California Department of Education
Request to Correct 2007 STAR CST-CAT/6 Survey and CAPA Demographic Data Form
County Code: District Code:
District Name:
Purchase Order #: Administration Period(s): A purchase order is required before corrections can be processed. Submit P.O. with this form.
Make CST-CAT/6 Survey corrections via Internet ($630 set-up fee + $.16 per student for all students within each administration period for which any records are being corrected)
Reprint CST-CAT/6 Survey reports for administration period # Students Costs Total Cost
Set-up fee and per student costs for correcting CST-CAT/6 Survey and CAPA data files
$630 plus $.16 per student per admin
# Students
Report Name Use this section to order reports for
demographic corrections only. Price per Student
Total Cost (# Students x
Price per Student) STAR Student Reports (paper) 1.50 STAR Student Reports (PDF on DVD-ROM) .25 Student Record Label .80 Student Master List .60 Group Summary CAT/6 Survey, School level .85 Group Summary CAT/6 Survey, District level .85 Student Master List Summary CST, School level .60 Student Master List Summary CST, District level .60 Subgroup Summaries .85 Master List Summary: CST End-of-Course Results (math,
science, history–social science), School level .60
Master List Summary: CST End-of-Course Results (math, science, history–social science), District level
.60
Student Data File CD .32 Total Cost for Order
District STAR Coordinator (Print name) District STAR Coordinator (Signature)
Date
District Superintendent (Print name) District Superintendent (Signature)
Date
Fax form by October 12, 2007, to: 800-541-8455
OR Mail form by October 11, 2007, to: ETS STAR Technical Assistance Center 2731 Systron Drive Concord, CA 94518 Attn.: Data Corrections

Part III Appendices | Appendix I: California Reading List Number
140 2007 STAR Post-Test Guide August 2007 © 2007 by the California Department of Education
Appendix I: California Reading List Number Using the California Reading List Web Site
Individual CST reports like the STAR Student Report show a recommended reading list number from 1 to 13+ that may be used to obtain a list of books for the student to read independently.
The California Reading List (CRL) Number is based on the student’s score for the CST for English–Language Arts. CRL numbers are limited by the difficulty level of the test, as well as by the student’s score on the test. CRL numbers are not a reading grade level. To look up a CRL for a student: 1. Go to the STAR home page: http://star.cde.ca.gov. 2. Click on the first link, California Reading List. 3. Read the introductory information about the California Reading List. 4. Click on the link Search for a reading list. The California Reading List Search page
opens.
5. Click the down arrow for the Grade Level drop-down list to select the student’s grade. 6. Click the down arrow for the Reading List # drop-down list and select the CRL number
from the student’s STAR Student Report. 7. Enter a keyword to limit the search to certain titles or authors or skip the Keywords
field.

Part III Appendices | Appendix I: California Reading List Number
August 2007 2007 STAR Post-Test Guide 141 © 2007 by the California Department of Education
8. Click the Find It! button. The California Reading List Search Results page displays the search results. Note: “NP” is printed in the Reading List # column for books that include nonstandard
prose. These are books of poems, plays and songs, or books with incorrect or no punctuation.
9. For more information about a specific book—for example, Across the Lines—click the
book’s title, which is a hypertext link. The Book Summary page opens.
This page includes the following additional information about the book: • Availability: In the sample above, the book is available at both the library and at
bookstores. Books marked Library but not Purchase are those that may be out of print and are generally not available at bookstores. A book marked Purchase is available at bookstores and/or Web sites that sell books, as well as at the library.
• Summary: A brief summary of the book. • Type of Book: The type of reading material, such as nonfiction, fiction, fantasy, or
poetry. A school subject will also appear for books that relate directly to subjects, such as history, science, or English–language arts/writing.

Part III Appendices | Appendix J: Glossary of Statistical Terms
142 2007 STAR Post-Test Guide August 2007 © 2007 by the California Department of Education
Appendix J: Glossary of Statistical Terms average percent correct
The sum of actual correct items by all students—raw scores—in the group who have a valid score, divided by the total number of items in the group of questions being analyzed (which is the total number of items in the cluster or test, divided by the number of students who have a valid score); then multiplied by 100 and rounded to the nearest whole number. Also written:
{[(Σ Raw scores / # of students in the group) / Number of questions on the test] * 100, rounded to nearest whole number}
mean scale score The average of the valid scale scores for the group of students is the sum of the scale scores divided by the number of students with scale scores.
[(Σ scale scores / Number of students with scale scores)] For the CSTs, the scale score is a value from 150 to 600 with 350 as the lowest score for the proficient performance level. For the CAPA, the scale score is a value from 15 to 60 with 35 as the lowest score for the proficient performance level.
National Percentile Rank (NPR) The percentile rank is a number between 1 and 99 indicating the percent of students in a national sample of students (norm group) in the same grade tested at the same time during the school year that had the same or a lower score. Percentiles should not be averaged because they do not constitute an equal interval scale. For example, if a student received a raw score of 95 on a mathematics test and this score was greater than or equal to the scores of 88% of the students taking the test, then the student’s percentile rank would be 88. The student scored at the 88th percentile.
NCE See Normal curve equivalent.
Normal curve equivalent (NCE) A transformation of a test score to a value on a scale from 1 to 99. NCEs are normalized scores with a mean of 50 and standard deviation of 21.06, chosen so that NCE values of 1, 50, and 99 equal percentile values at 1, 50, and 99. NCEs have an equal interval scale, meaning that NCEs may be averaged for groups of scores. Notes:
• NCE is a way of measuring where a student’s score falls along the normal curve. • The numbers on the NCE line run from 1 to 99, similar to percentile ranks, which
indicate an individual student’s rank, or how many students out of one hundred had a lower score.
NPR See National Percentile Rank.
percent correct Percent correct is equal to the raw score divided by the number of questions in the given subject or reporting cluster.

Part III Appendices | Appendix J: Glossary of Statistical Terms
August 2007 2007 STAR Post-Test Guide 143 © 2007 by the California Department of Education
percentile rank A number between 1 and 99 indicating the percent of scores for students in a norm group that had the same or a lower score. The percentile is a point on a scale of scores at or below which a given percent of the scores fell.
Examples: If a student received a score of 95 on a mathematics test and this score was greater than or equal to the scores of 88% of the students taking the test, then the student’s percentile rank would be 88. The student’s score would be at the 88th percentile. A student, who scores at the 42nd percentile, is doing as well as, or better than, 42 percent of the students who took the same test.
performance levels Performance on the CST and CAPA is measured at one of five levels: advanced, proficient, basic, below basic, or far below basic, with proficient marking the state’s target performance level for all students. Performance levels are derived from the scale score for a student. CST and CAPA performance levels are:
ADV = Advanced PRO = Proficient B = Basic
BB = Below basic FBB = Far below basic
quartiles Three quartiles (25th, 50th, and 75th percentiles) divide the scores into four quarters. Percentile ranks (PRs) between 1 and 25 are in the first or lowest quarter, PRs between 25 and 50 in the second quarter, PRs between 50 and 75 in the third quarter, and PRs between 76 and 99 in the fourth or highest quarter. Quartiles are used for reporting the CAT/6 Survey results for groups of students as follow:
Percent of students scoring above the 75th NPR Percent of students scoring at or above the 50th NPR Percent of students scoring above the 25th national percentile (NPR)
The following example from a school report shows how to calculate the percent of students at the school that scored in each quarter of the distribution for the norm group.
Percentiles National Norm Group This School % above 75 25 5 % at or above 50 50 38 % above 25 75 63
Percent of Scores in Each Quarter National Norm Group This School
4th Quarter (PRs of 76–99) 25 5 3rd Quarter (PRs of 51–75) 25 33 (38–5) 2nd Quarter (PRs of 26–50) 25 25 (63–38) 1st Quarter (PRs of 1–25) 25 37 (100–63)

Part III Appendices | Appendix J: Glossary of Statistical Terms
144 2007 STAR Post-Test Guide August 2007 © 2007 by the California Department of Education
quintiles Four quintiles (20th, 40th, 60th, and 80th percentiles) divide the scores into five groups:
Percentile ranks between 80 and 99 (highest fifth) Percentile ranks between 60 and 79 Percentile ranks between 40 and 59 Percentile ranks between 20 and 39 Percentile ranks between 1 and 19 (lowest fifth)
raw score Raw scores identify the number of questions answered correctly on a test or subtest. Raw scores do not take into account differences in the difficulties of different test forms. Therefore, raw scores should not be used to compare student performance on different administrations of the same exam.
scale score A mathematical transformation of a raw score. Scale scores take into account difficulty, where percent correct scores do not. A scale score allows different test administrations to be compared directly.
Notes: • A scale score is derived from a statistical process. It is not possible to calculate a
scale score by multiplying a student’s percent correct in a content area by 600. • CST scale scores range from 150 to 600. The lowest scores for basic and
proficient are always 300 and 350, respectively. Lowest scores for below basic and advanced vary by content area and grade.
• CAPA scale scores range from 15 to 60. The lowest scores for basic and proficient are 30 and 35 respectively.
• CAT/6 Survey scale scores are useful for reporting changes over time as the scores are “vertically scaled.” CAT/6 Survey scale scores range from 1 to 999.
• Neither CAT/6 Survey nor CST scale scores should be used to compare a student’s score in different subjects.
standard deviation (SD) Standard deviation is a measure of variance in the scores. About 68% of all scores will be plus or minus one standard deviation from the mean. About 95% of the scores will be within plus or minus two standard deviations from the mean.
stanine Stanine or “standard nine” divides the distribution into nine parts.
Stanine Percentile Range 1 1–4 2 5–10 3 11–22
Below Average
4 23–40 5 41–59 6 60–77
Average
7 78–89 8 90–95 9 96–99
Above Average

This page intentionally left blank.