Embed Size (px)
Citation preview
POST-FLOOD FORENSIC ANALYSIS OF SUNGAI MAONG USING INFOWORKS ™ RIVER SIMULATION (RS)
Jenny Kuihoon anak Kulu , Darrien Y.S. Mah, Frederik Josep Putuhena and Salim Said1Department of Civil Engineering, Faculty of Engineering,Universiti Malaysia Sarawak, 94300 UNIMAS, Sarawak
2KM17 Kuching Samarahan Expressway, 94300 Kota Samarahan, Sarawak E-mail: [email protected]
abstractSungai Maong catchment is one river basin with the worst flooding history in Kuching City. Post-flood forensic analysis outlined in this paper presented an approach using a hydrodynamic model – InfoWorks River Simulation (RS) coupled with its GIS applications, to identify the amount and location of the flooded areas. Results demonstrate that InfoWorks RS model is satisfactorily capable of providing a clear picture of the January 2000 flood event being simulated, highlighting the flooding where the floodwater flows outside the river channel and its pattern of spread. The model has successfully identified the flood behaviors and areas for improvement in respect to flooding in Sungai Maong catchment. The approach served as a demonstration tool for government agencies and communities to safeguard against future floods and recovery problems in Sungai Maong catchment as well as in the state of Sarawak.
Keywords: Flood, Post-flood analysis, Forensic, InfoWorks RS, Sungai Maong, Kuching City
I BACKGROUNDSungai Maong is one of the tributaries of Sungai Sarawak
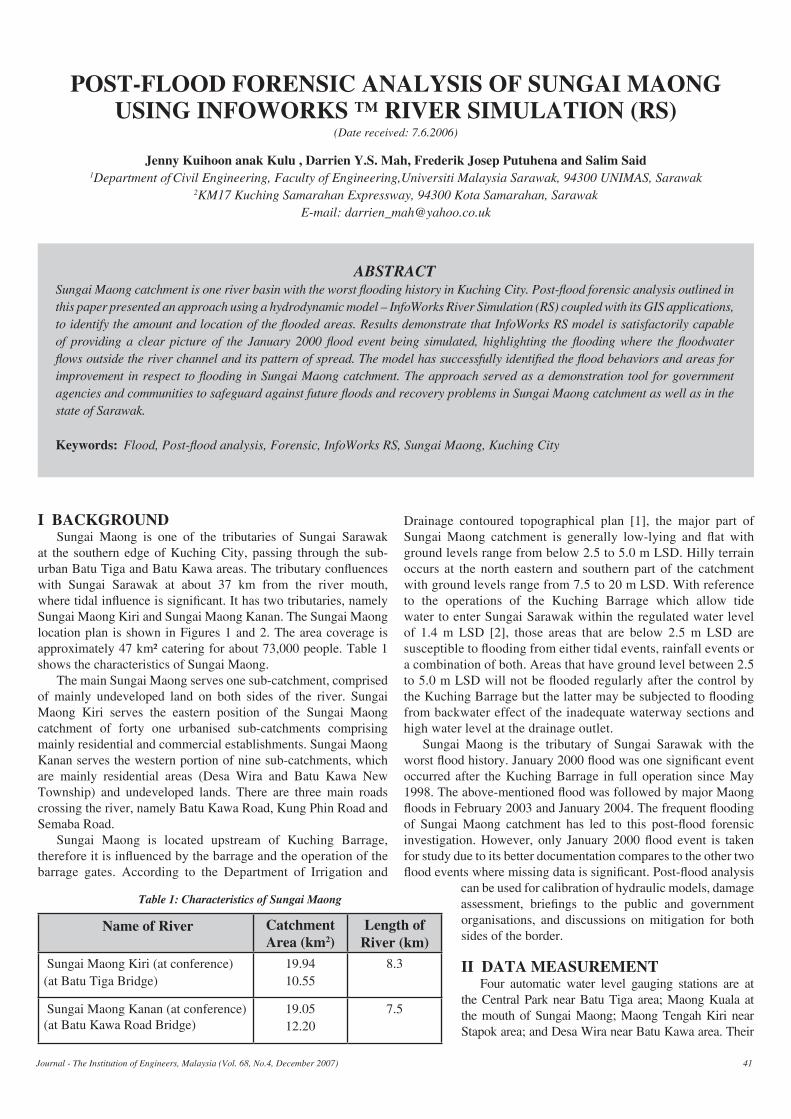
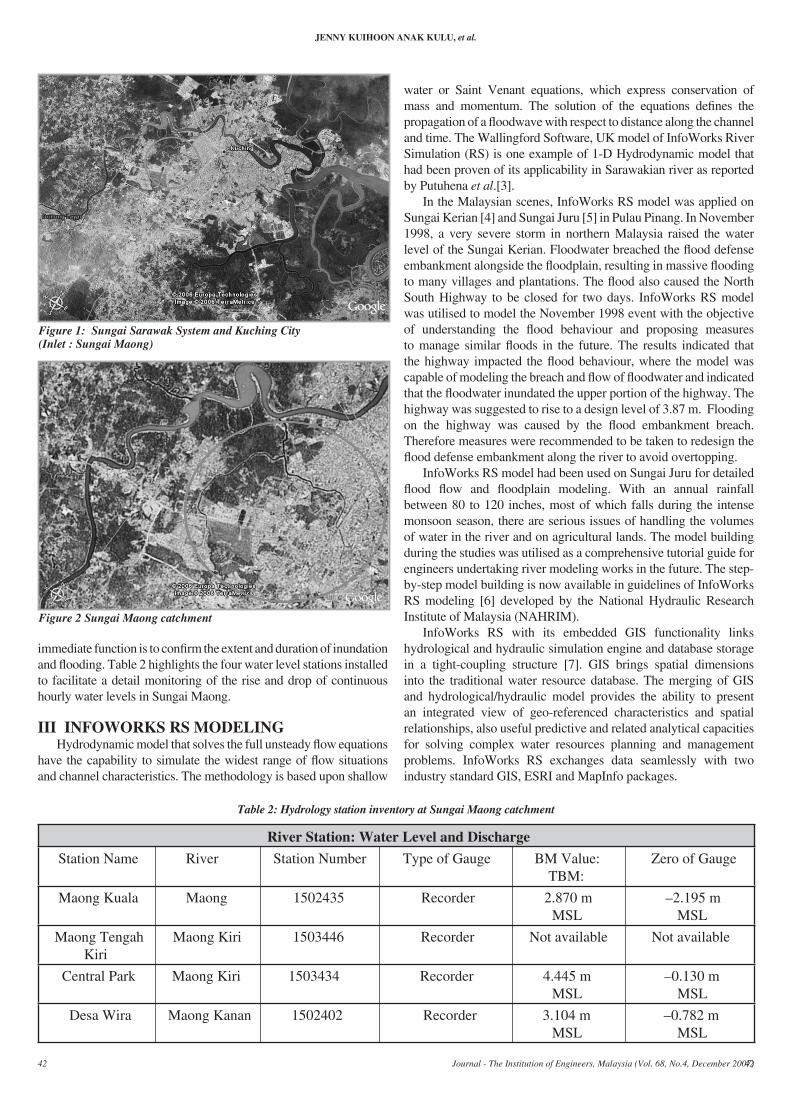
at the southern edge of Kuching City, passing through the sub-urban Batu Tiga and Batu Kawa areas. The tributary confluences with Sungai Sarawak at about 37 km from the river mouth, where tidal influence is significant. It has two tributaries, namely Sungai Maong Kiri and Sungai Maong Kanan. The Sungai Maong location plan is shown in Figures 1 and 2. The area coverage is approximately 47 km² catering for about 73,000 people. Table 1 shows the characteristics of Sungai Maong.
The main Sungai Maong serves one sub-catchment, comprised of mainly undeveloped land on both sides of the river. Sungai Maong Kiri serves the eastern position of the Sungai Maong catchment of forty one urbanised sub-catchments comprising mainly residential and commercial establishments. Sungai Maong Kanan serves the western portion of nine sub-catchments, which are mainly residential areas (Desa Wira and Batu Kawa New Township) and undeveloped lands. There are three main roads crossing the river, namely Batu Kawa Road, Kung Phin Road and Semaba Road.
Sungai Maong is located upstream of Kuching Barrage, therefore it is influenced by the barrage and the operation of the barrage gates. According to the Department of Irrigation and
Drainage contoured topographical plan [1], the major part of Sungai Maong catchment is generally low-lying and flat with ground levels range from below 2.5 to 5.0 m LSD. Hilly terrain occurs at the north eastern and southern part of the catchment with ground levels range from 7.5 to 20 m LSD. With reference to the operations of the Kuching Barrage which allow tide water to enter Sungai Sarawak within the regulated water level of 1.4 m LSD [2], those areas that are below 2.5 m LSD are susceptible to flooding from either tidal events, rainfall events or a combination of both. Areas that have ground level between 2.5 to 5.0 m LSD will not be flooded regularly after the control by the Kuching Barrage but the latter may be subjected to flooding from backwater effect of the inadequate waterway sections and high water level at the drainage outlet.
Sungai Maong is the tributary of Sungai Sarawak with the worst flood history. January 2000 flood was one significant event occurred after the Kuching Barrage in full operation since May 1998. The above-mentioned flood was followed by major Maong floods in February 2003 and January 2004. The frequent flooding of Sungai Maong catchment has led to this post-flood forensic investigation. However, only January 2000 flood event is taken for study due to its better documentation compares to the other two flood events where missing data is significant. Post-flood analysis
can be used for calibration of hydraulic models, damage assessment, briefings to the public and government organisations, and discussions on mitigation for both sides of the border.
II DATA MEASUREMENTFour automatic water level gauging stations are at
the Central Park near Batu Tiga area; Maong Kuala at the mouth of Sungai Maong; Maong Tengah Kiri near Stapok area; and Desa Wira near Batu Kawa area. Their
table 1: characteristics of sungai Maong
Name of River Catchment Area (km2)
Length of River (km)
Sungai Maong Kiri (at conference) (at Batu Tiga Bridge)
19.9410.55
8.3
Sungai Maong Kanan (at conference) (at Batu Kawa Road Bridge)
19.0512.20
7.5
(Date received: 7.6.2006)
Journal - The Institution of Engineers, Malaysia (Vol. 68, No.4, December 2007) 41
JENNY KUIhOON ANAK KULU, et al.
Journal - The Institution of Engineers, Malaysia (Vol. 68, No.4, December 2007)42
immediate function is to confirm the extent and duration of inundation and flooding. Table 2 highlights the four water level stations installed to facilitate a detail monitoring of the rise and drop of continuous hourly water levels in Sungai Maong.
III INFOWORKS RS MODELING Hydrodynamic model that solves the full unsteady flow equations
have the capability to simulate the widest range of flow situations and channel characteristics. The methodology is based upon shallow
water or Saint Venant equations, which express conservation of mass and momentum. The solution of the equations defines the propagation of a floodwave with respect to distance along the channel and time. The Wallingford Software, UK model of InfoWorks River Simulation (RS) is one example of 1-D Hydrodynamic model that had been proven of its applicability in Sarawakian river as reported by Putuhena et al.[3].
In the Malaysian scenes, InfoWorks RS model was applied on Sungai Kerian [4] and Sungai Juru [5] in Pulau Pinang. In November 1998, a very severe storm in northern Malaysia raised the water level of the Sungai Kerian. Floodwater breached the flood defense embankment alongside the floodplain, resulting in massive flooding to many villages and plantations. The flood also caused the North South Highway to be closed for two days. InfoWorks RS model was utilised to model the November 1998 event with the objective of understanding the flood behaviour and proposing measures to manage similar floods in the future. The results indicated that the highway impacted the flood behaviour, where the model was capable of modeling the breach and flow of floodwater and indicated that the floodwater inundated the upper portion of the highway. The highway was suggested to rise to a design level of 3.87 m. Flooding on the highway was caused by the flood embankment breach. Therefore measures were recommended to be taken to redesign the flood defense embankment along the river to avoid overtopping.
InfoWorks RS model had been used on Sungai Juru for detailed flood flow and floodplain modeling. With an annual rainfall between 80 to 120 inches, most of which falls during the intense monsoon season, there are serious issues of handling the volumes of water in the river and on agricultural lands. The model building during the studies was utilised as a comprehensive tutorial guide for engineers undertaking river modeling works in the future. The step-by-step model building is now available in guidelines of InfoWorks RS modeling [6] developed by the National Hydraulic Research Institute of Malaysia (NAHRIM).
InfoWorks RS with its embedded GIS functionality links hydrological and hydraulic simulation engine and database storage in a tight-coupling structure [7]. GIS brings spatial dimensions into the traditional water resource database. The merging of GIS and hydrological/hydraulic model provides the ability to present an integrated view of geo-referenced characteristics and spatial relationships, also useful predictive and related analytical capacities for solving complex water resources planning and management problems. InfoWorks RS exchanges data seamlessly with two industry standard GIS, ESRI and MapInfo packages.
42
Figure 1: sungai sarawak system and Kuching city (Inlet : sungai Maong)
Figure 2 sungai Maong catchment
table 2: Hydrology station inventory at sungai Maong catchment
River Station: Water Level and Discharge Station Name River Station Number Type of Gauge BM Value: Zero of Gauge TBM:
Maong Kuala Maong 1502435 Recorder 2.870 m –2.195 m MSL MSL
Maong Tengah Maong Kiri 1503446 Recorder Not available Not available Kiri
Central Park Maong Kiri 1503434 Recorder 4.445 m –0.130 m MSL MSL
Desa Wira Maong Kanan 1502402 Recorder 3.104 m –0.782 m MSL MSL
POST-FLOOD FORENSIC ANALYSIS OF SUNGAI MAONG USING INFOWORKSTM RIVER SIMULATION (RS)
Journal - The Institution of Engineers, Malaysia (Vol. 68, No.4, December 2007) 43
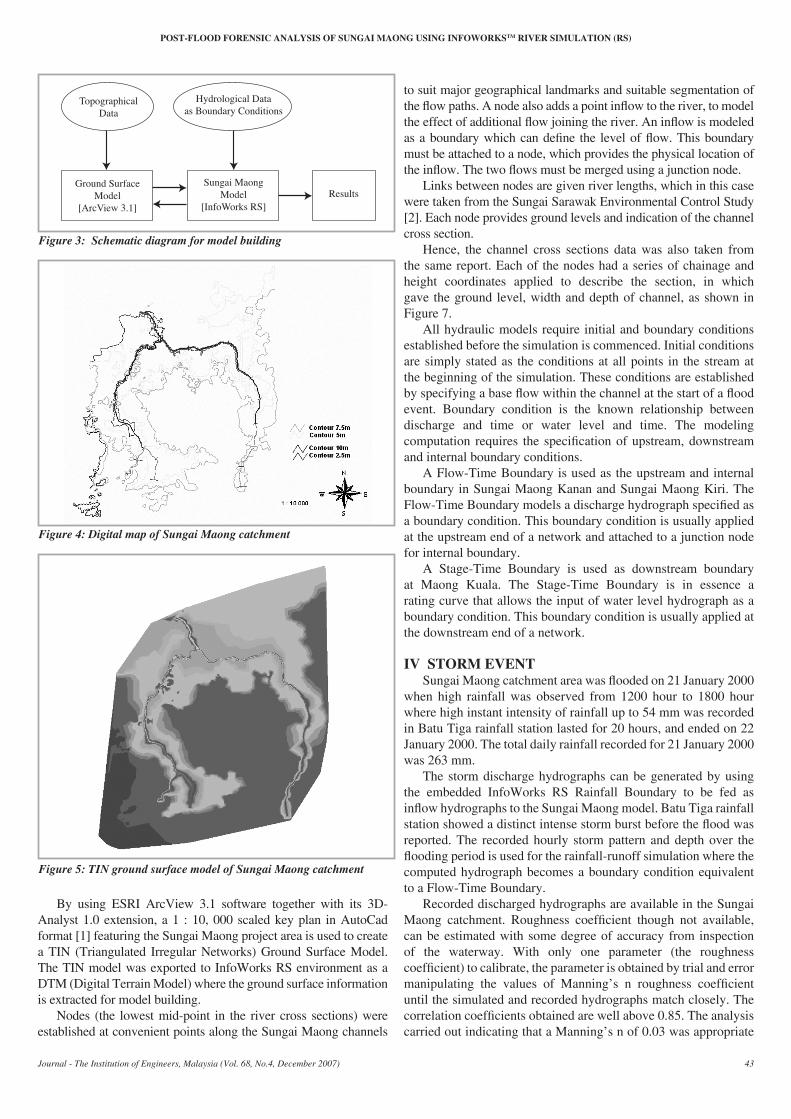
By using ESRI ArcView 3.1 software together with its 3D-Analyst 1.0 extension, a 1 : 10, 000 scaled key plan in AutoCad format [1] featuring the Sungai Maong project area is used to create a TIN (Triangulated Irregular Networks) Ground Surface Model. The TIN model was exported to InfoWorks RS environment as a DTM (Digital Terrain Model) where the ground surface information is extracted for model building.
Nodes (the lowest mid-point in the river cross sections) were established at convenient points along the Sungai Maong channels
to suit major geographical landmarks and suitable segmentation of the flow paths. A node also adds a point inflow to the river, to model the effect of additional flow joining the river. An inflow is modeled as a boundary which can define the level of flow. This boundary must be attached to a node, which provides the physical location of the inflow. The two flows must be merged using a junction node.
Links between nodes are given river lengths, which in this case were taken from the Sungai Sarawak Environmental Control Study [2]. Each node provides ground levels and indication of the channel cross section.
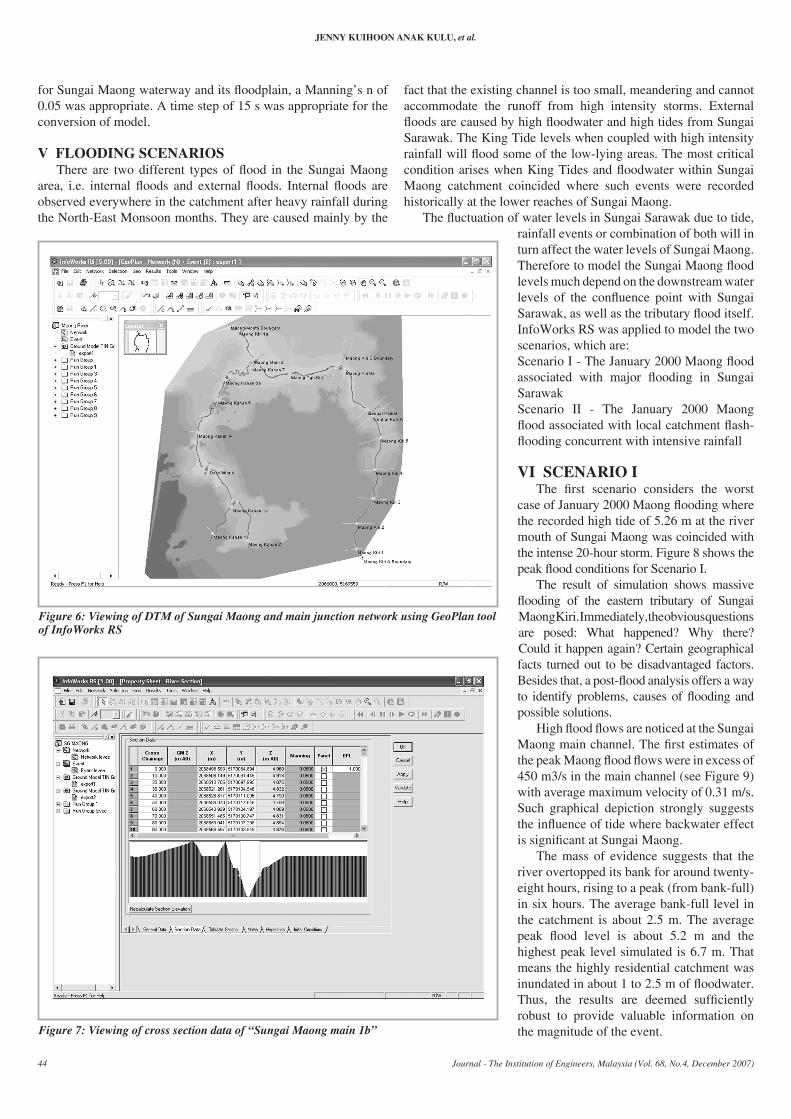
Hence, the channel cross sections data was also taken from the same report. Each of the nodes had a series of chainage and height coordinates applied to describe the section, in which gave the ground level, width and depth of channel, as shown in Figure 7.
All hydraulic models require initial and boundary conditions established before the simulation is commenced. Initial conditions are simply stated as the conditions at all points in the stream at the beginning of the simulation. These conditions are established by specifying a base flow within the channel at the start of a flood event. Boundary condition is the known relationship between discharge and time or water level and time. The modeling computation requires the specification of upstream, downstream and internal boundary conditions.
A Flow-Time Boundary is used as the upstream and internal boundary in Sungai Maong Kanan and Sungai Maong Kiri. The Flow-Time Boundary models a discharge hydrograph specified as a boundary condition. This boundary condition is usually applied at the upstream end of a network and attached to a junction node for internal boundary.
A Stage-Time Boundary is used as downstream boundary at Maong Kuala. The Stage-Time Boundary is in essence a rating curve that allows the input of water level hydrograph as a boundary condition. This boundary condition is usually applied at the downstream end of a network.
IV STORM EVENTSungai Maong catchment area was flooded on 21 January 2000
when high rainfall was observed from 1200 hour to 1800 hour where high instant intensity of rainfall up to 54 mm was recorded in Batu Tiga rainfall station lasted for 20 hours, and ended on 22 January 2000. The total daily rainfall recorded for 21 January 2000 was 263 mm.
The storm discharge hydrographs can be generated by using the embedded InfoWorks RS Rainfall Boundary to be fed as inflow hydrographs to the Sungai Maong model. Batu Tiga rainfall station showed a distinct intense storm burst before the flood was reported. The recorded hourly storm pattern and depth over the flooding period is used for the rainfall-runoff simulation where the computed hydrograph becomes a boundary condition equivalent to a Flow-Time Boundary.
Recorded discharged hydrographs are available in the Sungai Maong catchment. Roughness coefficient though not available, can be estimated with some degree of accuracy from inspection of the waterway. With only one parameter (the roughness coefficient) to calibrate, the parameter is obtained by trial and error manipulating the values of Manning’s n roughness coefficient until the simulated and recorded hydrographs match closely. The correlation coefficients obtained are well above 0.85. The analysis carried out indicating that a Manning’s n of 0.03 was appropriate
TopographicalData
Ground SurfaceModel
[ArcView 3.1]
Sungai MaongModel
[InfoWorks RS]Results
Hydrological Dataas Boundary Conditions
Figure 3: schematic diagram for model building
Figure 4: Digital map of sungai Maong catchment
Figure 5: tIN ground surface model of sungai Maong catchment
JENNY KUIhOON ANAK KULU, et al.
Journal - The Institution of Engineers, Malaysia (Vol. 68, No.4, December 2007)44
for Sungai Maong waterway and its floodplain, a Manning’s n of 0.05 was appropriate. A time step of 15 s was appropriate for the conversion of model.
V FLOODING SCENARIOSThere are two different types of flood in the Sungai Maong
area, i.e. internal floods and external floods. Internal floods are observed everywhere in the catchment after heavy rainfall during the North-East Monsoon months. They are caused mainly by the
fact that the existing channel is too small, meandering and cannot accommodate the runoff from high intensity storms. External floods are caused by high floodwater and high tides from Sungai Sarawak. The King Tide levels when coupled with high intensity rainfall will flood some of the low-lying areas. The most critical condition arises when King Tides and floodwater within Sungai Maong catchment coincided where such events were recorded historically at the lower reaches of Sungai Maong.
The fluctuation of water levels in Sungai Sarawak due to tide, rainfall events or combination of both will in turn affect the water levels of Sungai Maong. Therefore to model the Sungai Maong flood levels much depend on the downstream water levels of the confluence point with Sungai Sarawak, as well as the tributary flood itself. InfoWorks RS was applied to model the two scenarios, which are:Scenario I - The January 2000 Maong flood associated with major flooding in Sungai SarawakScenario II - The January 2000 Maong flood associated with local catchment flash-flooding concurrent with intensive rainfall
VI SCENARIO IThe first scenario considers the worst
case of January 2000 Maong flooding where the recorded high tide of 5.26 m at the river mouth of Sungai Maong was coincided with the intense 20-hour storm. Figure 8 shows the peak flood conditions for Scenario I.
The result of simulation shows massive flooding of the eastern tributary of Sungai Maong Kiri. Immediately, the obvious questions are posed: What happened? Why there? Could it happen again? Certain geographical facts turned out to be disadvantaged factors. Besides that, a post-flood analysis offers a way to identify problems, causes of flooding and possible solutions.
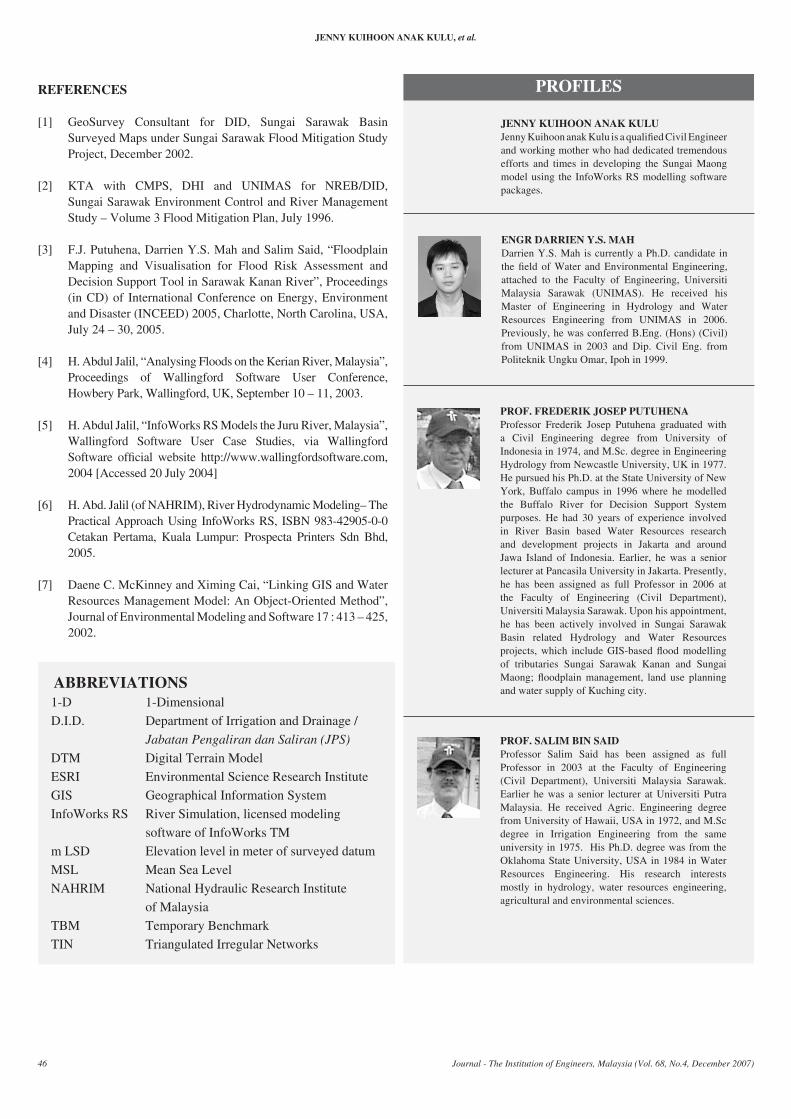
High flood flows are noticed at the Sungai Maong main channel. The first estimates of the peak Maong flood flows were in excess of 450 m3/s in the main channel (see Figure 9) with average maximum velocity of 0.31 m/s. Such graphical depiction strongly suggests the influence of tide where backwater effect is significant at Sungai Maong.
The mass of evidence suggests that the river overtopped its bank for around twenty-eight hours, rising to a peak (from bank-full) in six hours. The average bank-full level in the catchment is about 2.5 m. The average peak flood level is about 5.2 m and the highest peak level simulated is 6.7 m. That means the highly residential catchment was inundated in about 1 to 2.5 m of floodwater. Thus, the results are deemed sufficiently robust to provide valuable information on the magnitude of the event.
Figure 6: Viewing of DtM of sungai Maong and main junction network using GeoPlan tool of InfoWorks rs
Figure 7: Viewing of cross section data of “sungai Maong main 1b”
POST-FLOOD FORENSIC ANALYSIS OF SUNGAI MAONG USING INFOWORKSTM RIVER SIMULATION (RS)
Journal - The Institution of Engineers, Malaysia (Vol. 68, No.4, December 2007) 45
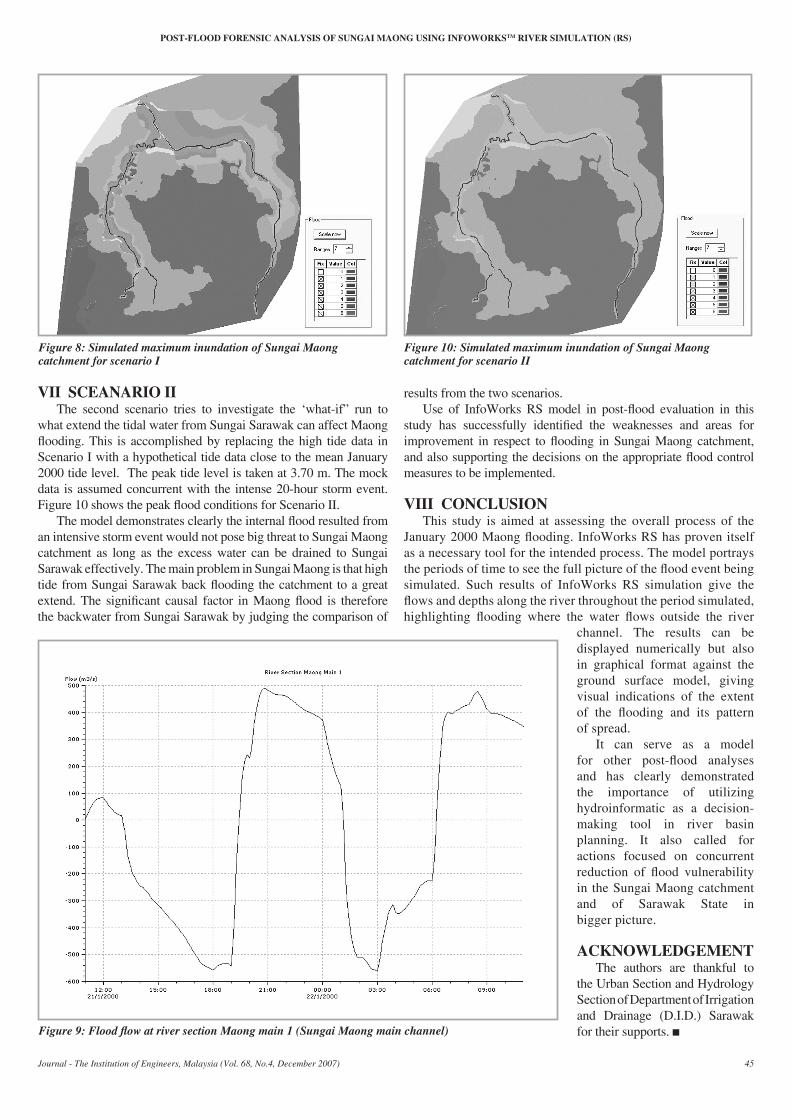
VII SCEANARIO IIThe second scenario tries to investigate the ‘what-if” run to
what extend the tidal water from Sungai Sarawak can affect Maong flooding. This is accomplished by replacing the high tide data in Scenario I with a hypothetical tide data close to the mean January 2000 tide level. The peak tide level is taken at 3.70 m. The mock data is assumed concurrent with the intense 20-hour storm event. Figure 10 shows the peak flood conditions for Scenario II.
The model demonstrates clearly the internal flood resulted from an intensive storm event would not pose big threat to Sungai Maong catchment as long as the excess water can be drained to Sungai Sarawak effectively. The main problem in Sungai Maong is that high tide from Sungai Sarawak back flooding the catchment to a great extend. The significant causal factor in Maong flood is therefore the backwater from Sungai Sarawak by judging the comparison of
results from the two scenarios.Use of InfoWorks RS model in post-flood evaluation in this
study has successfully identified the weaknesses and areas for improvement in respect to flooding in Sungai Maong catchment, and also supporting the decisions on the appropriate flood control measures to be implemented.
VIII CONCLUSIONThis study is aimed at assessing the overall process of the
January 2000 Maong flooding. InfoWorks RS has proven itself as a necessary tool for the intended process. The model portrays the periods of time to see the full picture of the flood event being simulated. Such results of InfoWorks RS simulation give the flows and depths along the river throughout the period simulated, highlighting flooding where the water flows outside the river
channel. The results can be displayed numerically but also in graphical format against the ground surface model, giving visual indications of the extent of the flooding and its pattern of spread.
It can serve as a model for other post-flood analyses and has clearly demonstrated the importance of utilizing hydroinformatic as a decision-making tool in river basin planning. It also called for actions focused on concurrent reduction of flood vulnerability in the Sungai Maong catchment and of Sarawak State in bigger picture.
ACKNOWLEDGEMENTThe authors are thankful to
the Urban Section and Hydrology Section of Department of Irrigation and Drainage (D.I.D.) Sarawak for their supports. n
Figure 8: simulated maximum inundation of sungai Maong catchment for scenario I
Figure 9: Flood flow at river section Maong main 1 (Sungai Maong main channel)
Figure 10: simulated maximum inundation of sungai Maong catchment for scenario II
JENNY KUIhOON ANAK KULU, et al.
Journal - The Institution of Engineers, Malaysia (Vol. 68, No.4, December 2007)46
REFERENCES
[1] GeoSurvey Consultant for DID, Sungai Sarawak Basin Surveyed Maps under Sungai Sarawak Flood Mitigation Study Project, December 2002.
[2] KTA with CMPS, DHI and UNIMAS for NREB/DID, Sungai Sarawak Environment Control and River Management Study – Volume 3 Flood Mitigation Plan, July 1996.
[3] F.J. Putuhena, Darrien Y.S. Mah and Salim Said, “Floodplain Mapping and Visualisation for Flood Risk Assessment and Decision Support Tool in Sarawak Kanan River”, Proceedings (in CD) of International Conference on Energy, Environment and Disaster (INCEED) 2005, Charlotte, North Carolina, USA, July 24 – 30, 2005.
[4] H. Abdul Jalil, “Analysing Floods on the Kerian River, Malaysia”, Proceedings of Wallingford Software User Conference, Howbery Park, Wallingford, UK, September 10 – 11, 2003.
[5] H. Abdul Jalil, “InfoWorks RS Models the Juru River, Malaysia”, Wallingford Software User Case Studies, via Wallingford Software official website http://www.wallingfordsoftware.com, 2004 [Accessed 20 July 2004]
[6] H. Abd. Jalil (of NAHRIM), River Hydrodynamic Modeling– The Practical Approach Using InfoWorks RS, ISBN 983-42905-0-0 Cetakan Pertama, Kuala Lumpur: Prospecta Printers Sdn Bhd, 2005.
[7] Daene C. McKinney and Ximing Cai, “Linking GIS and Water Resources Management Model: An Object-Oriented Method”, Journal of Environmental Modeling and Software 17 : 413 – 425, 2002.
ABBREVIATIONS 1-D 1-Dimensional D.I.D. Department of Irrigation and Drainage /
Jabatan Pengaliran dan Saliran (JPS) DTM Digital Terrain Model ESRI Environmental Science Research Institute GIS Geographical Information System InfoWorks RS River Simulation, licensed modeling
software of InfoWorks TM m LSD Elevation level in meter of surveyed datum MSL Mean Sea Level NAHRIM National Hydraulic Research Institute
of Malaysia TBM Temporary Benchmark TIN Triangulated Irregular Networks
JENNY KUIhOON ANAK KULUJenny Kuihoon anak Kulu is a qualified Civil Engineer and working mother who had dedicated tremendous efforts and times in developing the Sungai Maong model using the InfoWorks RS modelling software packages.
PROFILES
PROF. FREDERIK JOSEP PUTUhENAProfessor Frederik Josep Putuhena graduated with a Civil Engineering degree from University of Indonesia in 1974, and M.Sc. degree in Engineering Hydrology from Newcastle University, UK in 1977. He pursued his Ph.D. at the State University of New York, Buffalo campus in 1996 where he modelled the Buffalo River for Decision Support System purposes. He had 30 years of experience involved in River Basin based Water Resources research and development projects in Jakarta and around Jawa Island of Indonesia. Earlier, he was a senior lecturer at Pancasila University in Jakarta. Presently, he has been assigned as full Professor in 2006 at the Faculty of Engineering (Civil Department), Universiti Malaysia Sarawak. Upon his appointment, he has been actively involved in Sungai Sarawak Basin related Hydrology and Water Resources projects, which include GIS-based flood modelling of tributaries Sungai Sarawak Kanan and Sungai Maong; floodplain management, land use planning and water supply of Kuching city.
ENGR DARRIEN Y.S. MAh Darrien Y.S. Mah is currently a Ph.D. candidate in the field of Water and Environmental Engineering, attached to the Faculty of Engineering, Universiti Malaysia Sarawak (UNIMAS). He received his Master of Engineering in Hydrology and Water Resources Engineering from UNIMAS in 2006. Previously, he was conferred B.Eng. (Hons) (Civil) from UNIMAS in 2003 and Dip. Civil Eng. from Politeknik Ungku Omar, Ipoh in 1999.
PROF. SALIM BIN SAIDProfessor Salim Said has been assigned as full Professor in 2003 at the Faculty of Engineering (Civil Department), Universiti Malaysia Sarawak. Earlier he was a senior lecturer at Universiti Putra Malaysia. He received Agric. Engineering degree from University of Hawaii, USA in 1972, and M.Sc degree in Irrigation Engineering from the same university in 1975. His Ph.D. degree was from the Oklahoma State University, USA in 1984 in Water Resources Engineering. His research interests mostly in hydrology, water resources engineering, agricultural and environmental sciences.