Embed Size (px)
Citation preview

Post-Extrasystolic Changes of the Vectorcardiographic T Loop
in Healthy Subjects
VN Batchvarov
1, II Christov
2, G Bortolan
3, II Simova
4, AJ Camm
1
1 St. George’s University of London, London, United Kingdom
2 Centre of Biomedical Engineering, Bulgarian Academy of Sciences, Sofia, Bulgaria
3Institute of Biomedical Engineering ISIB - CNR, Padova, Italy
4 University Hospital ‘Aleksandrovska’, Clinic of Cardiology, Sofia, Bulgaria
Abstract
Visible T wave changes of the 1st sinus beat following a
ventricular premature beat (VPB) are sometimes
observed in the electrocardiograms (ECG) of both
healthy subjects and cardiac patients. We hypothesized
that ventricular repolarization of the post-VPB beat can
be modulated even without visible T wave changes. We
analyzed 12-lead ECGs acquired in 7 healthy subjects,
with at least 1 VPB/ECG with no visible changes of the 1st
post-VPB beat. The spatial T loop of each sinus beat was
reconstructed in derived XYZ leads and was
characterized by 5 parameters. The 1st post-VPB beat was
compared with the 2nd and 3rd pre-VPB beats. In 6
subjects, 1 to 3 T-loop parameters were significantly
modified with an average change from −18.9% to 30.1%
signifying increased repolarization heterogeneity. In
conclusion, heterogeneity of the post-VPB sinus beat can
be increased in the absence of visible T wave changes.
1. Introduction
Visible changes in the T (or T-U) wave of the sinus
beat immediately following a ventricular premature beat
(VPB) are not infrequently observed in
electrocardiograms (ECG) of both healthy subjects and
cardiac patients (for a recent review see [1]). Their
mechanism is not yet fully understood. It is possible,
however, that ventricular repolarization of the 1st sinus
complex is modulated even in the absence of visible to
the naked eye T wave changes.
Quantitative analysis of the T wave morphology has
been shown to provide information about the
heterogeneity of ventricular repolarization, which can not
be obtained by visual inspection of the T wave of the
standard 12-lead ECG, or measurement of simple
parameters such as QT dispersion. Various methods for T
wave morphology analysis have been proposed, such as
analysis of area-derived parameters [2], algebraic
decomposition of the T wave [3], principal component
analysis [4,5], analysis of the T loop using singular value
decomposition [6] and others.
Another possibility is to analyze quantitatively the
vectorcardiographic (VCG) T loop. Although the VCG
contains the same information as the scalar ECG, its
specific form of presentation of the ECG signal allows the
detection of abnormalities that are not immediately
visible on the scalar ECG. In this study, we implemented
a previously reported method of quantitative analysis of
the vectorcardiographic T-loop [7-9] in order to compare
sinus complexes preceding and immediately following
VPBs. We analyzed standard 12-lead ECGs acquired in
subjects with no heart disease and frequent VPBs.
2. Methods
2.1. ECG database
Digital 10-second 12-lead ECGs (MAC5000, GE
Medical Systems, Milwaukee, WI, USA, 500 Hz, 12 bit
A/D) acquired in 7 healthy subjects (3 men, 4 women,
age 35.3±7.9 years, range 23-48 years) were selected
from the ECG database of the Department of Cardiac and
Vascular Sciences at St. George’s, University of London.
All subjects had negative medical history and normal
physical examination, except for the presence of frequent
premature beats and were not taking any medications. In
each subject, 10 consecutive ECGs were acquired in the
resting supine position. All ECGs were normal except for
the presence of frequent monomorphic VPBs with no
visible changes in the T wave of the 1st post-VPB sinus
ISSN 0276−6574 451 Computers in Cardiology 2007;34:451−454.

beat. ECGs with at least 3 sinus beats preceding and 2
sinus beats following a VPB were selected for further
analysis (5.3±0.8, range 5–7 ECGs per subject). They
were converted into text files (Magellan ECG Research
Workstation programme, GE medical Systems) which
were then transferred into a custom-made software
programme [9] for analysis of the VCG T loop.
2.2. Quantitative analysis of VCG T-loop
The spatial T-loop of the vectorcardiogram (VCG) was
synthesized using orthogonal Frank leads derived from
the standard 12-lead ECG. Several methods for derivation
of Frank orthogonal leads from simultaneously recorded
12 standard leads have been proposed [10]. In this study,
we used the method of Levkov [11,12].
The QRS and T loop have generally the form of an
ellipse, which is best characterized by its major axis. For
example, Nowinski et al. [13] defined the T loop
eigenvalue parameter as a ratio of the major to the minor
axis of the ellipse. In previously published studies [7-9],
the VCG T-loop was characterized by parameters which
were measured (i) towards the maximal axis of the
ellipse, and (ii) towards the isoelectric (zero) point of the
ECG. The former approach was shown to provide
superior results [7-9] and therefore in this study the T-
loop parameters were measured with respect to the
maximal axis of the ellipse.
The following 5 parameters were analysed:
• Angle in the T-loop in the frontal plane (Tf)
• Angle in the T-loop in the horizontal plane (Th)
• Maximum angle between QRS and T loop axes (MA)
The angles (AF, AH and ALS) in the three VCG planes
– frontal, horizontal and left sagittal – are computed,
and the maximum value is taken as parameter MA:
MA = max(AF, AH, ALS)
• T axis elevation and azimuth angle difference (DEA).
This parameter is adopted from the work of Kallert et
al. [14]. The difference between frontal plane elevation
and azimuth angles is calculated along the entire
segment of repolarization, providing a description of
the T-wave loop morphology. DEA is defined as the
mean absolute value of the difference between the
frontal plane Elevation (α) and Azimuth (β) of all loop
samples (n)
DEA=mean(abs(αn - β n))
• The Elevation with respect to the frontal plane is the
angle between the loop axis at sample n and the Y axis
in the left sagittal plane (Fig. 1(a)), while the Azimuth
is the angle between the loop axis at the same sample
and the X axis in the frontal plane (Fig. 1(b)).
• Ratio of maximum to mean T vector magnitudes
(RMMV). This ratio is adopted from the work of
Kallert et al. [14]:
-0.2 -0.1 0 0.1
0
0.1
0.2
0.3
Z →
← Y
α
(a)
0 0.1 0.2 0.3
0
0.1
0.2
0.3
X →
← Y
β
(b)
Figure 1. Measurement of T axis Elevation (α) and
Azimuth (β) at the (n) sample of the loop
RMMV = Vmax / mean (Vn),
where Vn is the magnitude of the spatial vector of the
T loop at sample n, calculated by the formula:
2Z
2Y
2X VVVV ++= ,
where VX, VY and VZ are the magnitudes of the
projection of the spatial vector on the orthogonal axes.
Increase in MA and DEA, Tf and Th and decrease in
RMMV signify abnormal inscription of the T-loop and
hence increased heterogeneity of ventricular
repolarization. Abnormal inscription of the T-loop has
previously been reported in patients with ischaemic heart
disease compared to healthy controls [9].
2.3. Statistical analysis
For each subject and each parameter, the 1st post-VPB
complex was compared with the average of the 2nd and 3rd
pre-VPB complexes (unpaired t-test). Data are presented
as mean±standard deviation (SD). A P value of <0.05 was
considered to signify statistically significant difference.
452
3. Results
In 6 out of 7 subjects, 1 to 3 of the T loop parameters
were significantly modified (Table 1).
Table 1 Significant changes of the T loop parameters in
the individual subjects
Parameter Pre-VPB Post-VPB P value
302.40±1.19 297.80±2.59 0.007
316.25±2.30 309.43±3.05 0.0009 Tf (n=3*)
265.17±49.86 303.50±3.87 0.03
Th (n=1*) 10.3±2.2 13.4±2.6 0.02
31.83±3.08 28.00±1.26 0.02
19.92±1.07 14.83±2.48 0.001 MA (n=3*)
140.94±19.15 115.60±6.72 0.0011
DEA (n=1*) 59.75±5.29 69.33±8.02 0.035
2.91±0.19 2.70±0.06 0.031 RMMV
(n=2*) 2.52±0.09 2.10±0.16 4×10⁻⁶
*= number of subjects with statistically significant changes; pre-
VPB = average value for the 2nd and 3rd pre-VPB sinus
complex; post-VPB = value for the 1st post-VPB sinus complex
5 6 7 8 9
-2
-1.5
-1
-0.5
0
0.5
s
mV
x
y
z
3 2 1
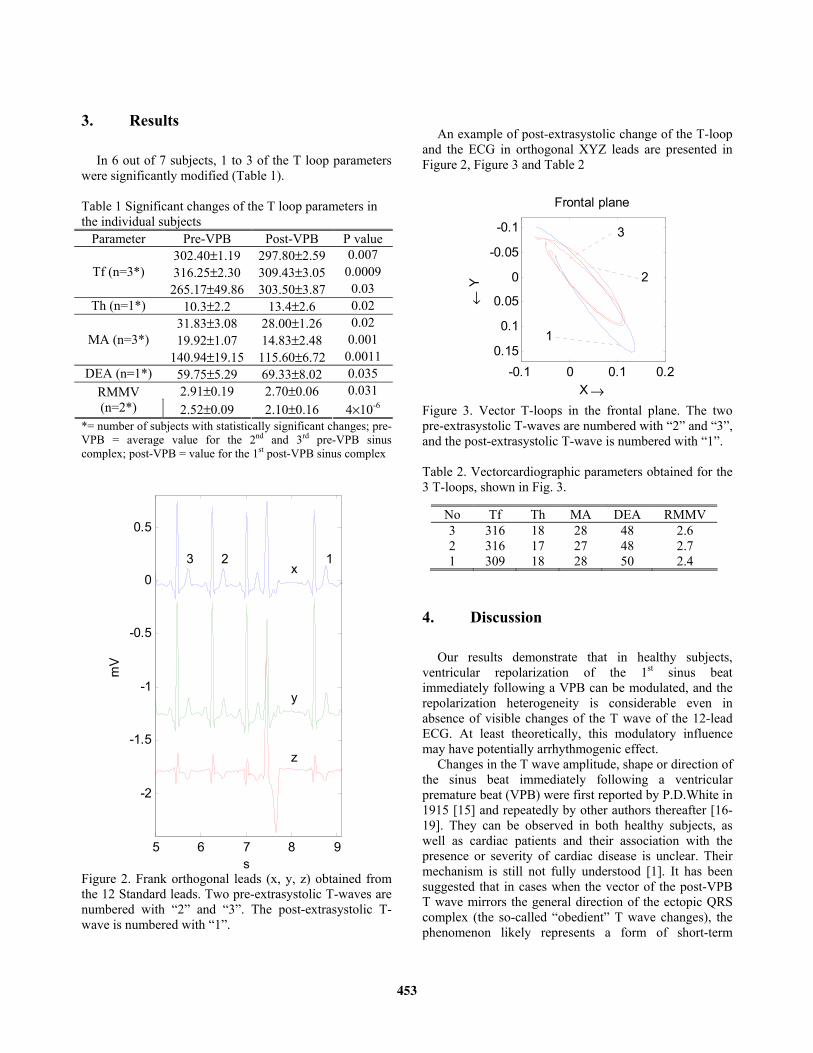
Figure 2. Frank orthogonal leads (x, y, z) obtained from
the 12 Standard leads. Two pre-extrasystolic T-waves are
numbered with “2” and “3”. The post-extrasystolic T-
wave is numbered with “1”.
An example of post-extrasystolic change of the T-loop
and the ECG in orthogonal XYZ leads are presented in
Figure 2, Figure 3 and Table 2
-0.1 0 0.1 0.2
-0.1
-0.05
0
0.05
0.1
0.15
X →
← Y
3
2
1
Frontal plane
Figure 3. Vector T-loops in the frontal plane. The two
pre-extrasystolic T-waves are numbered with “2” and “3”,
and the post-extrasystolic T-wave is numbered with “1”.
Table 2. Vectorcardiographic parameters obtained for the
3 T-loops, shown in Fig. 3.
4. Discussion
Our results demonstrate that in healthy subjects,
ventricular repolarization of the 1st sinus beat
immediately following a VPB can be modulated, and the
repolarization heterogeneity is considerable even in
absence of visible changes of the T wave of the 12-lead
ECG. At least theoretically, this modulatory influence
may have potentially arrhythmogenic effect.
Changes in the T wave amplitude, shape or direction of
the sinus beat immediately following a ventricular
premature beat (VPB) were first reported by P.D.White in
1915 [15] and repeatedly by other authors thereafter [16-
19]. They can be observed in both healthy subjects, as
well as cardiac patients and their association with the
presence or severity of cardiac disease is unclear. Their
mechanism is still not fully understood [1]. It has been
suggested that in cases when the vector of the post-VPB
T wave mirrors the general direction of the ectopic QRS
complex (the so-called “obedient” T wave changes), the
phenomenon likely represents a form of short-term
No Tf Th MA DEA RMMV
3 316 18 28 48 2.6
2 316 17 27 48 2.7
1 309 18 28 50 2.4
453

cardiac memory [20]. Such T wave changes are not pause
dependent (e.g. they can follow an interpolated VPB [1]).
In contrast, the “non-obedient” T wave changes (i.e. when
the post-extrasystolic T wave vector is not concordant
with the ectopic QRS), which are pause-related or depend
on the coupling interval of the VPB are probably due to
other mechanisms [1].
At present, our knowledge about the clinical
significance of post-VPB repolarization changes seems to
be limited only to the role of post-VPB and post-pause T
and U wave augmentation in the “climate of torsades de
pointes” [1] for the initiation of the arrhythmia [21].
In this study, we did not assess the relation between the
post-VPB repolarization change and the direction of
activation of the ectopic complex, the duration of the
coupling interval/ post-ectopic pause, or the site of origin
of the VPB.
In conclusion, our results suggest that the post-
extrasystolic repolarization modulation is very likely
more frequent than previously appreciated and therefore
deserves further studies in both healthy subjects and
patients with various cardiac diseases.
References
[1] Childers R. Influence of Rhythm Abnormalities on
Ventricular Repolarization. In: Malik M, Camm AJ
(editors): Dynamic Electrocardiography, 1st edition, Futura
Blackwell Publishing, Oxford 2004:390-405.
[2] Merri M, Benhorin J, Alberti M, Locati E, Moss AJ.
Electrocardiographic Quantitation of Ventricular
Repolarization. Circulation 1989; 80:1301-1308.
[3] Padrini R, Butrous G, Camm AJ, Malik M. Algebraic
Decomposition of the TU Wave Morphology Patterns.
Pacing Clin Electrophysiol 1995; 18:2209-2215.
[4] Priori S, Mortara D, Napolitano C, et al. Evaluation of the
Spatial Aspect of the T-Wave Complexity in the Long-QT
Syndrome. Circulation 1997; 96:3006-3012.
[5] Badilini F, Fayn J, Maison-Blanche P, et al. Quantitative
Aspects of Ventricular Repolarization: Relationship
Between Three-Dimensional T Wave loop Morphology
and Scalar QT Dispersion. A.N.E. 1997; 2:146-157.
[6] Acar B, Yi G, Hnatkova K, et al. Spatial, temporal and
wavefront direction characteristics of 12-lead T wave
morphology. Med Biol Eng Comput 1999; 37:574-584.
[7] Bortolan G, Bressan M, Christov I. Gender and age
influences in T-loop morphology, Computers in Cardiology
2003;30:513-516.
[8] Bortolan G, Bressan M, Christov I. Longitudinal
modifications of the T-loop morphology. Computers in
Cardiology 2002;29:685-688.
[9] Bortolan G, Christov I. Myocardial infarction and ischemia
characterization from T-loop Morphology in VCG.
Computers in Cardiology 2001;28:633-636.
[10] Rubel P, Benhadid I Fayn J. Quantitative assessment of
eight different methods for synthesising Frank VCGs from
simultaneously recorded standard ECG leads. J.
Electrocardiology, Suppl. 1992;24:197-202.
[11] Levkov C. Orthogonal electrocardiogram derived from the
limb and chest electrodes of the conventional 12-lead
system. Med. & Biol. Eng. & Comp. 1987;25:155-164.
[12] Daskalov IK, Dotsinsky IA and Christov II. Developments
in ECG acquisition, preprocessing, parameter measurement
and recording. IEEE Eng. in Med. & Biol. 1998;17:50-58.
[13] Nowinski K, Jensen S, Lundahl G and Bergfeldt L.
Changes in ventricular repolarization during percutaneous
transluminal coronary angioplasty in humans assessed by
QT interval, QT dispersion and T vector loop morphology.
Journ. of Intern. Med. 2000;248:126-136.
[14] Kallert T, Couderc JP, Voss A, Zareba W. Semi-automatic
method quantifying T wave loop morphology: Relevance
for assessment of heterogeneous repolarization. Comp. in
Card. 1999;26:153-156.
[15] White PD. Alternation of the Pulse: A Common Clinical
Condition. Am J M Sc. 1915; 150:82.
[16] Katz LN, Langendorf R, Cole SL. The unusual effect of
interpolated ventricular premature systoles. Am Heart J
1944; 28:167-176.
[17] Scherf D. Alterations in the form of the T waves with
changes in heart rate. Am Heart J 1944; 28:332-347.
[18] Levine HD, Lown B, Streeper RB. The Clinical
Significance of Postextrasystolic T-Wave Changes.
Circulation 1952; 6;538-548.
[19] Mann RH, Burchell HB. The significance of T-wave
inversion in sinus beats following ventricular extrasystoles.
Am Heart J 1954: 47:504-513.
[20] Rosenbaum MB, Blanco HH, Elizari MV.
Electrocardiographic characteristics and main causes of
pseudoprimary T wave changes. Significance of
concordant and discordant T waves in the human and other
animal species Ann NY Acad Sci 1990; 601:36-50.
[21] Jackman WM, Friday KJ, Anderson JL, Aliot EM, Clark
M, Lazzara R. The Long QT Syndromes: A Critical
Review, New Clinical Observations and a Unifying
Hypothesis. Prog Cardiovasc Dis 1988; XXXI:115-172.
Address for correspondence:
Dr. Velislav Batchvarov, MD
Division of Cardiac and Vascular Sciences,
St. George’s, University of London,
Cranmer Terrace, London SW17 0RE,
United Kingdom.
e-mail: [email protected]
454
![Vital Signs Monitoring using a New Flexible Polymer ...cinc.mit.edu/archives/2013/pdf/0265.pdfvital signs [2]. Numbers of occupations require employees to perform duties under hazardous](https://img.pdfslide.us/doc/110x75/5feeae2e0aae6c1c37097479/vital-signs-monitoring-using-a-new-flexible-polymer-cincmiteduarchives2013pdf0265pdf.jpg)


![Mechano-Electrical Feedback during Cardiac ...cinc.mit.edu/archives/2010/pdf/0833.pdf · Ks. In addition to changes in K+ currents, Aiba et al. [6] observed differ-ences in I Ca,L](https://img.pdfslide.us/doc/110x75/60711ffd47c7db5b190f7b42/mechano-electrical-feedback-during-cardiac-cincmiteduarchives2010pdf0833pdf.jpg)