Embed Size (px)
Citation preview
Post-Embryonic Nerve-Associated Precursors to AdultPigment Cells: Genetic Requirements and Dynamics ofMorphogenesis and DifferentiationErine H. Budi1,2, Larissa B. Patterson1,3, David M. Parichy1*
1 Department of Biology, University of Washington, Seattle, Washington, United States of America, 2 Graduate Program in Molecular and Cellular Biology, University of
Washington, Seattle, Washington, United States of America, 3 Graduate Program in Biology, University of Washington, Seattle, Washington, United States of America
Abstract
The pigment cells of vertebrates serve a variety of functions and generate a stunning variety of patterns. These cells are alsoimplicated in human pathologies including melanoma. Whereas the events of pigment cell development have been studiedextensively in the embryo, much less is known about morphogenesis and differentiation of these cells during post-embryonic stages. Previous studies of zebrafish revealed genetically distinct populations of embryonic and adultmelanophores, the ectotherm homologue of amniote melanocytes. Here, we use molecular markers, vital labeling, time-lapse imaging, mutational analyses, and transgenesis to identify peripheral nerves as a niche for precursors to adultmelanophores that subsequently migrate to the skin to form the adult pigment pattern. We further identify geneticrequirements for establishing, maintaining, and recruiting precursors to the adult melanophore lineage and demonstratenovel compensatory behaviors during pattern regulation in mutant backgrounds. Finally, we show that distinct populationsof latent precursors having differential regenerative capabilities persist into the adult. These findings provide a foundationfor future studies of post-embryonic pigment cell precursors in development, evolution, and neoplasia.
Citation: Budi EH, Patterson LB, Parichy DM (2011) Post-Embryonic Nerve-Associated Precursors to Adult Pigment Cells: Genetic Requirements and Dynamics ofMorphogenesis and Differentiation. PLoS Genet 7(5): e1002044. doi:10.1371/journal.pgen.1002044
Editor: Gregory S. Barsh, Stanford University School of Medicine, United States of America
Received December 15, 2010; Accepted February 18, 2011; Published May 19, 2011
Copyright: � 2011 Budi et al. This is an open-access article distributed under the terms of the Creative Commons Attribution License, which permits unrestricteduse, distribution, and reproduction in any medium, provided the original author and source are credited.
Funding: This research supported by National Institute of General Medical Sciences (http://www.nigms.nih.gov/), National Institutes of Health grant R01GM062182 to DMP. The funders had no role in study design, data collection and analysis, decision to publish, or preparation of the manuscript.
Competing Interests: The authors have declared that no competing interests exist.
* E-mail: [email protected]
Introduction
A fundamental challenge for modern developmental biology is
to determine how populations of stem and progenitor cells are
established, maintained, and recruited to differentiate at particular
times and places during post-embryonic development and in the
adult organism. The significance of the problem cannot be
overstated. Not only are these cells essential for normal
development and homeostasis, but understanding their biology
has profound translational importance. If we seek to evoke
regenerative responses in a clinical content, then post-embryonic
stem and progenitor populations may well supply the cells for
doing so [1–3]. If we hope to delay natural tissue senescence, it is
the life cycle of these cells that may need to be manipulated [4–7].
And if we aim to control malignancy, these cells or their
transformed progeny will often be our targets of choice [8–10].
Pigment cells are of great utility for understanding the biology
of post-embryonic stem and progenitor cells. Pigment cells are a
classic and enduring system for studying morphogenesis and
differentiation, and a century of effort has provided a firm
understanding of many aspects of pigment cell development in
the embryo [11–14]. These cells arise from neural crest cells,
which migrate from the dorsal neural tube and contribute not
only to pigment cells, but also glia and neurons of the peripheral
nervous system, bone and cartilage of the craniofacial skeleton,
and more. Despite the long-standing interest in these embryonic
events, it is now clear that pigment cells of adults derive in large
part from post-embryonic stem cells that are themselves of neural
crest origin [15–18]. We know some of the mechanisms that
underlie post-embryonic precursor development yet many
outstanding questions remain. Foremost among these concern
the genes and cellular behaviors by which pigment stem or
progenitor cells are established during early development and
subsequently maintained, whether there exist distinct subpopu-
lations of such cells with different genetic requirements and
potentials, and how these cells are recruited during normal
development and homeostasis.
Answers to these questions will provide insights into the basic
biology of the adult pigment cell lineage, and can inform our
understanding of post-embryonic neural crest derivatives as well as
stem and progenitor cells more generally. These answers are also
of enormous biomedical significance, as the skin pigment cell of
mammals, the melanocyte, is associated with a variety of human
pathologies [19] and transformed cells of this lineage give rise to
melanoma, one of the most common cancers [20,21] and also one
of the most deadly [21–25]. Poor outcomes reflect the inefficacy of
non-surgical treatments and the highly invasive character of
melanoma cells [26–29]. This invasiveness results in part from
neural crest and melanocyte-specific factors that are already
expressed by untransformed precursors, as well as lineage-specific
factors that are re-expressed upon transformation [30]. Better
understanding the genetic requirements and dynamics of melano-
PLoS Genetics | www.plosgenetics.org 1 May 2011 | Volume 7 | Issue 5 | e1002044
cyte development and homeostasis can thus provide insights into
the behaviors of transformed cells, and may suggest novel
strategies for clinical intervention.
In recent years, the zebrafish has proven to be a tractable system
for elucidating features of pigment cell development in the embryo
and during the larval-to-adult transformation, a period of post-
embryonic development analogous to later organogenesis, fetal
and neonatal development of mammals [31–33]. In the embryo,
neural crest cells differentiate into embryonic/early larval
melanophores, the zebrafish homologue of mammalian melano-
cytes. Melanophores and melanocytes depend on many of the
same genes and pathways [12,14,34], and melanomas with
characteristics equivalent to those of human melanomas can be
induced in zebrafish [18,34,35].
The development of zebrafish adult pigmentation involves a
‘‘pigment pattern metamorphosis’’ in which an embryonic/early
larval pigment pattern is transformed into that of the adult
[12,33,36–38]. Whereas the embryonic/early larval pigment cells
and pattern develop by 3.6 SSL (standardized standard length
[33]; about 4 days post-fertilization), new ‘‘metamorphic’’
melanophores begin to differentiate scattered over the flank by
5.9 SSL and ultimately migrate to form the adult stripes.
Simultaneously, additional metamorphic melanophores appear
already at sites of stripe formation, and many embryonic/early
larval melanophores are lost. These events culminate in a juvenile
pigment pattern by 11.0 SSL (4–5 weeks post-fertilization),
consisting of two melanophore stripes bounding a lighter
‘‘interstripe’’. Melanophores comprising these stripes reside in
the ‘‘hypodermis’’ between the epidermis and the myotomes
[39,40]. Other adult melanophores are found in the epidermis, the
dorsal scales, and the fins. Two additional classes of pigment cells
also develop: yellow–orange xanthophores, which populate the
interstripe and are required for organizing melanophores into
stripes [38,41,42]; and iridescent iridophores, which are initially
limited to the interstripe but later occupy melanophore stripes as
well [33]. During later adult development, additional stripes and
interstripes are added as the fish grows.
Mutants with pigment pattern defects limited to post-embryonic
stages have suggested a model in which embryonic/early larval
melanophores develop directly from the neural crest, whereas
metamorphic melanophores develop from latent stem cells of
presumptive neural crest origin. For example, picasso and puma
mutants have normal embryonic/early larval melanophores, but
profound deficiencies in their complements of metamorphic
melanophores. picasso encodes the neuregulin receptor erbb3b,
which acts both autonomously and non-autonomously to the
metamorphic melanophore lineage. Pharmacological inhibition of
ErbB signaling further revealed that erbb3b activity is required
during neural crest migration for the later development of
metamorphic melanophores, suggesting this locus is essential for
establishing a pool of precursors that will differentiate only later
during the larval-to-adult transformation [43]. By contrast, puma
encodes tubulin alpha 8-like 3a (tuba8l3a) and acts autonomously
to the metamorphic melanophore lineage. The temperature
sensitivity of this allele allowed the identification of a critical
period during pigment pattern metamorphosis, suggesting a role in
maintaining or expanding a population of latent precursors, or
recruiting these cells as melanophores [36,44,45].
To date it has not been known where latent precursors to
metamorphic melanophores reside, how erbb3b, tuba8l3a or other
loci promote the normal morphogenesis and differentiation of
these cells and their progeny, or whether pigment cell precursors
have indefinite or more limited re-population potential. Here we
investigate these issues using molecular marker analyses, transgen-
esis, vital labeling, and time-lapse imaging in wild-type and mutant
backgrounds. We show that during post-embryonic development,
proliferative pigment cell precursors are associated with peripheral
nerves and ganglia, and migrate to the hypodermis during pigment
pattern metamorphosis where they differentiate as melanophores
and iridophores. Nerve-associated pigment cell precursors are
missing or reduced in ErbB-deficient and tuba8l3a mutant
backgrounds. By contrast, these precursors persist in other mutants
having less severe metamorphic melanophore deficiencies, though
their subsequent development is marked both by defects, and
partial regulation, of morphogenesis and differentiation. Finally,
we show that latent precursors persist into the adult but that
different precursor pools have different regenerative potentials.
These findings provide a critical context for understanding the
cellular bases of adult melanophore development, the mechanistic
underpinnings of mutant phenotypes, and the roles for latent
precursors in adult homeostasis, regeneration, and neoplasia.
Results
A melanogenic, erbb3b-dependent population of extra-hypodermal progenitor cells
To identify tissues that might harbor latent precursors to adult
melanophores, we examined post-embryonic zebrafish for tran-
scripts expressed by embryonic neural crest cells, reasoning that
some of the cells expressing such markers might comprise a
population of undifferentiated melanophore precursors. We
examined foxd3 and sox10, which are expressed by early neural
crest cells, subpopulations of neural crest-derived glia, and some
other cell types [46–49], as well as crestin, which is known only to
be expressed by neural crest cells and their derivatives [50]. Cells
expressing these loci were present in the hypodermis where the
adult pigment pattern forms, but also in the myotomes, adjacent to
the spinal cord, and at the bases of the fins (Figure 1A–1G), raising
the possibility of both hypodermal and ‘‘extra-hypodermal’’
precursors for metamorphic melanophores.
If extra-hypodermal, post-embryonic cells expressing genes
typical of early neural crest cells contribute to metamorphic
melanophores, we hypothesized that some of these cells should
Author Summary
Understanding the biology of post-embryonic stem andprogenitor cells is of both basic and translationalimportance. To identify mechanisms by which stem andprogenitor cells are established, maintained, and recruitedto particular fates, we are using the zebrafish adultpigment pattern. Previous work showed that embryonicand adult pigment cells have different genetic require-ments, but little is known about the molecular orproliferative phenotypes of precursors to adult pigmentcells or where these precursors reside during post-embryonic development. We show here that post-embry-onic pigment cell precursors are associated with peripheralnerves and that these cells migrate to the skin during thelarval-to-adult transformation when the adult pigmentpattern forms. We also define morphogenetic anddifferentiative roles for several genes in promoting theseevents. Finally, we demonstrate that latent precursor poolspersist into the adult and that different pools havedifferent capacities for supplying new pigment cells inthe context of pattern regeneration. Our study sets thestage for future analyses to identify additional commonand essential features of pigment stem cell biology.
Zebrafish Adult Melanophore Precursors
PLoS Genetics | www.plosgenetics.org 2 May 2011 | Volume 7 | Issue 5 | e1002044
differentiate if supplied with appropriate trophic support. To test
this idea, we used a heat-shock inducible transgenic line,
Tg(hsp70::kitla)wp.r.t2, to misexpress the melanogenic factor kit
ligand-a (kitla) [51] throughout the larva (Figure 2A, 2B). These
larvae developed ectopic melanophores deep within the myo-
tomes, which were never found in identically treated siblings
lacking the transgene (Figure 2C–2G).
Previously we showed that erbb3b is essential for establishing
precursors to metamorphic melanophores [43]. Accordingly, if
extra-hypodermal kitla-responsive melanogenic cells and meta-
morphic melanophores arise from a common precursor pool, then
ectopic melanophores should fail to develop in erbb3b mutants
misexpressing kitla. Indeed, erbb3b; Tg(hsp70:kitla) larvae exhibited
,30-fold fewer ectopic melanophores than wild-type Tg(hsp70::ki-
tla) larvae (Figure 2H). A similar outcome was observed when
wild-type larvae were treated with the ErbB inhibitor, AG1478,
during the embryonic critical period for erbb3b activity in
establishing metamorphic melanophore precursors [43]. Together,
these results indicated that some extra-hypodermal cells are
competent to differentiate as melanophores in the wild-type, but
that most of these cells are missing when erbb3b activity is lost.
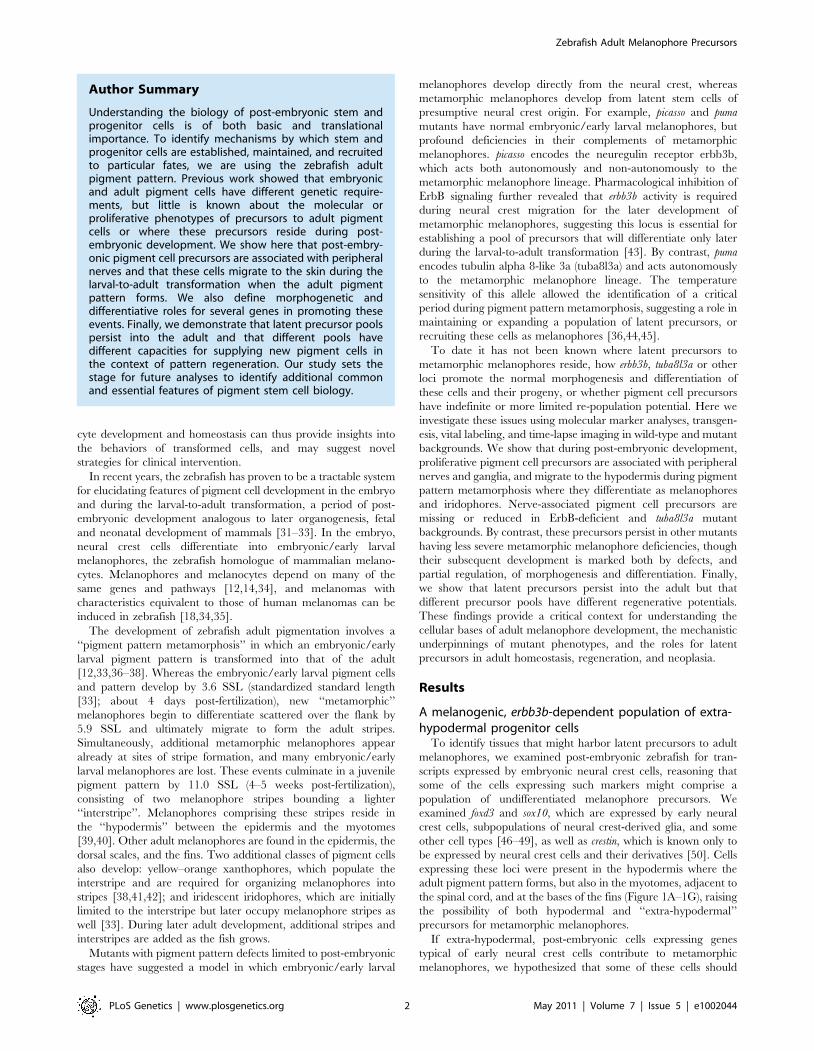
Figure 1. Post-embryonic expression of embryonic neural crestand glial markers. Shown are in situ hybridizations performed ontransverse sections of 7–9 SSL larvae. (A) foxd3 transcript was detectedin dorsal root ganglia (arrow) and scattered cells (e.g., arrowheads)within the myotome (m) and near the epidermis (e). (B) sox10expression by cells adjacent to the neural tube (arrow) and within themyotome (arrowhead). (C) foxd3+ cells (e.g., arrowheads) at the base ofthe dorsal fin (f). (D) foxd3+ cells within the myotomes and near theepidermis. (E–G) foxd3+, sox10+, and crestin+ cells within the myotomes.(H–J) Cells expressed mitfa (arrowheads), within the horizontalmyoseptum (H), at the surface of the myotome (I), and at the base ofanal fin (J) (see text for details).doi:10.1371/journal.pgen.1002044.g001
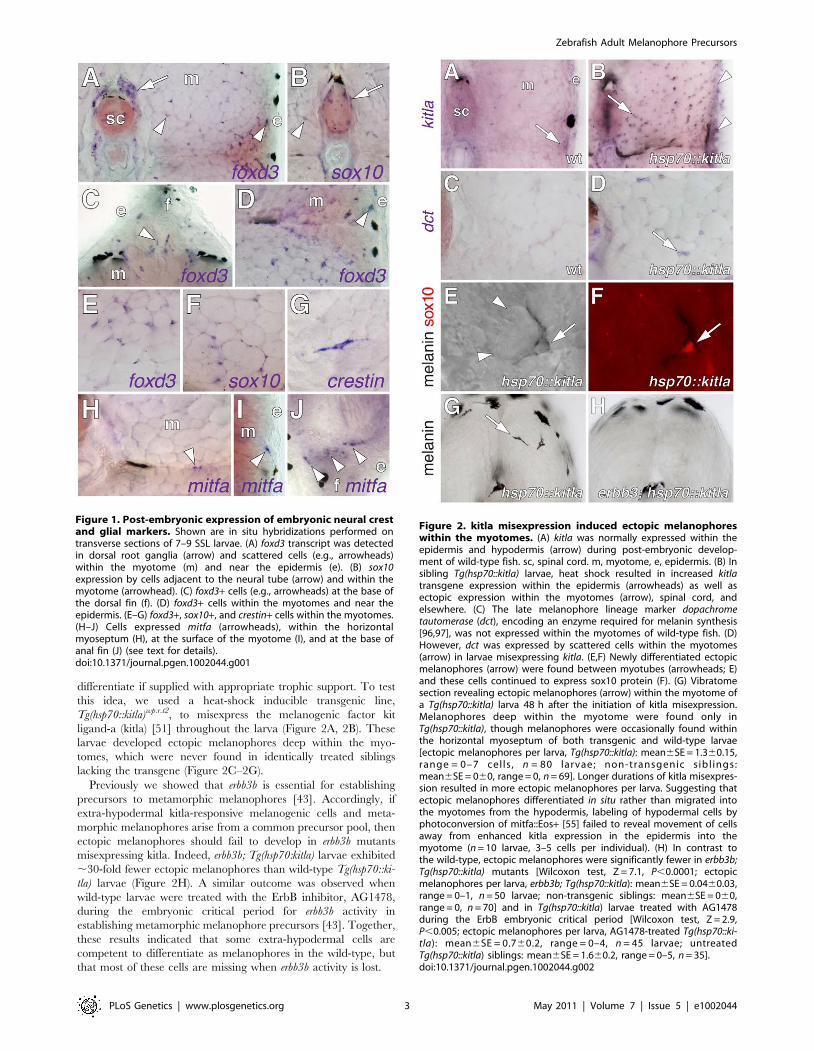
Figure 2. kitla misexpression induced ectopic melanophoreswithin the myotomes. (A) kitla was normally expressed within theepidermis and hypodermis (arrow) during post-embryonic develop-ment of wild-type fish. sc, spinal cord. m, myotome, e, epidermis. (B) Insibling Tg(hsp70::kitla) larvae, heat shock resulted in increased kitlatransgene expression within the epidermis (arrowheads) as well asectopic expression within the myotomes (arrow), spinal cord, andelsewhere. (C) The late melanophore lineage marker dopachrometautomerase (dct), encoding an enzyme required for melanin synthesis[96,97], was not expressed within the myotomes of wild-type fish. (D)However, dct was expressed by scattered cells within the myotomes(arrow) in larvae misexpressing kitla. (E,F) Newly differentiated ectopicmelanophores (arrow) were found between myotubes (arrowheads; E)and these cells continued to express sox10 protein (F). (G) Vibratomesection revealing ectopic melanophores (arrow) within the myotome ofa Tg(hsp70::kitla) larva 48 h after the initiation of kitla misexpression.Melanophores deep within the myotome were found only inTg(hsp70::kitla), though melanophores were occasionally found withinthe horizontal myoseptum of both transgenic and wild-type larvae[ectopic melanophores per larva, Tg(hsp70::kitla): mean6SE = 1.360.15,range = 0–7 cel ls , n = 80 larvae; non-transgenic sibl ings:mean6SE = 060, range = 0, n = 69]. Longer durations of kitla misexpres-sion resulted in more ectopic melanophores per larva. Suggesting thatectopic melanophores differentiated in situ rather than migrated intothe myotomes from the hypodermis, labeling of hypodermal cells byphotoconversion of mitfa::Eos+ [55] failed to reveal movement of cellsaway from enhanced kitla expression in the epidermis into themyotome (n = 10 larvae, 3–5 cells per individual). (H) In contrast tothe wild-type, ectopic melanophores were significantly fewer in erbb3b;Tg(hsp70::kitla) mutants [Wilcoxon test, Z = 7.1, P,0.0001; ectopicmelanophores per larva, erbb3b; Tg(hsp70::kitla): mean6SE = 0.0460.03,range = 0–1, n = 50 larvae; non-transgenic siblings: mean6SE = 060,range = 0, n = 70] and in Tg(hsp70::kitla) larvae treated with AG1478during the ErbB embryonic critical period [Wilcoxon test, Z = 2.9,P,0.005; ectopic melanophores per larva, AG1478-treated Tg(hsp70::ki-tla): mean6SE = 0.760.2, range = 0–4, n = 45 larvae; untreatedTg(hsp70::kitla) siblings: mean6SE = 1.660.2, range = 0–5, n = 35].doi:10.1371/journal.pgen.1002044.g002
Zebrafish Adult Melanophore Precursors
PLoS Genetics | www.plosgenetics.org 3 May 2011 | Volume 7 | Issue 5 | e1002044
Extra-hypodermal melanophore precursors are nerve-associated, proliferative, and specified for themelanophore lineage during the larval-to-adulttransformation
Our identification of extra-hypodermal cells expressing genes
typical of early neural crest and glial cells, as well as kitla-
responsive melanogenic cells within the myotomes, led us to ask
whether any of these cells embark upon a melanophore
differentiation program during normal post-embryonic develop-
ment. Since precursors to metamorphic melanophores require
erbb3b, we further predicted that any candidate extra-hypodermal
precursors of these cells should be missing in larvae deficient for
erbb3b activity.
In the wild-type, we found extra-hypodermal cells expressing
mitfa, encoding a master regulator of melanophore fate specifica-
tion (Figure 1H–1J) [52,53]. Cells expressing mitfa in extra-
hypodermal locations typically did so at lower levels than cells
within the hypodermis and were at the limit of detection given the
sensitivity of in situ hybridization at post-embryonic stages.
However, we also identified extra-hypodermal cells expressing
GFP driven by the proximal mitfa promoter in the transgenic line,
Tg(mitfa::GFP)w47, which faithfully recapitulates mitfa expression in
the melanophore lineage and in bipotent precursors to melano-
phores and iridophores in the embryo [54,55] (Figure 3A; Videos
S1, S2). In contrast to the wild-type, mitfa::GFP+ cells were largely
absent from both erbb3b mutants and wild-type larvae treated with
AG1478 during the embryonic erbb3b critical period (Figure 3B
and see below; Video S3). In neither genetic background could we
detect extra-hypodermal cells expressing transcript for dct,
encoding a melanin synthesis enzyme.
The many extra-hypodermal mitfa::GFP+ cells in larvae
contrasts with embryogenesis [54] and suggests that extra-
hypodermal cells may be specified for the melanophore lineage
during the larval-to-adult transformation. If so, we predicted that
cells expressing markers typical of early neural crest cells (or glia)
should occassionally be found to express mitfa::GFP as well. We
therefore examined larvae for simultaneous expression of mit-
fa::GFP, sox10, and foxd3, and, to learn where these cells reside,
we examined larvae with cell-type specific markers for surrounding
tissues. These analyses revealed numerous mitfa::GFP+ cells
associated with peripheral nerves and ganglia, including the doral
root ganglia, ventral motor root fibers, lateral line nerve, and nerve
fibers coursing through the myotomes (Figure 3E–3H; Figure S1).
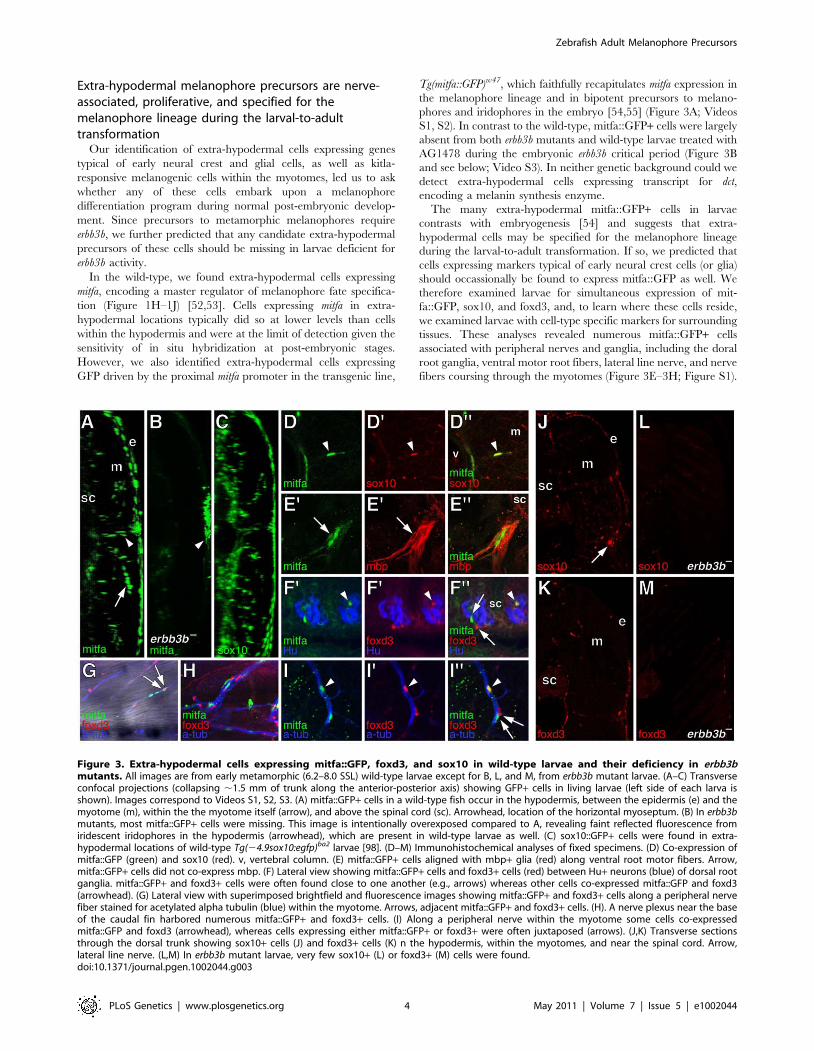
Figure 3. Extra-hypodermal cells expressing mitfa::GFP, foxd3, and sox10 in wild-type larvae and their deficiency in erbb3bmutants. All images are from early metamorphic (6.2–8.0 SSL) wild-type larvae except for B, L, and M, from erbb3b mutant larvae. (A–C) Transverseconfocal projections (collapsing ,1.5 mm of trunk along the anterior-posterior axis) showing GFP+ cells in living larvae (left side of each larva isshown). Images correspond to Videos S1, S2, S3. (A) mitfa::GFP+ cells in a wild-type fish occur in the hypodermis, between the epidermis (e) and themyotome (m), within the the myotome itself (arrow), and above the spinal cord (sc). Arrowhead, location of the horizontal myoseptum. (B) In erbb3bmutants, most mitfa::GFP+ cells were missing. This image is intentionally overexposed compared to A, revealing faint reflected fluorescence fromiridescent iridophores in the hypodermis (arrowhead), which are present in wild-type larvae as well. (C) sox10::GFP+ cells were found in extra-hypodermal locations of wild-type Tg(24.9sox10:egfp)ba2 larvae [98]. (D–M) Immunohistochemical analyses of fixed specimens. (D) Co-expression ofmitfa::GFP (green) and sox10 (red). v, vertebral column. (E) mitfa::GFP+ cells aligned with mbp+ glia (red) along ventral root motor fibers. Arrow,mitfa::GFP+ cells did not co-express mbp. (F) Lateral view showing mitfa::GFP+ cells and foxd3+ cells (red) between Hu+ neurons (blue) of dorsal rootganglia. mitfa::GFP+ and foxd3+ cells were often found close to one another (e.g., arrows) whereas other cells co-expressed mitfa::GFP and foxd3(arrowhead). (G) Lateral view with superimposed brightfield and fluorescence images showing mitfa::GFP+ and foxd3+ cells along a peripheral nervefiber stained for acetylated alpha tubulin (blue) within the myotome. Arrows, adjacent mitfa::GFP+ and foxd3+ cells. (H). A nerve plexus near the baseof the caudal fin harbored numerous mitfa::GFP+ and foxd3+ cells. (I) Along a peripheral nerve within the myotome some cells co-expressedmitfa::GFP and foxd3 (arrowhead), whereas cells expressing either mitfa::GFP+ or foxd3+ were often juxtaposed (arrows). (J,K) Transverse sectionsthrough the dorsal trunk showing sox10+ cells (J) and foxd3+ cells (K) n the hypodermis, within the myotomes, and near the spinal cord. Arrow,lateral line nerve. (L,M) In erbb3b mutant larvae, very few sox10+ (L) or foxd3+ (M) cells were found.doi:10.1371/journal.pgen.1002044.g003
Zebrafish Adult Melanophore Precursors
PLoS Genetics | www.plosgenetics.org 4 May 2011 | Volume 7 | Issue 5 | e1002044
Ectopic melanophores within the myotomes of wild-type
Tg(hsp70:kitla) larvae were likewise nerve-associated (Figure S2).
Double label analyses with markers of neural crest, glial, and
melanophore lineages revealed that, in wild-type larvae, mit-
fa::GFP+ cells were often in close proximity to cells expressing
sox10 and foxd3, and also co-expressed sox10, as expected given
the direct regulation of mitfa by sox10 (Figure 3D, 3G, 3H) [56,57].
We also found that 4–15% of mitfa::GFP+ cells co-expressed
foxd3, with doubly labeled cells occurring most frequently during
early metamorphosis, when the rate of melanophore population
increase is maximal [36] (Figure 3F, 3I; Figure 4A, 4B). This
frequency of double labeling is reminiscent of 15–18 h embryos, in
which 9–12% of mitfa::GFP+ cells are foxd3+ [54]. In contrast to
the co-labeling of mitfa::GFP and foxd3, we did not find
mitfa::GFP expression by myelinating glia expressing myelin basic
protein (mbp) (Figure 3E; Figure S1). As anticipated, however,
some cells expressing foxd3 or sox10 co-expressed mbp. All of
these cell types were deficient in erbb3b mutants and wild-type
larvae treated with AG1478 during the embryonic erbb3b critical
period (Figure 3J–3M; Figure 4A, 4B; Figure S4), though a few
residual mitfa::GFP+ and foxd3+ cells occurred in anterior and
posterior regions, corresponding to axial levels where a few
residual melanophores develop during metamorphosis [43] (data
not shown).
If some foxd3+ and sox10+ cells are progenitors to post-
embryonic melanoblasts, we predicted that a period of population
expansion could precede the appearance of mitfa::GFP+ cells,
which might themselves be proliferative. Consistent with this idea,
we found EdU incorporation by all three cell types but EdU-
labeling of post-embryonic foxd3+ and sox10+ cells was most
frequent prior to pigment pattern metamorphosis, whereas EdU-
labeling of mitfa::GFP+ cells was most frequent during the peak of
pigment pattern metamorphosis (Figure 4C, Figure 5). Given these
findings, we further asked if doubly labeled foxd3+; mitfa::GFP+cells constitute an especially proliferative population. These
analyses revealed EdU-incorporation in 55% of foxd3+; mit-
fa::GFP+ cells, a significantly higher frequency than for cells
expressing only foxd3 (17% EdU+) or only mitfa::GFP (24%
EdU+; x2 = 131.7, d.f. = 2, P,0.0001). The frequency of EdU
labeling amongst foxd3+; mitfa::GFP+ cells did not vary
significantly across stages (x2 = 2.3, d.f. = 2, P = 0.3). Finally, in
erbb3b mutants sampled at selected stages, we found lower levels of
EdU incorporation than in wild-type, though small numbers of
cells overall resulted in correspondingly low statistical power
(Figure 4C; Figure S4).
The foregoing analyses indicated that, during post-embryonic
development, a proliferative population of extra-hypodermal,
erbb3b-dependent foxd3+ and sox10+ cells associated with
peripheral nerves and ganglia becomes specified as precursors to
melanophores (or as bipotential precursors to melanophores and
iridophores; see reference [55]).
Extra-hypodermal cells contribute to the hypodermalpopulations of metamorphic melanophores andiridophores
The development of post-embryonic, extra-hypodermal mit-
fa::GFP+ cells suggested the possibility that such cells migrate to
the hypodermis during metamorphosis. To test this idea, we
injected DiI into the myotomes, the horizontal myoseptum, or the
base of the dorsal fin of wild-type or Tg(mitfa::GFP) larvae and we
assessed after $4 d whether DiI-labeled cells were present within
the hypodermis distant from the injection sites. In 10–30% of
injected larvae we found hypodermal DiI-labeled melanized cells,
mitfa::GFP+ cells, or iridophores (Figure 6), indicating that some
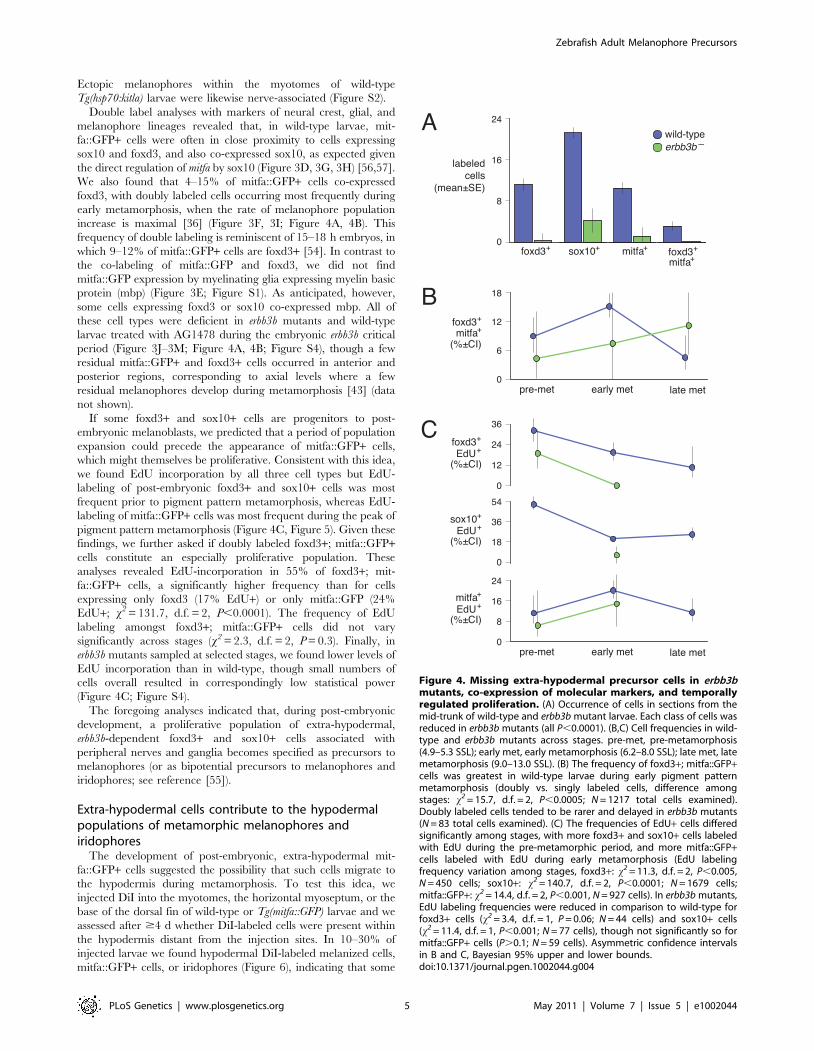
Figure 4. Missing extra-hypodermal precursor cells in erbb3bmutants, co-expression of molecular markers, and temporallyregulated proliferation. (A) Occurrence of cells in sections from themid-trunk of wild-type and erbb3b mutant larvae. Each class of cells wasreduced in erbb3b mutants (all P,0.0001). (B,C) Cell frequencies in wild-type and erbb3b mutants across stages. pre-met, pre-metamorphosis(4.9–5.3 SSL); early met, early metamorphosis (6.2–8.0 SSL); late met, latemetamorphosis (9.0–13.0 SSL). (B) The frequency of foxd3+; mitfa::GFP+cells was greatest in wild-type larvae during early pigment patternmetamorphosis (doubly vs. singly labeled cells, difference amongstages: x2 = 15.7, d.f. = 2, P,0.0005; N = 1217 total cells examined).Doubly labeled cells tended to be rarer and delayed in erbb3b mutants(N = 83 total cells examined). (C) The frequencies of EdU+ cells differedsignificantly among stages, with more foxd3+ and sox10+ cells labeledwith EdU during the pre-metamorphic period, and more mitfa::GFP+cells labeled with EdU during early metamorphosis (EdU labelingfrequency variation among stages, foxd3+: x2 = 11.3, d.f. = 2, P,0.005,N = 450 cells; sox10+: x2 = 140.7, d.f. = 2, P,0.0001; N = 1679 cells;mitfa::GFP+: x2 = 14.4, d.f. = 2, P,0.001, N = 927 cells). In erbb3b mutants,EdU labeling frequencies were reduced in comparison to wild-type forfoxd3+ cells (x2 = 3.4, d.f. = 1, P = 0.06; N = 44 cells) and sox10+ cells(x2 = 11.4, d.f. = 1, P,0.001; N = 77 cells), though not significantly so formitfa::GFP+ cells (P.0.1; N = 59 cells). Asymmetric confidence intervalsin B and C, Bayesian 95% upper and lower bounds.doi:10.1371/journal.pgen.1002044.g004
Zebrafish Adult Melanophore Precursors
PLoS Genetics | www.plosgenetics.org 5 May 2011 | Volume 7 | Issue 5 | e1002044
extra-hypodermal cells migrated to the hypodermis during
metamorphosis.
To further test the hypothesis that extra-hypodermal cells
contribute to the hypodermal melanophore population, we
examined cell behaviors by time-lapse imaging of trunks derived
from Tg(mitfa::GFP) larvae. Movies revealed the differentiation of
mitfa::GFP+ cells into melanophores as well as their migration
(Figure 7A; Videos S4, S5, S6). We therefore assessed the
migratory pathways by which mitfa::GFP+ cells had reached the
hypodermis. Approximately half of all mitfa::EGFP+ cells arrived
within the hypodermis during imaging. Some entered the
hypodermis after migrating over the dorsal or ventral margins of
the myotomes, whereas others originated from within the
myotomes, emerging either from the vicinity of the horizontal
myoseptum or along vertical myosepta (Figure 7B–7D, Figure 8;
Videos S7, S8, S9, S10). Movies also revealed the movement of
mitfa::GFP+ cells along nerves and their detachment from nerves
to migrate more broadly through the fish (Videos S11, S12).
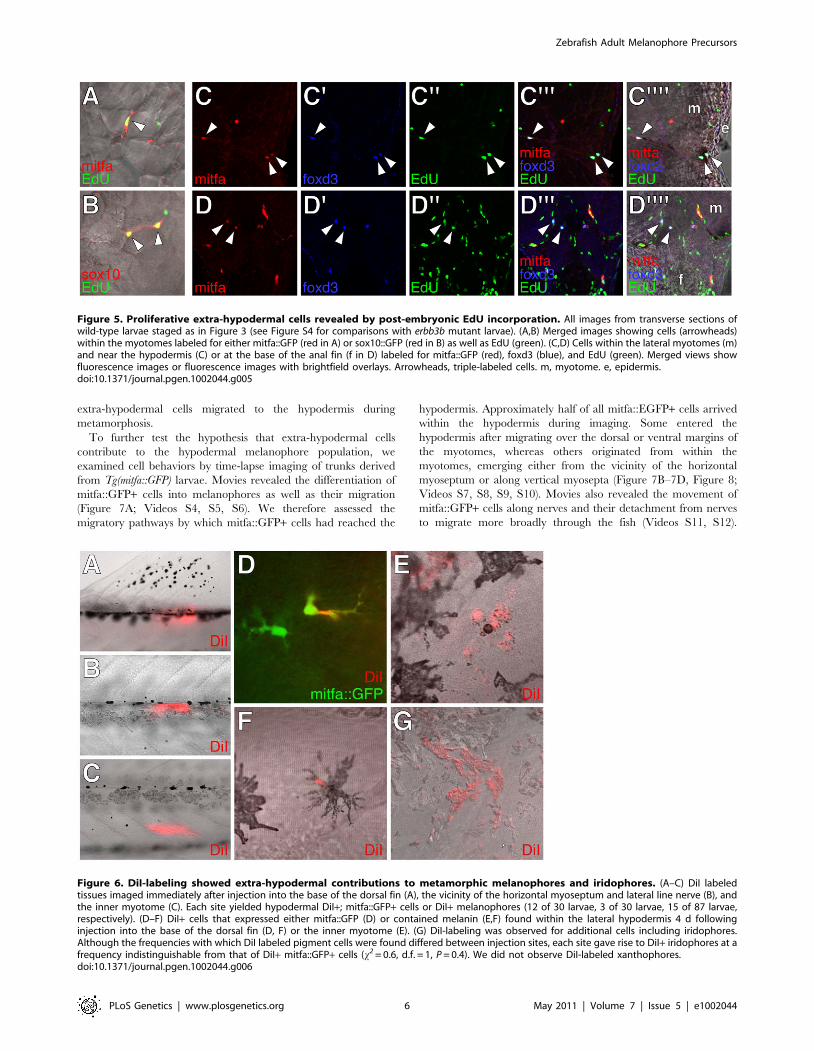
Figure 5. Proliferative extra-hypodermal cells revealed by post-embryonic EdU incorporation. All images from transverse sections ofwild-type larvae staged as in Figure 3 (see Figure S4 for comparisons with erbb3b mutant larvae). (A,B) Merged images showing cells (arrowheads)within the myotomes labeled for either mitfa::GFP (red in A) or sox10::GFP (red in B) as well as EdU (green). (C,D) Cells within the lateral myotomes (m)and near the hypodermis (C) or at the base of the anal fin (f in D) labeled for mitfa::GFP (red), foxd3 (blue), and EdU (green). Merged views showfluorescence images or fluorescence images with brightfield overlays. Arrowheads, triple-labeled cells. m, myotome. e, epidermis.doi:10.1371/journal.pgen.1002044.g005
Figure 6. DiI-labeling showed extra-hypodermal contributions to metamorphic melanophores and iridophores. (A–C) DiI labeledtissues imaged immediately after injection into the base of the dorsal fin (A), the vicinity of the horizontal myoseptum and lateral line nerve (B), andthe inner myotome (C). Each site yielded hypodermal DiI+; mitfa::GFP+ cells or DiI+ melanophores (12 of 30 larvae, 3 of 30 larvae, 15 of 87 larvae,respectively). (D–F) DiI+ cells that expressed either mitfa::GFP (D) or contained melanin (E,F) found within the lateral hypodermis 4 d followinginjection into the base of the dorsal fin (D, F) or the inner myotome (E). (G) DiI-labeling was observed for additional cells including iridophores.Although the frequencies with which DiI labeled pigment cells were found differed between injection sites, each site gave rise to DiI+ iridophores at afrequency indistinguishable from that of DiI+ mitfa::GFP+ cells (x2 = 0.6, d.f. = 1, P = 0.4). We did not observe DiI-labeled xanthophores.doi:10.1371/journal.pgen.1002044.g006
Zebrafish Adult Melanophore Precursors
PLoS Genetics | www.plosgenetics.org 6 May 2011 | Volume 7 | Issue 5 | e1002044
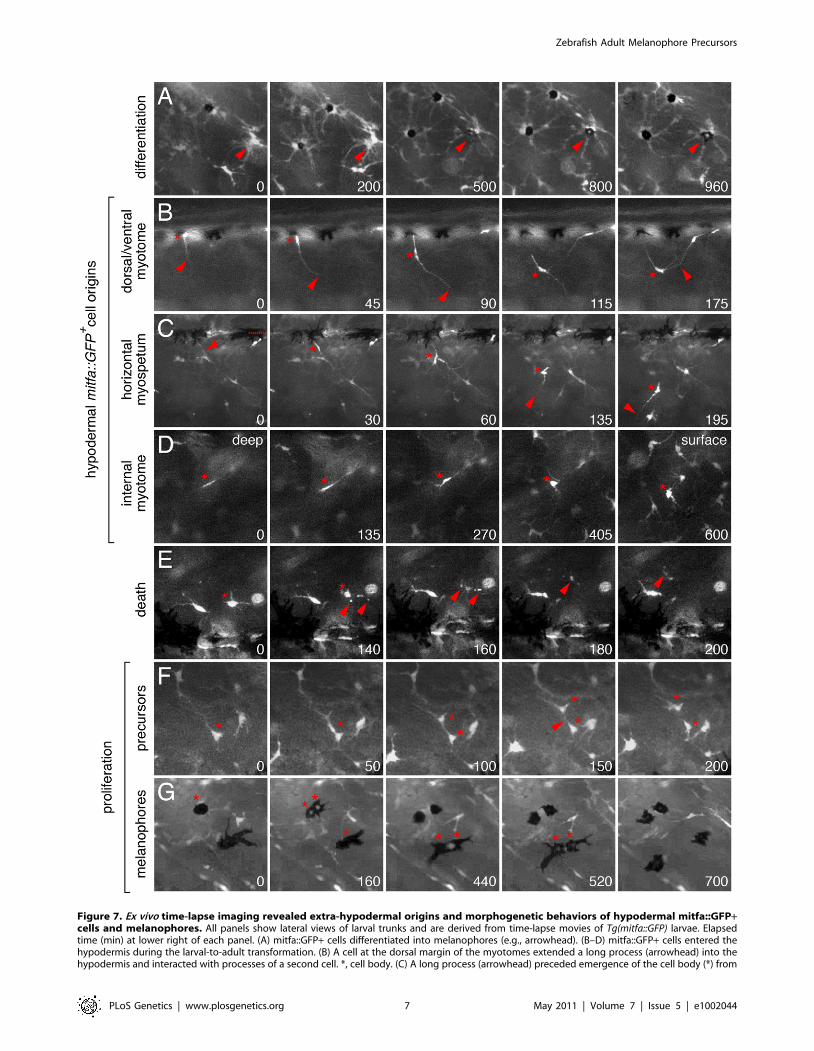
Figure 7. Ex vivo time-lapse imaging revealed extra-hypodermal origins and morphogenetic behaviors of hypodermal mitfa::GFP+cells and melanophores. All panels show lateral views of larval trunks and are derived from time-lapse movies of Tg(mitfa::GFP) larvae. Elapsedtime (min) at lower right of each panel. (A) mitfa::GFP+ cells differentiated into melanophores (e.g., arrowhead). (B–D) mitfa::GFP+ cells entered thehypodermis during the larval-to-adult transformation. (B) A cell at the dorsal margin of the myotomes extended a long process (arrowhead) into thehypodermis and interacted with processes of a second cell. *, cell body. (C) A long process (arrowhead) preceded emergence of the cell body (*) from
Zebrafish Adult Melanophore Precursors
PLoS Genetics | www.plosgenetics.org 7 May 2011 | Volume 7 | Issue 5 | e1002044
Together then, DiI labeling and time-lapse imaging indicated that
extra-hypodermal cells contribute to hypodermal mitfa::GFP+cells, melanophores, and iridophores during the larval-to-adult
transformation.
Genetic requirements for extra-hypodermal precursormorphogenesis and differentiation
Our findings suggested that a normal complement of adult
melanophores depends on contributions from a pool of extra-
hypodermal precursors. If this is the case, we predicted that
mutants with severe metamorphic melanophore deficiencies
should have correspondingly severe deficiencies of extra-hypoder-
mally derived mitfa:GFP+ cells. To test the contributions of extra-
hypodermal cells to hypodermal mitfa::GFP+ cells and melano-
phores, we crossed the Tg(mitfa::GFP) transgene into erbb3b and
tuba8l3a mutants, which exhibit severely reduced numbers of
metamorphic melanophores [36,43,44].
In comparison to the wild-type, and as predicted from the
foregoing analyses, erbb3b mutants had dramatically fewer extra-
hypodermally derived mitfa::GFP+ cells (Figure 9A; Video S13).
erbb3b mutant mifa::GFP+ cells originated from the vicinity of the
horizontal myoseptum (Figure 9B), and once in the hypodermis,
these cells were more likely to differentiate and to divide
(Figure 9C; in contrast to the somewhat reduced rates of EdU
incorporation prior to reaching the hypodermis shown in
Figure 4C). tuba8l3a mutants also had significantly fewer extra-
hypodermally derived mitfa::GFP+ cells. These cells were more
likely to differentiate, but divided at only one-third the frequency
of the wild-type (Figure 9; Video S14). tuba8l3a mutants exhibit a
post-embryonic demyelination of the peripheral nervous system
[44], and we found that regions exhibiting mbp+ glial deficiencies
and peripheral nerve defasciculation had fewer mitfa::GFP+ and
foxd3+ cells (Figure 10). We did not observe cells doubly labeled
for foxd3 and mitfa::GFP in tuba8l3a mutants.
Amongst the erbb3b- and tuba8l3a-dependent metamorphic
melanophore populations, are temporally and genetically distinct
subpopulations, comprising early metamorphic melanophores that
are initially dispersed but later migrate into stripes, and late
metamorphic melanophores that develop already at sites of stripe
formation [37,43,45] (Figure S5). Early metamorphic melano-
phores are ablated in kita mutants, but persist in colony stimulating
factor-1 receptor (csf1r) and endothelin receptor b1 (ednrb1) mutants. By
contrast, late metamorphic melanophores persist in kita mutants,
but are ablated in csf1r and ednrb1 mutants [37,38,58,59]. To test if
these differences reflect differential persistence of distinct precursor
pools, or differences in the subsequent morphogenesis and
differentiation of cells arising from a common precursor pool,
we crossed the Tg(mitfa::GFP) transgene into kitab5, csf1rj4e1 and
ednrb1b140 mutants and examined the origins of hypodermal
mitfa::GFP+ cells as well as their frequencies of differentiation,
death and proliferation.
In contrast to erbb3b and tuba8l3a mutants, kita, csf1r, and ednrb1
mutants did not exhibit significantly fewer extra-hypodermally
derived mitfa::GFP+ cells than the wild-type, though cells in kita
mutants typically failed to differentiate and instead died at high
frequency, whereas cells in csf1r and ednrb1 mutants were more
likely both to differentiate and to die (Figure 9; Video S15). We did
not observe gross defects in mitfa:GFP+ cell motility in any of the
mutant backgrounds. Finally, in contrast to the proliferation of
unmelanized mitf::GFP+ cells (Figure 9C), proliferation of
differentiated melanophores was rare in the wild-type (0.1%;
N = 3822 melanophores observed) and in most of the mutants
(0.2–0.4%; N = 4358 melanophore observed). In kita mutants,
however, the few melanophores that differentiated divided
frequently (14%; N = 35 melanophores observed; variation among
genotypes: x2 = 38.1, d.f. = 5, P,0.0001; Video S16). Together
these data show that erbb3b and tuba8l3a each promote the
development of extra-hypodermal mitfa::GFP+ cells, whereas all
five loci promote the differentiation and morphogenesis of these
cells once they reach the hypodermis.
Latent melanophore precursors in adult zebrafishOur demonstration that extra-hypodermal precursors contrib-
ute to hypodermal melanophores led us to ask whether latent
pigment cell precursors persist into the adult. Extra-hypodermal
the level of the horizontal myoseptum (dotted line). This cell subsequently interacted with a neighboring cell, extended a processes ventrally, andmoved in that direction. (D) A cell initially deep within the myotome (*) emerged into the hypodermis. The focal plane changes across panels, fromdeep within the myotome to the surface of the myotome and hypodermis, where other cells are found already. (E) Death of mitfa::GFP+ cell (*)revealed by fragmentation and cellular debris (arrowheads). (F,G) mitfa::GFP+ cells (F) and melanophores that retain some residual GFP expression (G)proliferating within the hypodermis. Melanophores in G are imaged in a kita mutant (see text for details). See supplemental Videos S4, S5, S6, S7, S8,S9, S10, S11, S12, S13, S14, S15, S16.doi:10.1371/journal.pgen.1002044.g007
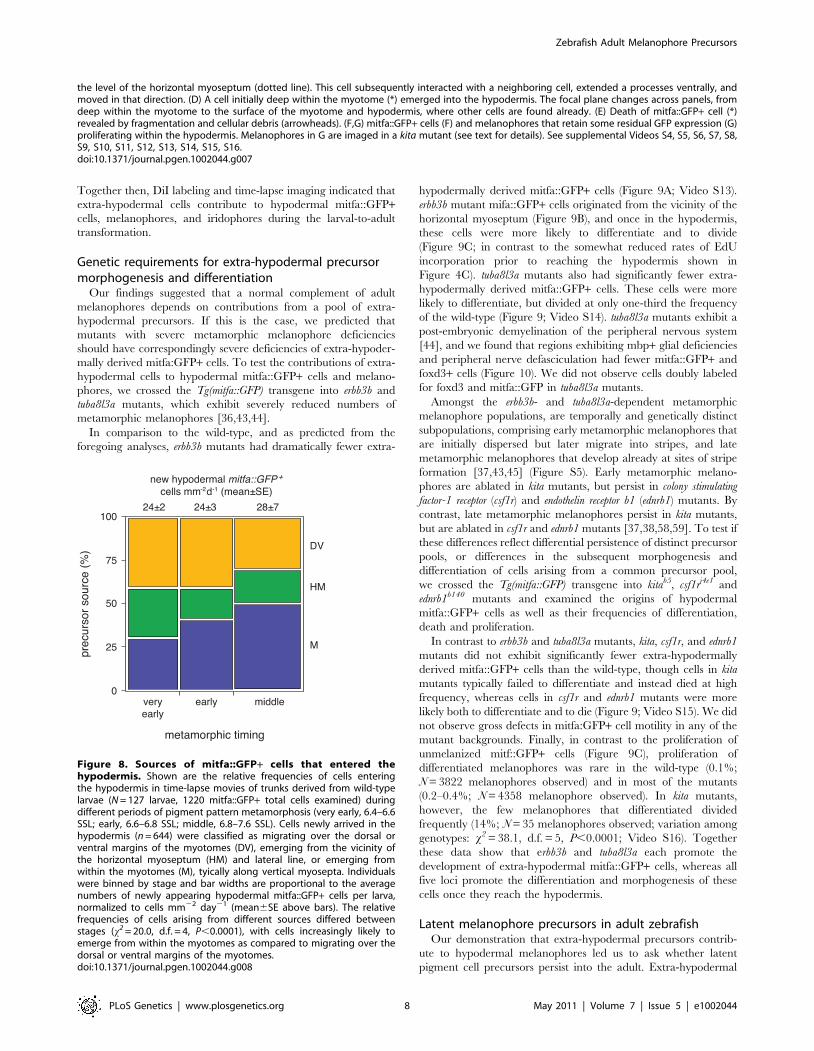
Figure 8. Sources of mitfa::GFP+ cells that entered thehypodermis. Shown are the relative frequencies of cells enteringthe hypodermis in time-lapse movies of trunks derived from wild-typelarvae (N = 127 larvae, 1220 mitfa::GFP+ total cells examined) duringdifferent periods of pigment pattern metamorphosis (very early, 6.4–6.6SSL; early, 6.6–6.8 SSL; middle, 6.8–7.6 SSL). Cells newly arrived in thehypodermis (n = 644) were classified as migrating over the dorsal orventral margins of the myotomes (DV), emerging from the vicinity ofthe horizontal myoseptum (HM) and lateral line, or emerging fromwithin the myotomes (M), tyically along vertical myosepta. Individualswere binned by stage and bar widths are proportional to the averagenumbers of newly appearing hypodermal mitfa::GFP+ cells per larva,normalized to cells mm22 day21 (mean6SE above bars). The relativefrequencies of cells arising from different sources differed betweenstages (x2 = 20.0, d.f. = 4, P,0.0001), with cells increasingly likely toemerge from within the myotomes as compared to migrating over thedorsal or ventral margins of the myotomes.doi:10.1371/journal.pgen.1002044.g008
Zebrafish Adult Melanophore Precursors
PLoS Genetics | www.plosgenetics.org 8 May 2011 | Volume 7 | Issue 5 | e1002044
foxd3+ and mitfa::GFP+ cells were distributed in adult fish
similarly to metamorphic stages and also were found associated
with the scales (Figure S6). To test the capacity of latent precursors
to supply new melanophores, we sought to ablate melanophores
with the goal of provoking a regenerative response. Because fish
doubly mutant for kitab5 and presumptive null alleles of csf1r lack
body melanophores [38], we reasoned that fish doubly mutant for
kitab5 and the temperature-sensitive allele csf1rut.r1e174 (csf1rTS) [60]
should have fewer melanophores (equivalent to kitab5 single
mutants) at permissive temperature, but should lack all melano-
phores at restrictive temperature. Repeated exposure to restrictive
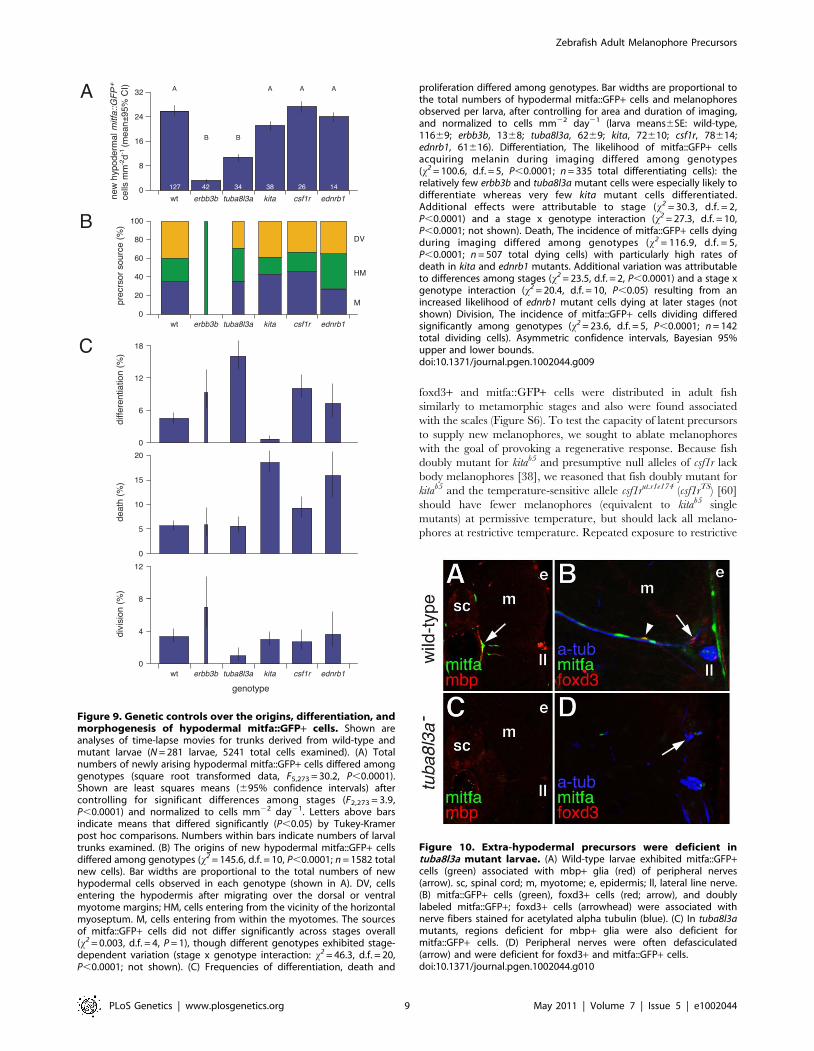
Figure 9. Genetic controls over the origins, differentiation, andmorphogenesis of hypodermal mitfa::GFP+ cells. Shown areanalyses of time-lapse movies for trunks derived from wild-type andmutant larvae (N = 281 larvae, 5241 total cells examined). (A) Totalnumbers of newly arising hypodermal mitfa::GFP+ cells differed amonggenotypes (square root transformed data, F5,273 = 30.2, P,0.0001).Shown are least squares means (695% confidence intervals) aftercontrolling for significant differences among stages (F2,273 = 3.9,P,0.0001) and normalized to cells mm22 day21. Letters above barsindicate means that differed significantly (P,0.05) by Tukey-Kramerpost hoc comparisons. Numbers within bars indicate numbers of larvaltrunks examined. (B) The origins of new hypodermal mitfa::GFP+ cellsdiffered among genotypes (x2 = 145.6, d.f. = 10, P,0.0001; n = 1582 totalnew cells). Bar widths are proportional to the total numbers of newhypodermal cells observed in each genotype (shown in A). DV, cellsentering the hypodermis after migrating over the dorsal or ventralmyotome margins; HM, cells entering from the vicinity of the horizontalmyoseptum. M, cells entering from within the myotomes. The sourcesof mitfa::GFP+ cells did not differ significantly across stages overall(x2 = 0.003, d.f. = 4, P = 1), though different genotypes exhibited stage-dependent variation (stage x genotype interaction: x2 = 46.3, d.f. = 20,P,0.0001; not shown). (C) Frequencies of differentiation, death and
proliferation differed among genotypes. Bar widths are proportional tothe total numbers of hypodermal mitfa::GFP+ cells and melanophoresobserved per larva, after controlling for area and duration of imaging,and normalized to cells mm22 day21 (larva means6SE: wild-type,11669; erbb3b, 1368; tuba8l3a, 6269; kita, 72610; csf1r, 78614;ednrb1, 61616). Differentiation, The likelihood of mitfa::GFP+ cellsacquiring melanin during imaging differed among genotypes(x2 = 100.6, d.f. = 5, P,0.0001; n = 335 total differentiating cells): therelatively few erbb3b and tuba8l3a mutant cells were especially likely todifferentiate whereas very few kita mutant cells differentiated.Additional effects were attributable to stage (x2 = 30.3, d.f. = 2,P,0.0001) and a stage x genotype interaction (x2 = 27.3, d.f. = 10,P,0.0001; not shown). Death, The incidence of mitfa::GFP+ cells dyingduring imaging differed among genotypes (x2 = 116.9, d.f. = 5,P,0.0001; n = 507 total dying cells) with particularly high rates ofdeath in kita and ednrb1 mutants. Additional variation was attributableto differences among stages (x2 = 23.5, d.f. = 2, P,0.0001) and a stage xgenotype interaction (x2 = 20.4, d.f. = 10, P,0.05) resulting from anincreased likelihood of ednrb1 mutant cells dying at later stages (notshown) Division, The incidence of mitfa::GFP+ cells dividing differedsignificantly among genotypes (x2 = 23.6, d.f. = 5, P,0.0001; n = 142total dividing cells). Asymmetric confidence intervals, Bayesian 95%upper and lower bounds.doi:10.1371/journal.pgen.1002044.g009
Figure 10. Extra-hypodermal precursors were deficient intuba8l3a mutant larvae. (A) Wild-type larvae exhibited mitfa::GFP+cells (green) associated with mbp+ glia (red) of peripheral nerves(arrow). sc, spinal cord; m, myotome; e, epidermis; ll, lateral line nerve.(B) mitfa::GFP+ cells (green), foxd3+ cells (red; arrow), and doublylabeled mitfa::GFP+; foxd3+ cells (arrowhead) were associated withnerve fibers stained for acetylated alpha tubulin (blue). (C) In tuba8l3amutants, regions deficient for mbp+ glia were also deficient formitfa::GFP+ cells. (D) Peripheral nerves were often defasciculated(arrow) and were deficient for foxd3+ and mitfa::GFP+ cells.doi:10.1371/journal.pgen.1002044.g010
Zebrafish Adult Melanophore Precursors
PLoS Genetics | www.plosgenetics.org 9 May 2011 | Volume 7 | Issue 5 | e1002044
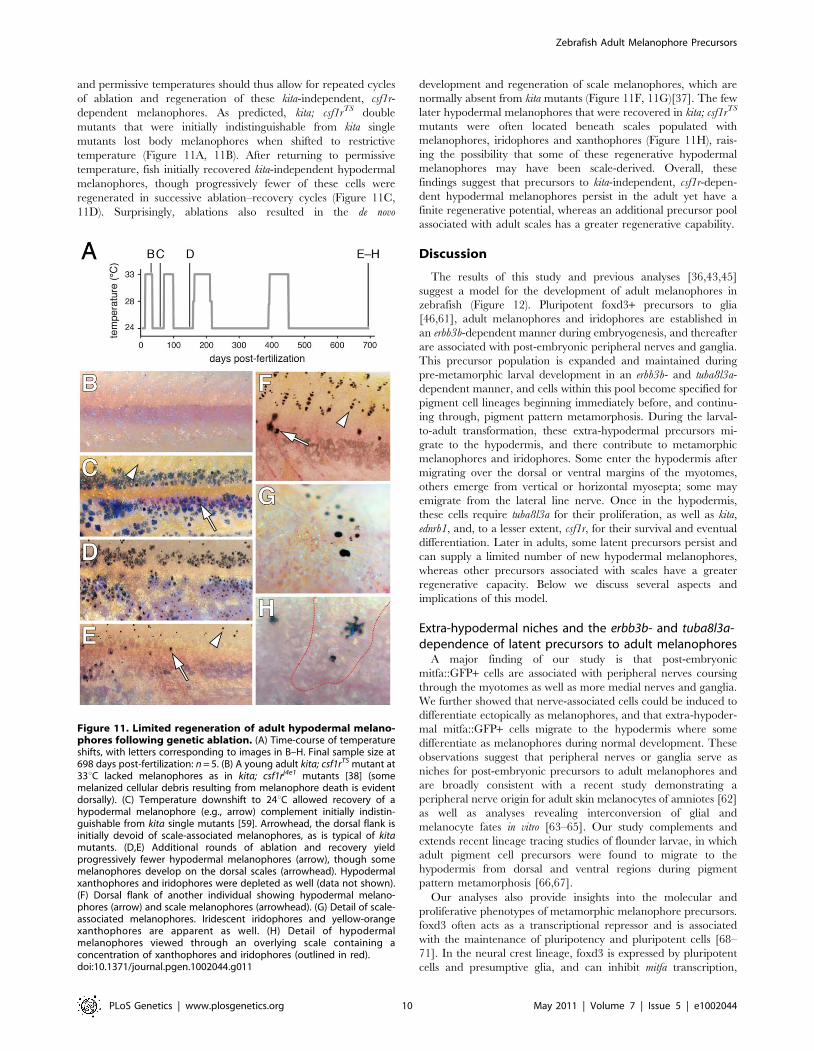
and permissive temperatures should thus allow for repeated cycles
of ablation and regeneration of these kita-independent, csf1r-
dependent melanophores. As predicted, kita; csf1rTS double
mutants that were initially indistinguishable from kita single
mutants lost body melanophores when shifted to restrictive
temperature (Figure 11A, 11B). After returning to permissive
temperature, fish initially recovered kita-independent hypodermal
melanophores, though progressively fewer of these cells were
regenerated in successive ablation–recovery cycles (Figure 11C,
11D). Surprisingly, ablations also resulted in the de novo
development and regeneration of scale melanophores, which are
normally absent from kita mutants (Figure 11F, 11G)[37]. The few
later hypodermal melanophores that were recovered in kita; csf1rTS
mutants were often located beneath scales populated with
melanophores, iridophores and xanthophores (Figure 11H), rais-
ing the possibility that some of these regenerative hypodermal
melanophores may have been scale-derived. Overall, these
findings suggest that precursors to kita-independent, csf1r-depen-
dent hypodermal melanophores persist in the adult yet have a
finite regenerative potential, whereas an additional precursor pool
associated with adult scales has a greater regenerative capability.
Discussion
The results of this study and previous analyses [36,43,45]
suggest a model for the development of adult melanophores in
zebrafish (Figure 12). Pluripotent foxd3+ precursors to glia
[46,61], adult melanophores and iridophores are established in
an erbb3b-dependent manner during embryogenesis, and thereafter
are associated with post-embryonic peripheral nerves and ganglia.
This precursor population is expanded and maintained during
pre-metamorphic larval development in an erbb3b- and tuba8l3a-
dependent manner, and cells within this pool become specified for
pigment cell lineages beginning immediately before, and continu-
ing through, pigment pattern metamorphosis. During the larval-
to-adult transformation, these extra-hypodermal precursors mi-
grate to the hypodermis, and there contribute to metamorphic
melanophores and iridophores. Some enter the hypodermis after
migrating over the dorsal or ventral margins of the myotomes,
others emerge from vertical or horizontal myosepta; some may
emigrate from the lateral line nerve. Once in the hypodermis,
these cells require tuba8l3a for their proliferation, as well as kita,
ednrb1, and, to a lesser extent, csf1r, for their survival and eventual
differentiation. Later in adults, some latent precursors persist and
can supply a limited number of new hypodermal melanophores,
whereas other precursors associated with scales have a greater
regenerative capacity. Below we discuss several aspects and
implications of this model.
Extra-hypodermal niches and the erbb3b- and tuba8l3a-dependence of latent precursors to adult melanophores
A major finding of our study is that post-embryonic
mitfa::GFP+ cells are associated with peripheral nerves coursing
through the myotomes as well as more medial nerves and ganglia.
We further showed that nerve-associated cells could be induced to
differentiate ectopically as melanophores, and that extra-hypoder-
mal mitfa::GFP+ cells migrate to the hypodermis where some
differentiate as melanophores during normal development. These
observations suggest that peripheral nerves or ganglia serve as
niches for post-embryonic precursors to adult melanophores and
are broadly consistent with a recent study demonstrating a
peripheral nerve origin for adult skin melanocytes of amniotes [62]
as well as analyses revealing interconversion of glial and
melanocyte fates in vitro [63–65]. Our study complements and
extends recent lineage tracing studies of flounder larvae, in which
adult pigment cell precursors were found to migrate to the
hypodermis from dorsal and ventral regions during pigment
pattern metamorphosis [66,67].
Our analyses also provide insights into the molecular and
proliferative phenotypes of metamorphic melanophore precursors.
foxd3 often acts as a transcriptional repressor and is associated
with the maintenance of pluripotency and pluripotent cells [68–
71]. In the neural crest lineage, foxd3 is expressed by pluripotent
cells and presumptive glia, and can inhibit mitfa transcription,
Figure 11. Limited regeneration of adult hypodermal melano-phores following genetic ablation. (A) Time-course of temperatureshifts, with letters corresponding to images in B–H. Final sample size at698 days post-fertilization: n = 5. (B) A young adult kita; csf1rTS mutant at33uC lacked melanophores as in kita; csf1rj4e1 mutants [38] (somemelanized cellular debris resulting from melanophore death is evidentdorsally). (C) Temperature downshift to 24uC allowed recovery of ahypodermal melanophore (e.g., arrow) complement initially indistin-guishable from kita single mutants [59]. Arrowhead, the dorsal flank isinitially devoid of scale-associated melanophores, as is typical of kitamutants. (D,E) Additional rounds of ablation and recovery yieldprogressively fewer hypodermal melanophores (arrow), though somemelanophores develop on the dorsal scales (arrowhead). Hypodermalxanthophores and iridophores were depleted as well (data not shown).(F) Dorsal flank of another individual showing hypodermal melano-phores (arrow) and scale melanophores (arrowhead). (G) Detail of scale-associated melanophores. Iridescent iridophores and yellow-orangexanthophores are apparent as well. (H) Detail of hypodermalmelanophores viewed through an overlying scale containing aconcentration of xanthophores and iridophores (outlined in red).doi:10.1371/journal.pgen.1002044.g011
Zebrafish Adult Melanophore Precursors
PLoS Genetics | www.plosgenetics.org 10 May 2011 | Volume 7 | Issue 5 | e1002044

favoring iridophore or glial over melanogenic fates [54,55,61,72].
We found that some nerve-associated foxd3+ cells co-expressed
mitfa::GFP just before and continuing through pigment pattern
metamorphosis, and that such cells were especially likely to have
incorporated EdU. These observations raise the possibility that
nerve-associated foxd3+ cells are a pluripotent and proliferative
population that can give rise to hypodermal melanophores and
iridophores during pigment pattern metamorphosis. Our finding
that DiI-labeled, extra-hypodermal tissues give rise to melano-
phores and iridophores with equal frequency is consistent with this
idea. Because the mitfa::GFP transgene we employed is repressible
by foxd3, we speculate that co-expression of mitfa::GFP reflects
low levels of perduring foxd3 protein as precursors adopt a
pigmentary fate, similar to observations of early neural crest
morphogenesis [54], or that a balance between the anti-
melanogenic and pro-melanogenic effects of foxd3 and mitfa,
respectively, prevents specified cells from differentiating prema-
turely. Nevertheless, we note that our analyses revealed more
extra-hypodermal mitfa::GFP+ cells than mitfa+ cells, which differs
from the one-to-one corrrespondence of such cells in embryos
[54]. Additional mitfa::GFP+ cells could reflect low levels of mitfa
expression that fall below the threshold for detection by in situ
hybridization at post-embryonic stages, yet are sufficient for
accumulating detectable levels of relatively stable GFP. Or,
mitfa::GFP expression in some cells could reflect a partial
disregulation of the transgene, as might occur if regulatory
elements for post-embryonic expression are missing. Distinguish-
ing between these possibilities will require the production and
analysis of additional transgenic reporter lines, but whichever the
outcome, the mitfa::GFP reporter we have used will be a valuable
tool for further dissecting the mechanisms of post-embryonic
melanophore development.
Examination of erbb3b and tuba8l3a mutants provides additional
support for the idea that extra-hypodermal, nerve-associated
precursors are essential for metamorphic melanophore develop-
ment. We found that presumptive precursors to glia and pigment
cells were missing from erbb3b mutants and wild-type larvae in
which ErbB activity had been inhibited during the embryonic
critical period for adult melanophore development. An on-going
requirement for erbb3b is suggested as well, by reduced
complements of adult melanophores following acute inhibition of
ErbB signaling in sensitized backgrounds during pigment pattern
metamorphosis [43], and by reduced rates of EdU incorporation
in erbb3b mutants during post-embryonic development (this study).
Because ErbB signaling can repress melanocyte differentiation
[62,73], a further role in preventing the premature differentiation
of nerve-associated precursors to hypodermal pigment cells seems
likely. Notably, our finding that extra-hypodermal, kitla-responsive
Figure 12. Model for establishment and maintenance of adult pigment cell precursors and their recruitment during developmentand regeneration. (A) Hypothesized lineage relationships, showing neural crest (NC) cells in the early embryo that give rise to Schwann cells andpigment cells of the early larva as well as erbb3b-dependent progenitors to metamorphic glial and pigment cell lineages (mGP). mGP are maintainedin association with peripheral nerves and ganglia, express foxd3, and their population expands (multiple arrowheads) in a tuba8l3a-dependentmanner. During pigment pattern metamorphosis (met), some mGP differentiate as metamorphic Schwann cells (S) and the expansion of this lineagelikely requires erbb3b (not shown). Other mGP become specified for metamorphic pigment cell lineages, as marked by mitfa::GFP expression. Somemitfa::GFP+ cells will give rise to melanophores or iridophores and are initially extra-hypodermally located in peripheral nerves and ganglia (M/I-e) butthen migrate to the hypodermis (M/I-h). The expansion of this population requires ednrb1 [58]. Some M/I-h will differentiate as metamorphiciridophores (I), other M/I-h expand their population in a tuba8l3a- and kita-dependent manner and ultimately differentiate as metamorphicmelanophores (M). Individual M/I-e or M/I-h may be bipotent for melanophore and iridophore fates, as in embryos [55], or their respectivepopulations may harbor precursors already specified for either the melanophore or iridophore fate. csf1r-dependent metamorphic xanthophores (X)presumably arise from a different precursor population (dashed line) and promote the survival of metamorphic melanophores (orange arrow)[38,42,60]. Some mGP persist into the adult and have a limited re-population potential. (B) Schematic of metamorphic larva illustrating sources andmigratory pathways of metamorphic melanophore and iridophore precursors. Shown are mGP and M/I-e (colors as in A) associated with nerves andbeneath the dorsal fin (f). M/I-e enter the hypodermis (arrows) from the dorsal or ventral margins of the myotomes (m), or after migrating alongnerves associated with the the vertical myosepta (vm) or the horizontal myoseptum (hm). Others may arise from the lateral line nerve (ll). Once in thehypodermis, these cells differentiate as melanophores (green cell with heavy black outline) or iridophores (not shown). sc, spinal cord. Additionalpopulations of precursors that may give rise to LM melanophores and scale melanophores are not shown (see text).doi:10.1371/journal.pgen.1002044.g012
Zebrafish Adult Melanophore Precursors
PLoS Genetics | www.plosgenetics.org 11 May 2011 | Volume 7 | Issue 5 | e1002044
melanogenic cells were missing in ErbB-deficient backgrounds at
post-embryonic stages contrasts with increased numbers of such
cells at embryonic/early larval stages [74]. This difference likely
reflects the pleiotropic nature of ErbB signals and a difference
between the stages examined: blocking ErbB activity in the
embryo presumably results in a de-repression of melanophore
differentiation amongst transiently persisting precursor cells,
whereas by post-embryonic stages, such precursors presumably
have been lost.
In contrast to erbb3b mutants, tuba8l3a mutants exhibit a post-
embryonic demyelination of peripheral nerves and a corresponding
critical period for adult melanophore development [36,44,45]. In
agreement with our model, tuba8l3a mutant larvae were deficient for
mbp+ glia, nerve-associated foxd3+ cells and foxd3+; mitfa::GFP+cells, and also had reduced rates of division amongst hypodermal
mitfa::GFP+ cells. Because tuba8l3a acts autonomously to the
metamorphic melanophore lineage [45], these findings suggest a
defect in the maintenance or expansion of pluripotent precursors to
mbp+ glia and mitfa:GFP+ pigment cell precursors. The post-
embryonic onset of these phenotypes further suggests the existence
of genetically distinct populations of embryonic and adult glia,
analogous to embryonic and metamorphic melanophores.
Pattern development, regulation, and the roles oftemporally and genetically distinct metamorphicmelanophore populations
Time-lapse imaging comparisons of wild-type and mutant
backgrounds further defined roles for genes previously known to
function in pigment pattern development: kita, csf1r, and ednrb1 all
promoted the survival of mitfa::GFP+ cells whereas kita also
promoted the differentiation of these cells as melanophores. Yet,
these analyses revealed compensatory responses of pigment cells
and their precursors in mutant backgrounds as well. For example,
residual mitfa::GFP+ cells in mutants with extra-hypodermal
precursor deficiencies (erbb3b, tuba8l3a) or hypodermal defects in
cell survival (csf1r, ednrb1) exhibited concomitantly greater rates of
differentiation, and, in one instance (erbb3b), an increased rate of
proliferation. Moreover, the reduced survival and differentiation of
mitfa::GFP+ cells in kita mutants was coupled with a 70-fold
increase in melanophore proliferation. These findings highlight the
remarkably regulative nature of zebrafish pigment pattern
development [36,41,42] and also the importance of direct imaging
for understanding cellular behaviors that would not be predicted
from terminal phenotypes alone.
A particularly dramatic example of pattern regulation occurs
during regeneration. Zebrafish larval melanophores regenerate
following laser ablation or the administration of melanocytotoxic
drugs [74–76], adult fin melanophores regenerate along with other
tissues after fin amputation [77–79], and hypodermal body
melanophores regenerate after localized laser ablations [80,81].
To test the capacity of latent precursors to supply new hypodermal
melanophores in the adult, we used fish doubly mutant for kita and
csf1rTS in which loss of residual melanophores at restrictive
temperature likely reflects the withdrawal of trophic support
provided by csf1r-dependent xanthophores [42,60]. Our finding
that progressively fewer hypodermal melanophores were recov-
ered after repeated ablations implies a limited re-population
potential for latent precursors that give rise to these kita-
independent, csf1r-dependent late metamorphic melanophores.
Whether the same is true of kita-dependent early metamorphic
melanophores remains to be determined. Nevertheless, our finding
that scale melanophores regenerated repeatedly-in contrast to late
metamorphic, hypodermal melanophores-suggests a more highly
regulative precursor pool associated with the adult scales, and
highlights the possibility of spatially and temporally distinct pools
of precursors having different morphogenetic and differentiative
potentials. That scale melanophores developed de novo in these fish,
despite their absence from kita single mutants, likely reflects a
priority effect; e.g., initially abundant xanthophores may repress
melanophore development in kita mutants [42,82,83] but simul-
taneous development of both melanophores and xanthophores
during regeneration allows for a stable pattern comprising both
cell types. The similar re-population potential of scale and fin
melanophores, and the previous observation that basonuclin-2
mutants, which are deficient for hypodermal melanophores,
nevertheless retain both scale and fin melanophores [84], also
suggest the possibility of more extensive similarities between scale-
and fin-associated precursor pools.
Finally our study provides new insights into the temporally
distinct populations of melanophores in zebrafish. We found
severe deficiencies in the numbers of extra-hypodermally derived
mitfa::GFP+ cells in erbb3b and tuba8l3a mutants, illustrating the
critical role of such cells in supplying metamorphic melanophores
overall. By contrast, we found no evidence for reduced numbers of
extra-hypodermally derived mitfa::GFP+ cells in kita, csf1r, or
ednrb1 mutants, indicating that different genetic requirements of
early and late metamorphic melanophores do not reflect
differences in the establishment or maintenance of these cells.
These findings suggest either of two interpretations. Early and late
metamorphic melanophores could arise from a common precursor
pool with differences in residual melanophore complements
among mutants reflecting specific requirements for kita, csf1r,
and ednrb1 in downstream events of morphogenesis and differen-
tiation. For example, our data indicate that mitfa::GFP+ cells
require kita for their surival, and presumably, terminal differen-
tiation: the development of late metamorphic melanophores in kita
mutants could thus reflect the late appearance of factors able to
substitute for kita activity in promoting melanophore differentia-
tion. Conversely, we found that mitfa::GFP+ cells were only
marginally dependent on csf1r: the failure of late metamorphic
melanophores to develop in csf1r mutants could, in turn, reflect a
late-arising, post-differentiation requirement for trophic support
from csf1r-dependent xanthophores [38,42,60]. An alternative
interpretation is that early and late metamorphic melanophores do
arise from distinct, but still cryptic, precursor pools that simply
were not revealed by our methods. In other systems, niches
initially assumed to have just one type of stem or progenitor cell
have sometimes been found to harbor distinct classes of cells with
disparate proliferative or differentiative potentials [85–87].
Additional time-lapse imaging analyses at later stages and
genetically based lineage analyses that are now being conducted
should provide further insights into these possibilities.
Post-embryonic stem cells in development, evolution,and neoplasia
The identification of extra-hypodermal nerve-associated pre-
cursors to adult melanophores in zebrafish (this study) and
amniotes [62] indicates that a fuller understanding of adult
pigment cell development and pattern formation requires a focus
on post-embryonic precursors, as distinct from embryonic neural
crest cells. The existence of genetically separable populations of
embryonic pigment cells, derived directly from neural crest cells,
and adult pigment cells, derived from post-embryonic precursors,
further suggests that species-differences in adult pigment patterns
may be explicable by evolutionary changes in the establishment,
maintenance or recruitment of post-embryonic latent precursors,
with few if any consequences for earlier pigment patterns [88].
Lastly, a peripheral nerve origin for adult pigment cells also raises
Zebrafish Adult Melanophore Precursors
PLoS Genetics | www.plosgenetics.org 12 May 2011 | Volume 7 | Issue 5 | e1002044
the possibility that the frequent and generally fatal metastases of
melanoma cells to the central nervous system [26–29,89,90] may
reflect the continued or reiterated expression of genes that favor
proliferation and migration in a nerve microenvironment.
Materials and Methods
Fish rearing, staging, and genetic stocksFish were reared at 28–29uC, 14L:10D. Post-embryonic stages
are reported as standardized standard length (SSL) measurements,
which indicate developmental progress of free-feeding larvae more
reliably than days post-fertilization [33]. Tg(mitfa::GFP)w47 and
Tg(24.9sox10:egfp)ba2 fish were generously provided by D. Raible
and R. Kelsh, respectively. Tg(TrDct::mCherry)wp.r.t3 and Tg(hsp70::ki-
tla)wp.r.t2 fish were produced using tol2kit Gateway vectors and Tol2-
mediated transgenesis [91,92] and heat shocks with the latter strain
were administered at 37uC for 1 hr three times daily for two days.
Experiments with erbb3b mutants used either of two presumptive
null alleles, erbb3but.r2e1 or erbb3bwp.r2e2 [93]. Experiments with csf1r
mutants used either the presumptive null allele csf1rj4blue or the
temperature-sensitive allele csf1rut.r1e174 [60]. In temperature shift
experiments, fish were shifted repeatedly between restrictive
temperature (33uC) and permissive temperature (24uC). All
experiments with the kita mutant used the presumptive null allele
kitab5 [59]. tuba8l3aj115e1 encodes a missense substitution with
temperature-sensitive effects. Experiments with this allele were
performed at standard rearing temperature, intermediate between
restrictive (33uC) and permissive (24uC) temperatures [36,44,45], to
allow analyses of a fuller complement of mitfa::GFP+ cells.
Quantitative analyses here are thus likely to underestimate effects
of the tuba8l3a mutation. Animal use conformed to University of
Washington IACUC guidelines.
Imaging and image analysisFish were viewed with Olympus SZX-12 or Zeiss Discovery
epifluorescence stereomicroscopes or with a Zeiss Observer
inverted compound epifluorescence microscope with Apotome.
Images were collected in Axiovision software using Axiocam HR
or MR3 cameras. For thick specimens, stacks of images were
collected and processed using Zeiss Axiovision 6D Acquisition or
Extended Focus modules and some fluorescence images were
deconvolved using the Zeiss Axiovision Deconvolution module.
Alternatively, specimens were viewed and images collected on
Zeiss 510 META or Olympus FV1000 laser confocal microscopes.
HistologyFor immunohistochemistry, larvae were fixed in 4% parafor-
maldehyde containing 1% DMSO in PBS, rinsed, embedded in
agarose, then sectioned by vibratome at 150–200 mm. Sections
were washed in PBS/1% DMSO/0.3% Triton-X pH 7.4
(PDTX), blocked in PDTX containing 10–20% heat inactivated
goat serum then incubated overnight at 4uC with primary
antibody. We used polyclonal antisera raised in rabbit against
zebrafish sox10 (1:500; provided by B. Appel [94]), zebrafish foxd3
(1:400; D. Raible [47]), zebrafish mbp (1:50; W. Talbot [95]), and
GFP (1:200; A11122, Invitrogen) as well as monoclonal antibodies
against GFP (1:200; 3E6 A11120, Invitrogen) and acetylated a-
tubulin (1:200; 6-11B-1, T6793 Sigma). After washing, sections
were incubated with secondary antibodies (AlexaFluor 405, 488,
568, 647; Invitrogen), washed and imaged.
In situ hybridization of post-embryonic zebrafish followed [44,84].
For some analyses larvae were sectioned at 100–300 mm by
vibratome. Detailed methods for in situ hybridization are available
online at http://protist.biology.washington.edu/dparichy/.
DiI injectionCell Tracker CM-DiI (Invitrogen) was prepared as a stock
solution in DMSO then diluted to 0.025–0.05% in 0.3 M sucrose
just before use. Larvae were anesthetized briefly and injected with
1–2 nl of DiI using a borosilicate needle, imaged immediately to
ascertain the specificity of staining in target tissues, then reared
individually until analyzed.
Ex vivo time-lapse imagingLarvae were rinsed with 10% Hanks medium, anesthetized and
then sacrificed by decapitation using a razor blade. After removing
the anterior portion of the trunk and discarding the tails, larval
trunks were placed on 0.4 mm transwell membranes (Millipore) in
glass-bottom dishes containing L-15 medium, 3% fetal bovine
serum, and penicillin/streptomycin. Trunks were equilibrated at
28.5uC for 3 h then imaged for 18–24 h (20 or 30 minute intervals
between images) on a Zeiss Observer inverted epifluorescence
microscope. Comparisons between isolated trunks imaged contin-
uously for 24 h and repeatedly anesthetized intact larvae did not
reveal gross differences in the survival of mitfa::GFP+ cells, though
average maximal estimated velocities of mitfa::GFP+ cells were
reduced by ,22% in cultured trunks as compared to intact larvae
(P,0.05; N = 67 cells examined). Imaging over longer durations
resulted in increased rates of cell death throughout the explant and
thus were not used for analyses.
Pharmacological inhibition of ErbB activityA stock solution of AG1478 [4-(3-chloroanilino)-6,7-dimethox-
yquinazoline; Calbiochem] was diluted in DMSO. Embryos were
treated with 3 mM AG1478 in 10% Hanks for through either 72 or
96 hours post-fertilization. To facilitate penetration, 0.5% DMSO
was added to all media and embryos were dechorionated prior to
treatment. Fish were reared in glass Petri dishes and solutions were
changed daily.
EdU labelingLarvae were incubated with 0.005% 5-ethynyl-29-deoxyuridine
(EdU; Intvitrogen) in 10% Hank’s medium containing 1%
DMSO for 36 h. Larvae were then sacrificed, fixed with 4%
PFA/1% DMSO, and vibrotome sectioned (150–200 mm) for
immunohistochemistry followed by histochemical detection of
EdU according to manufacturer’s recommendations.
Statistical analysesQuantitative data were analyzed with JMP 8.0.2 (SAS Institute,
Cary NC). Frequency data were examined using multiple logistic
regression or contingency table analyses, and tested for effects of
genotype, stage, and genotype x stage interactions. Significance of
effects were assessed by likelihood ratio tests and non-significant
factors were removed from the final models. Analyses of variance
were used for continuous variables including counts. Residuals
were examined for normality and homogeneity of variances,
conditions that were achieved for some variables after transfor-
mation by square root or natural logarithm. Further details of
statistical analyses are available upon request.
Supporting Information
Figure S1 mitfa::GFP+ cells amongst glia of the lateral line
nerve. Sagittal view of a wild-type larva showing mitfa::GFP+ cells
(mitfa, green; arrow) aligned with mbp+ glia (red) of the main
trunk lateral line nerve, near the horizontal myoseptum.
(TIF)
Zebrafish Adult Melanophore Precursors
PLoS Genetics | www.plosgenetics.org 13 May 2011 | Volume 7 | Issue 5 | e1002044
Figure S2 Ectopic kitla-responsive melanogenic cells were
nerve-associated. Shown is an ectopic sox10+ (red) melanophore
(arrow) within the myotome adjacent to a nerve fiber stained for
acetylated tubulin (green).
(TIF)
Figure S3 Defects in wild-type larvae treated with ErbB
inhibitor AG1478 during the erbb3b embryonic critical period.
(A,B) Post-embryonic mbp+ glia (red; arrowheads) were reduced
though not eliminated in AG1478-treated larvae. Inset, mit-
fa::GFP+ cell (green) aligned on mbp+ glia of a peripheral nerve at
the level of the horizontal myoseptum. sc, spinal cord; m,
myotome; e, epidermis; ll, lateral line nerve. (C,D) foxd3+ cells
(red; arrowheads) within the myotome were missing from
AG1478-treated larvae.
(TIF)
Figure S4 Deficiencies in mitfa::GFP+ cells, foxd3+ cells, and
EdU incorporation in erbb3b mutants. (A,B) Views and annotations
correspond to those for wild-type larvae in main text Figure 5.
Arrow, a rare EdU+; mitfa::GFP+ cell at the base of the ventral
fin.
(TIF)
Figure S5 erbb3b-dependence of kita-independent hypodermal
melanophores. (A) kitab5 presumptive null allele [59] with stripes of
kita-independent hypodermal melanophores. (B) Fish doubly
mutant for kitab5 and the presumptive null allele erbb3but.r2e1
showing loss of many kita-independent melanophores as well as
gaps in the ‘‘interstripes’’ (e.g., arrowhead) reflecting an iridophore
deficiency. Patches of residual melanophores may be of clonal
origin.
(TIF)
Figure S6 mitfa::GFP+ cells in adult fish. Shown are cross-
sections through ,20 SSL (,80 days post-fertilization) adult wild-
type fish. (A) A persisting nerve-associated mitfa::GFP+ cell (green;
arrow). sc, spinal cord; m, myotome. (B) mitfa::GFP+ cells (green;
arrowhead) within the lateral line nerve. e, epidermis (C)
mitfa::GFP+ cells (green; arrow) and foxd3+ cells (red; arrowhead)
in the ventral myotomes and base of the anal fin (f). (D)
mitfa::GFP+ cell (green; arrow) and doubly labeled mitfa::GFP+;
foxd3+ cell (arrowhead) associated with an adult scale (s).
(TIF)
Video S1 mitfa::GFP+ cells in a living wild-type larva. Images
were collected in sagittal planes from the skin to the midline of the
trunk. Image rotation reveals extra-hypodermal cells within the
myotomes, that typically expressed mitfa::GFP at levels lower than
in hypodermal cells.
(MOV)
Video S2 mitfa::GFP+ and dct::mCherry+ melanophores in a
living wild-type larva. In contrast to mitfa::GFP+ cells (green), cells
expressing the later melanophore lineage marker dct were detected
only in the hypodermis. Shown here are cells expressing mCherry
driven by the Takifugu rubripes dct promoter.
(MOV)
Video S3 mitfa::GFP+ cells are missing from a live erbb3b mutant
larva. Larva imaged as in Video S1 but over-exposed to provide
spatial context. Fluorescent cells forming a stripe in the
hypodermis are iridophores, which reflect under epifluorescence
in multiple channels (these cells are present in the larva shown in
Video S1, but their reflectance falls beneath the threshold for
detection at the exposure shown).
(MOV)
Video S4 mitfa::GFP+ cells differentiate as melanophores in the
hypodermis. mitfa::GFP+ cells acquiring melanin (arrows) over
,18 h.
(MOV)
Video S5 Migration of mitfa::GFP+ cells. Low magnification
view showing highly migratory mitfa::GFP+ cells over ,18 h. This
movie loops three times. mitfa::GFP+ cells are highly migratory
and extend long probing processes. These cells can be seen
migrating widely over the flank and also migrating from the body
into the anal fin at the lower edge of the frame. In contrast to
mitfa::GFP+ cells, xanthophores are larger, less motile and
autofluoresce weakly in the GFP channel, particularly from
accumulations of pteridine-containing organelles around the
nucleus.
(MOV)
Video S6 Migration of mitfa::GFP+ cells between body and fin.
Detail at the margin between body and anal fin, showing
movements of mitfa::GFP+ cells between these regions.
(MOV)
Video S7 mitfa::GFP+ cells emerging from within the myotome.
Several mitfa::GFP+ cells (arrows) enter the hypodermis from
within the myotome; also see Video S8.
(MOV)
Video S8 mitfa::GFP+ cells emerging from within the myotome.
High magnification view showing a single mitfa::GFP+ cell (arrow)
emerging from within the myotome. In this movie, only selected
planes of focus from a complete z-series are shown, illustrating the
progressive movement of this cell from the interior myotome to the
surface. As the cell approaches the more superficial planes, additional
mitfa::GFP+ cells already in the hypodermis come into focus.
(MOV)
Video S9 mitfa::GFP+ cell emerging from the vicinity of the
horizontal myoseptum. The movie loops three times.
(MOV)
Video S10 mitfa::GFP+ cells entering the hypodermis after
migrating over the dorsal myotome. One cell already at the dorsal
myotome and another extending a process over the flank at the
beginning of the movie (red arrows). A third cell extends a long
filopodium (yellow arrow) over the flank before entering into the
hypodermis.
(MOV)
Video S11 mitfa::GFP+ cells migrating within the caudal nerve
plexus. Shown are mitfa::GFP+ cells along a nerve plexus near the
base of the caudal fin in the medial region of a larva. This
particular individual is a kita mutant. Similar behaviors were
observed in wild-type larvae.
(MOV)
Video S12 mitfa::GFP+ cells migrating along and dispersing
from peripheral nerves. Shown is an enhanced detail of Video
S11. Arrowhead indicates a cell traversing along a nerve fiber then
migrating away.
(MOV)
Video S13 Morphogenesis of residual mitfa::GFP+ cells in erbb3b
mutants. Residual mitfa::GFP+ cells were often patchily distrib-
uted and typically expressed GFP at lower levels than in wild-type.
Red arrowhead, mitfa::GFP+ cell dividing. Arrow, mitfa::GFP+cell emerging from the vicinity of the horizontal myoseptum.
Yellow arrowhead, death of mitfa::GFP+ cell.
(MOV)
Zebrafish Adult Melanophore Precursors
PLoS Genetics | www.plosgenetics.org 14 May 2011 | Volume 7 | Issue 5 | e1002044
Video S14 Proliferation of mitfa::GFP+ cells. A mitfa::GFP+ cell
(arrow) divides within the hypodermis over ,14 h in a wild-type
larva.
(MOV)
Video S15 Death of mitfa::GFP+ cells. Fragmentation and loss
of three mitfa::GFP+ cells (arrows) in a kita mutant larva over
,16 h (see text for details).
(MOV)
Video S16 Proliferation of differentiated melanophores. Shown
is the posterior tail of a kita mutant larva, illustrating successive
melanophore divisions. mitfa::GFP+ cells also can be observed
migrating on the body and between the body and caudal fin.
(MOV)
Acknowledgments
Thanks to Dave Raible, Kevin Curran, and other members of the Raible
lab for providing reagents and for helpful discussions; members of the
Parichy lab for assistance with fish rearing; and David Lyons, Will Talbot,
Bruce Appel, and Robert Kelsh, who generously provided reagents.
Author Contributions
Conceived and designed the experiments: EHB LBP DMP. Performed the
experiments: EHB LBP DMP. Analyzed the data: EHB DMP. Wrote the
paper: EHB LBP DMP.
References
1. Bedelbaeva K, Snyder A, Gourevitch D, Clark L, Zhang XM, et al. (2010) Lackof p21 expression links cell cycle control and appendage regeneration in mice.
Proc Natl Acad Sci U S A 107: 5845–5850.
2. Salewski RP, Eftekharpour E, Fehlings MG (2010) Are induced pluripotent stem
cells the future of cell-based regenerative therapies for spinal cord injury? J Cell
Physiol 222: 515–521.
3. Guo JK, Cantley LG (2010) Cellular maintenance and repair of the kidney.
Annu Rev Physiol 72: 357–376.
4. Voog J, Jones DL (2010) Stem cells and the niche: a dynamic duo. Cell Stem
Cell 6: 103–115.
5. Inomata K, Aoto T, Binh NT, Okamoto N, Tanimura S, et al. (2009) Genotoxicstress abrogates renewal of melanocyte stem cells by triggering their
differentiation. Cell 137: 1088–1099.
6. Mayack SR, Shadrach JL, Kim FS, Wagers AJ (2010) Systemic signals regulate
ageing and rejuvenation of blood stem cell niches. Nature 463: 495–500.
7. Nishimura EK, Granter SR, Fisher DE (2005) Mechanisms of hair graying:incomplete melanocyte stem cell maintenance in the niche. Science 307:
720–724.
8. Alison MR, Islam S, Wright NA (2010) Stem cells in cancer: instigators and
propagators? J Cell Sci 123: 2357–2368.
9. Youssef KK, Van Keymeulen A, Lapouge G, Beck B, Michaux C, et al. (2010)Identification of the cell lineage at the origin of basal cell carcinoma. Nat Cell
Biol 12: 299–305.
10. Le LQ, Shipman T, Burns DK, Parada LF (2009) Cell of origin and
microenvironment contribution for NF1-associated dermal neurofibromas. CellStem Cell 4: 453–463.
11. Le Douarin NM (1999) The Neural Crest. Cambridge: Cambride University
Press.
12. Kelsh RN, Harris ML, Colanesi S, Erickson CA (2009) Stripes and belly-spots-A
review of pigment cell morphogenesis in vertebrates. Semin Cell Dev Biol 20:90–104.
13. Thomas AJ, Erickson CA (2008) The making of a melanocyte: the specification
of melanoblasts from the neural crest. Pigment Cell Melanoma Res 21: 598–610.
14. Cooper CD, Raible DW (2008) Mechanisms for reaching the differentiated state:
Insights from neural crest-derived melanocytes. Semin Cell Dev Biol.
15. Nishimura EK, Jordan SA, Oshima H, Yoshida H, Osawa M, et al. (2002)
Dominant role of the niche in melanocyte stem-cell fate determination. Nature
416: 854–860.
16. Wong CE, Paratore C, Dours-Zimmermann MT, Rochat A, Pietri T, et al.
(2006) Neural crest-derived cells with stem cell features can be traced back tomultiple lineages in the adult skin. J Cell Biol 175: 1005–1015.
17. Robinson KC, Fisher DE (2009) Specification and loss of melanocyte stem cells.
Semin Cell Dev Biol 20: 111–116.
18. White RM, Zon LI (2008) Melanocytes in development, regeneration, and
cancer. Cell Stem Cell 3: 242–252.
19. Nordlund JJ, Boissy RE, Hearing VJ, King RA, Oetting WS, et al. (2006) The
Pigmentary System: Physiology and Pathophysiology. 2nd Edition ed:Blackwell
Publishing, Inc.
20. Rigel DS (1997) Malignant melanoma: incidence issues and their effect on
diagnosis and treatment in the 1990s. Mayo Clin Proc 72: 367–371.
21. Jemal A, Siegel R, Ward E, Hao Y, Xu J, et al. (2009) Cancer statistics, 2009.
CA Cancer J Clin 59: 225–249.
22. Balch CM, Gershenwald JE, Soong SJ, Thompson JF, Ding S, et al. (2010)Multivariate analysis of prognostic factors among 2,313 patients with stage III
melanoma: comparison of nodal micrometastases versus macrometastases. J ClinOncol 28: 2452–2459.
23. Balch CM, Gershenwald JE, Soong SJ, Thompson JF, Atkins MB, et al. (2009)Final version of 2009 AJCC melanoma staging and classification. J Clin Oncol
27: 6199–6206.
24. Balch CM, Soong SJ, Gershenwald JE, Thompson JF, Reintgen DS, et al. (2001)Prognostic factors analysis of 17,600 melanoma patients: validation of the
American Joint Committee on Cancer melanoma staging system. J Clin Oncol19: 3622–3634.
25. Uong A, Zon LI (2010) Melanocytes in development and cancer. J Cell Physiol
222: 38–41.
26. Mouawad R, Sebert M, Michels J, Bloch J, Spano JP, et al. (2010) Treatment for
metastatic malignant melanoma: old drugs and new strategies. Crit Rev Oncol
Hematol 74: 27–39.
27. Bhatia S, Tykodi SS, Thompson JA (2009) Treatment of metastatic melanoma:
an overview. Oncology (Williston Park) 23: 488–496.
28. Jilaveanu LB, Aziz SA, Kluger HM (2009) Chemotherapy and biologic therapies
for melanoma: do they work? Clin Dermatol 27: 614–625.
29. Barth A, Wanek LA, Morton DL (1995) Prognostic factors in 1,521 melanoma
patients with distant metastases. J Am Coll Surg 181: 193–201.
30. Gupta PB, Kuperwasser C, Brunet JP, Ramaswamy S, Kuo WL, et al. (2005)
The melanocyte differentiation program predisposes to metastasis after
neoplastic transformation. Nat Genet 37: 1047–1054.
31. Devoto SH, Stoiber W, Hammond CL, Steinbacher P, Haslett JR, et al. (2006)
Generality of vertebrate developmental patterns: evidence for a dermomyotome
in fish. Evol Dev 8: 101–110.
32. Hawkes JW (1974) The structure of fish skin. I. General organization. Cell
Tissue Res 149: 147–158.
33. Parichy DM, Elizondo MR, Mills MG, Gordon TN, Engeszer RE (2009)
Normal table of postembryonic zebrafish development: staging by externally
visible anatomy of the living fish. Developmental Dynamics 238: 2975–3015.
34. Ceol CJ, Houvras Y, White RM, Zon LI (2008) Melanoma Biology and the
Promise of Zebrafish. Zebrafish 5: 247–255.
35. Patton EE, Widlund HR, Kutok JL, Kopani KR, Amatruda JF, et al. (2005)
BRAF mutations are sufficient to promote nevi formation and cooperate with
p53 in the genesis of melanoma. Curr Biol 15: 249–254.
36. Parichy DM, Turner JM (2003) Zebrafish puma mutant decouples pigment
pattern and somatic metamorphosis. Developmental Biology 256: 242–257.
37. Johnson SL, Africa D, Walker C, Weston JA (1995) Genetic control of adult
pigment stripe development in zebrafish. Dev Biol 167: 27–33.
38. Parichy DM, Ransom DG, Paw B, Zon LI, Johnson SL (2000) An orthologue of
the kit-related gene fms is required for development of neural crest-derived
xanthophores and a subpopulation of adult melanocytes in the zebrafish, Danio
rerio. Development 127: 3031–3044.
39. Hirata M, Nakamura K, Kanemaru T, Shibata Y, Kondo S (2003) Pigment cell
organization in the hypodermis of zebrafish. Dev Dyn 227: 497–503.
40. Hawkes JW (1974) The structure of fish skin. II. The chromatophore unit. Cell
Tissue Res 149: 159–172.
41. Parichy DM, Turner JM. Cellular interactions during adult pigment stripe
development in zebrafish; 2003. Academic Press Inc Elsevier Science. 486 p.
42. Nakamasu A, Takahashi G, Kanbe A, Kondo S (2009) Interactions between
zebrafish pigment cells responsible for the generation of Turing patterns. Proc
Natl Acad Sci U S A 106: 8429–8434.
43. Budi EH, Patterson LB, Parichy DM (2008) Embryonic requirements for ErbB
signaling in neural crest development and adult pigment pattern formation.
Development 135: 2603–2614.
44. Larson TA, Gordon TN, Lau HE, Parichy DM (2010) Defective adult
oligodendrocyte and Schwann cell development, pigment pattern, and
craniofacial morphology in puma mutant zebrafish having an alpha tubulin
mutation. Dev Biol 346: 296–309.
45. Parichy DM, Turner JM, Parker NB (2003) Essential role for puma in
development of postembryonic neural crest-derived cell lineages in zebrafish.
Dev Biol 256: 221–241.
46. Kelsh RN, Dutton K, Medlin J, Eisen JS (2000) Expression of zebrafish fkd6 in
neural crest-derived glia. Mech Dev. pp 161–164.
47. Lister JA, Cooper C, Nguyen K, Modrell M, Grant K, et al. (2006) Zebrafish
Foxd3 is required for development of a subset of neural crest derivatives.
Developmental Biology 290: 92–104.
48. Stewart RA, Arduini BL, Berghmans S, George RE, Kanki JP, et al. (2006)
Zebrafish foxd3 is selectively required for neural crest specification, migration
and survival. Developmental Biology 292: 174–188.
Zebrafish Adult Melanophore Precursors
PLoS Genetics | www.plosgenetics.org 15 May 2011 | Volume 7 | Issue 5 | e1002044
49. Dutton KA, Pauliny A, Lopes SS, Elworthy S, Carney TJ, et al. (2001) Zebrafish
colourless encodes sox10 and specifies non-ectomesenchymal neural crest fates.Development 128: 4113–4125.
50. Luo R, An M, Arduini BL, Henion PD (2001) Specific pan-neural crest
expression of zebrafish Crestin throughout embryonic development. Dev Dyn
220: 169–174.
51. Hultman KA, Bahary N, Zon LI, Johnson SL (2007) Gene Duplication of thezebrafish kit ligand and partitioning of melanocyte development functions to kit
ligand a. PLoS Genet 3: e17. doi:10.1371/journal.pgen.0030017.
52. Lister JA, Robertson CP, Lepage T, Johnson SL, Raible DW (1999) nacreencodes a zebrafish microphthalmia-related protein that regulates neural-crest-
derived pigment cell fate. Development 126: 3757–3767.
53. Hou L, Pavan WJ (2008) Transcriptional and signaling regulation in neural creststem cell-derived melanocyte development: do all roads lead to Mitf? Cell Res
18: 1163–1176.
54. Curran K, Raible DW, Lister JA (2009) Foxd3 controls melanophore
specification in the zebrafish neural crest by regulation of Mitf. Dev Biol 332:408–417.
55. Curran K, Lister JA, Kunkel GR, Prendergast A, Parichy DM, et al. (2010)
Interplay between Foxd3 and Mitf regulates cell fate plasticity in the zebrafishneural crest. Dev Biol 344: 107–118.
56. Elworthy S, Lister JA, Carney TJ, Raible DW, Kelsh RN (2003) Transcriptional
regulation of mitfa accounts for the sox10 requirement in zebrafish melanophoredevelopment. Development 130: 2809–2818.
57. Harris ML, Baxter LL, Loftus SK, Pavan WJ (2010) Sox proteins in melanocyte
development and melanoma. Pigment Cell Melanoma Res 23: 496–513.
58. Parichy DM, Mellgren EM, Rawls JF, Lopes SS, Kelsh RN, et al. (2000)
Mutational analysis of endothelin receptor b1 (rose) during neural crest and pigmentpattern development in the zebrafish Danio rerio. Dev Biol 227: 294–306.
59. Parichy DM, Rawls JF, Pratt SJ, Whitfield TT, Johnson SL (1999) Zebrafish
sparse corresponds to an orthologue of c-kit and is required for themorphogenesis of a subpopulation of melanocytes, but is not essential for
hematopoiesis or primordial germ cell development. Development 126:3425–3436.
60. Parichy DM, Turner JM (2003) Temporal and cellular requirements for Fms
signaling during zebrafish adult pigment pattern development. Development
130: 817–833.
61. Thomas AJ, Erickson CA (2009) FOXD3 regulates the lineage switch betweenneural crest-derived glial cells and pigment cells by repressing MITF through a
non-canonical mechanism. Development 136: 1849–1858.
62. Adameyko I, Lallemend F, Aquino JB, Pereira JA, Topilko P, et al. (2009)Schwann cell precursors from nerve innervation are a cellular origin of
melanocytes in skin. Cell 139: 366–379.
63. Nichols DH, Weston JA (1977) Melanogenesis in cultures of peripheral nervoustissue. I. The origin and prospective fate of cells giving rise to melanocytes. Dev
Biol 60: 217–225.
64. Dupin E, Glavieux C, Vaigot P, Le Douarin NM (2000) Endothelin 3 induces
the reversion of melanocytes to glia through a neural crest-derived glial-melanocytic progenitor. Proc Natl Acad Sci U S A 97: 7882–7887.
65. Dupin E, Real C, Glavieux-Pardanaud C, Vaigot P, Le Douarin NM (2003)
Reversal of developmental restrictions in neural crest lineages: transition fromSchwann cells to glial-melanocytic precursors in vitro. Proc Natl Acad Sci U S A
100: 5229–5233.
66. Watanabe K, Washio Y, Fujinami Y, Aritaki M, Uji S, et al. (2008) Adult-typepigment cells, which color the ocular sides of flounders at metamorphosis,
localize as precursor cells at the proximal parts of the dorsal and anal fins in early
larvae. Dev Growth Differ 50: 731–741.
67. Yamada T, Okauchi M, Araki K (2010) Origin of adult-type pigment cellsforming the asymmetric pigment pattern, in Japanese flounder (Paralichthys
olivaceus). Dev Dyn 239: 3147–3162.
68. Liu Y, Labosky PA (2008) Regulation of embryonic stem cell self-renewal andpluripotency by Foxd3. Stem Cells 26: 2475–2484.
69. Hanna LA, Foreman RK, Tarasenko IA, Kessler DS, Labosky PA (2002)
Requirement for Foxd3 in maintaining pluripotent cells of the early mouseembryo. Genes Dev. pp 2650–2661.
70. Teng L, Mundell NA, Frist AY, Wang Q, Labosky PA (2008) Requirement for
Foxd3 in the maintenance of neural crest progenitors. Development 135:
1615–1624.
71. Mundell NA, Labosky PA (2011) Neural crest stem cell multipotency requiresFoxd3 to maintain neural potential and repress mesenchymal fates. Develop-
ment.
72. Ignatius MS, Moose HE, El-Hodiri HM, Henion PD (2008) colgate/hdac1
Repression of foxd3 expression is required to permit mitfa-dependentmelanogenesis. Dev Biol 313: 568–583.
73. Buac K, Xu M, Cronin J, Weeraratna AT, Hewitt SM, et al. (2009) NRG1/
ERBB3 signaling in melanocyte development and melanoma: inhibition ofdifferentiation and promotion of proliferation. Pigment Cell Melanoma Res 22:
773–784.74. Hultman KA, Budi EH, Teasley DC, Gottlieb AY, Parichy DM, et al. (2009)
Defects in ErbB-dependent establishment of adult melanocyte stem cells reveal
independent origins for embryonic and regeneration melanocytes. PLoS Genet5: e1000544. doi:10.1371/journal.pgen.1000544.
75. Yang CT, Johnson SL (2006) Small molecule-induced ablation and subsequentregeneration of larval zebrafish melanocytes. Development 133: 3563–3573.
76. Yang CT, Sengelmann RD, Johnson SL (2004) Larval melanocyte regenerationfollowing laser ablation in zebrafish. J Invest Dermatol 123: 924–929.
77. Rawls JF, Johnson SL (2003) Temporal and molecular separation of the kit
receptor tyrosine kinase’s roles in zebrafish melanocyte migration and survival.Dev Biol 262: 152–161.
78. Rawls JF, Johnson SL (2001) Requirements for the kit receptor tyrosine kinaseduring regeneration of zebrafish fin melanocytes. Development 128: 1943–1949.
79. Lee Y, Nachtrab G, Klinsawat PW, Hami D, Poss KD (2010) Ras controls
melanocyte expansion during zebrafish fin stripe regeneration. Dis Model Mech3: 496–503.
80. Kondo S, Shirota H (2009) Theoretical analysis of mechanisms that generate thepigmentation pattern of animals. Semin Cell Dev Biol 20: 82–89.
81. Yamaguchi M, Yoshimoto E, Kondo S (2007) Pattern regulation in the stripe ofzebrafish suggests an underlying dynamic and autonomous mechanism. Proc
Natl Acad Sci U S A 104: 4790–4793.
82. Goodrich HB, Greene JM (1959) An experimental analysis of the developmentof a color pattern in the fish Brachydanio albolineatus Blyth. J exp Zool 141: 15–45.
83. Goodrich HB, Marzullo CM, Bronson WR (1954) An analysis of the formationof color patterns in two fresh-water fish. J exp Zool 125: 487–505.
84. Lang MR, Patterson LB, Gordon TN, Johnson SL, Parichy DM (2009)
Basonuclin-2 requirements for zebrafish adult pigment pattern development andfemale fertility. PLoS Genet 5: e1000744. doi:10.1371/journal.pgen.1000744.
85. Greco V, Guo S (2010) Compartmentalized organization: a common andrequired feature of stem cell niches? Development 137: 1586–1594.
86. Li L, Clevers H (2010) Coexistence of quiescent and active adult stem cells inmammals. Science 327: 542–545.
87. Zammit PS (2008) All muscle satellite cells are equal, but are some more equal
than others? J Cell Sci 121: 2975–2982.88. Quigley IK, Turner JM, Nuckels RJ, Manuel JL, Budi EH, et al. (2004) Pigment
pattern evolution by differential deployment of neural crest and post-embryonicmelanophore lineages in Danio fishes. Development 131: 6053–6069.
89. Bafaloukos D, Gogas H (2004) The treatment of brain metastases in melanoma
patients. Cancer Treat Rev 30: 515–520.90. Palmieri D, Chambers AF, Felding-Habermann B, Huang S, Steeg PS (2007)
The biology of metastasis to a sanctuary site. Clin Cancer Res 13: 1656–1662.91. Urasaki A, Morvan G, Kawakami K (2006) Functional dissection of the Tol2
transposable element identified the minimal cis-sequence and a highly repetitivesequence in the subterminal region essential for transposition. Genetics 174:
639–649.
92. Kwan KM, Fujimoto E, Grabher C, Mangum BD, Hardy ME, et al. (2007) TheTol2kit: A multisite gateway-based construction kit forTol2 transposon
transgenesis constructs. Developmental Dynamics 236: 3088–3099.93. Budi EH, Patterson LB, Parichy DM (2010) Morphogenesis of post-embryonic
neural crest-derived pigment cell precursors revealed by time lapse imaging
during zebrafish adult pigment pattern formation. Dev Biol 344: 448.94. Park HC, Boyce J, Shin J, Appel B (2005) Oligodendrocyte specification in
zebrafish requires notch-regulated cyclin-dependent kinase inhibitor function.J Neurosci 25: 6836–6844.
95. Lyons DA, Pogoda HM, Voas MG, Woods IG, Diamond B, et al. (2005) erbb3
and erbb2 are essential for schwann cell migration and myelination in zebrafish.Curr Biol 15: 513–524.
96. Kelsh RN, Schmid B, Eisen JS (2000) Genetic analysis of melanophoredevelopment in zebrafish embryos. Dev Biol 225: 277–293.
97. Guyonneau L, Murisier F, Rossier A, Moulin A, Beermann F (2004)Melanocytes and pigmentation are affected in dopachrome tautomerase
knockout mice. Mol Cell Biol 24: 3396–3403.
98. Carney TJ, Dutton KA, Greenhill E, Delfino-Machin M, Dufourcq P, et al.(2006) A direct role for Sox10 in specification of neural crest-derived sensory
neurons. Development 133: 4619–4630.
Zebrafish Adult Melanophore Precursors
PLoS Genetics | www.plosgenetics.org 16 May 2011 | Volume 7 | Issue 5 | e1002044


![Combining gene and stem cell therapy for peripheral nerve ... Cells... · 112 precursor cells [39], induced pluripotent stem cells [40] and embryonic stem cells [41]. Therapeutic](https://img.pdfslide.us/doc/110x75/5f041a0d7e708231d40c53c8/combining-gene-and-stem-cell-therapy-for-peripheral-nerve-cells-112-precursor.jpg)