Embed Size (px)
Citation preview

Post-Crisis Changes in the Stability of the US Banking System Evidence from US Bank Holding Companies from 2004 to 2014

Oliver Wyman
NYC-TCH00911-001
BACKGROUND ON THE STUDY This paper presents an empirical analysis of the changes of financial stability in the US banking sector from 2004-2014, in order to assess the impact of post-crisis regulatory initiatives. Four aspects of changes to the banking system are analyzed: the reach of effective banking regulation, risk of insolvency, risk of runs, and risk of contagion.
This report was sponsored by The Clearing House Association. All findings are solely our own.

Post-Crisis Changes in the Stability of the US Banking System
Oliver Wyman
NYC-TCH00911-001
Contents
Executive Summary 1
1. Introduction 3
2. Reach of banking regulation 7
3. Risk of insolvency 10
4. Risk of runs 18
5. Risk of contagion 21
6. Conclusion 25
References 27

Post-Crisis Changes in the Stability of the US Banking System
Oliver Wyman 1
NYC-TCH00911-001
Executive Summary
Following the financial crisis that peaked in 2008, a large number of regulatory initiatives have reshaped the rules that govern the financial system and the major institutions within it. This study assesses the changes related to US financial stability that have taken place in light of those regulatory initiatives and the actions of the banks themselves. Initiatives fall broadly into two camps. First, an extension of supervisory coverage to include a number of new BHCs that previously fell outside of the Federal Reserve’s prudential regulation and supervision. Second, and more importantly, an increase in the stringency of regulations, both with the introduction of new legislation (most notably the Dodd-Frank Act) as well as enhancements to existing requirements (such as Basel III).
In addition to highlighting the vulnerabilities of individual financial institutions, the financial crisis exposed systemic vulnerabilities in the banking system that proved detrimental to the wider economy. The system has since undergone a marked change in regulation as part of a broad policymaking effort to increase financial stability. Nonetheless, such changes come at a cost. There is a trade-off between levels of (and uncertainty in) capital and liquidity requirements, and the degree to which the banking system fulfills its core purpose in facilitating economic activity. In addition, overly stringent burdens placed on the banking sector increases the incentive for risk-taking activities to transition to the ‘shadow banking’ sector, with uncertain implications for the broader financial system as a whole.1
This study provides a broad assessment of the evolution of financial stability in the US banking system from 2004 to 2014. Consistent with the intentions of policymakers, we find evidence of improved financial stability across four key dimensions:
1. Reach of prudential regulation: Pre-crisis, a great deal of critical financial activity had developed beyond the reach of effective regulation. The crisis and subsequent policymaking brought a range of major financial firms, previously not directly affected by US banking regulation, under the supervision of the Federal Reserve as bank holding companies (BHCs). This widening of the perimeter of the banking system reduced the scope for systemic risky activities to be conducted without adequate oversight.
2. Risk of insolvency: Not only has high-quality capital increased substantially, but the riskiness of bank exposures has decreased. This has been especially true for the larger banks, which now hold nearly 30% of their balance sheets in low-risk assets such as cash. As a result of higher minimum requirements and systematic capital
1 For further discussion of the trade-offs inherent in targeting financial stability, see Crossen, Liang, Protsyk, and Zhang (2014).

Post-Crisis Changes in the Stability of the US Banking System
Oliver Wyman 2
NYC-TCH00911-001
planning under CCAR, median Tier 1 risk-based capital ratios for the US Global Systemically Important Banks increased from 7% in 2004 to 12% in 2014.
3. Risk of runs: Use of longer-duration funding and greatly increased holdings of liquid assets and investments have reduced the risk of destabilizing runs. Again, these changes are especially pronounced for larger banks, and have been spear-headed by a suite of regulatory and supervisory initiatives including the Liquidity Coverage Ratio (LCR), Net Stable Funding Ratio (NSFR), and Comprehensive Liquidity Assessment and Review (CLAR).
4. Risk of contagion: In addition to enhancements at the institution level, regulatory changes are reducing the bilateral and opaque web of interconnections among banks. One tangible manifestation of this reduction in contagion risk is the movement away from bilateral clearing towards CCPs.
Overall, we find strong evidence of a broad set of changes to the US banking system that are consistent with policymakers’ financial stability goals. The expanded reach of banking regulation, the ability of better-capitalized banks to absorb greater losses without becoming distressed, and banks’ reduced susceptibility to cash shortages all contribute to a financial system in which adverse shocks can be absorbed safely by individual banks rather than transmitted and amplified to other parts of the financial system. These conclusions are broadly consistent with recent findings of official sector assessments.2
At the same time, financial stability achieved today cannot be taken for granted tomorrow. A key contributor to the fragility of the financial system in 2008 was the scale and importance of financial activities that had gradually developed beyond the reach of prudential regulation. Ongoing care is needed to ensure that the new, more robust banking system architecture is sustainable, and will not be undermined as systemically important financial activity grows in the shadows beyond it.
2 For example, see the October 2014 Global Financial Stability Report prepared by the International Monetary Fund (IMF), and the 2014 Annual Report from the US Office of Financial Research (OFR).
Post-Crisis Changes in the Stability of the US Banking System Introduction
Oliver Wyman 3
NYC-TCH00911-001
1. Introduction
The financial crisis of 2008 represented a dramatic shock to the stability of the United States economy, and extraordinary actions by the government and central bank to prevent even worse catastrophe. In an effort to reduce the risk in the system following the crisis, a massive and ongoing policymaking effort has taken place to reform the rules of the financial system.
Such linked and (relatively) rapid changes to the structure and rules of the financial system have had material impact on the US financial system. Nearly all changes are related to a broad push by policymakers3 to promote financial stability.
“Financial stability” is an umbrella term that generally refers to the ability of the financial system to withstand internal or external shocks, without its core economic functions being impaired and without causing substantial negative effects on the broader economy. The post-crisis efforts related to financial stability have emphasized the need for considering the stability of the financial system as a whole (and not just the soundness of specific institutions and markets), and the requirement that financial stability be achieved without any extraordinary government support (Crossen, Liang, Protsyk, and Zhang 2014).
Financial stability goals are often framed in terms of addressing and managing systemic risk. For instance, the Financial Stability Board, an international group that has led the coordination of regulatory reform efforts across major financial jurisdictions, says that it “promotes global financial stability” via “a three-stage process for the identification of systemic risk in the financial sector, for framing the financial sector policy actions that can address these risks, and for overseeing implementation of those responses.”4
Much academic research on financial stability has focused on measuring systemic risk.5 Such measures can be useful in illuminating overall trends in the level of risk in the financial system. For example, the aggregate SRISK measure of systemic risk for US Financials peaked in late 2008, in the midst of the financial crisis.6 At the end of 2014, it had fallen to roughly one-third of this peak.
While such systemic risk quantifications can be useful indicators of how systemic risk is changing over time, they provide little insight into what is driving those changes. If
3 We use “policymakers” to refer generically to financial lawmakers, central bankers, regulators, and supervisors, and
others who shape the rules and standards of regulated financial institutions and markets. 4 http://www.financialstabilityboard.org/what-we-do/ 5 For an overview, see Crossen, Liang, Protsyk, and Zhang (2014) 6 Available at http://vlab.stern.nyu.edu/welcome/risk/

Post-Crisis Changes in the Stability of the US Banking System Introduction
Oliver Wyman 4
NYC-TCH00911-001
systemic risk seems to have declined in recent years, why has it fallen? What has changed about the financial system to make it more stable?
To help answer that question, it is useful to consider the actions of policymakers who have been actively driving towards that outcome. Regulators and other policymakers have devoted a great deal of time and energy to develop and implement new policies that promote financial stability. In developing potential explanations for reduced systemic risk in recent years, it makes sense to examine the changes in policy that have been introduced to achieve exactly that goal.
Policymakers in the US, especially those overseeing banks, have been in the vanguard of the global financial stability effort. Janet Yellen, Chair of the Board of Governors of the Federal Reserve, noted in 2014, “At the Federal Reserve, we have devoted substantially increased resources to monitoring financial stability and have refocused our regulatory and supervisory efforts to limit the buildup of systemic risk.” In the same speech, Yellen describes the kind of policy tools that “aim to make the financial system better able to withstand unexpected adverse developments”:
For example, requirements to hold sufficient loss-absorbing capital make financial institutions more resilient in the face of unexpected losses. Such requirements take on a macroprudential dimension when they are most stringent for the larger, most systemically important firms, thereby minimizing the risk that losses at such firms will reverberate through the financial system. Resilience against runs can be enhanced both by stronger capital positions and requirements for sufficient liquidity buffers among the most interconnected firms. An effective resolution regime for SIFIs can also enhance resilience by better protecting the financial system from contagion in the event of a SIFI collapse. Further, the stability of the financial system can be enhanced through measures that address interconnectedness between financial firms, such as margin and central clearing requirements for derivatives transactions. Finally, a regulatory umbrella wide enough to cover previous gaps in the regulation and supervision of systemically important firms and markets can help prevent risks from migrating to areas where they are difficult to detect or address. (Yellen 2014)
From this and many similar statements by prominent policymakers,7 we can identify some common policy levers that regulatory changes can push on to help promote financial stability. These include:
• Extending the reach of prudential regulation: A regulatory framework that ensures activities critical to the economy and the functioning of the financial system itself is robust and have proper oversight.
7 For example, see Tarullo (2011)

Post-Crisis Changes in the Stability of the US Banking System Introduction
Oliver Wyman 5
NYC-TCH00911-001
• Reducing solvency risk: Increasing the quantity and quality of loss absorbing capital that firms hold (relative to the risks they are exposed to) allows for more severe shocks to be borne by individual firms without their failing and transmitting distress to other parts of the financial system.
• Reducing the risk of runs: Increasing the durability of firms’ funding and their stocks of liquid assets readily available to meet unforeseen cash needs helps firms absorb adverse shocks without becoming subject to a destabilizing “run” as their creditors and counterparties drain cash in self-protection.
• Reducing the risk of contagion: Reducing direct linkages among major financial firms, creating higher prudential standards for the most systemically important and interconnected financial firms, and promoting transparency about the soundness of such firms all help to keep adverse shocks localized, reducing the likelihood that distress is transmitted and amplified to affect the broader financial system.
The first policy lever, which concerns the reach of prudential regulation, is not about the design of the rules themselves but instead about their scope: which groups of rules should be applied to various firms, activities, and markets. As Chair Yellen’s comment on the need for a sufficiently wide “regulatory umbrella” makes clear, US policymakers have also devoted considerable attention to this financial stability goal as well.
Figure 1: Financial stability policymaking: major post-crisis changes to US banking regulations (not exhaustive) Financial stability policy lever
Regulatory changes
Reducing solvency risk
• Revised risk-based capital standards (e.g. Basel 2.5, Basel 3) • Establishment of Comprehensive Capital Adequacy and Review (CCAR)
stress testing exercise • Modifications to the Supplementary Leverage Ratio (SLR) and adoption of a
stricter enhanced SLR for larger banks • Proposed introduction of TLAC and GSIB capital surcharges
Reducing risk of runs • Adoption of Liquidity Coverage Ratio (LCR) standards for minimum levels of cash and liquid assets
• Net Stable Funding Ratio (NSFR) standards (proposed by BCBS) Reducing risk of contagion
• Requirement to clear most swaps using a central counterparty • Margin requirements for all uncleared swaps (proposed) • Changes in tri-party repo market clearing to reduce intraday credit • Single Counterparty Credit Limits (to be re-proposed) • Introduction of the assumption in CCAR stress test for larger banks that each
firm’s largest counterparty defaults • Increased capital surcharge for firms reliant on short-term wholesale funding
(proposed) • Publication of firm-level stress testing results

Post-Crisis Changes in the Stability of the US Banking System Introduction
Oliver Wyman 6
NYC-TCH00911-001
The last three levers are about the design of regulatory policies: what the rules should be and how they should be calibrated. US banking regulators, led by the Federal Reserve, have been actively pushing on each of these policy levers to promote financial stability, as summarized in the table above.
The remainder of this paper uses these four elements of policy as a framework for assessing how financial stability has evolved over the last decade. For each element, we identify relevant metrics and analyze available data to assess how these underlying factors have evolved. For example, in assessing how solvency risk has evolved, we examine how capital levels have changed over time, as well as how the size and riskiness of firms’ exposures have evolved.
This paper therefore looks to complement the research to date that has focused on developing “all-in” metrics of systemic risk, by looking at the underlying features of the financial system that have been explicitly targeted by policymakers who aim to promote financial stability. We can then assess whether these underlying measures have changed over time in a way consistent with policymaker’s financial stability goals.
As noted above, financial stability must ultimately be considered holistically across the entire financial system. However, we focus in this paper on the US banking system, rather than the financial system as a whole. This is primarily for practical reasons: this allows us to work with a relatively consistent set of data to examine changes over time. This still allows us to assess one of the most significant changes in the structure of the financial system: the shift of many financial activities from being relatively unregulated pre-crisis to being subject to extensive banking system regulation today. We examine this extension of the reach of effective regulation in Section 2.
Note on methodology
The movement of institutions in and out of the banking system is not only a factor affecting the level of financial stability, but also a challenge for the time series analysis presented in this paper. In order to analyze a consistent set of metrics across the above-noted dimensions, we define the practically relevant US banking system for the investigation of financial stability as the collection of bank holding companies (BHCs) that were under the regulatory supervision of the Federal Reserve and had at least $500 MM in assets as of 2014 Q2, along with their predecessor institutions (whether or not they were regulated by the Federal Reserve). We use holding companies under Federal Reserve supervision (rather than entities supervised by other bank or non-bank regulatory agencies) as the basic group for analysis because it includes the vast majority of activities and assets undertaken by banking groups in the US, and is covered by consistent regulatory reporting data.
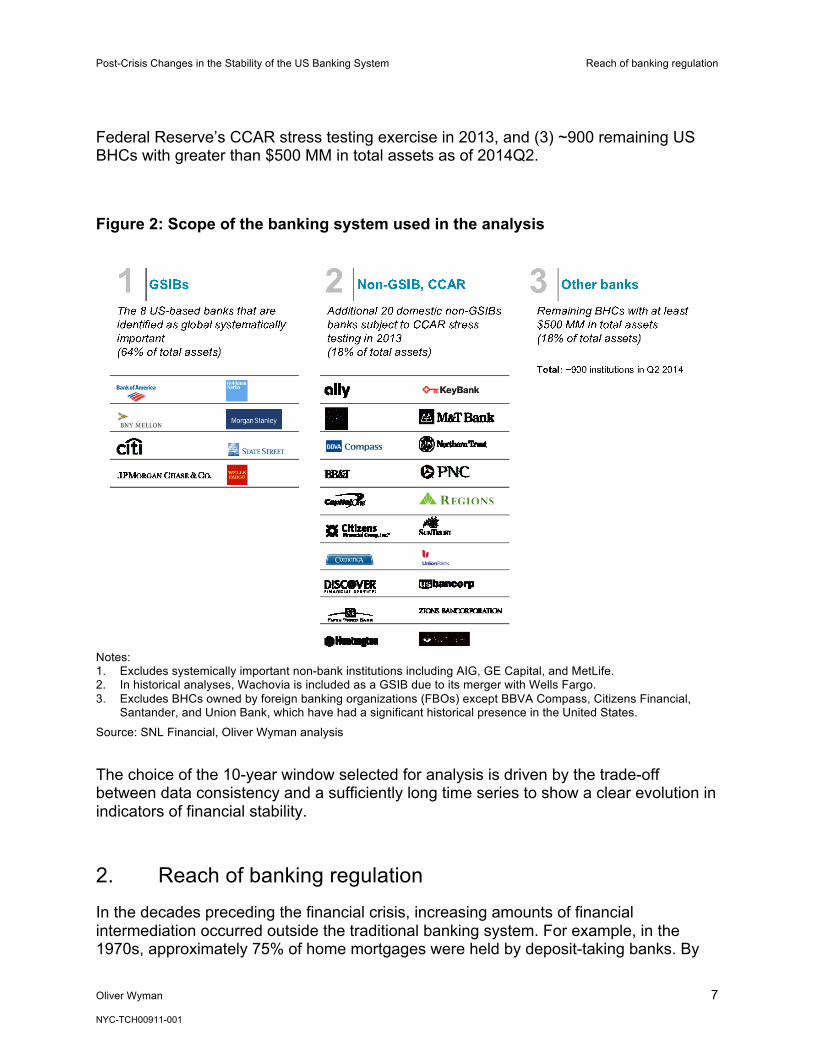
We further segment the system into three parts in order to compare the behavior of different bank types: (1) The 8 US-based “GSIBs”, or the banks identified as Global Systemically Important Banks that are subject to the most stringent prudential standards, (2) “Non-GSIB CCAR” banks, or the 20 domestic non-GSIBs that participated in the
Post-Crisis Changes in the Stability of the US Banking System Reach of banking regulation
Oliver Wyman 7
NYC-TCH00911-001
Federal Reserve’s CCAR stress testing exercise in 2013, and (3) ~900 remaining US BHCs with greater than $500 MM in total assets as of 2014Q2.
Figure 2: Scope of the banking system used in the analysis
Notes: 1. Excludes systemically important non-bank institutions including AIG, GE Capital, and MetLife. 2. In historical analyses, Wachovia is included as a GSIB due to its merger with Wells Fargo. 3. Excludes BHCs owned by foreign banking organizations (FBOs) except BBVA Compass, Citizens Financial,
Santander, and Union Bank, which have had a significant historical presence in the United States.
Source: SNL Financial, Oliver Wyman analysis The choice of the 10-year window selected for analysis is driven by the trade-off between data consistency and a sufficiently long time series to show a clear evolution in indicators of financial stability.
2. Reach of banking regulation
In the decades preceding the financial crisis, increasing amounts of financial intermediation occurred outside the traditional banking system. For example, in the 1970s, approximately 75% of home mortgages were held by deposit-taking banks. By
Post-Crisis Changes in the Stability of the US Banking System Reach of banking regulation
Oliver Wyman 8
NYC-TCH00911-001
2008, this proportion had fallen to below 30%.8 This major shift reflected the increasing use of risk intermediation approaches such as securitization and derivatives. It brought credit and financial services to a much larger group of firms and households at more competitive cost, but also resulted in a more complex financial system in which non-bank financial firms (and non-bank businesses within banking groups) came to play critical roles at the center of the financial system. Many of the financial institutions most heavily implicated in the crisis, such as securities brokers Bear Stearns and Lehman Brothers, government-sponsored enterprises (GSEs) Fannie Mae and Freddie Mac, and the insurance giant AIG, were non-bank institutions.
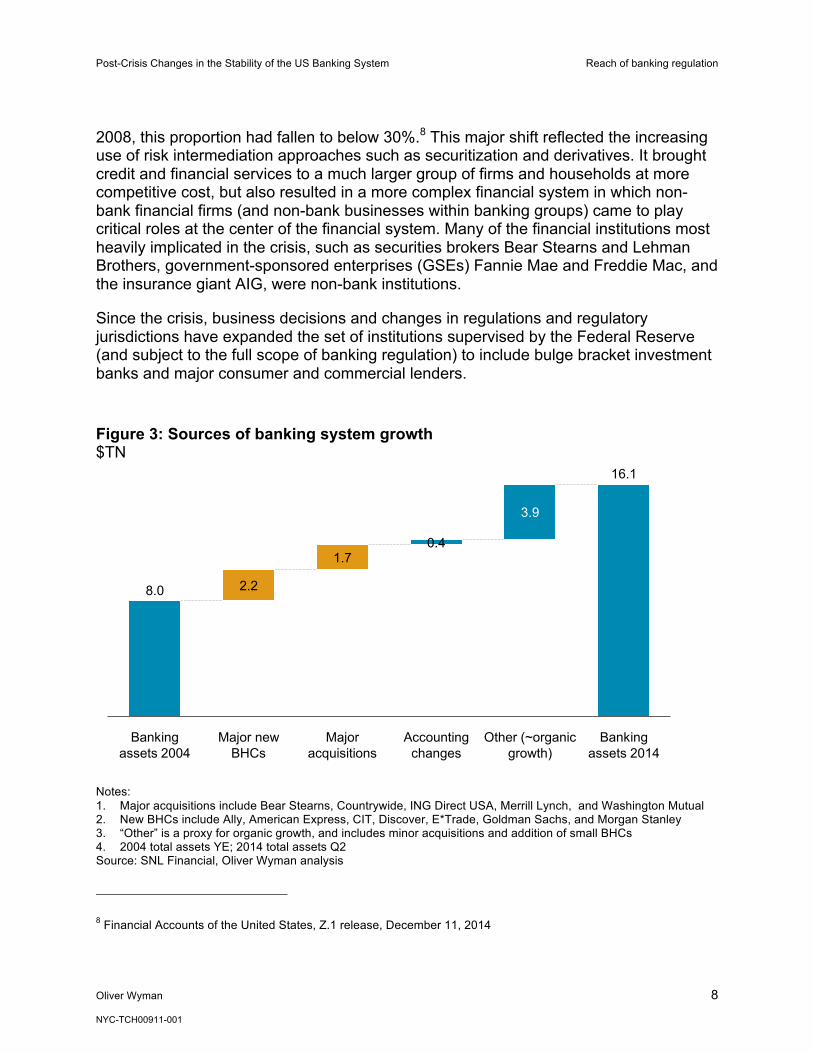
Since the crisis, business decisions and changes in regulations and regulatory jurisdictions have expanded the set of institutions supervised by the Federal Reserve (and subject to the full scope of banking regulation) to include bulge bracket investment banks and major consumer and commercial lenders.
Figure 3: Sources of banking system growth $TN
Notes: 1. Major acquisitions include Bear Stearns, Countrywide, ING Direct USA, Merrill Lynch, and Washington Mutual 2. New BHCs include Ally, American Express, CIT, Discover, E*Trade, Goldman Sachs, and Morgan Stanley 3. “Other” is a proxy for organic growth, and includes minor acquisitions and addition of small BHCs 4. 2004 total assets YE; 2014 total assets Q2 Source: SNL Financial, Oliver Wyman analysis
8 Financial Accounts of the United States, Z.1 release, December 11, 2014
Banking assets 2014
16.1
Other (~organic growth)
3.9
Accounting changes
0.4
Major acquisitions
1.7
Major new BHCs
2.2
Banking assets 2004
8.0

Post-Crisis Changes in the Stability of the US Banking System Reach of banking regulation
Oliver Wyman 9
NYC-TCH00911-001
The figure above illustrates historical changes to the banking system perimeter as defined in this study. Since 2004, the system has expanded by over $3.9 TN due to the conversion of some financial institutions to BHCs and the acquisition of others by BHC parents, thus widening the perimeter of Federal Reserve supervision. The major institutions to enter the banking system perimeter include:
• Bulge bracket investment banks: By 2007, the five US “bulge bracket” independent investment banks had combined assets of more than $4 TN. During the crisis, the failure of Lehman Brothers and the near collapse of Bear Stearns and Merrill Lynch, both non-bank institutions, contributed significantly to systemic risk within the financial system. With the acquisition of these distressed institutions by established BHCs, as well as the conversion of Goldman Sachs and Morgan Stanley to BHC status, the major US broker-dealers entered the banking system perimeter in 2008 and 2009.
• Major consumer and commercial lenders: Similarly, lending institutions with assets totaling over $1TN (as of 2007) became BHCs through conversion or acquisition between 2007 and 2011. This included firms such as Ally, American Express, CIT, Countrywide, Discover, and Washington Mutual.
Much of the activity of these institutions operated outside the purview of prudential bank regulation and supervision. In the years leading up to the crisis, the bulge bracket investment banks famously had much thinner equity capital cushions against losses than Federal Reserve-supervised banking groups, and were much more reliant on volatile funding sources.9 At the same time, Washington Mutual and Countrywide Financial were regulated by the much-criticized Office of Thrift Supervision (OTS).
The inclusion of such firms in the perimeter of the banking system has brought the full range of these firms’ activities under prudential bank regulation and supervision of the Federal Reserve. As such, they are subject to a host of banking regulations mandating greater loss absorbing capital, more durable funding, and larger stockpiles of liquidity, among other measures discussed in subsequent sections of this study.
Further, the larger non-bank financial firms designated as Systemically Important Financial Institutions (SIFIs), such as Prudential Financial Services, GE Capital, and AIG, as well as the US operations of Foreign Banking Organizations (FBOs), are becoming subject to greater Federal Reserve oversight and many supervisory requirements similar to that of the major BHCs. (Note that such FBOs and non-bank
9 For example, see Tarullo (2014)

Post-Crisis Changes in the Stability of the US Banking System Risk of insolvency
Oliver Wyman 10
NYC-TCH00911-001
SIFIs are generally excluded from the empirical analysis of the Federal Reserve-regulated banking system as defined in this paper.)
Since the crisis, consistent with the financial stability policy goal of having a “regulatory umbrella” that covers critical parts of the financial system, many activities previously beyond the reach of prudential regulation have become subject to stringent banking regulation. This ensures that activities that might contribute to systemic risk are subject to appropriate monitoring and oversight by supervisors. (At the same time, Volcker rule constraints have pushed some activities considered by many to be relatively risky, such as proprietary trading, out of banks.)
While such changes have collectively placed a larger proportion of financial institutions under the banking regulatory regime, they may also create incentives for some types of financial intermediation to migrate beyond the reach of these rules. Thus, the evolution of risks outside the banking sector will need to be carefully assessed over time to ensure that the stability of the financial system as a whole is maintained.
3. Risk of insolvency
The solvency of banks and other financial institutions came under severe stress during the financial crisis. In the second half of 2007, US home prices experienced significant declines across many markets to a degree unprecedented since the Great Depression. This led to a marked increase in credit losses on mortgages and other home equity products, as well as sharp declines in the value of residential mortgage-backed securities (RMBS). Firms exposed to the mortgage market and in particular to securities backed by higher-risk mortgages faced significant losses starting in the first half of 2008. Insufficient capital buffers to absorb these losses led to widespread distress in the financial system.
Risks to the solvency of financial institutions, which we now recognize as being unacceptably high in the run-up to the crisis, are a function of two key drivers: the size and quality of exposures and the capital available to absorb losses. Relatively risky asset portfolios can be held safely (at least in terms of solvency) with larger buffers of capital. We find that both sides of this ‘solvency equation’ have improved since the financial crisis: while total assets of the banking system have increased overall, the system has experienced both a de-risking of assets while capital buffers have grown markedly larger.
First, the size and riskiness of the banking system’s exposures is an important driver of its overall stability. Below we show the size of the banking system’s balance sheet (tangible assets) as a proportion of GDP. While overall banking assets have steadily climbed in the last decade, partially due to a widening banking perimeter, they have remained stable in the post-crisis period as a fraction of GDP (2010-2014).

Post-Crisis Changes in the Stability of the US Banking System Risk of insolvency
Oliver Wyman 11
NYC-TCH00911-001
Figure 4: Size of bank balance sheets Tangible assets / US GDP (%)
Total banking system
GSIBs
6 87 8
1922
20 1969
12 1010
14 16
11Real Est. Lns
Securities
Cash & Eq.
2014
Other
2010
Cnsr Lns.
Trading Assets
2007
7
2004
C&I Lns.6
964
96
19
10
7
14
93
6
16
72
8
19
8
5
4811
10 86
9
12 9
6
99
6
Cash & Eq.
C&I Lns.Cnsr Lns.Real Est. Lns
Trading Assets
Securities
Other
2014
60
16
4
9
2010
62
14
35
8
2007
47
7
4
7
2004
37
63
4
5
Post-Crisis Changes in the Stability of the US Banking System Risk of insolvency
Oliver Wyman 12
NYC-TCH00911-001
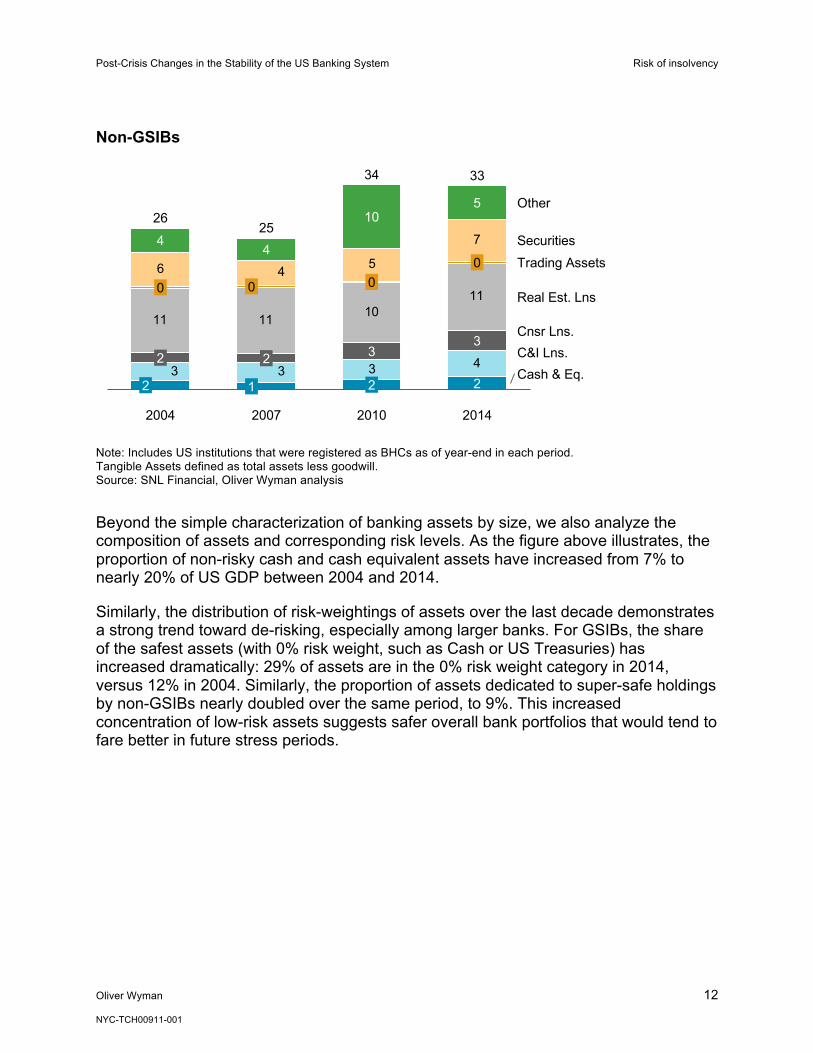
Non-GSIBs
Note: Includes US institutions that were registered as BHCs as of year-end in each period. Tangible Assets defined as total assets less goodwill. Source: SNL Financial, Oliver Wyman analysis Beyond the simple characterization of banking assets by size, we also analyze the composition of assets and corresponding risk levels. As the figure above illustrates, the proportion of non-risky cash and cash equivalent assets have increased from 7% to nearly 20% of US GDP between 2004 and 2014.
Similarly, the distribution of risk-weightings of assets over the last decade demonstrates a strong trend toward de-risking, especially among larger banks. For GSIBs, the share of the safest assets (with 0% risk weight, such as Cash or US Treasuries) has increased dramatically: 29% of assets are in the 0% risk weight category in 2014, versus 12% in 2004. Similarly, the proportion of assets dedicated to super-safe holdings by non-GSIBs nearly doubled over the same period, to 9%. This increased concentration of low-risk assets suggests safer overall bank portfolios that would tend to fare better in future stress periods.
3 4
11 11 1011
6 5
7
33
40
4
Cash & Eq.C&I Lns.Cnsr Lns.
Real Est. Lns
Trading AssetsSecurities
Other
2014
33
2
3
0
5
2010
34
2
3
0
10
2007
25
1
2
0
4
2004
26
2
2

Post-Crisis Changes in the Stability of the US Banking System Risk of insolvency
Oliver Wyman 13
NYC-TCH00911-001
Figure 5: Proportion of very low-risk assets on bank balance sheets Zero risk weight assets as % of total
Note: Includes US institutions that were registered as BHCs in each period. Source: SNL Financial, Oliver Wyman analysis
Over the same period, cash and “cash-equivalent” assets of GSIBs grew from 14% to 27%. The increase of cash holdings is likely driven by both changing supervisory expectations as well as implementation of the Liquidity Coverage Ratio (LCR) and other liquidity requirements.
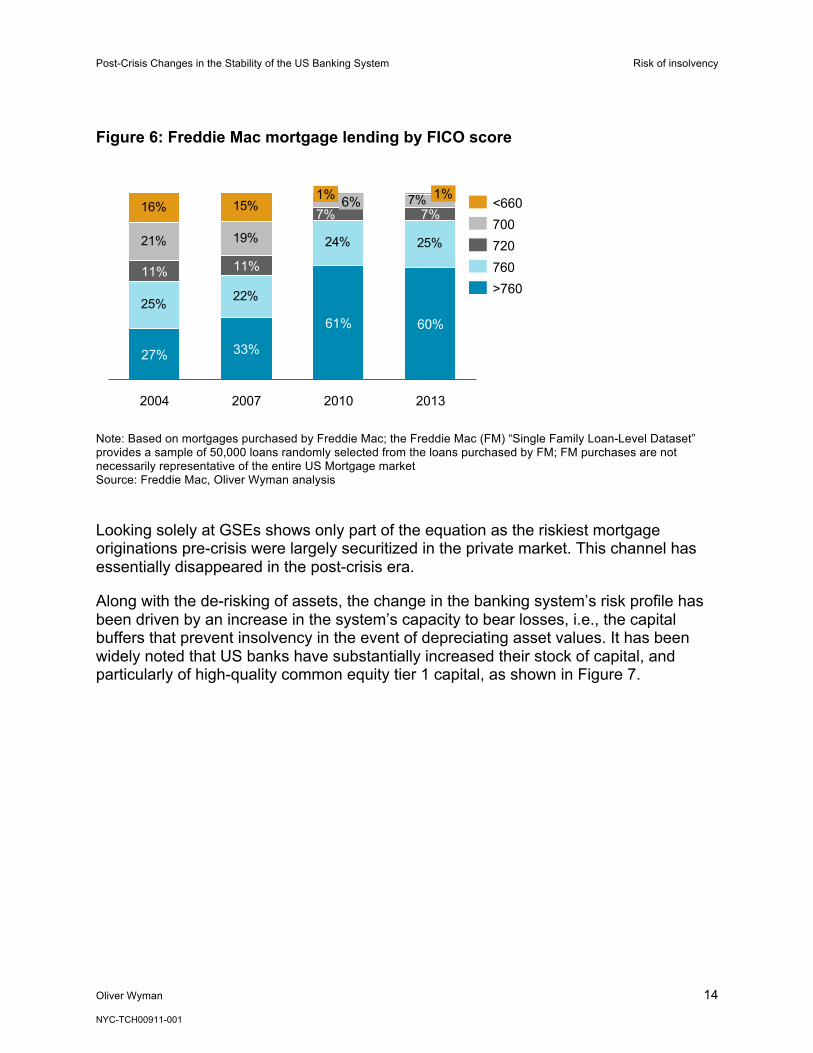
As noted earlier, a key destabilizing factor in the financial crisis was the risk of insolvency driven by securitized credit exposures, and in particular RMBS. Since the financial crisis, the quality of mortgage lending has increased dramatically, as evidenced by higher FICO scores and lower LTVs. While comprehensive public data for the full US mortgage industry is not available it is instructive to look at disclosures by the large GSEs that form a significant part of the US market. At Freddie Mac, for example, 60% of mortgages in 2014 had a FICO score of 760+, compared to only 27% in 2004 and 33% in 2007.
Post-Crisis Changes in the Stability of the US Banking System Risk of insolvency
Oliver Wyman 14
NYC-TCH00911-001
Figure 6: Freddie Mac mortgage lending by FICO score
Note: Based on mortgages purchased by Freddie Mac; the Freddie Mac (FM) “Single Family Loan-Level Dataset” provides a sample of 50,000 loans randomly selected from the loans purchased by FM; FM purchases are not necessarily representative of the entire US Mortgage market Source: Freddie Mac, Oliver Wyman analysis
Looking solely at GSEs shows only part of the equation as the riskiest mortgage originations pre-crisis were largely securitized in the private market. This channel has essentially disappeared in the post-crisis era.
Along with the de-risking of assets, the change in the banking system’s risk profile has been driven by an increase in the system’s capacity to bear losses, i.e., the capital buffers that prevent insolvency in the event of depreciating asset values. It has been widely noted that US banks have substantially increased their stock of capital, and particularly of high-quality common equity tier 1 capital, as shown in Figure 7.
25% 22%
24% 25%21% 19%
16% 15% 7%
2013
60%
7%1%
2010
61%
7%6%1%
2007
33%
11%
2004
27%
11%
<660
760
700720
>760

Post-Crisis Changes in the Stability of the US Banking System Risk of insolvency
Oliver Wyman 15
NYC-TCH00911-001
Figure 7: Common Equity Tier 1 (CET1) $ BN
Source: SNL Financial, Oliver Wyman analysis
As the figure below shows, the increase in capital has been driven primarily by retained earnings, as opposed to direct capital raising. Between 2010 and 2013, over 75% of the profits generated by the banking system were retained and added to capital buffers.
Figure 8: Change in Total Equity $BN, 2010–2013
Source: SNL Financial – SEC filings, Oliver Wyman analysis
99
173232
263
GSIBs
Other CCAR
Others
2014
1,246
772
211
2012
1,040
632
176
2010
858
541
144
2007
507
273
135
2004
474
235
83157
Total EYO 2013
1,711
Other (Net New
BHCs)
15
Common stock
Dividend
90
Preferred stock
Dividend
27
Treasury Stock
59
Common Stock
116
Preferred-stock
44
Net Income
454
Total BOY 2010
1,261
73
Capital Adjustment
+$350BN

Post-Crisis Changes in the Stability of the US Banking System Risk of insolvency
Oliver Wyman 16
NYC-TCH00911-001
Because capital has increased significantly more than the quantity of risky assets held by banks, capital ratios have also improved. Consistent with the stated intent of US policymakers to have heightened prudential standards for the larger and most systemically important firms, the change in loss absorbing capacity has been most pronounced for the GSIBs, with median capital ratios increasing by 68% between 2004 and 2014. Risk-based capital ratios for non-GSIB CCAR banks and other banks in our sample increased 42% and 24%, respectively, over the same period.
Figure 9: Tier 1 Capital Ratio (Tier 1 Capital/RWA) 25% quartile, median, and 75% quartile
Notes: Due to regulatory changes such as changes in RWA measurement rules, capital ratio inputs may not be strictly comparable across the period shown. 2014 capital ratio is as of 2014Q3 (most recent available) while all other values are as of year-end. Source: SNL Financial, Oliver Wyman analysis
The sharp increase in post-crisis capital ratios for larger banks is consistent with the implementation of new capital rules for these firms, including the Federal Reserve’s forward-looking CCAR stress testing regime, which made projected post-stress capital the binding constraint for participating BHCs, effectively raising their required regulatory capital. To be able to distribute capital to shareholders, GSIBs and other large banks subject to CCAR must have capital sufficient to withstand the losses that are estimated to accompany a severe stress scenario, and still have enough capital left over to continue lending and be considered strong trading counterparties (Board of Governors of the Federal Reserve System 2014).
As noted earlier, it is the relative size of potential losses and of capital buffers that is most important to assessing solvency risk. As a simple demonstration of the magnitude of current bank capital levels relative to exposures, we use a top-down capital stress testing framework developed by Federal Reserve economists, the Capital and Loss Assessment under Stress Scenarios (CLASS) model (Hirtle, Kovner, Vickery, and Bhanot 2014). Like its more sophisticated cousins that are used in the Federal Reserve’s supervisory stress tests of capital adequacy, the CLASS model predicts (for a
6.5
5.7
8.29.6 9.89.1 7.5
11.311.9
12.6
7.86.4
9.110.7 11.1
2
4
6
8
10
12
14
16
2004 2007 2010 2012 2014
8.27.5 7.7
9.110.1
12.6 11.9
13.4
14.9 15.1
10.09.3
10.5
12.112.4
2
4
6
8
10
12
14
16
2004 2007 2010 2012 2014
6.8
5.1
9.3
11.0 11.3
7.5 7.3
12.2
14.5
12.8
7.16.5
10.3
13.111.9
2
4
6
8
10
12
14
16
2004 2007 2010 2012 2014
Non-GSIB, CCAR banks Other banksGSIBs

Post-Crisis Changes in the Stability of the US Banking System Risk of insolvency
Oliver Wyman 17
NYC-TCH00911-001
given macroeconomic scenario) losses, revenues, net income, and capital ratios for each bank. It is based on public data and simple econometric models, and is estimated on BHC data from 1991 to 2013 Q3.10
First, we use the CLASS model to estimate changes in overall capital levels in the banking system under the Federal Reserve-defined Severely Adverse stress scenario (as used in CCAR 2015).11
Figure 10: Change in aggregate capital ratio under Federal Reserve Severely Adverse scenario CET1 capital as % of RWA
The Federal Reserve’s Severely Adverse scenario includes double-digit unemployment, home prices dropping by more than 25%, and a stock market decline of nearly 60%. Consistent with results from CCAR and DFAST, capital levels decline but remain well above the regulatory minimum ratio of 4.5%.
Given the capital buffers of today’s banks, economic conditions would need to be quite extreme – likely well beyond the experience of 2008 – to seriously threaten the overall solvency of the banking system. It is difficult to assess precisely how banks would fare in such extreme scenarios, given that it requires extrapolation beyond historical
10 We directly use the regression coefficients from Hirtle, Kovner, Vickery, and Bhanot (2014). We conservatively assume that the CLASS framework’s autoregressive models for net charge-offs tend toward the long-run historical mean values reported by the authors. To conservatively reflect structural changes such as post-crisis reductions in net revenue generation for some businesses, we assume that the framework’s Pre-Provision Net Revenue (PPNR) autoregressive models tend toward an average of the last observed value (Q3 2014) and the reported long-run historical mean.
11 Available at http://www.federalreserve.gov/bankinforeg/CCAR-2015-Severely-Adverse-Market-Shocks.xlsx
0
2
4
6
8
10
12
14
4.5
GSIBs
Non-GSIB CCAROthers
Q4Q3Q2Q1 2016
Q4Q3Q2Q1 2015
Q4
Real GDP declines by 4.6%Unemployment goes to 10.1%Home prices drop by 26%Stock market drops by 58%

Post-Crisis Changes in the Stability of the US Banking System Risk of runs
Oliver Wyman 18
NYC-TCH00911-001
experience. With appropriate caveats for the significant uncertainty of such extrapolations, we use the CLASS framework to gauge, in an indicative way, what kind of extreme economic environment might be needed to seriously impair bank capital levels.
The results when the CLASS model is applied to one such extreme scenario is shown in the figure below. In this extreme stress scenario, real GDP declines by over 12% (nearly triple the worst decline in US GDP in the post-World War II era), unemployment reaches nearly 15% (unequalled since the 1930s), home prices drop by half to pre-2000 levels, and stock market shares lose most of their value, dropping to circa 1990 levels.
Figure 11: Change in aggregate capital ratio under extreme stress scenario12 CET1 capital as % of RWA
Using the simple assumptions of the CLASS model, banks still remain solvent (if no longer well capitalized) even in this extreme economic scenario. As noted above, such extrapolations should be taken with a grain of salt, but the results do suggest that current capital levels are consistent with a very high degree of conservatism.
4. Risk of runs
During the financial crisis, many financial institutions' reliance on short term wholesale funding, such as repurchase agreement (repos) and commercial paper, made them susceptible to runs. This was especially true for those non-bank firms that relied more 12 Extreme scenario constructed by applying 2 times the difference between the Base and Severely Adverse scenario
(Unemployment rate, GDP growth) or 2 times the multiplication factor between the Base and Severely Adverse (all other economic and market variables), in each quarter
0
2
4
6
8
10
12
14
Q3Q2Q1 2016
Q4Q3Q2Q1 2015
Q4
4.5 GSIBs
Non-GSIB CCAROthers
Q4
Real GDP declines by 12.5% Unemployment goes to 14.8%Home prices drop by 48%Stock market drops by 83%
Post-Crisis Changes in the Stability of the US Banking System Risk of runs
Oliver Wyman 19
NYC-TCH00911-001
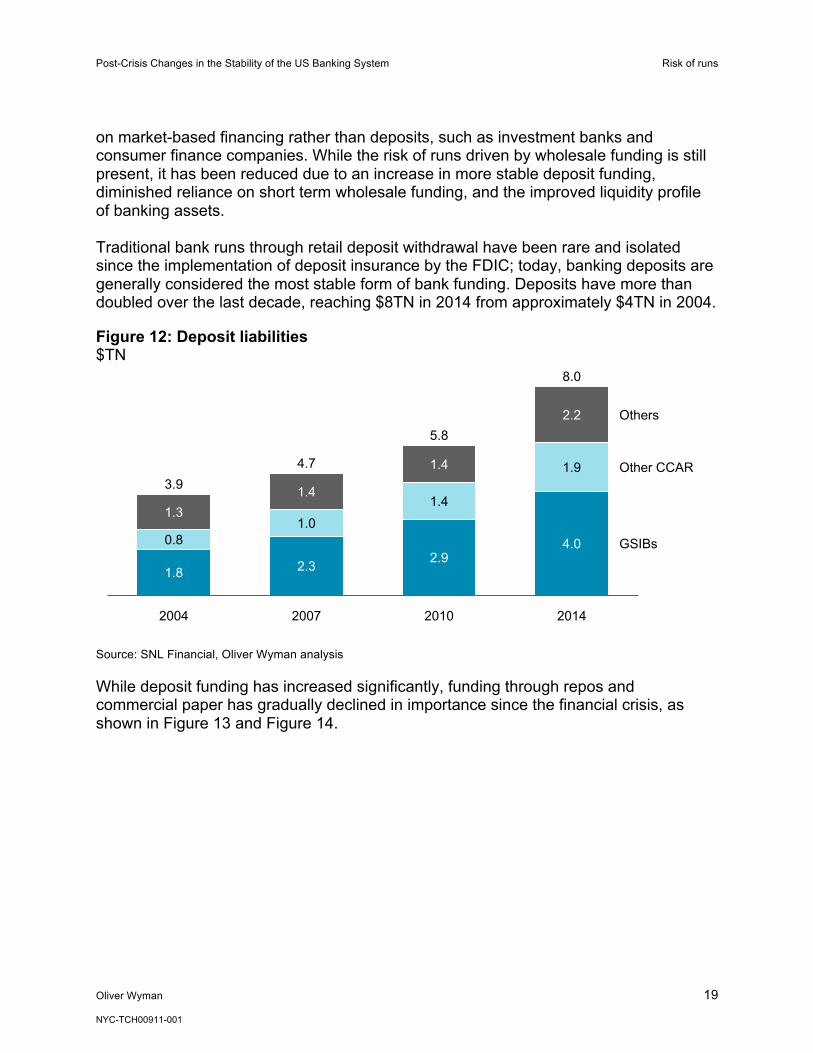
on market-based financing rather than deposits, such as investment banks and consumer finance companies. While the risk of runs driven by wholesale funding is still present, it has been reduced due to an increase in more stable deposit funding, diminished reliance on short term wholesale funding, and the improved liquidity profile of banking assets. Traditional bank runs through retail deposit withdrawal have been rare and isolated since the implementation of deposit insurance by the FDIC; today, banking deposits are generally considered the most stable form of bank funding. Deposits have more than doubled over the last decade, reaching $8TN in 2014 from approximately $4TN in 2004.
Figure 12: Deposit liabilities $TN
Source: SNL Financial, Oliver Wyman analysis
While deposit funding has increased significantly, funding through repos and commercial paper has gradually declined in importance since the financial crisis, as shown in Figure 13 and Figure 14.
GSIBs
Other CCAR
Others
2014
8.0
4.0
1.9
2.2
2010
5.8
2.9
1.4
1.4
2007
4.7
2.3
1.0
1.4
2004
3.9
1.8
0.8
1.3

Post-Crisis Changes in the Stability of the US Banking System Risk of runs
Oliver Wyman 20
NYC-TCH00911-001
Figure 13: Bank use of repo liabilities % of tangible assets, 2004–2014
Note: Tangible assets defined as total assets less goodwill Source: SNL Financial, Oliver Wyman analysis
Figure 14: Commercial paper issuance by financial firms $TN, 2000–2014
Source: SNL Financial, Oliver Wyman analysis
Moreover, large dealers (all of whom are GSIBs) have generally increased the term of their repo financing. According to New York Federal Reserve research, the weighted-average remaining maturity for tri-party repo trades collateralized by risky assets (those other than government and agency securities) has more than doubled since 2011 from 35 days to 75 days (Copeland, Davis, and Selig 2014).
2001 2002 2003 2004 2005 2006 2007 2008 2009 2010 2011 2012 2013 2014
5
4
3
2
1
0
6

Post-Crisis Changes in the Stability of the US Banking System Risk of contagion
Oliver Wyman 21
NYC-TCH00911-001
The observable trend toward more durable funding is consistent with the intention of senior Federal Reserve policymakers, as well as with more stringent stress testing of funding run-offs via LCR and similar requirements.13
The risk of runs is also dampened by holdings of liquid assets, which can be easily converted to cash in order to fulfill payment obligations. Liquid assets and relatively liquid investments – including cash, cash-equivalents, and securities available for sale – have increased substantially among the larger banks, particularly cash holdings by GSIBs. While some of these assets can decrease in value in a stress environment, they can prevent or delay runs on a financial institution.
Figure 15: Liquid asset and investment holdings $BN
Note: Cash is defined as the sum of Deposits, Reverse Repos and Fed Funds Source: SNL Financial, Oliver Wyman analysis
The post-crisis development of larger capital buffers relative to potential losses, more durable funding sources, and larger stocks of cash and liquid assets all help to reduce the risk of firms experiencing sudden and destabilizing liquidity runs. The evidence strongly suggests that the risk of such runs within the banking system has declined.
5. Risk of contagion
Contagion, in our context, is the spread of financial distress from one part of the financial system to other parts, with stresses often not just spreading but also becoming
13 For example, see Tarullo (2015)
Cash by bank type AFS securities by bank type
230243
393 374
2010
2,057
1,298
367
2007
1,355
2014
2,247
1,358
515
816
296
2004
1,315
695
390
GSIBsNon-GSIB, CCAROther banks
168
125
62
2,838
3,206
2014
200
2010
2,432
2,174
133
2007
1,175
1,004
85 86
2004
887
697
128
Post-Crisis Changes in the Stability of the US Banking System Risk of contagion
Oliver Wyman 22
NYC-TCH00911-001
amplified. Distress might spread from bank to bank and from market to market. Distress may spread due to one or more of three basic mechanisms:
1) Direct financial connections among individual firms
2) Firms having exposures to a common source of risk
3) Informational contagion, in which stress in one area is seen as signaling potential problems elsewhere
All three mechanisms were observed during the financial crisis, and post-crisis regulatory changes, many global in scope, have aimed to reduce the risk posed by each of these modes of contagion.
Direct financial connections among individual firms can result from interbank lending, repo trades, OTC derivatives contracts, a bank simply owning equity or debt issued by another, and similar contractual connections. Although many have argued that direct financial interconnections played a smaller role than other transmission mechanisms in the recent financial crisis,14 the existence of a large and opaque web of direct counterparty relationships among major financial firms (and especially global dealers) due to OTC derivatives made it more difficult for both firms and external parties to understand their risk exposures, and so exacerbated indiscriminant defensive behavior and similar informational contagion. More directly, AIG FP and other firms in the business of offering credit protection on highly rated securities failed due to collateral calls on OTC derivatives contracts.
The US (along with other major financial jurisdictions) has put into place requirements to clear most OTC derivatives trades using a central counterparty, shrinking and simplifying what had become a complex web of bilateral obligations among major OTC market participants. From essentially a zero base ten years ago, the Financial Stability Board estimates that 44% of all interest rate swaps and 19% of credit derivatives (by notional outstanding) were centrally cleared as of September 2014; approximately 90% of new OTC derivatives trades in CDS indices are centrally cleared (2014). New rules also require dealer-to-dealer trades to be collateralized from their inception, providing a cushion to absorb losses on such trades.
Beyond such reforms to the OTC markets, the counterparty exposures of large banks (including those arising from OTC derivatives and repos) now directly affect the capital and liquidity stocks that they are required to hold, based on ongoing stress tests. For example, for the US BHCs that have the most sizeable counterparty exposures (all eight GSIBs), the regular CCAR capital adequacy stress testing exercises incorporate very severe stresses on counterparty exposures, including the assumption that each firm’s 14 For example, see Committee on Capital Markets Regulation (2014)

Post-Crisis Changes in the Stability of the US Banking System Risk of contagion
Oliver Wyman 23
NYC-TCH00911-001
largest-exposure counterparty defaults without warning (no matter how well rated or strong financially that counterparty is). Similarly, potential collateral calls relating to each firm’s derivatives contracts are included in liquidity stress tests such as LCR.
Such measures, along with other new rules such as higher capital requirements for exposures to financial firms, raise the economic cost to each bank of maintaining large ongoing exposures to other major financial firms. The result has been a steady decline in overall counterparty credit exposures among BHCs, as shown in Figure 16. The net credit exposure of outstanding OTC derivatives (after netting but before collateral) has declined dramatically since the crisis, from $835 BN in 2009 to $579 BN in 2014. Derivatives contracts with banks and securities firms as counterparties have declined by over 35% in this period.
Figure 16: Net OTC derivatives credit exposure of US BHCs, by counterparty type $BN
Source: SNL Financial, Oliver Wyman analysis
Significant work has also gone into reducing the size and scope of the direct financial interconnections arising in the wholesale funding markets; for example, the fraction of tri-party repo volume that involves intraday provision of credit by clearing banks to dealers has declined from 100% in 2012 to less than 10%.15
While much has already been accomplished, work remains to fully define and implement many important regulatory changes intended to reduce direct financial connections among financial firms, including the Single Counterparty Credit Limit, OTC
15 See “Key Events,” May 2014, at http://www.newyorkfed.org/banking/tpr_infr_reform.html
471412
474420
327 311
2012
592
218
2010
220
36
2013
30
579
Corp & Others
Banks & Sec Firms
35
2009
291
3726
835
712
242250
Sovereign Govts
717810
2011
35
285
2014
Post-Crisis Changes in the Stability of the US Banking System Risk of contagion
Oliver Wyman 24
NYC-TCH00911-001
margin requirements, and supplemental capital requirements that are intended to reduce dependence on short-term wholesale funding.
The financial crisis saw many examples of banks and other financial firms experiencing distress at the same time due to exposures to common sources of risk. Most fundamentally, when home prices retreated from unsustainable highs, exposure to US residential mortgages (and in particular higher risk mortgages) threatened nearly all major financial firms, since the credit risk of this enormous asset class had become dispersed throughout the financial system via securitization and credit derivatives. Firms shared exposures not just to common asset risks but also to common liability risks: after Bear Stearns collapsed, other investment banks worked to overcome the fragility of over-reliance on hedge fund collateral and short-term secured funding.
One of the most damaging contagion dynamics in the financial crisis resulted from a combination of shared asset exposures and fragile funding structures: fire sales. To meet liquidity needs, firms would sell assets under duress, depressing market prices. Other firms holding similar assets on a mark-to-market accounting basis would have to mark their own holdings down to the fire sale price, reducing their own capital position and potentially sparking loss of confidence and forced sales of their own.
Common risks interact with direct financial connections to spread contagion. Counterparty credit risk exposure to large financial market participants was itself a common risk shared by many firms, making these central ‘nodes’ in the financial system network disproportionately important in the transmission and containment of distress.
Banks are still exposed to common sources of risk – it is difficult to see how they could not be. However, the significantly increased stocks of capital and liquidity provide much more runway for firms to absorb rather than transmit any shocks to their capital, liquidity, or funding. This reduces the likelihood and impact of any fire sales. Furthermore, the larger and most interconnected banks – the most important nodes in the financial network – are subject to more stringent prudential standards, such as higher capital requirements via the capital surcharge for GSIBs. This increases not just the stability of those firms but of the system as a whole.
Informational contagion is most prevalent and most damaging when uncertainty is widespread. In the crisis, markets and counterparties often lacked credible and current information on the health of large financial firms and the risks they faced. Given this absence of information, excessive confidence in firms and securities quickly turned into a generalized fear. Losses or funding pressures affecting one firm could easily be interpreted as warning signs of trouble at similar institutions.
The Federal Reserve’s SCAP stress testing exercise of large banks in 2009, which made firm-level results public, helped diminish contagion and market paralysis by providing a credible demonstration that the large banks were in fact adequately capitalized. This greatly reduced the fog of uncertainty that had enveloped the banking
Post-Crisis Changes in the Stability of the US Banking System Conclusion
Oliver Wyman 25
NYC-TCH00911-001
system in the crisis. Published stress tests results continue today under the CCAR and DFAST regimes that large US banks are subject to.
6. Conclusion
The crisis is without doubt the defining event in the financial history of the last decade. It laid bare fragilities that had gradually built up as the US financial system transformed in the preceding decades. Arguably the most important of these changes were the tremendous growth of capital markets, securitization, and derivatives alongside and interwoven with the traditional banking system based on deposits and loans. The increasing importance of market-based financial activity was accompanied by a corresponding rise of large non-bank financial intermediaries at the center of the financial system, which had neither the safety net access nor the accompanying regulation that defined banks. And among banks, the crisis pointed to significant deficiencies in the standards and measures of financial health. The financial system had outgrown the financial regulatory system.
The crisis thus kick-started a wave of huge changes to financial regulation, in many ways “marking to market” the bank regulatory framework to the realities of the modern financial landscape. New or updated requirements for more capital, more durable funding, more liquidity, and less interconnectivity among large financial firms have transformed the US financial system and made it much more stable. Policymakers have achieved a great deal.
However, there remain two critical watch points (and avenues for continued research) for the newly fortified banking system architecture. First is the importance of assessing over time the impact (intended and unintended) of the new suite of regulations, and refining them as needed. Such assessments should consider both improvements in financial stability and changes in the effectiveness and efficiency with which the financial system performs its core functions such as supporting economic growth. Many changes are still in flight, such as the transformation of OTC markets, the design of regulations that affect banks’ funding models, and shifts in legal-entity and operating models that help ensure that even the most significant firms can fail without endangering the broader economy. These and other prospective changes need to be rolled out thoughtfully, and as above, assessed for impact and refined over time.
Second is the need to make sure that core functions provided by well-regulated banks are economically viable within the new regulatory framework. There will always be the risk that (once again) significant financial intermediation activities build-up in the pockets and seams of the financial system, where they are difficult to see and regulate effectively. And it is neither possible nor desirable to maintain a static financial system without innovation or dynamic competition. However, it is important to ensure that the economic incentives for banks and their investors are calibrated to encourage critical
Post-Crisis Changes in the Stability of the US Banking System Conclusion
Oliver Wyman 26
NYC-TCH00911-001
banking functions to remain within the bounds of effectively regulated entities. Otherwise, the financial stability achieved today could be undermined over time. A key contributor to the fragility of the financial system in 2008 was the scale and importance of financial activities that had gradually developed beyond the reach of prudential regulation. If the services provided by today’s banks cannot be delivered on an economic basis, competitive and investor pressure will inevitably see such services migrate to parts of the financial system with lower regulatory costs and less oversight.
Ongoing care is thus needed to ensure that the new banking system architecture is sustainable, and will not be undermined as systemically important financial activity grows in the shadows beyond it.

Post-Crisis Changes in the Stability of the US Banking System Conclusion
Oliver Wyman 27
NYC-TCH00911-001
References
Board of Governors of the Federal Reserve System, “Comprehensive Capital Analysis and Review 2014: Assessment Framework and Results,” March 2014.
Committee on Capital Markets Regulation, “What To Do About Contagion,” September 3, 2014, http://capmktsreg.org/press/ccmr-releases-paper-urging-discussion-contagion-financial-markets/
Copeland, Adam, Isaac Davis, and Ira Selig, “What’s Your WAM? Taking Stock of Dealers’ Funding Durability,” Liberty Street Economics, Federal Reserve Bank of New York, http://libertystreeteconomics.newyorkfed.org/2014/06/whats-your-wam-taking-stock-of-dealers-funding-durability.html, June 9th 2014.
Crossen, Christopher, Xuan Liang, Andriy Protsyk, and Jing Zhang, “Measuring the Banking System’s Resilience,” Moody’s Analytics, November 2014.
Financial Stability Board, “OTC Derivatives Market Reforms: Eighth Progress Report on Implementation,” November 7, 2014, http://www.financialstabilityboard.org/2014/11/eighth-progress-report-on-implementation-of-otc-derivatives-market-reforms/
Hirtle, Beverly, Anna Kovner, James Vickery, and Meru Bhanot, “The Capital and Loss Assessment under Stress Scenarios (CLASS) Model,” Staff Reports 663, Federal Reserve Bank of New York, February 2014; revised October 2014.
International Monetary Fund, “Global Financial Stability Report: Risk Taking, Liquidity, and Shadow Banking: Curbing Excess While Promoting Growth,” October 2014.
Office of Financial Research, “2014 Annual Report to Congress,” December 2, 2014.
Tarullo, Daniel K, “Capital and liquidity standards,” Testimony before the Committee on Financial Services, US House of Representatives, Washington DC, June 16, 2011.
Tarullo, Daniel K , “Regulating Large Foreign Banking Organizations,” Remarks at the Harvard Law School Symposium on Building the Financial System of the Twenty-first Century: An Agenda for Europe and the United States, Armonk, New York, March 27, 2014.
Tarullo, Daniel K, “Advancing Macroprudential Policy Objectives,” Remarks at the Office of Financial Research and Financial Stability Oversight Council's 4th Annual Conference on Evaluating Macroprudential Tools: Complementarities and Conflicts, Arlington, Virginia, January 30, 2015.

Post-Crisis Changes in the Stability of the US Banking System Conclusion
Oliver Wyman 28
NYC-TCH00911-001
Yellen, Janet, “Monetary Policy and Financial Stability,” Remarks from the 2014 Michel Camdessus Central Banking Lecture, International Monetary Fund, Washington, DC, July 2, 2014.

Post-Crisis Changes in the Stability of the US Banking System
Oliver Wyman 29
NYC-TCH00911-001
Report qualifications/assumptions and limiting conditions Oliver Wyman shall not have any liability to any third party in respect of this report or any actions taken or decisions made as a consequence of the results, advice or recommendations set forth herein.
This report does not represent investment advice or provide an opinion regarding the fairness of any transaction to any and all parties. The opinions expressed herein are valid only for the purpose stated herein and as of the date hereof. Information furnished by others, upon which all or portions of this report are based, is believed to be reliable but has not been verified. No warranty is given as to the accuracy of such information. Public information and industry and statistical data are from sources Oliver Wyman deems to be reliable; however, Oliver Wyman makes no representation as to the accuracy or completeness of such information and has accepted the information without further verification. No responsibility is taken for changes in market conditions or laws or regulations and no obligation is assumed to revise this report to reflect changes, events or conditions, which occur subsequent to the date hereof.

Oliver Wyman, Inc.
© 2015 Oliver Wyman. All rights reserved. Oliver Wyman 1166 Avenue of the Americas, 29th floor New York, NY 10036 Tel: 1 (212) 541-8100 Fax: 1 (212) 541-8957 www.oliverwyman.com