Embed Size (px)
Citation preview
Construction and Building Materials 24 (2010) 1967–1974
Contents lists available at ScienceDirect
Construction and Building Materials
journal homepage: www.elsevier .com/locate /conbui ldmat
Post-crack (or post-peak) flexural response and toughness of fiberreinforced concrete after exposure to high temperature
Piti Sukontasukkul a,*, Worachet Pomchiengpin a, Smith Songpiriyakij b
a Department of Civil Engineering, King Mongkut’s University of Technology North Bangkok, 1518 Pibulsongkram Road, Bangsue, Bangkok 10800, Thailandb Department of Technology of Civil Engineering, King Mongkut’s University of Technology North Bangkok, 1518 Pibulsongkram Road, Bangsue, Bangkok 10800, Thailand
a r t i c l e i n f o
Article history:Received 25 January 2010Received in revised form 17 March 2010Accepted 1 April 2010Available online 24 April 2010
Keywords:Flexural toughnessPost-crack responseHigh temperatureFiber reinforced concrete
0950-0618/$ - see front matter � 2010 Elsevier Ltd. Adoi:10.1016/j.conbuildmat.2010.04.003
* Corresponding author. Tel.: +66 089 794 9241; faE-mail address: [email protected] (P. Sukontasukk
a b s t r a c t
Several studies have already reported on the various effects of high temperature on the mechanical prop-erties of fiber reinforced concrete (FRC). Some of these effects include changes in; compressive strength,compression toughness and splitting tensile strength. None of the previous studies have investigatedthe changes that might occur on the post-crack flexural response and flexural toughness. Post-crack (orpeak) response and toughness is considered one of FRC’s key beneficial characteristics – as the purposeof adding fibers is to increase the energy absorption and load carrying capacity after an initial crack. In thisstudy, the flexural toughness test according to ASTM C1018 was carried out on two types of concrete: plainconcrete and fiber reinforced concrete with three different types of fiber (steel, polypropylene, and poly-ethylene) at 0.5% and 1.0% by volume fractions. Prior to the flexural test, the specimens were put in an ovenchamber and subjected to high temperatures using the ISO/TR834 standards of: 400 �C, 600 �C and 800 �C.The results showed the typical load–deflection response of FRC was a double-peak response. The first peakrepresented the properties of concrete matrix and the second peak represented the properties of the fibersused. Under flexural load, instead of dropping (or remaining unchanged), the post-peak load and thetoughness were found to increase at lower temperatures (400 �C) and later, decreased as the temperatureincreased (600 �C and 800 �C). Fiber type and content also played an important role. At a temperature of400 �C, all FRCs exhibited higher flexural strength and increased post-peak response and toughness. A sig-nificant decrease in strength, toughness and load–deflection response was observed with synthetic orplastic FRC (PFRC) when the temperature approached 800 �C. When steel FRC (SFRC) was used, thoseeffects were relatively small. It appears, SFRC has better heat resistance than the PFRC. The density (mea-sured by ultrasonic pulse velocity) was found to decrease more in the PFRC than in the SFRC.
� 2010 Elsevier Ltd. All rights reserved.
1. Introduction
Concrete has been well known as a low cost building materialwith high strength and versatility. Though high in compressivestrength, concrete is quite brittle with a tensile strength of only10% of its compressive strength [1]. Another way to improveconcrete’s brittleness is to mix short fibers into concrete (fiberreinforced concrete, FRC). Short natural fibers, such as horse hair,hay and straw have been used for centuries to reinforce brittlematerials. Commercial fibers were first developed during the early1900’s using wire and metal clips. The earliest research into FRCdate back to the 1960’s [2,3] and since then extensive researchand development has been carried out [4–8]. Nowadays, fiberscan be extracted from various types of materials such as steel, plas-tic, carbon and glass and used in a variety of applications such asindustrial floor, tunneling, precast wall and shotcrete.
ll rights reserved.
x: +66 2 587 4337.ul).
Exposure to fire or any extreme heat source can have adverseeffects on concretes’ mechanical properties; for plain concrete,changes can occur in the pore structures, cracking and spalling,the destruction of the bond between cement paste and aggregatesand the deterioration of the hardened cement paste [9]. As forcompression strength, changes vary depending on the amountof time of exposure and the level of the temperature. At relativelylow temperatures (300–400 �C), compression strength was foundto remain unchanged [10] and in some cases, slightly increased.This increase is believed to be the result of a hydration reactionbetween leftover un-hydrated cement particles and the free waterinside the concrete. When temperatures approach 300 �C,strength is reduced by about 15–40%. At 550 �C, the compressionstrength decreases to a level of about 55–70% of its original value[11,12]. In addition to the changes in strength, change of color isalso observed. With temperatures between 300 �C and 400 �C thecolor changes from grey to red [13] due to the oxidation of theiron oxide which is present in the aggregate and the cement paste[14].
1968 P. Sukontasukkul et al. / Construction and Building Materials 24 (2010) 1967–1974
In cases of fiber reinforced concrete (FRC), there are studies oncompressive strength, flexural strength and compression tough-ness. For example, Lau and Anson [15] carried out both compres-sion and flexural tests on both plain concrete and 1%SFRC underhigh temperatures ranging between 105 �C and 1200 �C. Their re-sults indicated a decrease in both compressive and flexuralstrength for both the plain and SFRC. However, SFRC was able toresist high temperatures much better than plain concrete – as seenby a much higher residual strength at all temperature levels.
Poon et al. [16] experimented with compression to determinestrength and toughness of SFRC and PPFRC, at temperatures be-tween 200 �C and 800 �C. At temperatures lower than 200 �C, thecompressive strength of both plain and FRC remained unchanged.The strength was found to decrease linearly as the temperature in-creased above 200 �C. As for compression toughness, SFRC wasfound to maintain its energy absorption better than plain concreteeven at the highest temperatures. While, in the case of PFRC, thecompression toughness decreased more rapidly and became lowerthan that of plain concrete at the highest temperature.
Chen and Liub [17] studied the effect of high temperature onthe residual strength and the spalling resistance of hybrid FRC.Their results indicated: Without fiber – the first spalling occurredat temperatures around 400 �C. With fiber – the first spalling didnot occur until temperatures reached 800 �C. These results showthat fibers are able to enhance the spalling resistance of concrete.Peng et al. [18] also studied the spalling resistance of FRC. Their re-sults indicated the PPFRC was able to provide better spalling resis-tance than both plain and SFRC. This was due to the melting ofpolypropylene fiber (at temperatures less than 170 �C) which thencreated air voids spaces and/or allowed moisture to escape.
Even though several studies of FRC under high temperature ex-ist, most used tests which were unable to express the true ability ofFRC. FRC materials, using a single value of strength (i.e., compres-
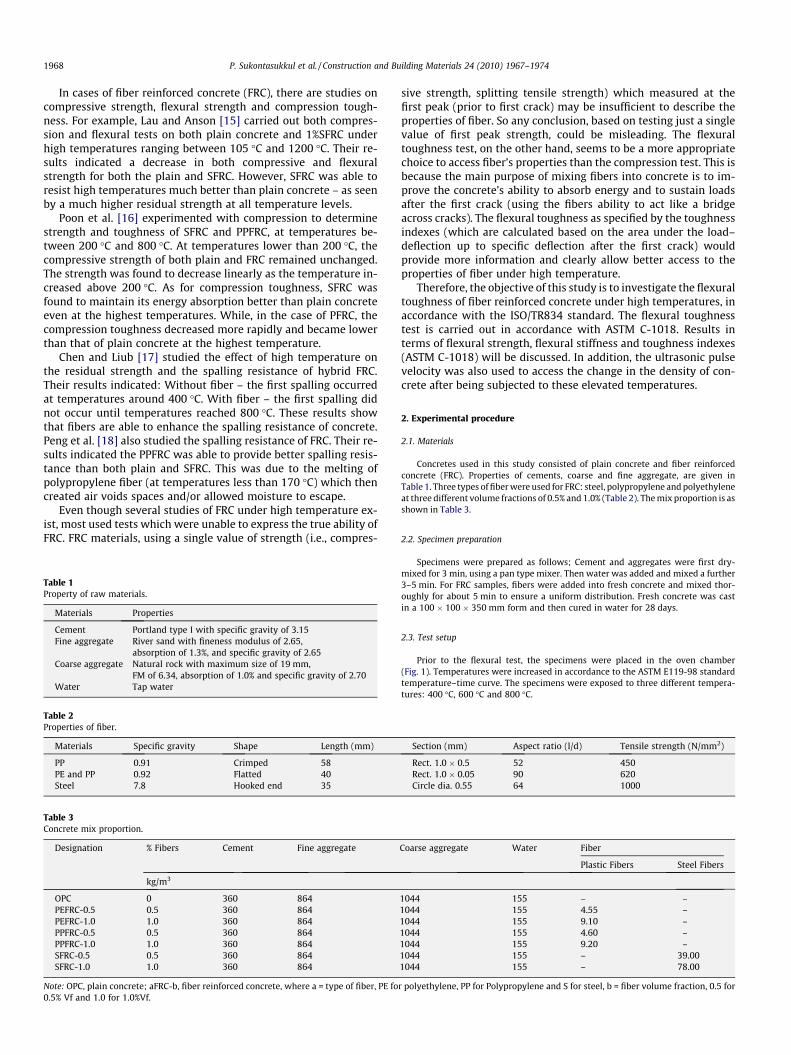
Table 1Property of raw materials.
Materials Properties
Cement Portland type I with specific gravity of 3.15Fine aggregate River sand with fineness modulus of 2.65,
absorption of 1.3%, and specific gravity of 2.65Coarse aggregate Natural rock with maximum size of 19 mm,
FM of 6.34, absorption of 1.0% and specific gravity of 2.70Water Tap water
Table 2Properties of fiber.
Materials Specific gravity Shape Length (mm)
PP 0.91 Crimped 58PE and PP 0.92 Flatted 40Steel 7.8 Hooked end 35
Table 3Concrete mix proportion.
Designation % Fibers Cement Fine aggregate
kg/m3
OPC 0 360 864PEFRC-0.5 0.5 360 864PEFRC-1.0 1.0 360 864PPFRC-0.5 0.5 360 864PPFRC-1.0 1.0 360 864SFRC-0.5 0.5 360 864SFRC-1.0 1.0 360 864
Note: OPC, plain concrete; aFRC-b, fiber reinforced concrete, where a = type of fiber, PE fo0.5% Vf and 1.0 for 1.0%Vf.
sive strength, splitting tensile strength) which measured at thefirst peak (prior to first crack) may be insufficient to describe theproperties of fiber. So any conclusion, based on testing just a singlevalue of first peak strength, could be misleading. The flexuraltoughness test, on the other hand, seems to be a more appropriatechoice to access fiber’s properties than the compression test. This isbecause the main purpose of mixing fibers into concrete is to im-prove the concrete’s ability to absorb energy and to sustain loadsafter the first crack (using the fibers ability to act like a bridgeacross cracks). The flexural toughness as specified by the toughnessindexes (which are calculated based on the area under the load–deflection up to specific deflection after the first crack) wouldprovide more information and clearly allow better access to theproperties of fiber under high temperature.
Therefore, the objective of this study is to investigate the flexuraltoughness of fiber reinforced concrete under high temperatures, inaccordance with the ISO/TR834 standard. The flexural toughnesstest is carried out in accordance with ASTM C-1018. Results interms of flexural strength, flexural stiffness and toughness indexes(ASTM C-1018) will be discussed. In addition, the ultrasonic pulsevelocity was also used to access the change in the density of con-crete after being subjected to these elevated temperatures.
2. Experimental procedure
2.1. Materials
Concretes used in this study consisted of plain concrete and fiber reinforcedconcrete (FRC). Properties of cements, coarse and fine aggregate, are given inTable 1. Three types of fiber were used for FRC: steel, polypropylene and polyethyleneat three different volume fractions of 0.5% and 1.0% (Table 2). The mix proportion is asshown in Table 3.
2.2. Specimen preparation
Specimens were prepared as follows; Cement and aggregates were first dry-mixed for 3 min, using a pan type mixer. Then water was added and mixed a further3–5 min. For FRC samples, fibers were added into fresh concrete and mixed thor-oughly for about 5 min to ensure a uniform distribution. Fresh concrete was castin a 100 � 100 � 350 mm form and then cured in water for 28 days.
2.3. Test setup
Prior to the flexural test, the specimens were placed in the oven chamber(Fig. 1). Temperatures were increased in accordance to the ASTM E119-98 standardtemperature–time curve. The specimens were exposed to three different tempera-tures: 400 �C, 600 �C and 800 �C.
Section (mm) Aspect ratio (l/d) Tensile strength (N/mm2)
Rect. 1.0 � 0.5 52 450Rect. 1.0 � 0.05 90 620Circle dia. 0.55 64 1000
Coarse aggregate Water Fiber
Plastic Fibers Steel Fibers
1044 155 – –1044 155 4.55 –1044 155 9.10 –1044 155 4.60 –1044 155 9.20 –1044 155 – 39.001044 155 – 78.00
r polyethylene, PP for Polypropylene and S for steel, b = fiber volume fraction, 0.5 for
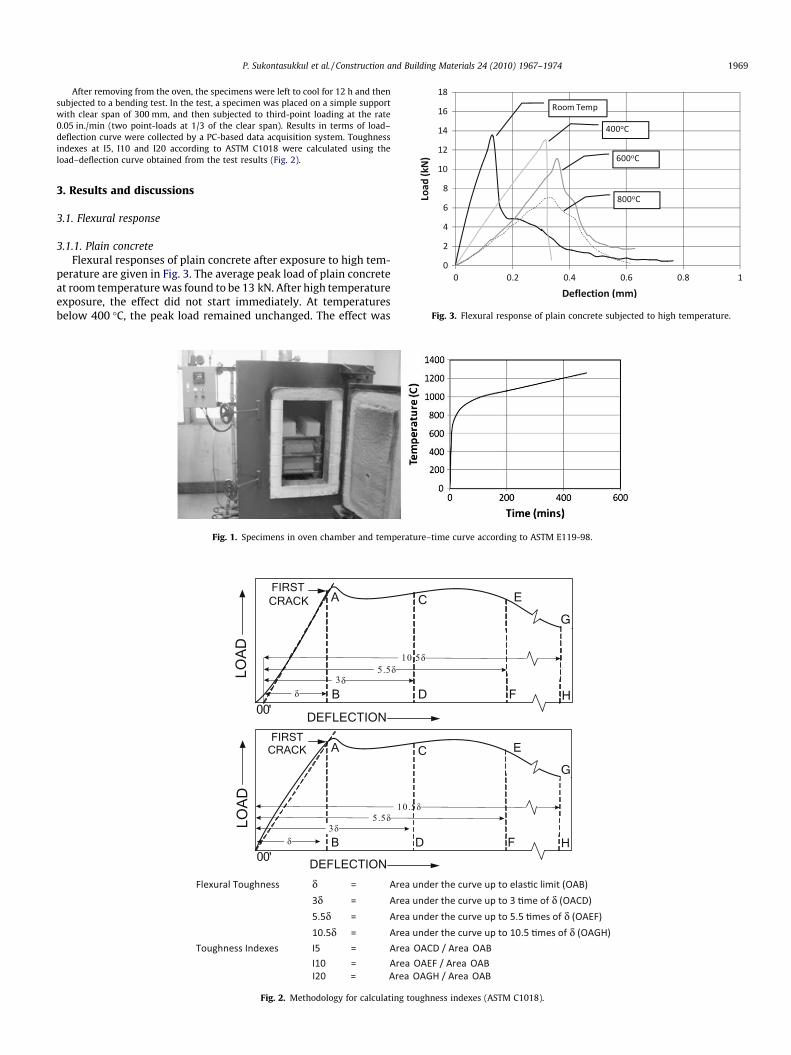
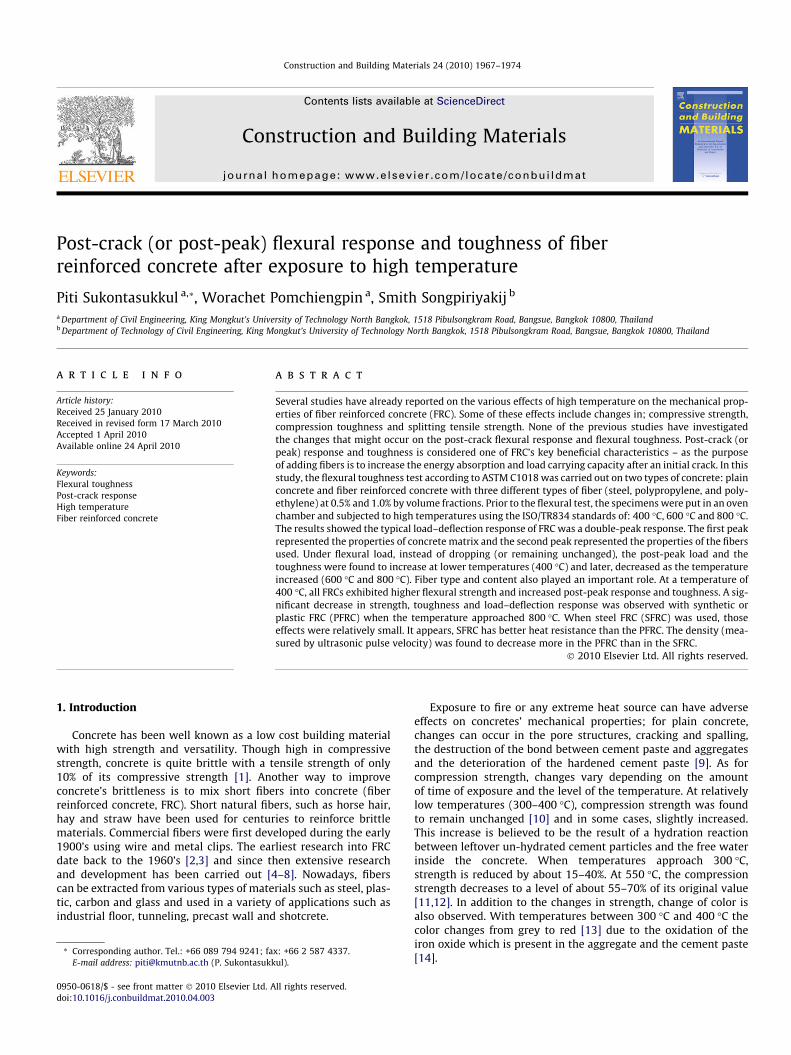
Fig. 3. Flexural response of plain concrete subjected to high temperature.
P. Sukontasukkul et al. / Construction and Building Materials 24 (2010) 1967–1974 1969
After removing from the oven, the specimens were left to cool for 12 h and thensubjected to a bending test. In the test, a specimen was placed on a simple supportwith clear span of 300 mm, and then subjected to third-point loading at the rate0.05 in./min (two point-loads at 1/3 of the clear span). Results in terms of load–deflection curve were collected by a PC-based data acquisition system. Toughnessindexes at I5, I10 and I20 according to ASTM C1018 were calculated using theload–deflection curve obtained from the test results (Fig. 2).
3. Results and discussions
3.1. Flexural response
3.1.1. Plain concreteFlexural responses of plain concrete after exposure to high tem-
perature are given in Fig. 3. The average peak load of plain concreteat room temperature was found to be 13 kN. After high temperatureexposure, the effect did not start immediately. At temperaturesbelow 400 �C, the peak load remained unchanged. The effect was
Fig. 1. Specimens in oven chamber and temperature–time curve according to ASTM E119-98.
Fig. 2. Methodology for calculating toughness indexes (ASTM C1018).
1970 P. Sukontasukkul et al. / Construction and Building Materials 24 (2010) 1967–1974
more pronounced with temperatures above 400 �C as seen by thedecreasing percentage of 24% and 45% at 600 �C and 800 �C, respec-tively. Besides strength, the slope of the load–deflection curvedecreased as temperatures were increased. This indicated the stiff-ness of the beam was also affected by the increase temperature.The decrease in strength and stiffness was perhaps due to cracksoccurring inside the concrete due to the differing coefficients ofthermal expansion between the aggregate and cement paste.
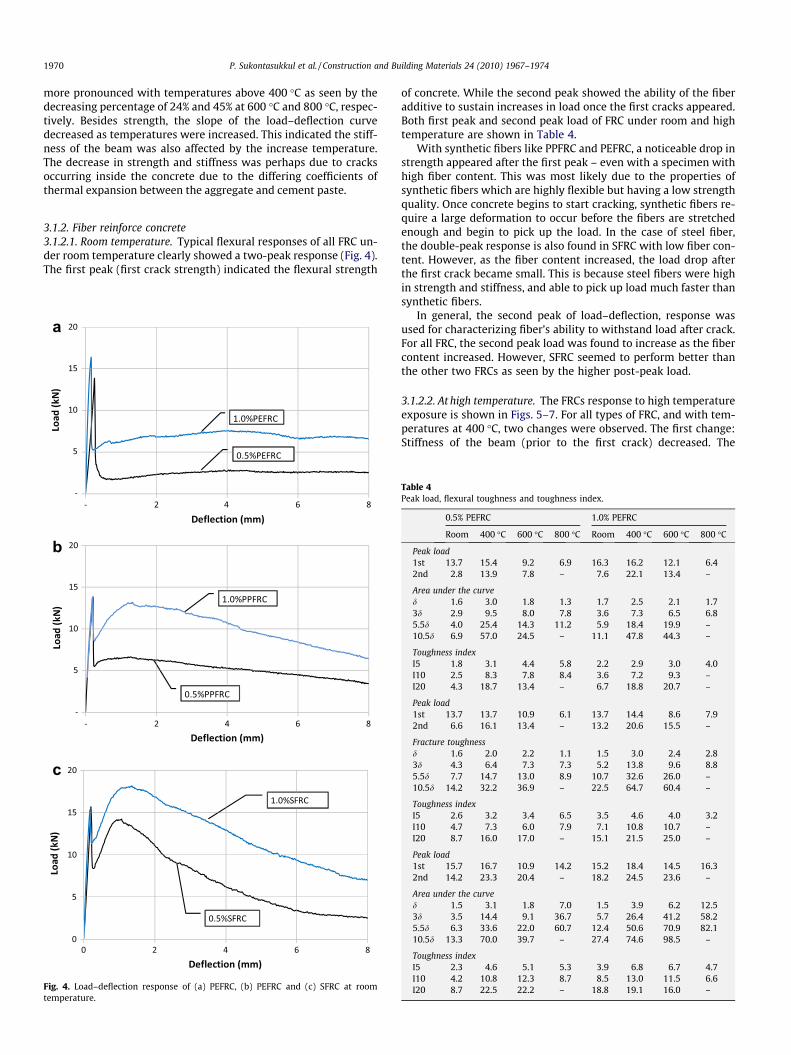
3.1.2. Fiber reinforce concrete3.1.2.1. Room temperature. Typical flexural responses of all FRC un-der room temperature clearly showed a two-peak response (Fig. 4).The first peak (first crack strength) indicated the flexural strength
a
b
c
Fig. 4. Load–deflection response of (a) PEFRC, (b) PEFRC and (c) SFRC at roomtemperature.
of concrete. While the second peak showed the ability of the fiberadditive to sustain increases in load once the first cracks appeared.Both first peak and second peak load of FRC under room and hightemperature are shown in Table 4.
With synthetic fibers like PPFRC and PEFRC, a noticeable drop instrength appeared after the first peak – even with a specimen withhigh fiber content. This was most likely due to the properties ofsynthetic fibers which are highly flexible but having a low strengthquality. Once concrete begins to start cracking, synthetic fibers re-quire a large deformation to occur before the fibers are stretchedenough and begin to pick up the load. In the case of steel fiber,the double-peak response is also found in SFRC with low fiber con-tent. However, as the fiber content increased, the load drop afterthe first crack became small. This is because steel fibers were highin strength and stiffness, and able to pick up load much faster thansynthetic fibers.
In general, the second peak of load–deflection, response wasused for characterizing fiber’s ability to withstand load after crack.For all FRC, the second peak load was found to increase as the fibercontent increased. However, SFRC seemed to perform better thanthe other two FRCs as seen by the higher post-peak load.
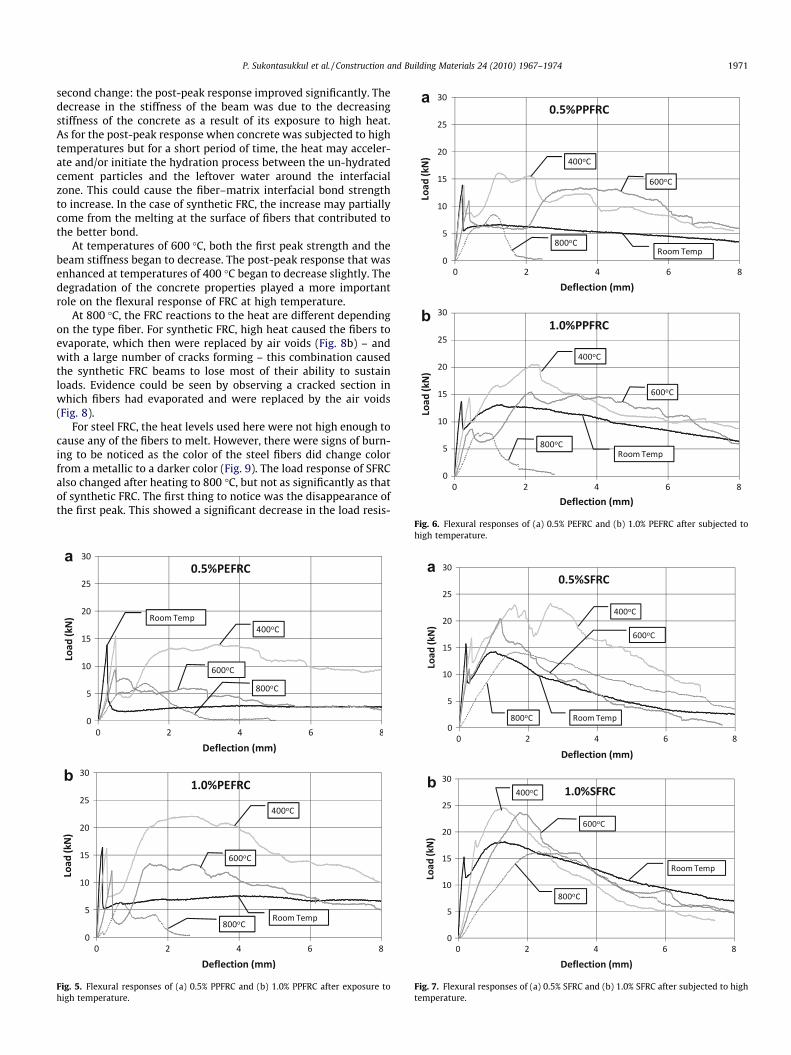
3.1.2.2. At high temperature. The FRCs response to high temperatureexposure is shown in Figs. 5–7. For all types of FRC, and with tem-peratures at 400 �C, two changes were observed. The first change:Stiffness of the beam (prior to the first crack) decreased. The
Table 4Peak load, flexural toughness and toughness index.
0.5% PEFRC 1.0% PEFRC
Room 400 �C 600 �C 800 �C Room 400 �C 600 �C 800 �C
Peak load1st 13.7 15.4 9.2 6.9 16.3 16.2 12.1 6.42nd 2.8 13.9 7.8 – 7.6 22.1 13.4 –
Area under the curved 1.6 3.0 1.8 1.3 1.7 2.5 2.1 1.73d 2.9 9.5 8.0 7.8 3.6 7.3 6.5 6.85.5d 4.0 25.4 14.3 11.2 5.9 18.4 19.9 –10.5d 6.9 57.0 24.5 – 11.1 47.8 44.3 –
Toughness indexI5 1.8 3.1 4.4 5.8 2.2 2.9 3.0 4.0I10 2.5 8.3 7.8 8.4 3.6 7.2 9.3 –I20 4.3 18.7 13.4 – 6.7 18.8 20.7 –
Peak load1st 13.7 13.7 10.9 6.1 13.7 14.4 8.6 7.92nd 6.6 16.1 13.4 – 13.2 20.6 15.5 –
Fracture toughnessd 1.6 2.0 2.2 1.1 1.5 3.0 2.4 2.83d 4.3 6.4 7.3 7.3 5.2 13.8 9.6 8.85.5d 7.7 14.7 13.0 8.9 10.7 32.6 26.0 –10.5d 14.2 32.2 36.9 – 22.5 64.7 60.4 –
Toughness indexI5 2.6 3.2 3.4 6.5 3.5 4.6 4.0 3.2I10 4.7 7.3 6.0 7.9 7.1 10.8 10.7 –I20 8.7 16.0 17.0 – 15.1 21.5 25.0 –
Peak load1st 15.7 16.7 10.9 14.2 15.2 18.4 14.5 16.32nd 14.2 23.3 20.4 – 18.2 24.5 23.6 –
Area under the curved 1.5 3.1 1.8 7.0 1.5 3.9 6.2 12.53d 3.5 14.4 9.1 36.7 5.7 26.4 41.2 58.25.5d 6.3 33.6 22.0 60.7 12.4 50.6 70.9 82.110.5d 13.3 70.0 39.7 – 27.4 74.6 98.5 –
Toughness indexI5 2.3 4.6 5.1 5.3 3.9 6.8 6.7 4.7I10 4.2 10.8 12.3 8.7 8.5 13.0 11.5 6.6I20 8.7 22.5 22.2 – 18.8 19.1 16.0 –
a
b
P. Sukontasukkul et al. / Construction and Building Materials 24 (2010) 1967–1974 1971
second change: the post-peak response improved significantly. Thedecrease in the stiffness of the beam was due to the decreasingstiffness of the concrete as a result of its exposure to high heat.As for the post-peak response when concrete was subjected to hightemperatures but for a short period of time, the heat may acceler-ate and/or initiate the hydration process between the un-hydratedcement particles and the leftover water around the interfacialzone. This could cause the fiber–matrix interfacial bond strengthto increase. In the case of synthetic FRC, the increase may partiallycome from the melting at the surface of fibers that contributed tothe better bond.
At temperatures of 600 �C, both the first peak strength and thebeam stiffness began to decrease. The post-peak response that wasenhanced at temperatures of 400 �C began to decrease slightly. Thedegradation of the concrete properties played a more importantrole on the flexural response of FRC at high temperature.
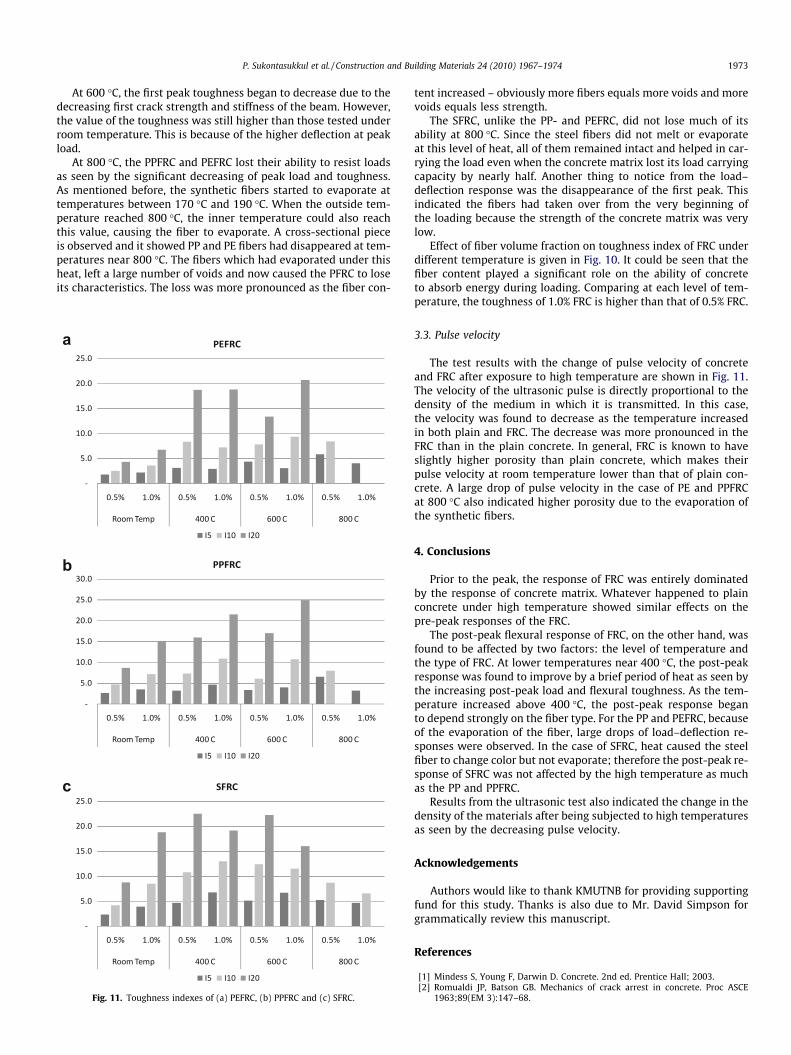
At 800 �C, the FRC reactions to the heat are different dependingon the type fiber. For synthetic FRC, high heat caused the fibers toevaporate, which then were replaced by air voids (Fig. 8b) – andwith a large number of cracks forming – this combination causedthe synthetic FRC beams to lose most of their ability to sustainloads. Evidence could be seen by observing a cracked section inwhich fibers had evaporated and were replaced by the air voids(Fig. 8).
For steel FRC, the heat levels used here were not high enough tocause any of the fibers to melt. However, there were signs of burn-ing to be noticed as the color of the steel fibers did change colorfrom a metallic to a darker color (Fig. 9). The load response of SFRCalso changed after heating to 800 �C, but not as significantly as thatof synthetic FRC. The first thing to notice was the disappearance ofthe first peak. This showed a significant decrease in the load resis-
a
b
Fig. 5. Flexural responses of (a) 0.5% PPFRC and (b) 1.0% PPFRC after exposure tohigh temperature.
Fig. 6. Flexural responses of (a) 0.5% PEFRC and (b) 1.0% PEFRC after subjected tohigh temperature.
a
b
ig. 7. Flexural responses of (a) 0.5% SFRC and (b) 1.0% SFRC after subjected to high
F temperature.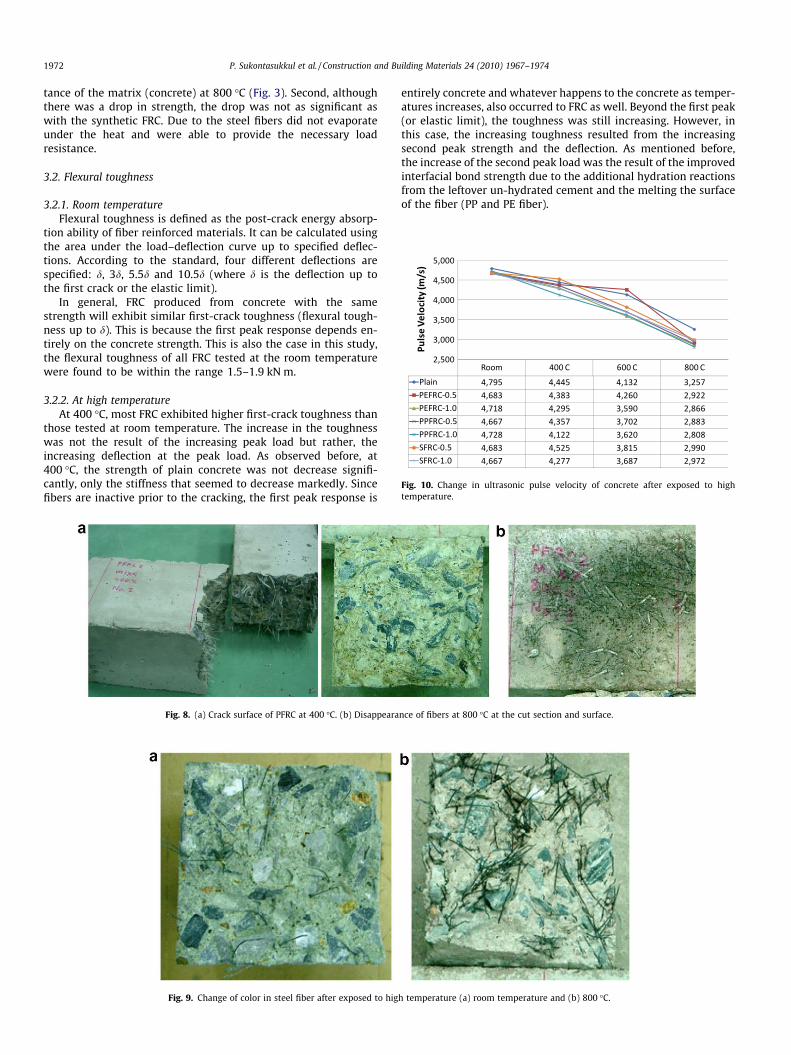
Fig. 10. Change in ultrasonic pulse velocity of concrete after exposed to hightemperature.
1972 P. Sukontasukkul et al. / Construction and Building Materials 24 (2010) 1967–1974
tance of the matrix (concrete) at 800 �C (Fig. 3). Second, althoughthere was a drop in strength, the drop was not as significant aswith the synthetic FRC. Due to the steel fibers did not evaporateunder the heat and were able to provide the necessary loadresistance.
3.2. Flexural toughness
3.2.1. Room temperatureFlexural toughness is defined as the post-crack energy absorp-
tion ability of fiber reinforced materials. It can be calculated usingthe area under the load–deflection curve up to specified deflec-tions. According to the standard, four different deflections arespecified: d, 3d, 5.5d and 10.5d (where d is the deflection up tothe first crack or the elastic limit).
In general, FRC produced from concrete with the samestrength will exhibit similar first-crack toughness (flexural tough-ness up to d). This is because the first peak response depends en-tirely on the concrete strength. This is also the case in this study,the flexural toughness of all FRC tested at the room temperaturewere found to be within the range 1.5–1.9 kN m.
3.2.2. At high temperatureAt 400 �C, most FRC exhibited higher first-crack toughness than
those tested at room temperature. The increase in the toughnesswas not the result of the increasing peak load but rather, theincreasing deflection at the peak load. As observed before, at400 �C, the strength of plain concrete was not decrease signifi-cantly, only the stiffness that seemed to decrease markedly. Sincefibers are inactive prior to the cracking, the first peak response is
Fig. 8. (a) Crack surface of PFRC at 400 �C. (b) Disappeara
Fig. 9. Change of color in steel fiber after exposed to hig
entirely concrete and whatever happens to the concrete as temper-atures increases, also occurred to FRC as well. Beyond the first peak(or elastic limit), the toughness was still increasing. However, inthis case, the increasing toughness resulted from the increasingsecond peak strength and the deflection. As mentioned before,the increase of the second peak load was the result of the improvedinterfacial bond strength due to the additional hydration reactionsfrom the leftover un-hydrated cement and the melting the surfaceof the fiber (PP and PE fiber).
nce of fibers at 800 �C at the cut section and surface.
h temperature (a) room temperature and (b) 800 �C.
P. Sukontasukkul et al. / Construction and Building Materials 24 (2010) 1967–1974 1973
At 600 �C, the first peak toughness began to decrease due to thedecreasing first crack strength and stiffness of the beam. However,the value of the toughness was still higher than those tested underroom temperature. This is because of the higher deflection at peakload.
At 800 �C, the PPFRC and PEFRC lost their ability to resist loadsas seen by the significant decreasing of peak load and toughness.As mentioned before, the synthetic fibers started to evaporate attemperatures between 170 �C and 190 �C. When the outside tem-perature reached 800 �C, the inner temperature could also reachthis value, causing the fiber to evaporate. A cross-sectional pieceis observed and it showed PP and PE fibers had disappeared at tem-peratures near 800 �C. The fibers which had evaporated under thisheat, left a large number of voids and now caused the PFRC to loseits characteristics. The loss was more pronounced as the fiber con-
a
b
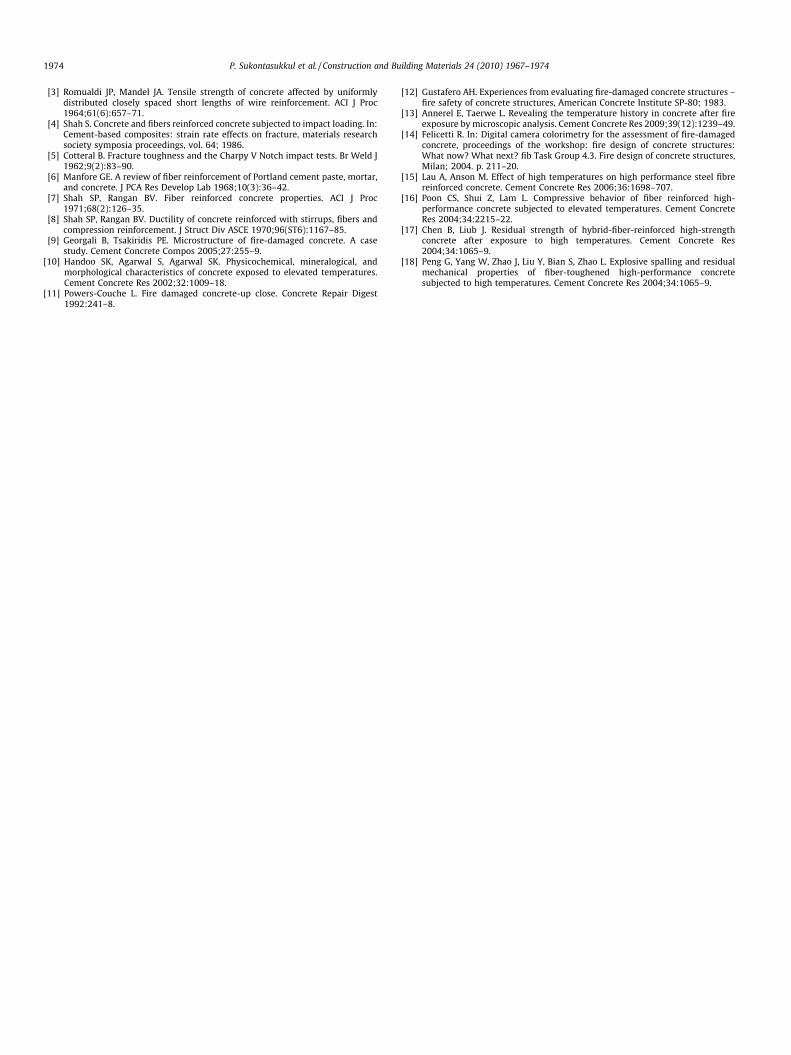
c
Fig. 11. Toughness indexes of (a) PEFRC, (b) PPFRC and (c) SFRC.
tent increased – obviously more fibers equals more voids and morevoids equals less strength.
The SFRC, unlike the PP- and PEFRC, did not lose much of itsability at 800 �C. Since the steel fibers did not melt or evaporateat this level of heat, all of them remained intact and helped in car-rying the load even when the concrete matrix lost its load carryingcapacity by nearly half. Another thing to notice from the load–deflection response was the disappearance of the first peak. Thisindicated the fibers had taken over from the very beginning ofthe loading because the strength of the concrete matrix was verylow.
Effect of fiber volume fraction on toughness index of FRC underdifferent temperature is given in Fig. 10. It could be seen that thefiber content played a significant role on the ability of concreteto absorb energy during loading. Comparing at each level of tem-perature, the toughness of 1.0% FRC is higher than that of 0.5% FRC.
3.3. Pulse velocity
The test results with the change of pulse velocity of concreteand FRC after exposure to high temperature are shown in Fig. 11.The velocity of the ultrasonic pulse is directly proportional to thedensity of the medium in which it is transmitted. In this case,the velocity was found to decrease as the temperature increasedin both plain and FRC. The decrease was more pronounced in theFRC than in the plain concrete. In general, FRC is known to haveslightly higher porosity than plain concrete, which makes theirpulse velocity at room temperature lower than that of plain con-crete. A large drop of pulse velocity in the case of PE and PPFRCat 800 �C also indicated higher porosity due to the evaporation ofthe synthetic fibers.
4. Conclusions
Prior to the peak, the response of FRC was entirely dominatedby the response of concrete matrix. Whatever happened to plainconcrete under high temperature showed similar effects on thepre-peak responses of the FRC.
The post-peak flexural response of FRC, on the other hand, wasfound to be affected by two factors: the level of temperature andthe type of FRC. At lower temperatures near 400 �C, the post-peakresponse was found to improve by a brief period of heat as seen bythe increasing post-peak load and flexural toughness. As the tem-perature increased above 400 �C, the post-peak response beganto depend strongly on the fiber type. For the PP and PEFRC, becauseof the evaporation of the fiber, large drops of load–deflection re-sponses were observed. In the case of SFRC, heat caused the steelfiber to change color but not evaporate; therefore the post-peak re-sponse of SFRC was not affected by the high temperature as muchas the PP and PPFRC.
Results from the ultrasonic test also indicated the change in thedensity of the materials after being subjected to high temperaturesas seen by the decreasing pulse velocity.
Acknowledgements
Authors would like to thank KMUTNB for providing supportingfund for this study. Thanks is also due to Mr. David Simpson forgrammatically review this manuscript.
References
[1] Mindess S, Young F, Darwin D. Concrete. 2nd ed. Prentice Hall; 2003.[2] Romualdi JP, Batson GB. Mechanics of crack arrest in concrete. Proc ASCE
1963;89(EM 3):147–68.
1974 P. Sukontasukkul et al. / Construction and Building Materials 24 (2010) 1967–1974
[3] Romualdi JP, Mandel JA. Tensile strength of concrete affected by uniformlydistributed closely spaced short lengths of wire reinforcement. ACI J Proc1964;61(6):657–71.
[4] Shah S. Concrete and fibers reinforced concrete subjected to impact loading. In:Cement-based composites: strain rate effects on fracture, materials researchsociety symposia proceedings, vol. 64; 1986.
[5] Cotteral B. Fracture toughness and the Charpy V Notch impact tests. Br Weld J1962;9(2):83–90.
[6] Manfore GE. A review of fiber reinforcement of Portland cement paste, mortar,and concrete. J PCA Res Develop Lab 1968;10(3):36–42.
[7] Shah SP, Rangan BV. Fiber reinforced concrete properties. ACI J Proc1971;68(2):126–35.
[8] Shah SP, Rangan BV. Ductility of concrete reinforced with stirrups, fibers andcompression reinforcement. J Struct Div ASCE 1970;96(ST6):1167–85.
[9] Georgali B, Tsakiridis PE. Microstructure of fire-damaged concrete. A casestudy. Cement Concrete Compos 2005;27:255–9.
[10] Handoo SK, Agarwal S, Agarwal SK. Physicochemical, mineralogical, andmorphological characteristics of concrete exposed to elevated temperatures.Cement Concrete Res 2002;32:1009–18.
[11] Powers-Couche L. Fire damaged concrete-up close. Concrete Repair Digest1992:241–8.
[12] Gustafero AH. Experiences from evaluating fire-damaged concrete structures –fire safety of concrete structures, American Concrete Institute SP-80; 1983.
[13] Annerel E, Taerwe L. Revealing the temperature history in concrete after fireexposure by microscopic analysis. Cement Concrete Res 2009;39(12):1239–49.
[14] Felicetti R. In: Digital camera colorimetry for the assessment of fire-damagedconcrete, proceedings of the workshop: fire design of concrete structures:What now? What next? fib Task Group 4.3. Fire design of concrete structures,Milan; 2004. p. 211–20.
[15] Lau A, Anson M. Effect of high temperatures on high performance steel fibrereinforced concrete. Cement Concrete Res 2006;36:1698–707.
[16] Poon CS, Shui Z, Lam L. Compressive behavior of fiber reinforced high-performance concrete subjected to elevated temperatures. Cement ConcreteRes 2004;34:2215–22.
[17] Chen B, Liub J. Residual strength of hybrid-fiber-reinforced high-strengthconcrete after exposure to high temperatures. Cement Concrete Res2004;34:1065–9.
[18] Peng G, Yang W, Zhao J, Liu Y, Bian S, Zhao L. Explosive spalling and residualmechanical properties of fiber-toughened high-performance concretesubjected to high temperatures. Cement Concrete Res 2004;34:1065–9.