Embed Size (px)
Citation preview

Post Consolidation Estimates of ACH Scale Economies, Technical Change and Cost
Efficiency
Paul W. Bauer, Economic Advisor, and
Patrick Higgins, Research Assistant
Federal Reserve Bank of Cleveland

Summary
•Using data through 2000, we find that the ACH cost function still exhibits both scale economies and rapid technical change
•There are some signs that the technology may be maturing as the rate of technical change appears to have slowed
•Scale economies still appears to exist far beyond the current range of output
•These findings have important implications for Reserve Banks that are facing increasing competition from private sector providers.

ACH system is a value-dated electronic funds transfer system
• The principal participants in an ACH transaction are the customer initiating the transaction, that customer’s bank, the bank of the party who is paying or receiving funds, that party, and the ACH processor
• Either credit transfers or debit transfers may be made using an ACH system
• With credit transfers, such as payroll, the payor’s bank initiates the transfer

ACH Characteristics, cont.
• The funds received by the payee’s bank are generally provisional until the morning of the business day following the settlement day, which is one or two days after the ACH payment is processed
• With debit transfers, the payee’s depository institution initiates the transfer.
• A relatively new use of ACH has been the processing of one-time payments, such as the checks that merchants truncate at the point-of-sale or, occasionally, as “e-checks” for internet transactions

ACH Selling Points
• The payor knows exactly when the funds will be removed from his account, and likewise the payee knows exactly when the funds will be deposited to his account
• ACH transactions offer convenience, particularly for recurring payments, because a paper check need not be written, delivered, and cashed
• The total costs to all parties are much cheaper for ACH transactions than for paper checks.
• There can be accounting efficiencies for payors and payees that track invoices electronically

Market Conditions
• For many years, the Federal Reserve had a near monopoly in the ACH market, but those days may be gone
• Competition from private sector operators is expected to provide much more intense competition for ACH transactions in the coming years
• Currently, private sector operators have about 12 percent of the inter-bank ACH market

Market Conditions, cont.
• Pricing to meet the competition is critically important for the ACH service because about 80 percent of FedACH origination volumes come from the 50 largest originating institutions
• Given this high concentration of originations the loss of just a few of them would result in a significant loss in volume
• Receipt volumes are less at risk because they are more evenly spread among various endpoints. The largest 50 institutions account for only 27 percent of receipts, and it takes the largest 300 FedACH customers to get to 50 percent of total receipts

A cost function approach is selected because cost minimization is a better assumption for Reserve Banks’ behavioral objective than profit maximization
• Under the MCA of 1980, the Reserve Banks are required to recover their costs of providing financial services that also have private sector competition
• The costs recovered must include not only the actual production costs, but also a set of imputed costs called the “private sector adjustment factor” (PSAF) that includes financing costs, return on capital, taxes, and certain other expenses that would be incurred if a private business firm provided the service
• Although the Reserve Banks must price their services to recover actual costs plus PSAF, our cost functions only model actual activity production costs

Translog Cost Function
,v+u+YR+
wy
ww1/2w+
)y(1/2+y+=C
itijj
T
Tj=
kitityk
K
=1k
jitkitkj
K
j=1
K
=1k
kitk
K
=1k
2ityyity0it
+
+
10
lnln
lnlnln
lnlnln

Hybrid-translog Cost Function
,v+u+YR+
wy
zzz
zzz
ww1/2w+
)y(1/2+y+=C
itijj
T
Tj=
kitityk
K
=1k
ititit
ititit
jitkitkj
K
j=1
K
=1k
kitk
K
=1k
2ityyity0it
+
+
1
321
321
0
lnln
lnlnln
)3sin()2sin()sin(
)3cos()2cos()cos(
lnlnln

Unit Cost Decomposition
y
)vu)exp(w,yC(-
y
)vuexp( )w,yC(=
)y/ C(
)y/ C(
i
i iiiii lnlnln
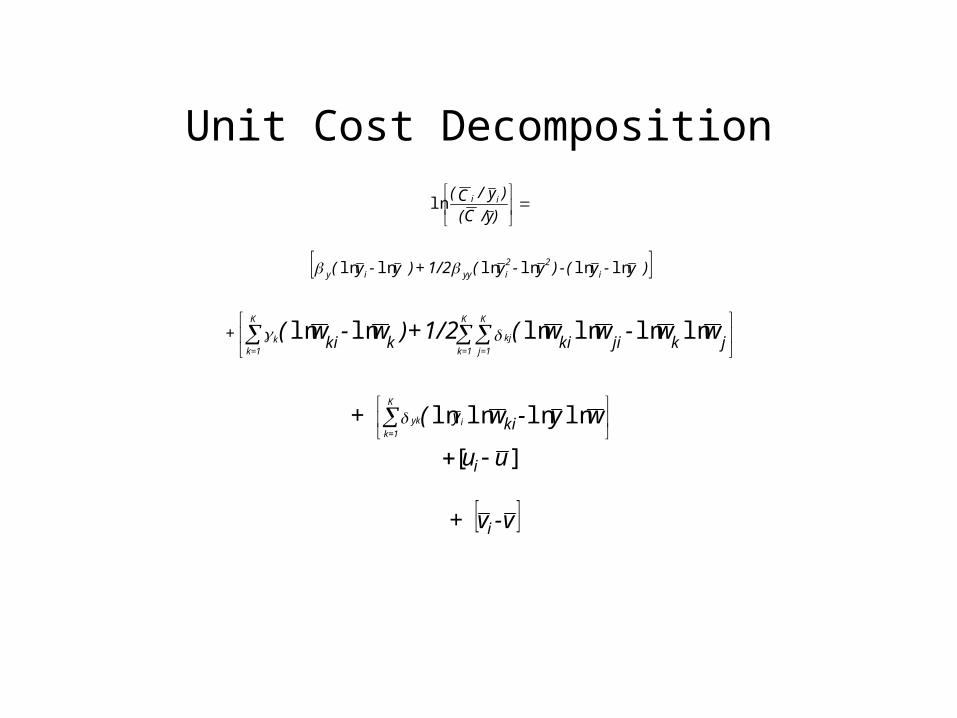
Unit Cost Decomposition
v-v +
uu
wy-w( +
ww-ww(1/2+)w-w(
i
i
kiy
jkjikikki +
)y-y(-)y-y(1/2 + )y-y(
)y/ C(
)y/ C(
iyk
K
=1k
kj
K
j=1
K
=1kk
K
=1k
i22
iyyiy
ii
][
lnlnlnln
lnlnlnlnlnln
lnlnlnlnlnln
ln

Estimation Techniques
• The GLS technique assumes that that the inefficiency terms are independent of the other regressors
• The Within technique includes a set of dummy variables for the various sites in order to allow for the possibility that relative site efficiencies are correlated with the other regressors

Characteristics in Common
• To increase statistical efficiency, we estimate the cost function jointly with input share equations that are derived using Shephard’s Lemma and the relevant cost function
• We impose the usual symmetry and linear homogeneity in input prices required by economic theory

Characteristics in Common, cont.
• Both techniques use the longitudinal aspect of the data and avoid assuming a specific distribution for the inefficiency term by using repeated observations over time to identify firm-specific, time-invariant inefficiencies
• Iterative seemingly unrelated regression techniques are used to estimate the system of cost and input share equations

Data Sources
• PACS
• BEA price indices for various subcomponents
• BLS ACCRA cost of living indices
• RS Means building costs
• Moody’s Aaa corporate bond rate

Data
• One output, number of ACH transactions
• Four inputs, Labor (18.3%), Building (2.4%), Materials (48%, and Communications (31.4%)
• Full sample 1990 to 2000, quarterly data

Our output measure is the number of ACH payments originated and received rather than the site-specific measure used in previous studies that employed the number of payments processed at each site
• The pre-1996 definition includes 1/3 of addemdum records, additional information about the transaction increasingly used in electronic data interchange, whereas the latter one does not.
• Also, with this definition, inter-District items get counted more than once because each District “processes” the item

We construct an output series for the entire period in two steps because there is the additional wrinkle that neither definition of output was collected in 1996, the year when most of the accounting changes were being implemented
• First, we have data on originations for 1996, just not receipts
• We assume that the ratio of originations to receipts is roughly constant from 1997 to 1996 and use their ratio from 1997 to obtain an estimate of 1996 receipts

Second, To extend the current definition of output back to the 1990 to 1995 period, we assume that the ratio of addendum items/total items and the ratio of inter-District/total items are relatively constant over this period
• If this is the case, then first definition = constant x second definition
• To estimate this constant, we use data from 1990 to 1995 to forecast the old definition of output for 1996 and use data from 1996 to 2000 to forecast the new definition of output for 1995

This gives us two years, 8 quarters of observations, with overlapping estimates of the two output definitions. For each site we take the average ratio of the old to the new definition of output and use that estimate of the constant to convert that site’s output from 1990 to 1995 to the new definition of output

Input Aggregation
• For labor, the task is relatively easy, have man hours and expenditure on personnel, so we can easily construct a measure of the price of labor
• For the other three inputs, use a technique developed by Severin-Lossin that combines the desirable features of the Caves, Christiansen and Diewert (1982) index and the TT index

A Quick Look at the Raw Data

Figure 1, TotalACH Volume
0
200
400
600
800
1000
1200
1400
1990 1991 1992 1993 1994 1995 1996 1997 1998 1999 2000
Year

Figure 2, ACH Unit Costs
0.0000.0050.0100.0150.0200.0250.0300.0350.0400.045
1990 1992 1994 1996 1998 2000
Year
$ p
er t
ran
sact
ion

Empirical Results

Figure 3, Estimates of Technical Change
0
0.2
0.40.6
0.8
1
1.2
1990 1992 1994 1996 1998 2000Year
Ind
ex
GLS-T-YDGLS-H-YDWithin-T-YDWithin-H-YD

Figure 4: Estimated ACH Average Cost Function
0
0.005
0.01
0.015
0.02
0.025
50,000 50,050,000 100,050,000 150,050,000 200,050,000
Items Processed
Avera
ge C
ost
GLS-H
GLS-T
Within/translog
Within/hybrid-translog
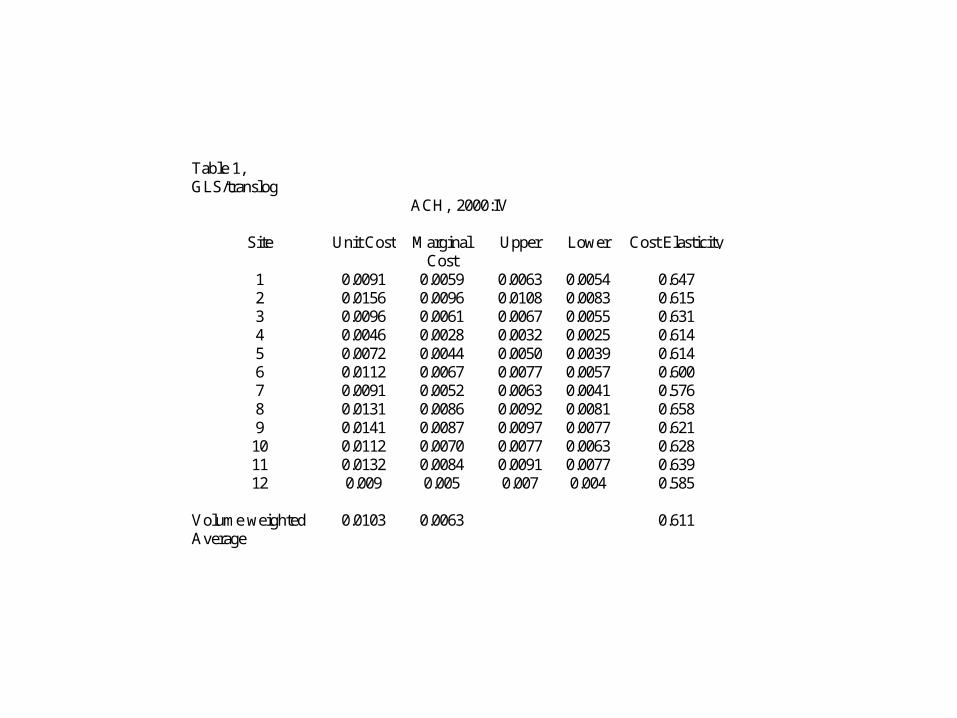
Table 1,GLS/translog
ACH, 2000:IV
Site Unit Cost MarginalCost
Upper Lower Cost Elasticity
1 0.0091 0.0059 0.0063 0.0054 0.6472 0.0156 0.0096 0.0108 0.0083 0.6153 0.0096 0.0061 0.0067 0.0055 0.6314 0.0046 0.0028 0.0032 0.0025 0.6145 0.0072 0.0044 0.0050 0.0039 0.6146 0.0112 0.0067 0.0077 0.0057 0.6007 0.0091 0.0052 0.0063 0.0041 0.5768 0.0131 0.0086 0.0092 0.0081 0.6589 0.0141 0.0087 0.0097 0.0077 0.621
10 0.0112 0.0070 0.0077 0.0063 0.62811 0.0132 0.0084 0.0091 0.0077 0.63912 0.009 0.005 0.007 0.004 0.585
Volume weightedAverage
0.0103 0.0063 0.611

Table 2, Within/translog ACH, Average 2000:IV
Site Unit Cost Marginal Cost Upper Lower Cost Elasticity1 0.0091 0.0023 0.0034 0.0013 0.2562 0.0156 0.0029 0.0050 0.0008 0.1843 0.0096 0.0022 0.0033 0.0010 0.2244 0.0046 0.0009 0.0015 0.0003 0.1875 0.0072 0.0013 0.0023 0.0004 0.1886 0.0112 0.0018 0.0034 0.0002 0.1587 0.0091 0.0009 0.0024 -0.0005 0.104
8 0.0131 0.0037 0.0051 0.0023 0.2829 0.0141 0.0028 0.0046 0.0010 0.20210 0.0112 0.0024 0.0038 0.0010 0.21611 0.0132 0.0031 0.0047 0.0016 0.23912 0.0091 0.0011 0.0035 -0.0012 0.124
Volume weighted Average 0.0103 0.0019 0.180

Figure 5, Cost Efficiency Estimates
0.0
0.2
0.4
0.6
0.8
1.0
1.2
1 2 3 4 5 6 7 8 9 10 11 12
Processing Site
Ind
ex
GLS-T-YD
GLS-H=YD
Within-T-YD
Bauer and Ferrier
Within-H-YD

Table 3, Unit Cost Decomposition, GLS/translogLogarithmic Differences from Sample Mean
Cost Total Direct Effect ofProcessing Site Unit Cost
($)Unit Cost Efficiency Output Input
PriceInteractio
nss1 0.0195 -0.041 -0.192 0.107 0.045 -0.001s2 0.0291 0.360 0.286 -0.006 0.080 0.000s3 0.0184 -0.095 -0.206 0.119 -0.009 0.000s4 0.0170 -0.179 -0.194 0.033 -0.017 0.000s5 0.0186 -0.089 -0.061 -0.001 -0.027 0.000s6 0.0150 -0.299 -0.100 -0.170 -0.028 -0.001s7 0.0173 -0.159 0.082 -0.248 0.007 0.000s8 0.0271 0.289 0.121 0.202 -0.035 0.001s9 0.0225 0.104 0.035 0.092 -0.024 0.000
s10 0.0220 0.083 0.077 0.018 -0.013 0.000s11 0.0267 0.273 0.206 0.077 -0.011 0.000s12 0.0159 -0.246 -0.054 -0.224 0.032 0.000
Average over 1990:I to 2000:IV

Table 4, Unit Cost Decomposition, Within/translogLogarithmic Differences from Sample Mean
Cost Total Direct Effect ofProcessing Site Unit Cost
($)Unit Cost Efficiency Output Input
PriceInteractio
nss1 0.0195 -0.041 -0.360 0.226 0.045 -0.001s2 0.0291 0.360 0.334 -0.012 0.080 0.000s3 0.0184 -0.095 -0.359 0.251 -0.009 0.000s4 0.0170 -0.179 -0.236 0.070 -0.017 0.000s5 0.0186 -0.089 -0.053 -0.003 -0.027 0.000s6 0.0150 -0.299 0.128 -0.359 -0.027 -0.001s7 0.0173 -0.159 0.332 -0.524 0.007 0.000s8 0.0271 0.289 -0.135 0.427 -0.035 0.002s9 0.0225 0.104 -0.077 0.195 -0.024 0.000
s10 0.0220 0.083 0.082 0.039 -0.013 0.000s11 0.0267 0.273 0.118 0.163 -0.011 0.000s12 0.0159 -0.246 0.226 -0.473 0.032 0.000
Average over 1990:I to 2000:IV

Conclusions
• We find evidence for large scale economies, so in the face of increasing competition, retaining volume is necessary to hold unit costs, and hence prices, down
• We also found the rate of technical change to be very rapid after consolidation in mid-1990s, but it appears to have slowed since 1998, suggesting that further efforts at consolidation should be considered