Embed Size (px)
Citation preview
ORIGINAL PAPER
Post-acclimation transcriptome adjustment is a majorfactor in freezing tolerance of winter wheat
Daniel Z. Skinner
Received: 4 March 2009 /Revised: 23 April 2009 /Accepted: 12 May 2009 /Published online: 2 June 2009# Springer-Verlag 2009
Abstract Cold-acclimated winter wheat plants were slowlyfrozen to −10°C, and then the temperature was eithermaintained at −10°C or was lowered further to −12°C.Expression levels of a total of 423 genes were significantlyaltered in these treatments; genes upregulated outnumberedthose downregulated by about a 9:1 ratio. Sixty-eight geneswere upregulated at least fivefold in all freezing treatments;17 of these 68 encoded transcription factors including C-repeat binding factor (Cbf), WRKY, or other Zn-fingerproteins, indicating strong upregulation of genes involvedin transcription regulation. Sixteen of the 68 highlyupregulated genes encoded kinases, phosphatases, calciumtrafficking-related proteins, or glycosyltransferases, indicat-ing upregulation of genes involved in signal transduction.Six genes encoding chlorophyll a/b binding-like proteinswere upregulated uniquely in response to the -12°Ctreatment, suggesting a protective role of pigment-bindingproteins in freezing stress response. Most genes respondedsimilarly in the very freezing tolerant cultivar Norstar andin the moderately freezing tolerant Tiber, but some genesresponded in opposite fashion in the two cultivars. Theseresults showed that wheat crowns actively adapt as thetemperature declines to potentially damaging levels, andgenetic variation for this ability exists among cultivars.
Keywords Cold acclimation . DNA array .
Freezing tolerance . Hardiness . Transcriptome
Introduction
Wheat (Triticum aestivum L.) supplies about 20% of thefood calories for the world’s population and is a staple inmany countries. The per capita consumption of wheat in theUSA exceeds that of any other single food source(Anonymous 2002). Each year, millions of kilograms ofpotential grain yield fail to materialize because of variousstress factors that impact the growth and maturation of theplants. One of the most significant stresses is coldtemperature and freezing conditions. In a historical surveyof wheat crop losses in the Midwestern USA in the years1956 to 1988, it was reported that the percentage of winterwheat fields that were not harvested due to winterkillaveraged 7% over the 33-year period with a high of 22.2%(Patterson et al. 1990). For decades, plant breeders haveworked to improve the cold tolerance of winter wheat but,according to the University of Saskatchewan winter wheatproduction manual, “…since 1929, the total world breedingeffort has achieved little or no increase in the winterhardiness of available cultivars…” (Fowler 2002).
The ability of wheat plants to survive freezing iscontingent on the effectiveness of two processes, coldacclimation and freezing stress response. Cold acclimation(Thomashow 1999) is a relatively slow, adaptive responseof plants to mild cold stress (e.g., +3°C) that results in aplethora of physiological responses that greatly enhancetolerance to more severe conditions (e.g., −15°C). Freezingstress response, as used in this report, refers to responses ofpreviously cold-acclimated plants to those “more severeconditions.” Cold acclimation involves the transcriptionalresponse of at least 450 genes in wheat (Monroy et al.2007) probably located in all of the chromosomes (Fowleret al. 2005). While cold acclimation of cereal grain plants atlow, above freezing temperatures results in large increases
Funct Integr Genomics (2009) 9:513–523DOI 10.1007/s10142-009-0126-y
Electronic supplementary material The online version of this article(doi:10.1007/s10142-009-0126-y) contains supplementary material,which is available to authorized users.
D. Z. Skinner (*)USDA-ARS and Department of Crop and Soil Sciences,Washington State University,Pullman, WA 99164, USAe-mail: [email protected]
in cold tolerance, it has been shown that further improve-ment of cold tolerance may be realized by furtheracclimation at nonfatal subfreezing temperatures, a processknown as “second phase of hardening” (Livingston 1996)or “subzero acclimation” (Herman et al. 2006). Herman etal. (2006) found that, in wheat plants that had been coldacclimated at +3°C for 3 weeks, then exposed to −3°C for6 h to 3 days, the level of freezing tolerance increased bymore than 2°C, concomitant with significant changes inthe messenger RNA (mRNA) expression levels ofhundreds of genes. Hence, the exposure of cold acclimatedcereal plants to 24 h of −3°C resulted in adaptive changesthat conferred improved freezing tolerance, and thisadaptation involved broad changes in the transcriptome(Herman et al. 2006). There may be further adaptiveresponses as the temperature declines further, but nothingis known of transcriptomic changes that may occur as thetemperature declines to potentially damaging levels. If theplants actively adapt as the temperature declines, genesinvolved in transcription regulation and signal transduc-tion would be expected to respond strongly, because rapidand precise regulation of expression of freezing stressresponse genes would be necessary. Other key genesinvolved in freezing stress response, such as thoseencoding cold responsive proteins or osmoprotectants,would also be expected to respond.
The hypothesis motivating this research was that wheatplants actively adjust the transcriptome during the freezingprocess. Information on transcriptomic changes will pro-vide clues about the mechanisms that are used by the plantsto effect response to subfreezing temperatures as theyoccur, after cold acclimation has taken place. Therefore, theobjective of this research was to elucidate the transcrip-tomic changes that occurred in previously cold acclimatedwinter wheat plants as the temperature declined topotentially damaging levels.
Experimental
Plant material and freezing treatment
The winter wheat cultivars Norstar (Grant 1980) and Tiber(Kisha et al. 1992) were studied. The LT50, the temperatureexpected to be fatal to 50% of the plants, has been reportedas about −19°C for Norstar (Limin and Fowler 2006) andabout −13°C for Tiber (Skinner et al. 2005). Norstar andTiber are hard red winter wheat cultivars but appear to haveno commonality in their pedigrees. Norstar was derivedfrom a cross of Winalta and Alabaskaya (Grant 1980),while Tiber is a selection from Redwin (Kisha et al. 1992).Redwin does not have Winalta or Alabaskaya in itspedigree (Kisha et al. 1992).
Seeds were sown into SunshineMix LC1 planting medium(Sun Gro Horticulture, Bellevue, WA, USA) in six-containerpacks (Model 1020, Blackmore Co., Belleville, MI, USA).Seeds were germinated and seedlings grown at 22°C in agrowth chamber (Model E15, Conviron, Pembina, ND, USA)under cool white fluorescent lights (about 300 µmol m−2 s−1
at the soil surface) with a 16-h photoperiod until theseedlings reached the three-leaf stage. The plants were thentransferred to 3°C with an 8-h photoperiod (about 250 µmolm−2 s−1 at mid-plant height) for 4 weeks to induce coldacclimation. Plants were irrigated weekly with nutrientsolution containing macro and micronutrients (Peters Profes-sional, Scotts Co., Camarillo, CA, USA).
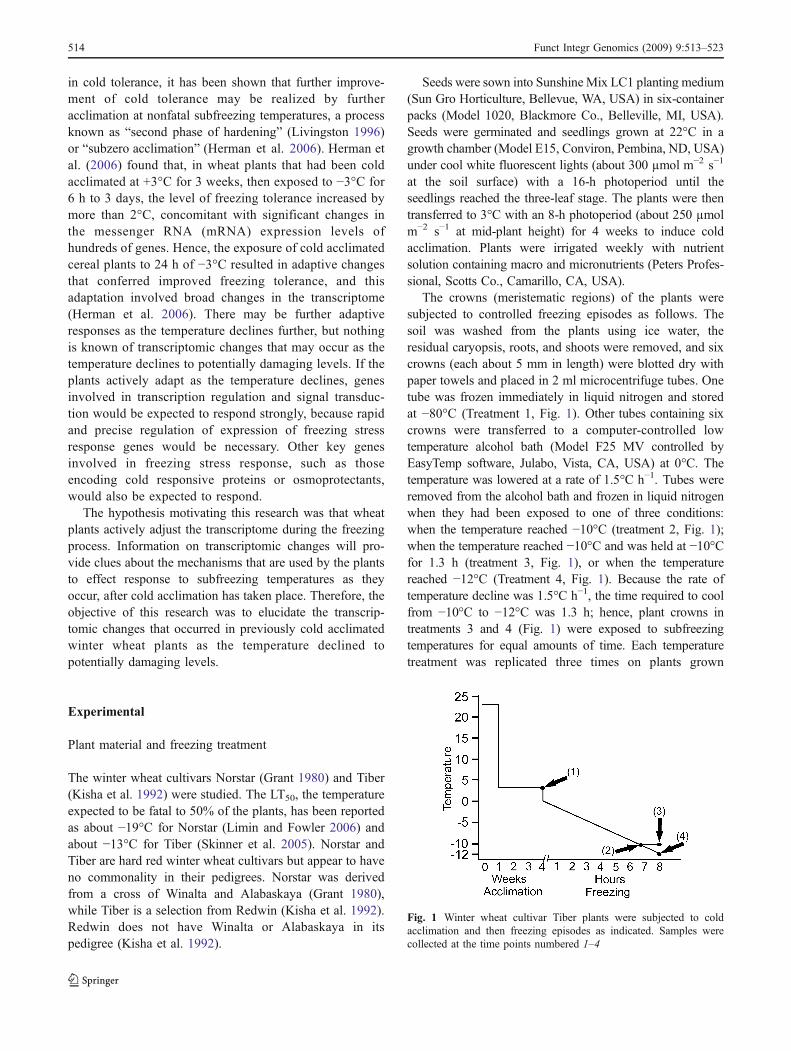
The crowns (meristematic regions) of the plants weresubjected to controlled freezing episodes as follows. Thesoil was washed from the plants using ice water, theresidual caryopsis, roots, and shoots were removed, and sixcrowns (each about 5 mm in length) were blotted dry withpaper towels and placed in 2 ml microcentrifuge tubes. Onetube was frozen immediately in liquid nitrogen and storedat −80°C (Treatment 1, Fig. 1). Other tubes containing sixcrowns were transferred to a computer-controlled lowtemperature alcohol bath (Model F25 MV controlled byEasyTemp software, Julabo, Vista, CA, USA) at 0°C. Thetemperature was lowered at a rate of 1.5°C h−1. Tubes wereremoved from the alcohol bath and frozen in liquid nitrogenwhen they had been exposed to one of three conditions:when the temperature reached −10°C (treatment 2, Fig. 1);when the temperature reached −10°C and was held at −10°Cfor 1.3 h (treatment 3, Fig. 1), or when the temperaturereached −12°C (Treatment 4, Fig. 1). Because the rate oftemperature decline was 1.5°C h−1, the time required to coolfrom −10°C to −12°C was 1.3 h; hence, plant crowns intreatments 3 and 4 (Fig. 1) were exposed to subfreezingtemperatures for equal amounts of time. Each temperaturetreatment was replicated three times on plants grown
Fig. 1 Winter wheat cultivar Tiber plants were subjected to coldacclimation and then freezing episodes as indicated. Samples werecollected at the time points numbered 1–4
514 Funct Integr Genomics (2009) 9:513–523
independently at different times. Samples were stored at−80°C. A duplicate set of tubes with the roots removed fromthe plants and the shoots trimmed to about 2-cm length wasincluded with two of the trials to determine whether thetemperature treatments were fatal to the plants. These plantswere removed from the freezing bath, allowed to thawovernight on ice, then planted into moist Vermiculite inclosed plastic boxes, and incubated at 25°C with a 16-h photoperiod. Plants were assessed for survival after 5 days.
RNA extraction and microarray interrogation
To extract RNA, the six plant crowns that had been frozenin liquid nitrogen and stored at −80°C were homogenizedin liquid nitrogen using a mortar and pestle; RNA wasextracted using 1.5 ml of Trizol reagent and the standardprotocol (Invitrogen, Carlsbad, CA, USA). RNA wasquantified with UV spectrophotometry and stored at −80°C. About 40 μg RNAwas recovered from six plant crowns.
Global gene expression levels were assayed with theGeneChip® Wheat Genome Array (Affymetrix, SantaClara, CA, USA). This array contains 61,127 probe setsrepresenting 55,052 transcripts for all 42 wheat chromo-somes (http://www.affymetrix.com). RNA labeling andhybridization to the Affymetrix arrays and post-hybridization scanning and data pre-processing was con-ducted by the Washington State University BiotechnologyCore Facility. Three independent sets of RNA samples wereanalyzed for each temperature treatment (total of 12microarray chips). The data files were further analyzedusing “Flexarray” software (Blazejczyk et al. 2007). Themicroarray data were normalized using the “robust multi-chip average” method, and probe sets showing significantdifferences in hybridization intensity among treatmentswere sought using the empirical Bayes analysis due toWright and Simon (algorithm EB Wright & Simon)available in the Flexarray software. The GenBank identi-fiers of the sequences that the probe sets were designed toidentify were obtained from the GeneChip information fileprovided by Affymetrix. Tentative functions of genes ofinterest were sought through BLASTN searches of theGenBank nonredundant database (http://blast.ncbi.nlm.nih.gov). In the event the BLASTN algorithm returned onlygenes of unknown function, translated searches (BLASTXand TBLASTX) were also performed. Genes with nosignificant match to GenBank entries were also used asqueries in BLASTN searches of the TIGR plant database(http://www.tigr.org).
Quantitative real-time PCR
Quantitative real-time PCR (qPCR) was used to confirmexpression level changes of selected genes. The Protoscript
II kit (New England Biolabs, Ipswich, MA, USA) was usedto synthesize complementary DNA (cDNA). The cDNAsynthesis reactions were initiated with 1 µg RNA that hadbeen treated with RNase-free DNase I (Ambion, Austin,TX, USA) according to the manufacturer’s protocol andwere primed with the anchored oligo dT primers providedin the Protoscript II kit. Synthesis was according to themanufacturers’ protocol, except that the reactions wereallowed to proceed for 100 min instead of 60 min. Thecompleted 20 µl cDNA syntheses were diluted to 50 µlwith nuclease-free water and stored at −20°C. This templatecDNA was diluted 1:10 prior to use, and 1 µl of theresulting solution was used as template for qPCR. ThePCRs were conducted on an Applied Biosystems (FosterCity, CA USA) 7300 Real-Time PCR System using 25-µlpreparations that consisted of 1× Go-Tag® Colorless MasterMix (Promega, Madison, WI, USA), 1 µl cDNA, 200 µMeach primer, 0.85× SYBR Green I (Invitrogen, Carlsbad,CA, USA), and 300 nM ROX dye (Roche, Indianapolis,IN, USA) as a passive fluorescence standard. The qPCRsoftware available with the instrument was used todetermine the Ct, the fractional cycle number at which thefluorescence intensity reached an arbitrary threshold, usingthe threshold determined by the software. Relative foldchange was determined using the delta–delta Ct method asdescribed by Dussault and Pouliot (2006) using the Cbf1Bgene amplicon resulting from the primers described byVagujfalvi et al. (2005) as an endogenous control. TheseCbf1B primers result in amplification of fragments ofmultiple Cbf genes (Vagujfalvi et al. 2005). In thetemperature treatments used in the current study, the resultof that amplification was very uniform across treatments(see Supplementary Figure 1S) and was used as a constant-expression benchmark. Downregulation was expressed asthe negative reciprocal of the fractional fold change asrecommended (Jankowska et al. 2008; Turtinen et al. 2005).
Primers for quantification of CBF gene expression werethose described by Vagujfalvi et al. (2005). Primers forother genes assayed with qPCR were designed using theonline tool BatchPrimer3 (http://probes.pw.usda.gov/cgi-bin/batchprimer3/batchprimer3.cgi) and are shown inTable 1. An amplicon length of about 100 bp and primermelting temperatures of about 60°C were specified. ThePCR amplification profile was 3 min at 95°C, then 55cycles of 95°C for 30 s, 55°C for 25 s, and 72°C for 30 s. Adissociation curve was generated for each primer pair toconfirm that a single PCR product was generated. Productsof each primer pair also were assayed on a 1% agarose gel(Seakem LE, FMC Corp., Philadelphia, PA, USA) at leastonce to again confirm that a single product had beengenerated. Primer pairs that resulted in amplification ofmultiple products were discarded. Each qPCR assay wasrepeated three times.
Funct Integr Genomics (2009) 9:513–523 515
Results
All of the plants that had been frozen in each of thetemperature treatments and then allowed to recover pro-duced robust leaf growth after 5 days, indicating that theRNA used in this study was extracted from crowns ofplants that were still alive.
Global transcriptome changes in response to freezingtreatments
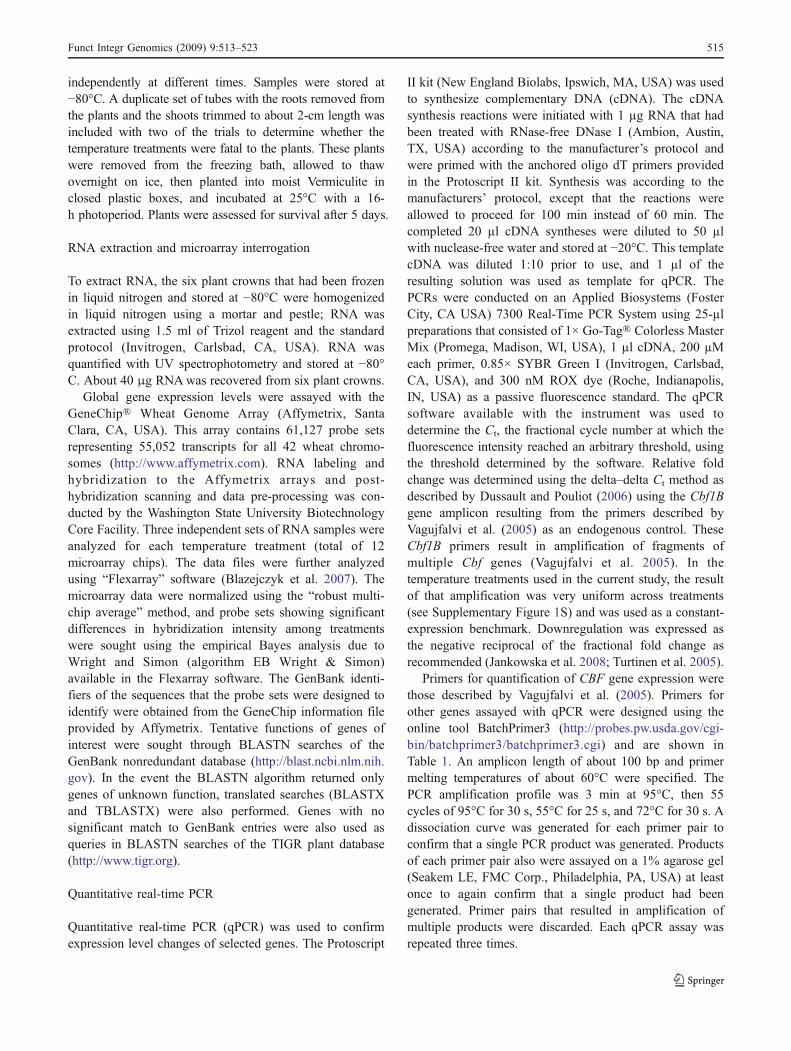
The principal component analysis of the Affymetrix micro-array data revealed that tremendous gene expressionchanges occurred in the crowns of the plants as they werecooled to −10°C, and more changes occurred in the plantsas they were held at −10°C for 1.3 h. Somewhat different
expression changes occurred as the plants were furthercooled to −12°C (Fig. 2). Relative to the control (treatment1, Fig. 1), a total of 423 genes changed expression level atleast twofold (statistically significant at P< 0.05) during thethree freezing treatments. Within each treatment, thenumbers of genes that changed expression level were asfollows. As the crowns were cooled from 0°C to −10°C at1.5°C h−1 (Treatment 2, Fig. 1), 344 genes were upregu-lated and 39 were downregulated. In the crowns that werecooled to −10°C and then held at −10° for 1.3 h (treatment3, Fig. 1), 298 genes were upregulated and 33 weredownregulated, suggesting that at least 46 genes that wereupregulated as the temperature declined to −10°Cwere reducedin expression as the plants were held at −10°C for 1.3 h andthat three genes that had been downregulated as thetemperature declined increased expression as the plants
Table 1 Genes and primers used in quantitative real-time PCR to assay expression levels in wheat plants exposed to three freezing conditions
Probe seta basis (GenBank accession) Sequences of primers used for qPCR
Forward Reverse
BQ172277 TCTAGCGGTCCTTTGCTTGT CGGAGCTCAAGGTGAAAGAG
CA614891 GCGCGTCGTAGGTTTAGTTT TTTTGGGACGGATGGAGTAG
CA623997 AAGAATCCGTGCAAAAGCAT CCAGTGCACAAGTCGTTGTC
CA626272 TTCCCTCTTCCATCACCAAC CTCGCATTTGATGTCCTCCT
CA666957 TTTAGTCCCCCTTGGAGCTT GAACTTGCAGGCATGTATCG
CA674427 ACCCATGCACACATCCATAA TGTAGTAAAAACGCGCCAAA
CA692019 CCTACGGGGAGAACCTCTTC CCGTGGTCGTAGTACTGCTT
CK211276 ACCAAACAGCCTCACCAAAC AACTCGAGGTGATCCACTGC
CK212505 ATGCGTTGTTGTTGACTGGA TTCTCCATGTTCGGCTTCTT
CK216032 GAGAAAAGCTAGCGCAGGAA AGACACAGCAACGCAACATC
a Probe set used in the Affymetrix GeneChip® Wheat Genome Array
Fig. 2 Principal componentanalysis plot of transcriptomeexpression in crown tissue ofwinter wheat cultivar Tiberplants exposed to the indicatedfreezing conditions
516 Funct Integr Genomics (2009) 9:513–523
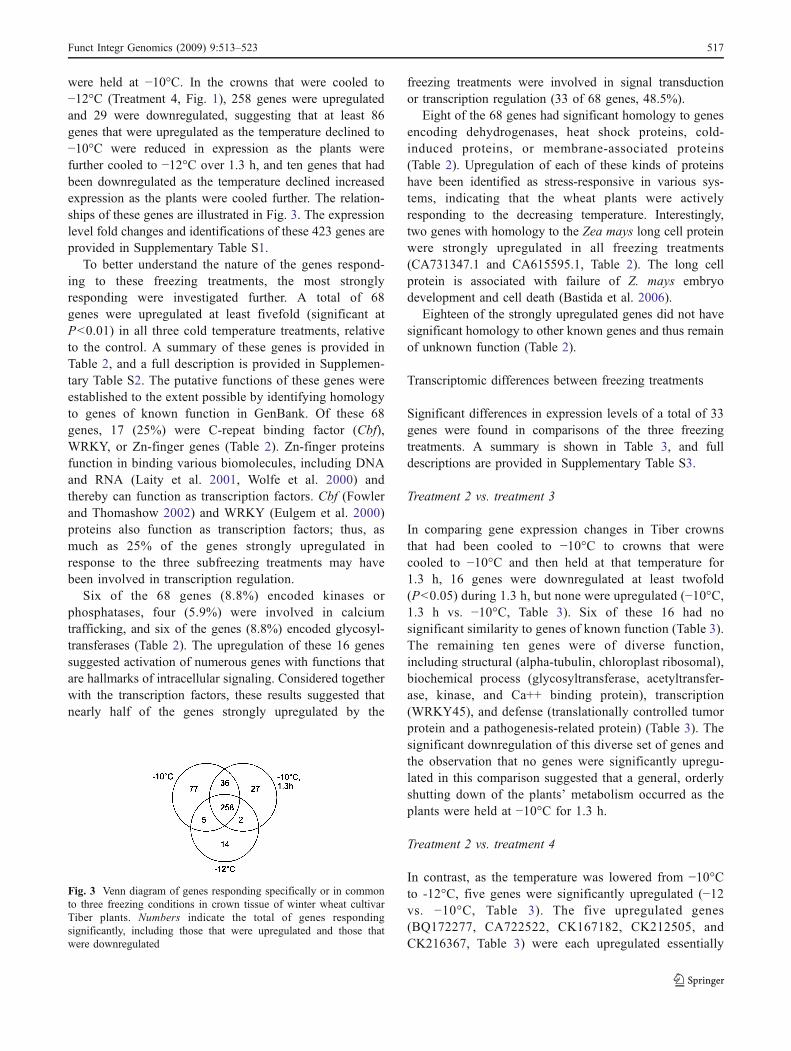
were held at −10°C. In the crowns that were cooled to−12°C (Treatment 4, Fig. 1), 258 genes were upregulatedand 29 were downregulated, suggesting that at least 86genes that were upregulated as the temperature declined to−10°C were reduced in expression as the plants werefurther cooled to −12°C over 1.3 h, and ten genes that hadbeen downregulated as the temperature declined increasedexpression as the plants were cooled further. The relation-ships of these genes are illustrated in Fig. 3. The expressionlevel fold changes and identifications of these 423 genes areprovided in Supplementary Table S1.
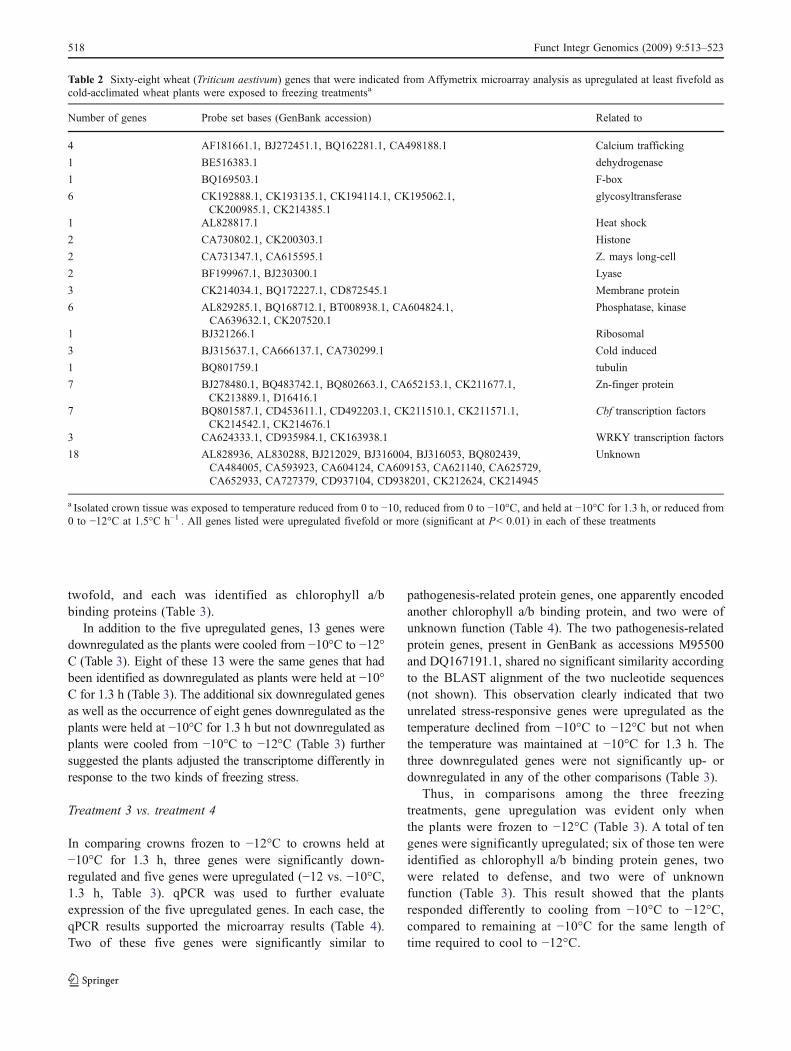
To better understand the nature of the genes respond-ing to these freezing treatments, the most stronglyresponding were investigated further. A total of 68genes were upregulated at least fivefold (significant atP<0.01) in all three cold temperature treatments, relativeto the control. A summary of these genes is provided inTable 2, and a full description is provided in Supplemen-tary Table S2. The putative functions of these genes wereestablished to the extent possible by identifying homologyto genes of known function in GenBank. Of these 68genes, 17 (25%) were C-repeat binding factor (Cbf),WRKY, or Zn-finger genes (Table 2). Zn-finger proteinsfunction in binding various biomolecules, including DNAand RNA (Laity et al. 2001, Wolfe et al. 2000) andthereby can function as transcription factors. Cbf (Fowlerand Thomashow 2002) and WRKY (Eulgem et al. 2000)proteins also function as transcription factors; thus, asmuch as 25% of the genes strongly upregulated inresponse to the three subfreezing treatments may havebeen involved in transcription regulation.
Six of the 68 genes (8.8%) encoded kinases orphosphatases, four (5.9%) were involved in calciumtrafficking, and six of the genes (8.8%) encoded glycosyl-transferases (Table 2). The upregulation of these 16 genessuggested activation of numerous genes with functions thatare hallmarks of intracellular signaling. Considered togetherwith the transcription factors, these results suggested thatnearly half of the genes strongly upregulated by the
freezing treatments were involved in signal transductionor transcription regulation (33 of 68 genes, 48.5%).
Eight of the 68 genes had significant homology to genesencoding dehydrogenases, heat shock proteins, cold-induced proteins, or membrane-associated proteins(Table 2). Upregulation of each of these kinds of proteinshave been identified as stress-responsive in various sys-tems, indicating that the wheat plants were activelyresponding to the decreasing temperature. Interestingly,two genes with homology to the Zea mays long cell proteinwere strongly upregulated in all freezing treatments(CA731347.1 and CA615595.1, Table 2). The long cellprotein is associated with failure of Z. mays embryodevelopment and cell death (Bastida et al. 2006).
Eighteen of the strongly upregulated genes did not havesignificant homology to other known genes and thus remainof unknown function (Table 2).
Transcriptomic differences between freezing treatments
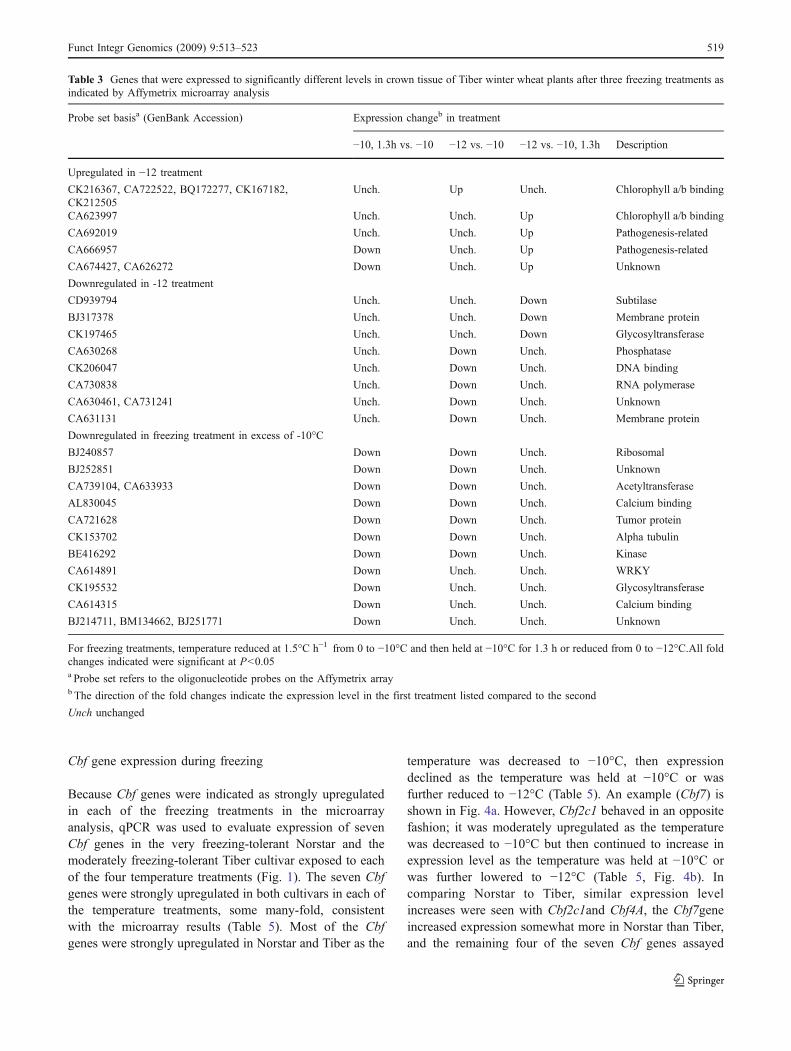
Significant differences in expression levels of a total of 33genes were found in comparisons of the three freezingtreatments. A summary is shown in Table 3, and fulldescriptions are provided in Supplementary Table S3.
Treatment 2 vs. treatment 3
In comparing gene expression changes in Tiber crownsthat had been cooled to −10°C to crowns that werecooled to −10°C and then held at that temperature for1.3 h, 16 genes were downregulated at least twofold(P<0.05) during 1.3 h, but none were upregulated (−10°C,1.3 h vs. −10°C, Table 3). Six of these 16 had nosignificant similarity to genes of known function (Table 3).The remaining ten genes were of diverse function,including structural (alpha-tubulin, chloroplast ribosomal),biochemical process (glycosyltransferase, acetyltransfer-ase, kinase, and Ca++ binding protein), transcription(WRKY45), and defense (translationally controlled tumorprotein and a pathogenesis-related protein) (Table 3). Thesignificant downregulation of this diverse set of genes andthe observation that no genes were significantly upregu-lated in this comparison suggested that a general, orderlyshutting down of the plants’ metabolism occurred as theplants were held at −10°C for 1.3 h.
Treatment 2 vs. treatment 4
In contrast, as the temperature was lowered from −10°Cto -12°C, five genes were significantly upregulated (−12vs. −10°C, Table 3). The five upregulated genes(BQ172277, CA722522, CK167182, CK212505, andCK216367, Table 3) were each upregulated essentially
Fig. 3 Venn diagram of genes responding specifically or in commonto three freezing conditions in crown tissue of winter wheat cultivarTiber plants. Numbers indicate the total of genes respondingsignificantly, including those that were upregulated and those thatwere downregulated
Funct Integr Genomics (2009) 9:513–523 517
twofold, and each was identified as chlorophyll a/bbinding proteins (Table 3).
In addition to the five upregulated genes, 13 genes weredownregulated as the plants were cooled from −10°C to −12°C (Table 3). Eight of these 13 were the same genes that hadbeen identified as downregulated as plants were held at −10°C for 1.3 h (Table 3). The additional six downregulated genesas well as the occurrence of eight genes downregulated as theplants were held at −10°C for 1.3 h but not downregulated asplants were cooled from −10°C to −12°C (Table 3) furthersuggested the plants adjusted the transcriptome differently inresponse to the two kinds of freezing stress.
Treatment 3 vs. treatment 4
In comparing crowns frozen to −12°C to crowns held at−10°C for 1.3 h, three genes were significantly down-regulated and five genes were upregulated (−12 vs. −10°C,1.3 h, Table 3). qPCR was used to further evaluateexpression of the five upregulated genes. In each case, theqPCR results supported the microarray results (Table 4).Two of these five genes were significantly similar to
pathogenesis-related protein genes, one apparently encodedanother chlorophyll a/b binding protein, and two were ofunknown function (Table 4). The two pathogenesis-relatedprotein genes, present in GenBank as accessions M95500and DQ167191.1, shared no significant similarity accordingto the BLAST alignment of the two nucleotide sequences(not shown). This observation clearly indicated that twounrelated stress-responsive genes were upregulated as thetemperature declined from −10°C to −12°C but not whenthe temperature was maintained at −10°C for 1.3 h. Thethree downregulated genes were not significantly up- ordownregulated in any of the other comparisons (Table 3).
Thus, in comparisons among the three freezingtreatments, gene upregulation was evident only whenthe plants were frozen to −12°C (Table 3). A total of tengenes were significantly upregulated; six of those ten wereidentified as chlorophyll a/b binding protein genes, twowere related to defense, and two were of unknownfunction (Table 3). This result showed that the plantsresponded differently to cooling from −10°C to −12°C,compared to remaining at −10°C for the same length oftime required to cool to −12°C.
Table 2 Sixty-eight wheat (Triticum aestivum) genes that were indicated from Affymetrix microarray analysis as upregulated at least fivefold ascold-acclimated wheat plants were exposed to freezing treatmentsa
Number of genes Probe set bases (GenBank accession) Related to
4 AF181661.1, BJ272451.1, BQ162281.1, CA498188.1 Calcium trafficking
1 BE516383.1 dehydrogenase
1 BQ169503.1 F-box
6 CK192888.1, CK193135.1, CK194114.1, CK195062.1,CK200985.1, CK214385.1
glycosyltransferase
1 AL828817.1 Heat shock
2 CA730802.1, CK200303.1 Histone
2 CA731347.1, CA615595.1 Z. mays long-cell
2 BF199967.1, BJ230300.1 Lyase
3 CK214034.1, BQ172227.1, CD872545.1 Membrane protein
6 AL829285.1, BQ168712.1, BT008938.1, CA604824.1,CA639632.1, CK207520.1
Phosphatase, kinase
1 BJ321266.1 Ribosomal
3 BJ315637.1, CA666137.1, CA730299.1 Cold induced
1 BQ801759.1 tubulin
7 BJ278480.1, BQ483742.1, BQ802663.1, CA652153.1, CK211677.1,CK213889.1, D16416.1
Zn-finger protein
7 BQ801587.1, CD453611.1, CD492203.1, CK211510.1, CK211571.1,CK214542.1, CK214676.1
Cbf transcription factors
3 CA624333.1, CD935984.1, CK163938.1 WRKY transcription factors
18 AL828936, AL830288, BJ212029, BJ316004, BJ316053, BQ802439,CA484005, CA593923, CA604124, CA609153, CA621140, CA625729,CA652933, CA727379, CD937104, CD938201, CK212624, CK214945
Unknown
a Isolated crown tissue was exposed to temperature reduced from 0 to −10, reduced from 0 to −10°C, and held at −10°C for 1.3 h, or reduced from0 to −12°C at 1.5°C h−1 . All genes listed were upregulated fivefold or more (significant at P< 0.01) in each of these treatments
518 Funct Integr Genomics (2009) 9:513–523
Cbf gene expression during freezing
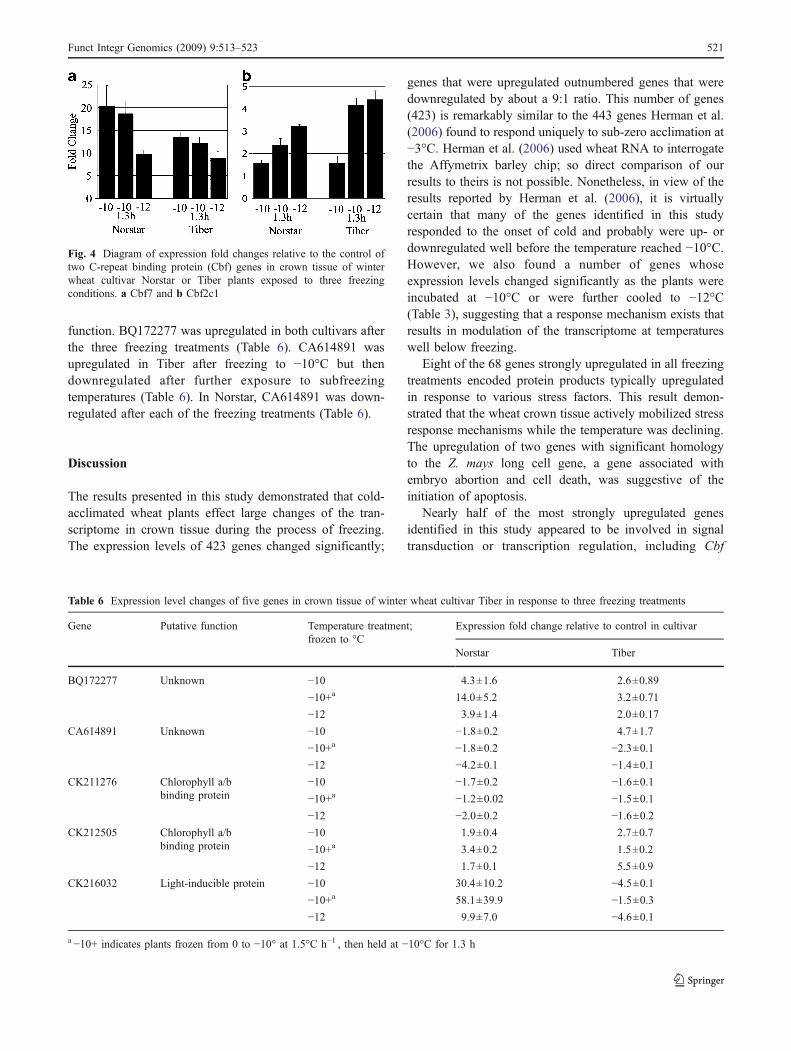
Because Cbf genes were indicated as strongly upregulatedin each of the freezing treatments in the microarrayanalysis, qPCR was used to evaluate expression of sevenCbf genes in the very freezing-tolerant Norstar and themoderately freezing-tolerant Tiber cultivar exposed to eachof the four temperature treatments (Fig. 1). The seven Cbfgenes were strongly upregulated in both cultivars in each ofthe temperature treatments, some many-fold, consistentwith the microarray results (Table 5). Most of the Cbfgenes were strongly upregulated in Norstar and Tiber as the
temperature was decreased to −10°C, then expressiondeclined as the temperature was held at −10°C or wasfurther reduced to −12°C (Table 5). An example (Cbf7) isshown in Fig. 4a. However, Cbf2c1 behaved in an oppositefashion; it was moderately upregulated as the temperaturewas decreased to −10°C but then continued to increase inexpression level as the temperature was held at −10°C orwas further lowered to −12°C (Table 5, Fig. 4b). Incomparing Norstar to Tiber, similar expression levelincreases were seen with Cbf2c1and Cbf4A, the Cbf7geneincreased expression somewhat more in Norstar than Tiber,and the remaining four of the seven Cbf genes assayed
Table 3 Genes that were expressed to significantly different levels in crown tissue of Tiber winter wheat plants after three freezing treatments asindicated by Affymetrix microarray analysis
Probe set basisa (GenBank Accession) Expression changeb in treatment
−10, 1.3h vs. −10 −12 vs. −10 −12 vs. −10, 1.3h Description
Upregulated in −12 treatment
CK216367, CA722522, BQ172277, CK167182,CK212505
Unch. Up Unch. Chlorophyll a/b binding
CA623997 Unch. Unch. Up Chlorophyll a/b binding
CA692019 Unch. Unch. Up Pathogenesis-related
CA666957 Down Unch. Up Pathogenesis-related
CA674427, CA626272 Down Unch. Up Unknown
Downregulated in -12 treatment
CD939794 Unch. Unch. Down Subtilase
BJ317378 Unch. Unch. Down Membrane protein
CK197465 Unch. Unch. Down Glycosyltransferase
CA630268 Unch. Down Unch. Phosphatase
CK206047 Unch. Down Unch. DNA binding
CA730838 Unch. Down Unch. RNA polymerase
CA630461, CA731241 Unch. Down Unch. Unknown
CA631131 Unch. Down Unch. Membrane protein
Downregulated in freezing treatment in excess of -10°C
BJ240857 Down Down Unch. Ribosomal
BJ252851 Down Down Unch. Unknown
CA739104, CA633933 Down Down Unch. Acetyltransferase
AL830045 Down Down Unch. Calcium binding
CA721628 Down Down Unch. Tumor protein
CK153702 Down Down Unch. Alpha tubulin
BE416292 Down Down Unch. Kinase
CA614891 Down Unch. Unch. WRKY
CK195532 Down Unch. Unch. Glycosyltransferase
CA614315 Down Unch. Unch. Calcium binding
BJ214711, BM134662, BJ251771 Down Unch. Unch. Unknown
For freezing treatments, temperature reduced at 1.5°C h−1 from 0 to −10°C and then held at −10°C for 1.3 h or reduced from 0 to −12°C.All foldchanges indicated were significant at P<0.05a Probe set refers to the oligonucleotide probes on the Affymetrix arrayb The direction of the fold changes indicate the expression level in the first treatment listed compared to the second
Unch unchanged
Funct Integr Genomics (2009) 9:513–523 519
increased expression much more in Tiber than in Norstar(Table 5).
Transcriptomic response of selected genes to freezingtreatments
The expression levels of five additional genes wereexamined with qPCR in Norstar and Tiber exposed to thethree freezing treatments. Two of the genes, identified aschlorophyll a/b binding protein genes (GenBank accessions
CK211276 and CK212505) responded in opposite fashionto the freezing treatments. While CK211276 was moder-ately downregulated in all freezing treatments in bothcultivars, CK212505 was moderately upregulated (Table 6).A gene (GenBank accession CK216032) with significantsimilarity to several genes encoding light-inducible proteinswas strongly upregulated in Norstar in response to thefreezing treatments but was downregulated in Tiber(Table 6). The other two genes assayed, GenBank acces-sions BQ172277 and CA614891, were of unknown
Temperature Treatment; frozen to °C Expression fold change relative to control in cultivar
Gene Norstar Tiber
Cbf1A −10 224.0±54.9 500.2±137.9
−10+a 90.2±14.2 483.8±154.3
−12 89.7±8.3 256.1±66
Cbf1C −10 36.6±8.4 103.1±10.7
−10+ 20.6±2.5 94.1±16.2
−12 9.8±2.5 25.4±4.5
Cbf2B −10 15.0±3.3 56.5±27.4
−10+ 6.0±0.7 16.7±1.2
−12 5.0±0.8 7.5±2.2
Cbf2C1 −10 1.6±0.1 1.6±0.3
−10+ 2.4±0.3 4.2±0.3
−12 3.2±0.1 4.4±0.4
Cbf4A −10 2.3±0.5 2.6±1
−10+ 2.3±0.8 1.9±0.6
−12 −1.01±0.01 −1.1±0.3Cbf5 −10 85.2±48.1 382.3±70.6
−10+ 87.0±22.9 407.0±88.7
−12 50.3±0.5 216.0±38.1
Cbf7 −10 20.3±4.6 13.5±1.1
−10+ 18.7±2.7 12.1±1.4
−12 9.7±1 8.9±1.4
Table 5 Expression levelchanges of C-repeat bindingfactor (Cbf) genes in wheat(Triticum aestivum) in responseto three freezing treatments
a −10+ indicates plants frozen to−10° at 1.5°C h−1 , then held at−10°C for 1.3 h
Table 4 Fold changes measured by quantitative real-time PCR of five wheat genes of the cultivar Tiber that were indicated from microarrayanalysis as upregulated at least twofold as cold-acclimated crown tissue was cooled from −10 to −12°C at 1.5°C h−1
Probe set basisa (GenBank accession) Expression fold change relative to control as plants
Maintained at −10°C for 1.3h Cooled from −10 to −12°C over 1.3h
CA623997 −1.6±0.11 2.8±0.62
CA626272 1.6±0.23 4.5±0.68
CA666957 2.1±0.02 3.6±0.17
CA674427 −1.4±0.12 1.5±0.17
CA692019 −1.5±0.40 3.2±0.01
a Putative function assignments were as follows: CA623997, chlorophyll binding protein precursor; CA692019 and CA666957, pathogenesis-related proteins; all others, unknown function
520 Funct Integr Genomics (2009) 9:513–523
function. BQ172277 was upregulated in both cultivars afterthe three freezing treatments (Table 6). CA614891 wasupregulated in Tiber after freezing to −10°C but thendownregulated after further exposure to subfreezingtemperatures (Table 6). In Norstar, CA614891 was down-regulated after each of the freezing treatments (Table 6).
Discussion
The results presented in this study demonstrated that cold-acclimated wheat plants effect large changes of the tran-scriptome in crown tissue during the process of freezing.The expression levels of 423 genes changed significantly;
genes that were upregulated outnumbered genes that weredownregulated by about a 9:1 ratio. This number of genes(423) is remarkably similar to the 443 genes Herman et al.(2006) found to respond uniquely to sub-zero acclimation at−3°C. Herman et al. (2006) used wheat RNA to interrogatethe Affymetrix barley chip; so direct comparison of ourresults to theirs is not possible. Nonetheless, in view of theresults reported by Herman et al. (2006), it is virtuallycertain that many of the genes identified in this studyresponded to the onset of cold and probably were up- ordownregulated well before the temperature reached −10°C.However, we also found a number of genes whoseexpression levels changed significantly as the plants wereincubated at −10°C or were further cooled to −12°C(Table 3), suggesting that a response mechanism exists thatresults in modulation of the transcriptome at temperatureswell below freezing.
Eight of the 68 genes strongly upregulated in all freezingtreatments encoded protein products typically upregulatedin response to various stress factors. This result demon-strated that the wheat crown tissue actively mobilized stressresponse mechanisms while the temperature was declining.The upregulation of two genes with significant homologyto the Z. mays long cell gene, a gene associated withembryo abortion and cell death, was suggestive of theinitiation of apoptosis.
Nearly half of the most strongly upregulated genesidentified in this study appeared to be involved in signaltransduction or transcription regulation, including Cbf
Table 6 Expression level changes of five genes in crown tissue of winter wheat cultivar Tiber in response to three freezing treatments
Gene Putative function Temperature treatment;frozen to °C
Expression fold change relative to control in cultivar
Norstar Tiber
BQ172277 Unknown −10 4.3±1.6 2.6±0.89
−10+a 14.0±5.2 3.2±0.71
−12 3.9±1.4 2.0±0.17
CA614891 Unknown −10 −1.8±0.2 4.7±1.7
−10+a −1.8±0.2 −2.3±0.1−12 −4.2±0.1 −1.4±0.1
CK211276 Chlorophyll a/bbinding protein
−10 −1.7±0.2 −1.6±0.1−10+a −1.2±0.02 −1.5±0.1−12 −2.0±0.2 −1.6±0.2
CK212505 Chlorophyll a/bbinding protein
−10 1.9±0.4 2.7±0.7
−10+a 3.4±0.2 1.5±0.2
−12 1.7±0.1 5.5±0.9
CK216032 Light-inducible protein −10 30.4±10.2 −4.5±0.1−10+a 58.1±39.9 −1.5±0.3−12 9.9±7.0 −4.6±0.1
a −10+ indicates plants frozen from 0 to −10° at 1.5°C h−1 , then held at −10°C for 1.3 h
Fig. 4 Diagram of expression fold changes relative to the control oftwo C-repeat binding protein (Cbf) genes in crown tissue of winterwheat cultivar Norstar or Tiber plants exposed to three freezingconditions. a Cbf7 and b Cbf2c1
Funct Integr Genomics (2009) 9:513–523 521
genes. Cbf genes encode transcription factors that influencethe expression of many other genes (the Cbf regulon) andhave long been known as crucial to cold acclimation ofwheat at above freezing temperatures (Galiba et al. 2009).Typically, the expression of the Cbf genes (Kume et al.2005) and the genes they regulate (Kobayashi et al. 2004;Ganeshan et al. 2008) rapidly increase expression inresponse to low, above-freezing temperature, and thendecrease expression with time at constant low temperature.In this study, we demonstrated that expression of Cbf genesin cold acclimated plants greatly increased as the temper-ature declined to below freezing, potentially damaginglevels. This result extends the influence of the Cbf regulonto include freezing stress response in addition to coldacclimation in wheat. Because the LT50 of Tiber is about−13°C and that of Norstar is about −19°C, freezing to −12°Cconstituted exposure of Tiber to about 90% of its LT50
temperature, but Norstar was exposed to only about 60% ofits LT50 temperature. The greater increase in expression inTiber than in Norstar of most of the Cbf genes (Table 5) andthe differential expression of other genes (Table 6) betweenthe two cultivars suggested that gene expression is modulat-ed in accordance with the level of freezing stress, as may beestimated by the percentage of LT50 imposed.
The finding of increased expression of genes encodingchlorophyll a/b binding protein in crown tissue frozen to−12°C was unexpected. Chlorophyll a/b binding proteinsare part of the light-harvesting complex within thechloroplasts, but we studied crown tissue, the meristematicregion of the plant, where the plastids are largelyundifferentiated (Mullet 1988) and not expected to be asite of photosynthesis. Therefore, it seems unlikely thatfreezing stress response in the crown tissue would involveupregulation of genes encoding structural parts of the lightharvesting mechanism. Satoh et al. (2001) reviewedchlorophyll a/b binding-like proteins and concluded that,although certain of these proteins are capable of bindingchlorophyll, their relatively low affinity for chlorophyll andcharacteristic stress inducibility “suggested little contribu-tion to photosynthesis” but, rather, suggested a “protectiverole during stress conditions.” Some genes encodingchlorophyll a/b binding-like proteins contain motifs sug-gestive of a protease inhibitor function (Satoh et al. 2001).Although no proteases specifically inhibited by the chloro-phyll a/b binding-like proteins have yet been identified, theoccurrence of these motifs further suggests a protectiverole, rather than a role in photosynthesis (Satoh et al. 2001).
Overall, these results suggested that a significant part ofthe ability of wheat plants to survive freezing may bedetermined by their ability to adjust the transcriptome incrown tissue as the temperature is decreased to potentiallydamaging levels. Variation in numbers of copies of mRNAtranscripts does not, by itself, confer greater freezing
tolerance. Significant variation in activity of gene productsis necessary to contribute to changes in freezing tolerance.How much metabolic activity is happening in a wheatcrown as it cools to −10°C or −12°C is unknown. However,it was reported previously that significant changes in thelevels of various carbohydrates occurred in crowns ofbarley (Hordeum vulgare L.) and oat (Avena sativa L.)plants incubated at −3°C (Livingston 1996), and Herman etal. (2006) reported that wheat crowns held at −3°Cunderwent numerous changes in physiology, cellularstructure, and the proteome. It seems likely that at leastsome of these changes can also occur at temperatures lessthan −3°C and are a result of transcriptional regulation ofkey genes. Because about 25% of the responsive genesidentified in this study were not significantly similar to anygenes of known function and genes encoding chlorophyllbinding-like proteins were upregulated in the nonphotosyn-thetic crown tissue, it may be that responses to subfreezingstresses involve processes that have not yet been described.Furthermore, certain of the responsive genes were differ-entially regulated in cultivars with differing cold tolerance,suggesting that it may be possible to identify specific genesand alleles related to a greater ability to survive freezing,thereby providing access to previously unknown geneticvariation for cold tolerance in winter wheat.
Acknowledgements The author thanks Brian Bellinger for technicalassistance and Derek Pouchnik of the Washington State UniversityBiotechnology Core Facility for conducting the microarray hybrid-izations and scans. This project was supported by USDA-ARS project5348-21430-003-00D. Mention of product names does not representan endorsement of any product or company but is given only to clarifythe methodology; other products may be equally effective.
References
Anonymous (2002) World wheat facts. Western Organization ofResearch Councils, Washington, DC, pp. 1–2
Bastida M, Graziano E, Roca R, Lopez I, Sanchez-Pons N, Puigdome-nech P, Vicient CM (2006) A maize defective-kernel mutant(longcell) characterized by tubular cells, severe morphologicalalterations and induction of cell death. Planta 223:755–768
Blazejczyk M, Miron M, Nadon R (2007) FlexArray: a statistical dataanalysis software for gene expressionmicroarrays. GenomeQuebec,Montreal, Canada. http://genomequebec.mcgill.ca/FlexArray
Dussault A, Pouliot M (2006) Rapid and simple comparison ofmessenger RNA levels using real-time PCR. Biol Proced Online8:1–10
Eulgem T, Rushton PJ, Robatzek S, Somssich I, Somssich IE (2000)The WRKY superfamily of plant transcription factors. TrendsPlant Sci 5:199–206
Fowler DB (2002) Cultivar development and selection, Chapter 8. In:Winter wheat production manual. The University of Saskatch-ewan. http://www.usask.ca/agriculture/plantsci/winter_cereals/Winter_wheat/CHAPT08/cvchpt08.php. Accessed March 2, 2009
Fowler S, Thomashow MF (2002) Arabidopsis transcriptome profilingindicates that multiple regulatory pathways are activated during
522 Funct Integr Genomics (2009) 9:513–523
cold acclimation in addition to the CBF cold response pathway.Plant Cell 14:1675–1690
Fowler S, Cook D, Thomashow MF (2005) The CBF cold-responsepathway. In: Jenks MA, Hasegawa PM (eds) Plant abiotic stress.Blackwell, Oxford, UK
Galiba G, Vágújfalvi A, Li C, Soltész A, Dubcovsky J (2009)Regulatory genes involved in the determination of frost tolerancein temperate cereals. Plant Sci 176:12–19
Ganeshan S, Vitamvas P, Fowler DB, Chibbar RN (2008) Quantitativeexpression analysis of selected COR genes reveals theirdifferential expression in leaf and crown tissues of wheat(Triticum aestivum L.) during an extended low temperatureacclimation regimen. J Exp Bot 59:2393–2402
Grant MN (1980) Registration of Norstar wheat. Crop Sci 20:552Herman EM, Rotter K, Premakumar R, Elwinger G, Bae R, Ehler-
King L, Chen SX, Livingston DP (2006) Additional freezehardiness in wheat acquired by exposure to −3°C is associatedwith extensive physiological, morphological, and molecularchanges. J Exp Bot 57:3601–3618
Jankowska AM, Gondek LP, Szpurka H, Nearman ZP, Tiu RV,Maciejewski JP (2008) Base excision repair dysfunction in asubgroup of patients with myelodysplastic syndrome. Leukemia22:551–558
Kisha TJ, Taylor GA, Bowman HR, Wiesner LE, Jackson GD,Carlson GR, Bergman JW, Kushnak GD, Stallknecht GF, StewartVR, McGuire CF (1992) Registration of Tiber hard red winterwheat. Crop Sci 32:1292
Kobayashi F, Takumi S, Nakata M, Ohno R, Nakamura T, NakamuraC (2004) Comparative study of the expression profiles of theCor/Lea gene family in two wheat cultivars with contrastinglevels of freezing tolerance. Physiol Plant 120:585–594
Kume S, Kobayashi F, Ishibashi M, Ohno R, Nakamura C, Takumi S(2005) Differential and coordinated expression of Cbf and Cor/Lea genes during long-term cold acclimation in two wheatcultivars showing distinct levels of freezing tolerance. Genes &Genet Syst 80:185–197
Laity JH, Lee BM, Wright PE (2001) Zinc finger proteins: newinsights into structural and functional diversity. Curr Opin StructBiol 11:39–46
Limin AE, Fowler DB (2006) Low-temperature tolerance andgenetic potential in wheat (Triticum aestivum L.): response tophotoperiod, vernalization, and plant development. Planta224:360–366
Livingston DP III (1996) The second phase of cold hardening:freezing tolerance and fructan isomer changes in winter cerealcrowns. Crop Sci 36:1568–1573
Monroy AF, Dryanova A, Malette B, Oren DH, Ridha Farajalla M,Liu W, Danyluk J, Ubayasena LWC, Kane K, Scoles GJ, SarhanF, Gulick PJ (2007) Regulatory gene candidates and geneexpression analysis of cold acclimation in winter and springwheat. Plant Mol Biol 64:409–423
Mullet JE (1988) Chloroplast development and gene-expression.Annu Rev Plant Physiol Plant Molec Biol 39:475–502
Patterson FL, Shaner GE, Ohm HW, Foster JE (1990) A historicalperspective for the establishment of research goals for wheatimprovement. J Prod Agric 3:30–38
Satoh H, Uchida A, Nakayama K, Okada M (2001) Water-solublechlorophyll protein in Brassicaceae plants is a stress-inducedchlorophyll-binding protein. Plant Cell Physiol 42:906–911
Skinner DZ, Bellinger BS, Halls S, Baek KH, Garland-Campbell K,Siems WF (2005) Phospholipid acyl chain and phospholipasedynamics during cold acclimation of winter wheat. Crop Sci45:1858–1867
Thomashow MF (1999) Plant cold acclimation: freezing tolerancegenes and regulatory mechanisms. Annu Rev Plant Physiol PlantMol Biol 50:571–599
Turtinen LW, Bremer LA, Prall DN, Schwartzhoff J, Hartsel SC(2005) Distinct cytokine release profiles from human endo-thelial and THP-1 macrophage-like cells exposed to differentamphotericin B formulations. Immunopharm Immunotox27:85–93
Vagujfalvi A, Aprile A, Miller A, Dubcovsky J, Delugu G, Galiba G,Cattivelli L (2005) The expression of several Cbf genes at the Fr-A2 locus is linked to frost resistance in wheat. Mol Genet Genom274:506–514
Wolfe SA, Nekludova L, Pabo CO (2000) DNA recognition byCys2His2 zinc finger proteins. Ann Rev Biophys Biomol Struct29:183–212
Funct Integr Genomics (2009) 9:513–523 523


![Original Article Role of Hsp-70 responses in cold acclimation ...Freezing-thawing of cells Freezing-thawing was performed as described previously [5]. Briefly, flasks were kept in](https://img.pdfslide.us/doc/110x75/610d3b2cad120422ab4c85a6/original-article-role-of-hsp-70-responses-in-cold-acclimation-freezing-thawing.jpg)