Embed Size (px)
Citation preview

Possible Consequences of an Increase in Tropical Cyclone Intensity on
Japanese Port Infrastructure and Operations
Miguel EstebanResearch Fellow
Kyoto University
Japan
Lecture as part of the course:Lecture as part of the course:
Engineering and Policy Responses to Climate Change Impacts on SeaportsEngineering and Policy Responses to Climate Change Impacts on Seaports

Overview
1. Brief introduction of myself
2. Introduction to tropical cyclones and how they are affected by climate change
3. Outline of the methodology used to compute increase in size of tropical cyclone
4. Types of damage4.1. Indirect damage (downtime)4.2. Direct damage (destruction of infrastructure)
5. Indirect damage and its significance on the economy of Japan
6. Direct damage to breakwaters (effect of sea level rise)
7. Conclusions

General Info about Myself
• I have two nationalities (British, Spanish)• Lived in England (Liverpool, Reading) and
Spain, Belgium, Switzerland and Japan (6 years)
• 1996-2000 - M. Eng. in Civil Eng. (Bristol Uni.)• 2001-2004 – Worked as an Engineer• 2004-2007 – PhD at Yokohama Uni. (Japan)• 2007-2009 – Post-Doc at the United Nations
University (Work I will present today)• Oct 2009 – Kyoto University (1 week!)

Work –Coastal Engineer
• 4 Years experience as a Graduate Engineer (2001-2004)
• JacobsGIBB (International Consultants, Coastal Dept.)
• High-Point Rendel (Specialist Coastal Engineering Consultants)

Worked also as a Tunneling Engineer for 2 years

CERN – European Centre for Nuclear Research
• Was an underground work inspector building new Caverns for CERN
• These are the installations shown in the Film Angels & Demons

Doctors Degree
• Yokohama National University • Supervisor: Prof. Tomoya Shibayama
“Structural and Financial Risk Assessment of Caisson Breakwaters Against Wind Waves and
Tsunami Attack”
• Methodology: Lab. Experiments, Computer Simulation, Analysis of Real Failures
• Symposiums & Field Trips: Tanzania, Sri Lanka.

Lab. Experiments

What are tropical cyclones?
• 3 different names: Hurricanes (America) Cyclones (Indian Ocean) Typhoons (Asia-Pacific)
• Same physical phenomena
• Central eye surrounded by rain bands
• High winds, low pressure centre, thunderstorms, heavy rain
• storm surge (e.g. Bangladesh), wind damage, landslides, flooding, high waves
9

How do tropical cyclones originate?
• Produced by areas of high sea temperatures (hence affected by an increase in surface sea temperature)
• Primary energy source is the release of the heat of condensation from water vapour condensing at high altitudes
• Originate just north or south of equator (they need the Coriolis force to form, and this is not present at equator)
• (Coriolis force is a force exerted due to the earth’s rotation)

Tropical Cyclones in Asia
• Worst affected areas… Philippines, Taiwan, Japan, China, Korea, Bangladesh, India, Vietnam…
• Maybe others in future… Iran, Brazil?
11

Rationale
• One of the fears of global warming is that it could result in an increase in the frequency and intensity of typhoons due to the warming of sea temperature (Nordhaus 2006).
• 8 of the 10 most costliest natural disasters in Asia (1980-2008) were due to typhoons in Japan (Munich Re.)
• Stern Report highlights generally the dangers to the economy
12

Predicting Climate Change
Predicting the future…
How real are our predictions?
Are we modern day witches?
13
Knowledge about future and typhoons (I)
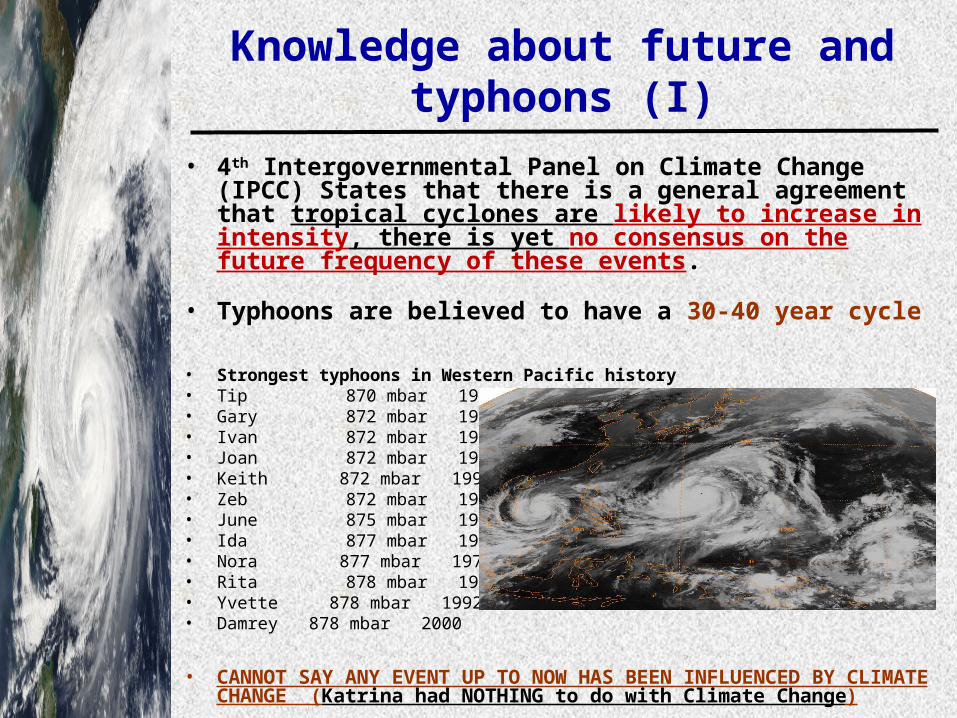
• 4th Intergovernmental Panel on Climate Change (IPCC) States that there is a general agreement that tropical cyclones are likely to increase in intensity, there is yet no consensus on the future frequency of these events.
• Typhoons are believed to have a 30-40 year cycle
• Strongest typhoons in Western Pacific history • Tip 870 mbar 1979 • Gary 872 mbar 1992 • Ivan 872 mbar 1997 • Joan 872 mbar 1997 • Keith 872 mbar 1997 • Zeb 872 mbar 1998 • June 875 mbar 1975 • Ida 877 mbar 1958 • Nora 877 mbar 1973 • Rita 878 mbar 1978 • Yvette 878 mbar 1992 • Damrey 878 mbar 2000
• CANNOT SAY ANY EVENT UP TO NOW HAS BEEN INFLUENCED BY CLIMATE CHANGE (Katrina had NOTHING to do with Climate Change)

Knowledge about future and typhoons (II)
• Pielke et al. (2006) “Normalised Hurricane Damage in the United States, 1900-2005”

Knowledge about future and typhoons (III)
• Damage is increasing, but we occupy more of the planet each day.
• Typhoon formation is influenced by surface sea water temperature (0.7 degrees 20th century)
• Simulations by of Knutson and Tuleya (2004). These authors carried out 1300 five-day idealized simulations using a high-resolution version of the Geophysical Fluid Dynamics Laboratory (GFDL) R30 hurricane prediction system. Conclusion: typhoons to get stronger.
• It is crucial to understand assumptions on which the present model was built
16

Assumptions
• Tropical cyclone tracks will not change in the future.
• The frequency and seasonal distribution of tropical cyclones will not change in the future.
• There is a general relationship between the maximum sustained wind speed and the size of the tropical cyclone.
• Any wind which is higher than 30 knots (55.56 km/h) will generally lead to a precautionary cessation of many human activities.
• The topography and population distribution of the target country (in this case Japan) will not change in the future.

Methodology I
• Monte Carlo Simulation
• Computer program randomly simulates one full year of typhoons in 2085
• Maximum wind speed and area are altered

Methodology (V) –Change typhoon size
• Maximum wind speed and area are altered
R1 goes to R2
(R30=30 knot radius)
R3 goes to R4
(R50=50 knot radius)
19

Methodology (III) – Expected increase in wind intensity
• Knutson and Tuleya (2004) give probability distribution functions of typhoon intensity in 2085
• Basically we change the size of historical typhoons according to the shift in the probability distribution function

Method. IV - Probability Distributions of Wind in 2085
0
50
100
150
0.00 100.00 200.00 300.00
Mean radius of 50 knot winds (km)
Max
imum
sus
tain
ed w
ind
sp
eeds
(kn
ots)
0
50
100
150
200
0.00 200.00 400.00 600.00
Mean radius of 30 knot winds (km)
Max
imum
sus
tain
ed w
ind
spee
ds (
knot
s)
If maximum winds are stronger (at the centre) typhoon is usually bigger
R30 = 46.744 + 2.168 Wmax
R50 = - 81.345 + 2.099 Wmax
• Not well understood
• Rx = bo + b1 Wmax
• Two scenarios A: low correlation (b1
=1) B: expected correlation
(b1 =2)

Types of Typhoon Damage
• Direct Damage: Physical destruction caused by the typhoons (e.g. houses destroyed, consequences of floods, etc)
• Indirect Damage: Time Loss during the passage of a typhoon (factories have to close, workers stay at home, provisional measures put in place, etc).

The importance of wind speeds
• Assume that wind speed of 30 knots or higher leads to the precautionary stop of many human activities
• Ports, airports, trains, etc
• Map illustrates the affected area for the life of typhoon Tokage (2004)
23

Port Downtime... Why is it important?
• PORT DOWNTIME: number of hours that a port has to close due to high winds
• This downtime causes disruption to the economy of a country (time is money)
• The Port Designer’s Handbook recommends limits for oil tankers of
between 20 and 30 knots for berthing of up to 40 knots for loading and unloading of 55 knots before vessel should leave port
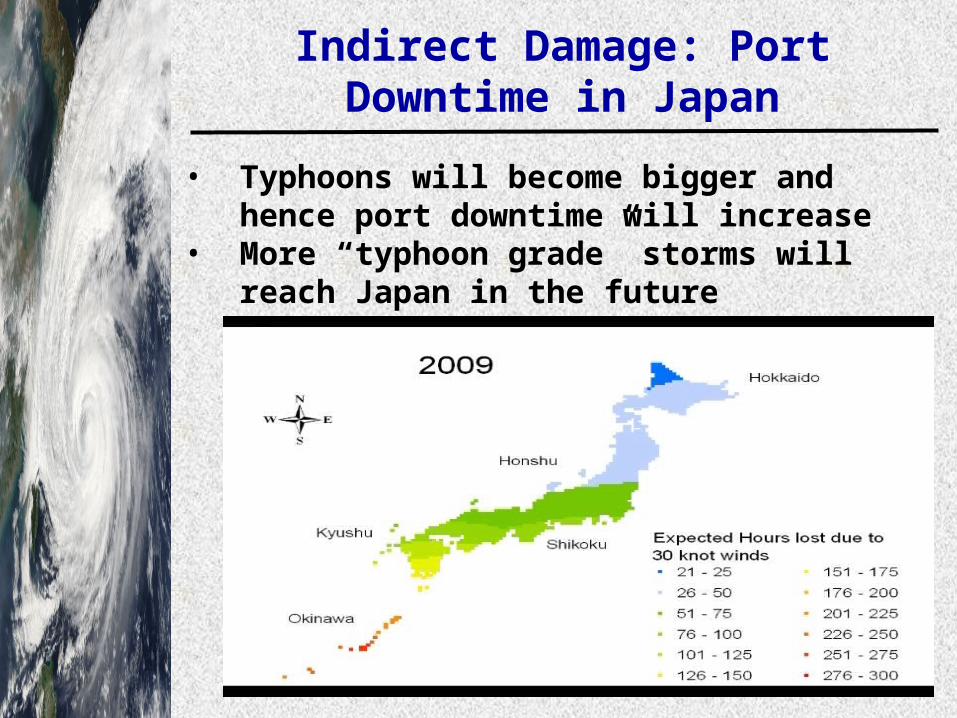
Indirect Damage: Port Downtime in Japan
• Typhoons will become bigger and hence port downtime will increase
• More “typhoon grade” storms will reach Japan in the future

Seasonal differences in the Increase in Port Downtime
010
20304050
6070
Month
No
. h
ou
rs50 knot no climatechange
50 knot climatechange
30 knot no climatechange
30 knot climatechange
010
20304050
6070
Month
No
. h
ou
rs
50 knot no climatechange
50 knot climatechange
30 knot no climatechange
30 knot climatechange
PORT OF NAHA (OKINAWA)
PORT OF YOKOHAMA

Relation between GDP and RPCS
• Direct correlation between total capital expenditure in Port Infrastructure (RPCS) and the growth in Japanese GDP (Kawakami and Doi 2004).
88.28.48.68.8
99.29.49.6
1970 1980 1990 2000
Year
Rea
l Por
t Cap
ital S
tock
(L
n)
trill
ion
yen
11.812.012.212.412.612.813.013.2
1970 1980 1990 2000
YearG
DP
(Ln)
trill
ion
yen
Growth in RPCS in Japan, 1990 Prices in trillion yen (Ln)
Growth in GDP in Japan, 1990 Prices in trillion yen (Ln)

Extra required Port Infrastructure Expenditure due to climate
change• 4 Scenarios, depending on rate of economic growth (1 or
2%) and the relationship between maximum wind speed and typhoon area
• 30.6 and 127.9 billion additional Yen required to be invested by the year 2085 to compensate against increase in downtime
• Failure to spend this money could reduce GDP by between 1.5 and 3.4% by 2085.
0
50
100
150
1985 2035 2085
Year
Req
uir
ed
ad
dit
ion
al
Real
Po
rt C
ap
ital
Sto
ck
(b
illi
on
yen
)
Scenario A1
Scenario A2
Scenario B1
Scenario B2

Expected GDP Loss in Japan due to downtime in OTHER sectors in the economy
• Japanese GDP could be 0.15% lower in the year 2085 due to downtime caused by 30 mph winds (based on 1990 GDP figures)
• ~$60 USD per capita per year in current economic terms

Increase in Downtime in the Philippines
• In this case the north of the country is mostly affected (Island of Luzon)
• Luzon concentrates most of the economic activity (Manila is situated in Luzon)

Increase in Downtime in Taiwan
31
2009 2085

Direct Damage and Port Infrastructure
• Tropical cyclones generate high waves that can destroy port infrastructure
• The key protective elements in ports are breakwaters
• Very expensive structures that can be damaged by high wave attack

Design of Breakwaters
• Breakwaters are designed against an expected type of wave attack.
• Typically an engineer will find from the historical records the worst type of wave for the last 50 years and design the breakwater accordingly (50 year return period wave).
• Assumptions: Wave Climate will not change Sea Level will be constant

Overboard is of crucial importance in breakwater design
Sand fill
Concrete Shell
Foundation Material
Toe Protection Armour
Armour Blocks
b) Vertical Breakwater
d) Armoured Caisson Breakwater
Inner Chamber
b) Perforated Vertical Breakwater
• Overboard: distance from sea level to top of the breakwater
c)Composite Breakwater
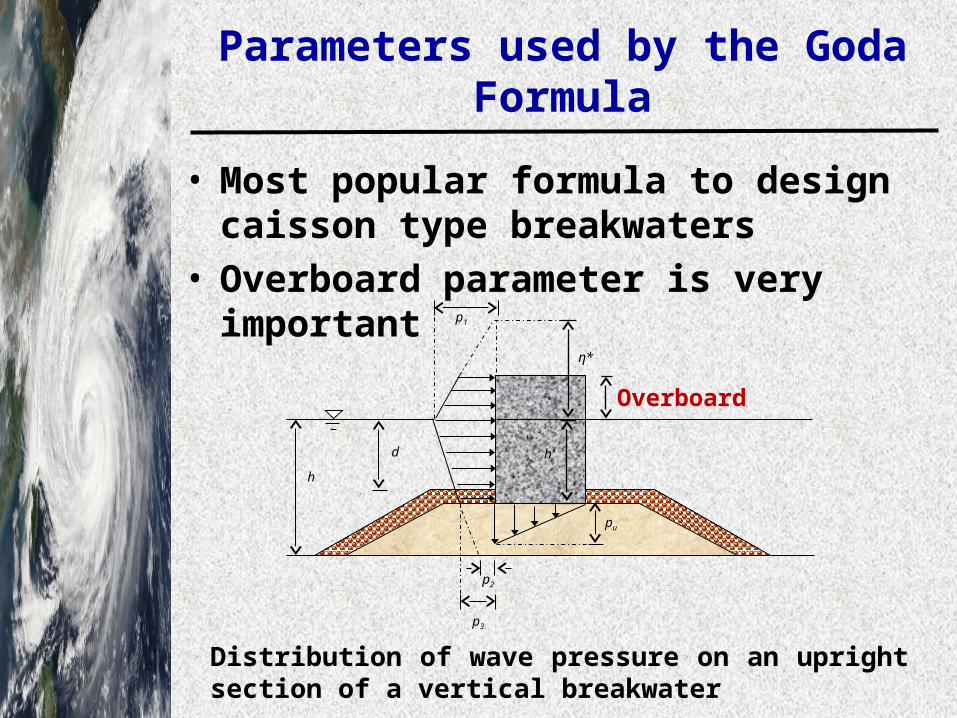
Parameters used by the Goda Formula
• Most popular formula to design caisson type breakwaters
• Overboard parameter is very important
h
η*
p3
d
p2
pu
p1
h’
Distribution of wave pressure on an upright section of a vertical breakwater
Overboard

Sea Level is Rising….
• Average sea levels are increasing
• IPCC quotes rises between 18-59cm (some as high as 0.8m)

Increased Probability of Failure due to Sea Level Rise
• A decrease in overboard would result in higher forces exerted by waves on the caisson.
• Okayasu & Sakai (2006) assumed constant sea level rise during next 40 years.
• Probability of failure would increase by over 50% (using a reliability design method) by 2050

Economic Cost of Sea Level Rise
• Cost of building new breakwaters in Japan would increase by between 0.5 and 2.3% as a result of Sea Level Rise
• A breakwater already constructed cannot be expected to survive its design life (typically 50 years)

But what about an increase in tropical cyclone intensity?
• Effect of this and sea level rise has still not been investigated
• Future work for me…
• It is likely that effect can cause dramatic future damage to breakwaters

Is this the whole picture?
• Well, not quite…
• Tropical cyclones follow 30-40 years cycles but we only have satellite since 1978.
• Records go back to the 19th Century, but quality of data is not so good…
• We are not sure what will happen with frequency and the paths of typhoons

Typhoon Gonu –It could have been a big disaster-
• June 5th 2007 Very Severe Cyclonic Storm Gonu, the most intense cyclone on record in the Arabian Sea. Winds 260 km/h
• June 7th made landfall in Iran – downgraded to cyclonic storm ~80 km/hr

But why am I talking about cyclone Gonu?
• Unprecedented in the 20th Century
• 19th Century record shows some storms entering Oman Sea (how reliable?)
• Lack of local experience in dealing with cyclones
• More common in the future?

Cyclone Catarina –Brazil-
• First EVER recorded cyclone in the South Atlantic (Category 2)
• Caused widespread damage
• Countries that are not used to getting these events suffer more damage.

Summary (I)
• Tropical cyclones are likely to increase in strength in the future.
• Much is still unknown about these events.
• 30.6 and 127.9 billion additional Yen required to be invested in port infrastructure in Japan by the year 2085
• Japanese GDP could be 0.15% lower in the year 2085 due to downtime only

Summary (II)
• Breakwater damage could increase by up to 50% by 2050 as a result of sea level rise
• Cost of construction new breakwaters could increase by up to 2.3% to take into account sea level rise only
• Areas of the world which do not experience tropical cyclones could start to feel them in the future