Embed Size (px)
Citation preview
1
Positive feedback between global warming and atmospheric CO2
concentration inferred from past climate change
Marten Scheffer1, Victor Brovkin2 and Peter Cox3
1. Aquatic Ecology and Water Quality Management Group, Department of
Environmental Sciences, Wageningen University, P.O. Box 8080, 6700 DD
Wageningen, The Netherlands. Fax: 31-317-484411. Email: [email protected].
2. Potsdam Institute for Climate Impact Research, P.O. box 601203, D-14412,
Potsdam, Germany
3. Hadley Centre, The Met Office, Bracknell, Berkshire RG12 2SY, UK

2
[1] There is good evidence that higher global temperatures will promote a rise of
greenhouse gas levels, implying a positive feedback which will increase the effect of
anthropogenic emissions on global temperatures. However, the magnitude of this effect
predicted by the available models remains highly uncertain, due to the accumulation of
uncertainties in the processes thought to be involved. Here we present an alternative
way of estimating the magnitude of the feedback effect based on reconstructed past
changes. Linking this information with the mid-range IPCC estimation of the
greenhouse gas effect on temperature we suggest that the feedback of global
temperature on atmospheric CO2 will promote warming by an extra 15-78% on a
century-scale. This estimate may be conservative as we did not account for synergistic
effects of likely temperature moderated increase in other greenhouse gases. Our semi-
empirical approach independently supports process based simulations suggesting that
feedback may cause a considerable boost in warming.
1. Introduction
[2] The direct effects of CO2 and other greenhouse gases on earth temperature are
relatively well understood. However, estimation of the overall effect of anthropogenic
emissions is complicated by the existence of feedbacks in the earth system [Kellogg,
1983; Lashof, 1989; Lashof et al., 1997]. An important class of feedbacks is related to
the effect of temperature on greenhouse gas dynamics. Increased photosynthesis at
higher CO2 levels and temperatures implies a negative feedback, but positive feedbacks
seem likely to override this effect [Lashof et al., 1997; Woodwell et al., 1998]. For
instance, higher temperatures may lead to increased release of CO2 , methane and N2O

3
from terrestrial ecosystems and to increased oceanic denitrification and stratification,
resulting in nutrient limitation of algal growth reducing the CO2 sink to the ocean. Also,
CaCO3 neutralization in the ocean is reduced at higher temperatures [Archer et al.,
2004]. Several analyses with elaborate coupled climate-carbon models that take such
feedbacks into account suggest an overall amplification of the effects of anthropogenic
addition of greenhouse gases to the atmosphere [Cox et al., 2000; Friedlingstein et al.,
2001; Prentice et al., 2001; Friedlingstein et al., in press]. However, we are still far
from able to compute the relative strengths of the multitude of known (and unknown)
relevant processes on a global scale with much precision [Prentice et al., 2001;
Friedlingstein et al., 2003].
[3] Here, we combine information derived from reconstruction of past changes with
a simple well accepted greenhouse effect model in an attempt to produce an
independent estimate of the potential implications of the positive feedback between
global temperature and greenhouse gases.
2. Model
[4] The essence of the problem stripped to the bare bones is that CO2 affects global
temperature, while at the same time temperature affects the CO2 concentration. To
analyze the feedback our model should include both effects. The effect of CO2 and other
greenhouse gases on global temperature is relatively straightforward. A simple
logarithmic increase of global temperature (T) with concentration of e.g. CO2 is usually
assumed [Budyko, 1982] (Fig. 2a):
T= T0 + s/ln(2) *ln(C /C0) (1)
4
Where ∆T= T-T0 is the temperature increase relative to a reference temperature (T0 ) at
a reference CO2 concentration (C0 ), and s scales the impact of CO2 on the temperature.
State-of-the-art models suggest the value of s to be somewhere between 1.5 and 4.5°C
[IPCC, 2001].
[5] The effect of temperature on greenhouse gases is the more difficult aspect to
model. We take an empirical approach based on palaeo-reconstructions. The basic
rationale is that pre-industrial CO2 variations during glacial cycles and the little ice-age
have been largely temperature driven. The relationship between CO2 and temperature in
past dynamics depends on the time-scale at which we focus, but is roughly linear in
most data-sets (e.g. Fig. 1) implying that for our current purpose it may be simply
represented as (Fig. 2b):
C= α (T-T0)+C0 (2)
where α is the slope of change in atmospheric CO2 against temperature, and T0 and CO
are reference temperature and CO2 level respectively.
[6] If we interpret the correlation between (pre-industrial) CO2 and temperature (eq.
2) as representing the effect of temperature on the equilibrium atmospheric CO2
concentrations, we can combine equation (1) which describes equilibrium temperature
as a function of CO2 with the empirically derived temperature effect on the equilibrium
concentration of greenhouse gas (Eq. 2), to construct a minimal interactive model which
has a single stable equilibrium (Fig. 2c).
[7] At first sight that there may seem to be some circularity in interpreting the
reconstructed times series as simply representing the effect of temperature on CO2, as
the causality between temperature and greenhouse gas concentrations goes two ways.
5
Indeed, the correlated temperature and greenhouse gas concentrations may be
considered to roughly indicate a set of possible equilibrium conditions of the interactive
earth system on centennial to millennial scales [Woodwell et al., 1998]. However, it
may be argued that the different CO2 concentrations in the past have arisen largely
because the equilibrium temperature curve has moved up and down over time (Fig. 3)
due to other mechanisms than those related to the effect of CO2 concentrations on
temperature, e.g. changes in solar irradiation, which moderated the equilibrium
temperatures for given CO2 concentrations. If we assume that the CO2 equilibrium as a
function of temperature remained largely unaltered in the absence of anthropogenic
emissions (or at least varied independently of the temperature isocline), the
reconstructed co-variation of ancient CO2 with temperature may be interpreted as
revealing the slope of the effect of temperature on CO2 equilibrium concentrations. This
is exactly the complementary information to equation (1) needed to allow an estimate of
the boost in global warming produced by the feedback of temperature to greenhouse gas
dynamics.
[8] Since the equilibrium line for greenhouse gas (C’=0) is not vertical (due to the
feedback effect), anthropogenic emissions of fossil CO2 and other greenhouse gases will
produce a stronger increase in temperature as well as greenhouse gas concentrations
than would be expected if temperature would not affect greenhouse gas concentrations
(Fig. 4). The magnitude of the predicted effect of warming on warming depends on the
ratio of the slopes of the two equilibrium lines. The Carbon equilibrium line (C’=0) is
simply a straight line with slope α. The temperature equilibrium line is slightly bended
(Fig. 2). However, if for simplicity we linearize the temperature isocline estimating the
6
slope δ from the projected effect of CO2 doubling (between 3± 1.5°C [IPCC, 2001]), the
factor with which the projected temperature rise will increase due to inclusion of the
feedback follows simply from the two slopes as:
∆Twith feedback/( ∆Twithout feedback) = 1/(1- δ α) (3)
This relationship can be deduced directly from geometrical considerations, using the
ideas illustrated in Fig. 4 if the temperature equilibrium curve (T’=0) is approximated
with a straight line.
3. Parameter estimation
[9] There is uncertainty in the estimates of both slopes. Uncertainty about climate
sensitivity to CO2 has received much attention. Some extreme simulations suggest that
temperature increase for doubling of CO2 concentration can be as high as 11.5°C
[Stainforth et al., 2005] but most model experiments (excluding the feedback of
temperature on CO2 dynamics) constrain the effect of CO2 doubling to the range from
1.5°C to 4.5°C [IPCC, 2001]. Assuming a pre-industrial CO2 concentration of 280
ppmv as a reference value, the variation in estimations of s implies that the slope (δ) of
the line (T’=0) around present-day CO2 concentration is about 0.0107 0C/ppmv CO2
(for the mid-range estimate of ∆T = 3°C) with an uncertainty range of 0.0054 to 0.0161
0C/ppmv CO2 (for ∆T = 1.5°C to 4.5°C).
[10] The other part of the feedback, the effect of temperature on atmospheric CO2
concentrations, is more difficult to infer. Importantly, since processes on very different
time scales affect global CO2 dynamics, the effect of temperature on atmospheric CO2
concentration may differ strongly with the time scale of interest. A review of biospheric
7
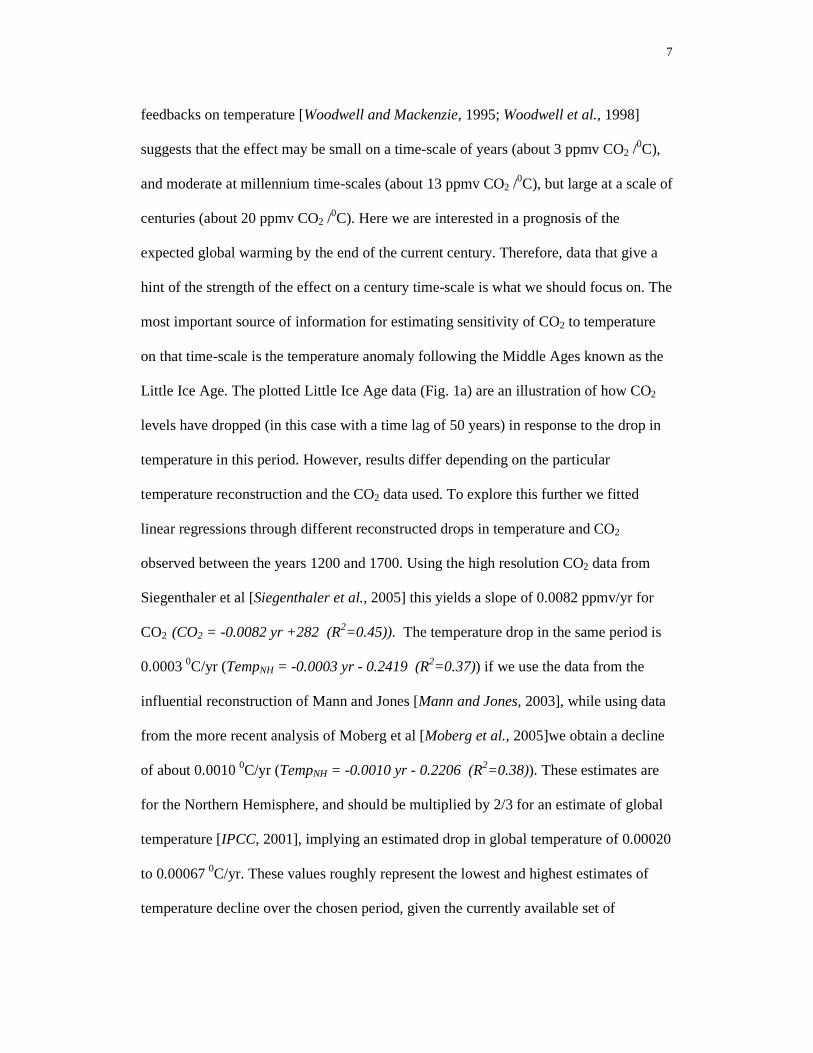
feedbacks on temperature [Woodwell and Mackenzie, 1995; Woodwell et al., 1998]
suggests that the effect may be small on a time-scale of years (about 3 ppmv CO2 /0C),
and moderate at millennium time-scales (about 13 ppmv CO2 /0C), but large at a scale of
centuries (about 20 ppmv CO2 /0C). Here we are interested in a prognosis of the
expected global warming by the end of the current century. Therefore, data that give a
hint of the strength of the effect on a century time-scale is what we should focus on. The
most important source of information for estimating sensitivity of CO2 to temperature
on that time-scale is the temperature anomaly following the Middle Ages known as the
Little Ice Age. The plotted Little Ice Age data (Fig. 1a) are an illustration of how CO2
levels have dropped (in this case with a time lag of 50 years) in response to the drop in
temperature in this period. However, results differ depending on the particular
temperature reconstruction and the CO2 data used. To explore this further we fitted
linear regressions through different reconstructed drops in temperature and CO2
observed between the years 1200 and 1700. Using the high resolution CO2 data from
Siegenthaler et al [Siegenthaler et al., 2005] this yields a slope of 0.0082 ppmv/yr for
CO2 (CO2 = -0.0082 yr +282 (R2=0.45)). The temperature drop in the same period is
0.0003 0C/yr (TempNH = -0.0003 yr - 0.2419 (R2=0.37)) if we use the data from the
influential reconstruction of Mann and Jones [Mann and Jones, 2003], while using data
from the more recent analysis of Moberg et al [Moberg et al., 2005]we obtain a decline
of about 0.0010 0C/yr (TempNH = -0.0010 yr - 0.2206 (R2=0.38)). These estimates are
for the Northern Hemisphere, and should be multiplied by 2/3 for an estimate of global
temperature [IPCC, 2001], implying an estimated drop in global temperature of 0.00020
to 0.00067 0C/yr. These values roughly represent the lowest and highest estimates of
temperature decline over the chosen period, given the currently available set of

8
plausible large-scale temperature reconstructions. If we assume that the CO2 drop
during the Little Ice Age was due to the temperature drop, combining this with the
estimated 0.0082 ppmv drop in CO2 we arrive at an estimated carbon sensitivity (α) to
temperature of 41 (following Mann and Jones) to 12 (following Moberg et al) ppmv
CO2 /0C. For an estimated temperature sensitivity (δ) of 0.0107 0C/ppmv CO2 this
implies a feedback effect (1/(1- δ α) of 1.15 (following Moberg et al) to 1.78 (following
Mann and Jones). Note that the uncertainty in the slope of the ‘IPCC greenhouse effect’
(1.5-4.5 0C) also translates into uncertainty of the magnitude of the feedback (estimated
feedbacks become for Moberg 1.07 to 1.25 and for Mann and Jones 1.28 -2.93). This
highlights that it is crucial to reduce our uncertainty in the relationships needed to
estimate the overall feedback effect. However, it also highlights the fact that the real
system simply seems to be quite sensitive.
[11] The estimated feedback effect might be conservative, as higher temperatures are
also likely to promote concentrations of methane [Woodwell et al., 1998; Petit et al.,
1999] and N2O [Leuenberger and Siegenthaler, 1992]. Although, these relationships
have received somewhat less attention, the synergy implies that the overall positive
effect of warming on greenhouse gases is substantially larger than would be inferred
from the feedback on CO2 alone.
4. Discussion
[12] Admittedly, our approach is rather crude as we base our estimation on time series
showing the lumped effects of all slow and fast mechanisms. Although we differentiate
between feedback strengths inferred for different time-scales, our quasi-equilibrium
approach cannot produce more than a rough estimate. Also, there are obvious
9
differences between the period from 1200 till 1700, on which the estimate of the century
scale feedback strength is based and current conditions. Some of these such as enhanced
nutrient availability may tend to reduce atmospheric carbon concentrations, while others
may push the balance to the other direction.
[13] The main merit of our approach as we see it, is that it allows for an estimate of
the potential boost in global warming by century-scale feedbacks which is quite
independent from that provided by coupled CO2-climate models that explicitly simulate
a suite of mechanisms. Like our approach these models have considerable uncertainty.
Not only are the quantitative representations of the mechanisms in the models uncertain,
there is also always an uncertainty related to the fact that we are not sure whether all
important mechanisms have been accounted for in the models. In view of the
independence of our approach it is encouraging that our estimate of a boost in global
warming corresponds roughly to what was found in simulation studies [Cox et al.,
2000; Prentice et al., 2001; Friedlingstein et al., 2003]. As Levins [Levins, 1966] once
phrased it, one is more likely to accept something as the truth when it emerges "as the
intersection of independent lies". Although "lies" may sound a bit too harsh for the
models involved, both our approach and the large simulation models clearly have their
shortcomings. Interpreting our results in this spirit, they enhance the credibility of the
view that over the coming century we might see a considerable boost of global warming
and greenhouse gas levels compared to recent trends.
5. Acknowledgements
10
We wish to thank Anders Moberg, Marcel Meinders and two anonymous reviewers for
digging deep into this matter and giving advices that helped much in improving the
manuscript.
References
Archer, D., P. Martin, B. Buffet, V. Brovkin, S. Rahmstorf, and A. Ganaploski (2004) The importance of ocean temperature to global biogeochemistry, Earth and Planetary Science Letters, 222 (2), 333-348.
Budyko, M.I. (1982) The Earth's Climate: Past and Future, Academic Press, New York.
Cox, P.M., R.A. Betts, C.D. Jones, S.A. Spall, and I.J. Totterdell (2000) Acceleration of global warming due to carbon-cycle feedbacks in a coupled climate model (vol 408, pg 184, 2000), Nature, 408 (6813), 750.
Etheridge, D.M., L.P. Steele, R.L. Langenfelds, R.J. Francey, J.M. Barnola, and V.I. Morgan (1996) Natural and anthropogenic changes in atmospheric CO2 over the last 1000 years from air in Antarctic ice and firn, J. Geophys. Res.-Atmos., 101 (D2), 4115-4128.
Friedlingstein, P., L. Bopp, P. Ciais, J.L. Dufresne, L. Fairhead, H. LeTreut, P. Monfray, and J. Orr (2001) Positive feedback between future climate change and the carbon cycle, Geophysical Research Letters, 28 (8), 1543-1546.
Friedlingstein, P., P. Cox, R. Betts, L. Bopp, W. von Bloh, V. Brovkin, P. Cadule, S. Doney, M. Eby, I. Fung, G. Bala, J. John, C. Jones, F. Joos, T. Kato, M. Kawamiya, W. Knorr, K. Lindsay, H.D. Matthews, T. Raddatz, P. Rayner, C. Reick, E. Roeckner, K.-G. Schnitzler, R. Schnur, K. Strassmann, A.J. Weaver, C. Yoshikawa, and N. Zeng (in press) Climate –carbon cycle feedback analysis, results from the C4MIP model intercomparison, Journal of Climate.
Friedlingstein, P., J.L. Dufresne, P.M. Cox, and P. Rayner (2003) How positive is the feedback between climate change and the carbon cycle?, Tellus Series B-Chemical and Physical Meteorology, 55 (2), 692-700.
IPCC (2001) Climate Change 2001: Synthesis Report. A Contribution of Working Groups I, II, and III to the Third Assessment Report of the Integovernmental Panel on Climate Change, Cambridge University Press.
Kellogg, W.W. (1983) Feedback mechanisms in the climate system affecting future levels of carbon dioxide, J. Geophys. Res., 88C, 1263-1269.
Lashof, D.A. (1989) The dynamic greenhouse - Feedback processes that may influence future concentrations of atmospheric trace gases and climatic change, Clim. Change., 14 (3), 213-242.
Lashof, D.A., B.J. DeAngelo, S.R. Saleska, and J. Harte (1997) Terrestrial ecosystem feedbacks to global climate change, Annu. Rev. Energ. Environ., 22, 75-118.
Leuenberger, M., and U. Siegenthaler (1992) Ice-age atmospheric concentration of nitrous-oxide from an Antarctic ice core, Nature, 360 (6403), 449-451.
Levins, R. (1966) The strategy of model building in population biology, Am. Sci., 54 (4), 421-431.

11
Mann, M.E., and P.D. Jones (2003) Global surface temperatures over the past two millennia, Geophysical Research Letters, 30 (15).
Moberg, A., D.M. Sonechkin, K. Holmgren, N.M. Datsenko, and W. Karlen (2005) Highly variable Northern Hemisphere temperatures reconstructed from low- and high-resolution proxy data, Nature, 433 (7026), 613-617.
Petit, J.R., J. Jouzel, D. Raynaud, N.I. Barkov, J.M. Barnola, I. Basile, M. Bender, J. Chappellaz, M. Davis, G. Delaygue, M. Delmotte, V.M. Kotlyakov, M. Legrand, V.Y. Lipenkov, C. Lorius, L. Pepin, C. Ritz, E. Saltzman, and M. Stievenard (1999) Climate and atmospheric history of the past 420,000 years from the Vostok ice core, Antarctica, Nature, 399 (6735), 429-436.
Prentice, I.C., G.D. Farquhar, M.J.R. Fasham, M.L. Goulden, M. Heimann, V.J. Jaramillo, H.S. Kheshgi, C. Le Quere, R.J. Scholes, D.W.R. Wallace, D. Archer, M.R. Ashmore, O. Aumont, D. Baker, M. Battle, M. Bender, L.P. Bopp, P. Bousquet, K. Caldeira, P. Ciais, P.M. Cox, W. Cramer, F. Dentener, I.G. Enting, C.B. Field, P. Friedlingstein, E.A. Holland, R.A. Houghton, J.I. House, A. Ishida, A.K. Jain, I.A. Janssens, F. Joos, T. Kaminski, C.D. Keeling, R.F. Keeling, D.W. Kicklighter, K.E. Hohfeld, W. Knorr, R. Law, T. Lenton, K. Lindsay, E. Maier-Reimer, A.C. Manning, R.J. Matear, A.D. McGuire, J.M. Melillo, R. Meyer, M. Mund, J.C. Orr, S. Piper, K. Plattner, P.J. Rayner, S. Sitch, R. Slater, S. Taguchi, P.P. Tans, H.Q. Tian, M.F. Weirig, T. Whorf, and A. Yool, The carbon cycle and atmospheric carbon dioxide, in Third Assessment Report of the Intergovernmental Panel on Climate Change. Climate Change 2001: The Scientific Basis., edited by IPCC, pp. 183-238, Cambridge University Press, Cambridge, UK, 2001.
Siegenthaler, U., E. Monnin, K. Kawamura, R. Spahni, J. Schwander, B. Stauffer, T.F. Stocker, J.-M. Barnola, and H. Fischer (2005) Supporting evidence from the EPICA Dronning Maud Land ice core for atmospheric CO2 changes during the past millennium, Tellus B, 57 (1), 51-57.
Stainforth, D.A., T. Aina, C. Christensen, M. Collins, N. Faull, D.J. Frame, J.A. Kettleborough, S. Knight, A. Martin, J.M. Murphy, C. Piani, D. Sexton, L.A. Smith, R.A. Spicer, A.J. Thorpe, and M.R. Allen (2005) Uncertainty in predictions of the climate response to rising levels of greenhouse gases, Nature, 433 (7024), 403-406.
Woodwell, G.M., and F.T. Mackenzie, Biotic Feedbacks in the Global Climatic System: Will the Warming Feed the Warming?, pp. 416, Oxford University Press, Oxford, 1995.
Woodwell, G.M., F.T. Mackenzie, R.A. Houghton, M. Apps, E. Gorham, and E. Davidson (1998) Biotic feedbacks in the warming of the earth, Clim. Change., 40 (3-4), 495-518.

12
Figure 1.
Relationships between past atmospheric CO2 concentrations and reconstructed
temperatures. (a) Reconstructed smoothed Northern Hemisphere temperatures of the
period 1500-1600 following Moberg et al [Moberg et al., 2005] plotted against CO2
levels 50 years later as estimated from a smoothed time series from the Law Dome
record [Etheridge et al., 1996]. (b) A regression of CO2 against temperature (lower
panel) for a 400.000 years period of glacial cycles reconstructed from the Vostok ice
core. Slopes of the fitted lines are 50.6 ppmv CO2/0C for Little Ice Age(a) and are 8.7
ppmv CO2/0C for the glacial cycles (b).

13
Figure 2
An illustration of how effects of atmospheric carbon on equilibrium global temperature
(T’=0 in panel a), and effects of global temperature on the equilibrium level of
atmospheric carbon (C’=0 in panel b) can be interpreted to lead to an equilibrium of
the interactive system (dot in panel c). Arrows indicate the direction of change if the
system is out of equilibrium. Note that temperature change will be faster than
atmospheric carbon change. Hence, arrows in panel c do not show precise direction.
Rather they serve to illustrate that the intersection represents a stable node.
14
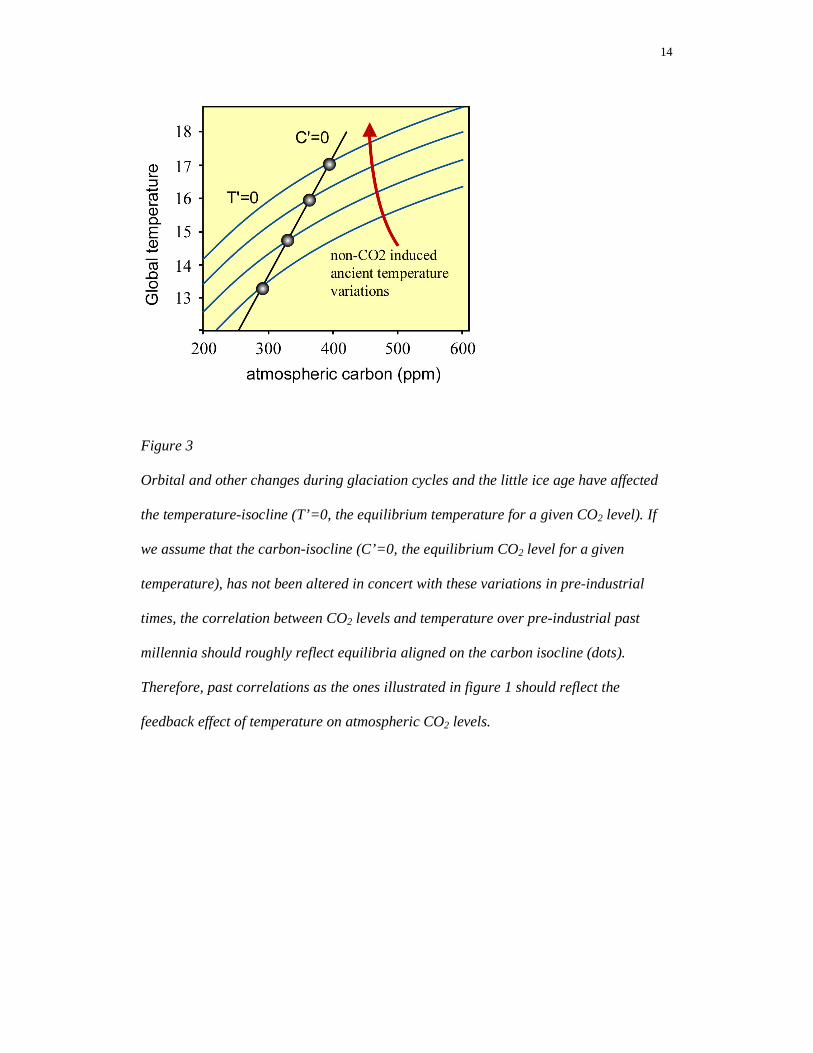
Figure 3
Orbital and other changes during glaciation cycles and the little ice age have affected
the temperature-isocline (T’=0, the equilibrium temperature for a given CO2 level). If
we assume that the carbon-isocline (C’=0, the equilibrium CO2 level for a given
temperature), has not been altered in concert with these variations in pre-industrial
times, the correlation between CO2 levels and temperature over pre-industrial past
millennia should roughly reflect equilibria aligned on the carbon isocline (dots).
Therefore, past correlations as the ones illustrated in figure 1 should reflect the
feedback effect of temperature on atmospheric CO2 levels.
15
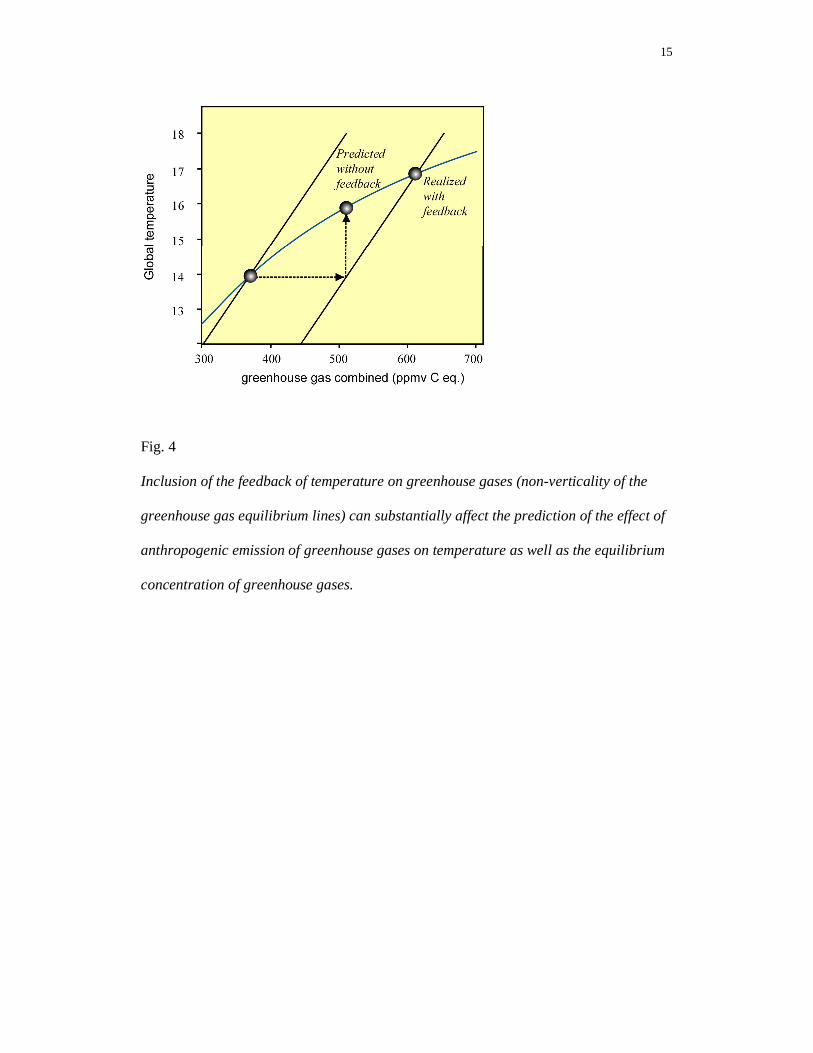
Fig. 4
Inclusion of the feedback of temperature on greenhouse gases (non-verticality of the
greenhouse gas equilibrium lines) can substantially affect the prediction of the effect of
anthropogenic emission of greenhouse gases on temperature as well as the equilibrium
concentration of greenhouse gases.