Embed Size (px)
Citation preview
Lehman Brothers 6th Annual Worldwide Wireless and Wireline ConferenceNYC, June 3, 2005
Christoph CaselitzPresident Siemens Communications Mobile Networks
Positioning to Win
Safe Harbor Statement
This presentation contains forward-looking statements and information – that is, statements related to future, not past, events. These statements may be identified either orally or in writing by words as “expects,” “anticipates,” “intends,” “plans,” “believes,” “seeks,” “estimates,” “will” or words of similar meaning. Such statements are based on our current expectations and certain assumptions, and are, therefore, subject to certain risks and uncertainties. A variety of factors, many of which are beyond Siemens' control, affect its operations, performance, business strategy and results and could cause the actual results, performance or achievements of Siemens worldwide to be materially different from any future results, performance or achievements that may be expressed or implied by such forward-looking statements. For us, particular uncertainties arise, among others, from changes in general economic and business conditions, changes in currency exchange rates and interest rates, introduction of competing products or technologies by other companies, lack of acceptance of new products or services by customers targeted by Siemens worldwide, changes in business strategy and various other factors. More detailed information about certain of these factors is contained in Siemens' filings with the SEC, which are available on the Siemens website, www.siemens.com and on the SEC's website, www.sec.gov. Should one or more of these risks or uncertainties materialize, or should underlying assumptions prove incorrect, actual results may vary materially from those described in the relevant forward-looking statement as anticipated, believed, estimated, expected, intended, planned or projected. Siemens does not intend or assume any obligation to update or revise these forward-looking statements in light of developments which differ from those anticipated.
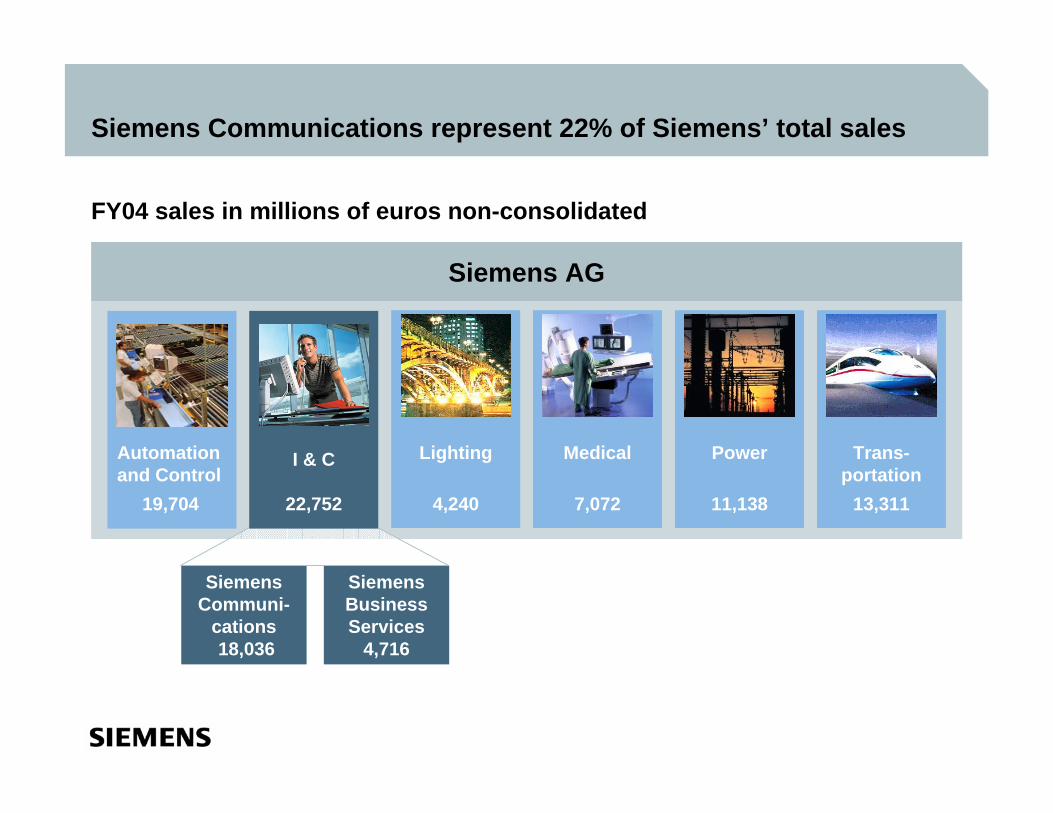
Siemens AG
Trans-portation
13,311
Power
11,138
Medical
7,072
Lighting
4,240
Automation and Control
19,704
FY04 sales in millions of euros non-consolidated
Siemens Communications represent 22% of Siemens’ total sales
Siemens Communi-
cations18,036
Siemens Business Services
4,716
I & C
22,752
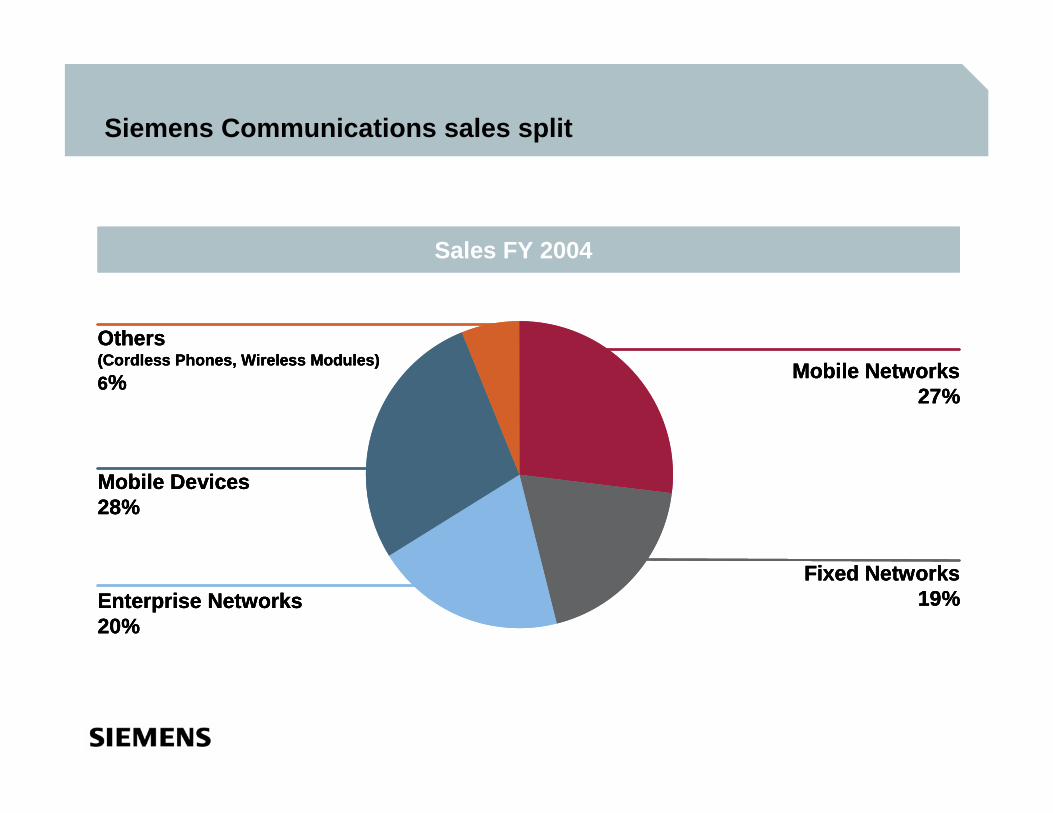
Siemens Communications sales split
Sales FY 2004
Others(Cordless Phones, Wireless Modules)6%
Mobile Devices28%
Fixed Networks19%
Mobile Networks 27%
Enterprise Networks 20%
Sales FY 2004
Others(Cordless Phones, Wireless Modules)6%
Mobile Devices28%
Fixed Networks19%
Mobile Networks 27%
Enterprise Networks 20%
Sales FY 2004
Others(Cordless Phones, Wireless Modules)6%
Mobile Devices28%
Fixed Networks19%
Mobile Networks 27%
Enterprise Networks 20%
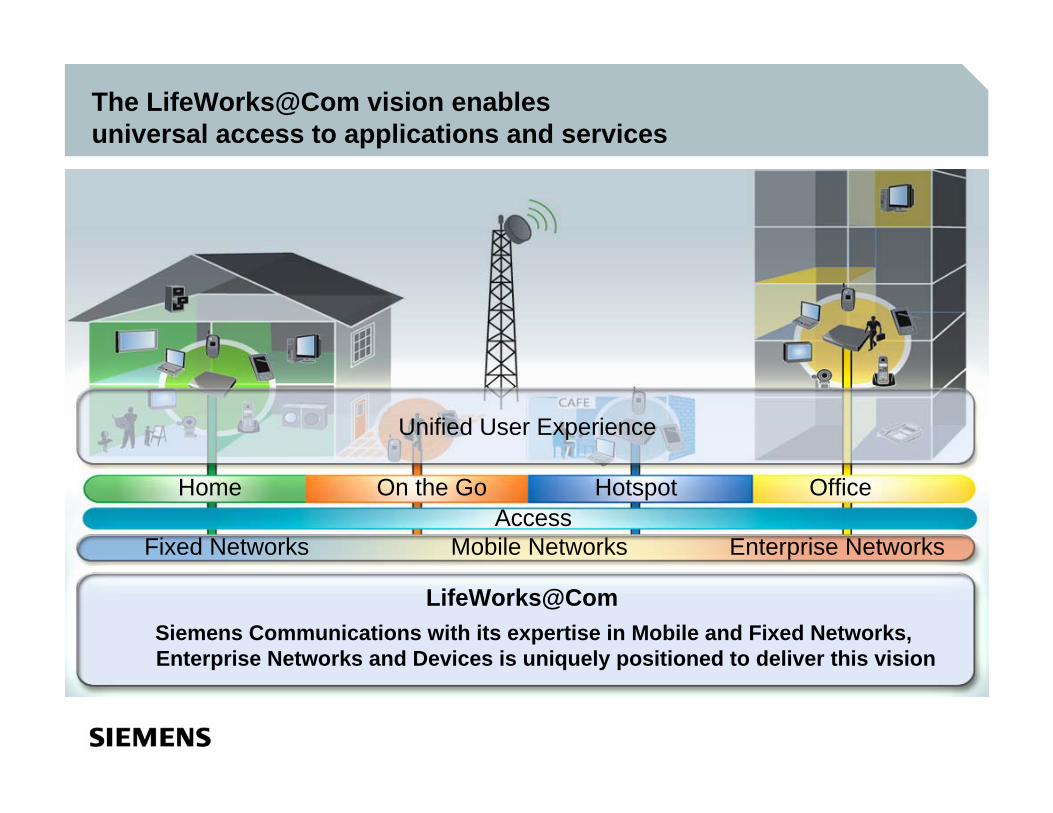
The LifeWorks@Com vision enables universal access to applications and services
Siemens Communications with its expertise in Mobile and Fixed Networks, Enterprise Networks and Devices is uniquely positioned to deliver this vision
LifeWorks@Com
AccessFixed Networks Mobile Networks Enterprise Networks
Unified User Experience
Home On the Go Hotspot Office
0
175
350
525
700
Latin America Mideast & Africa Asia Pacific
Total mobile subscriber baseGSM subscriber base
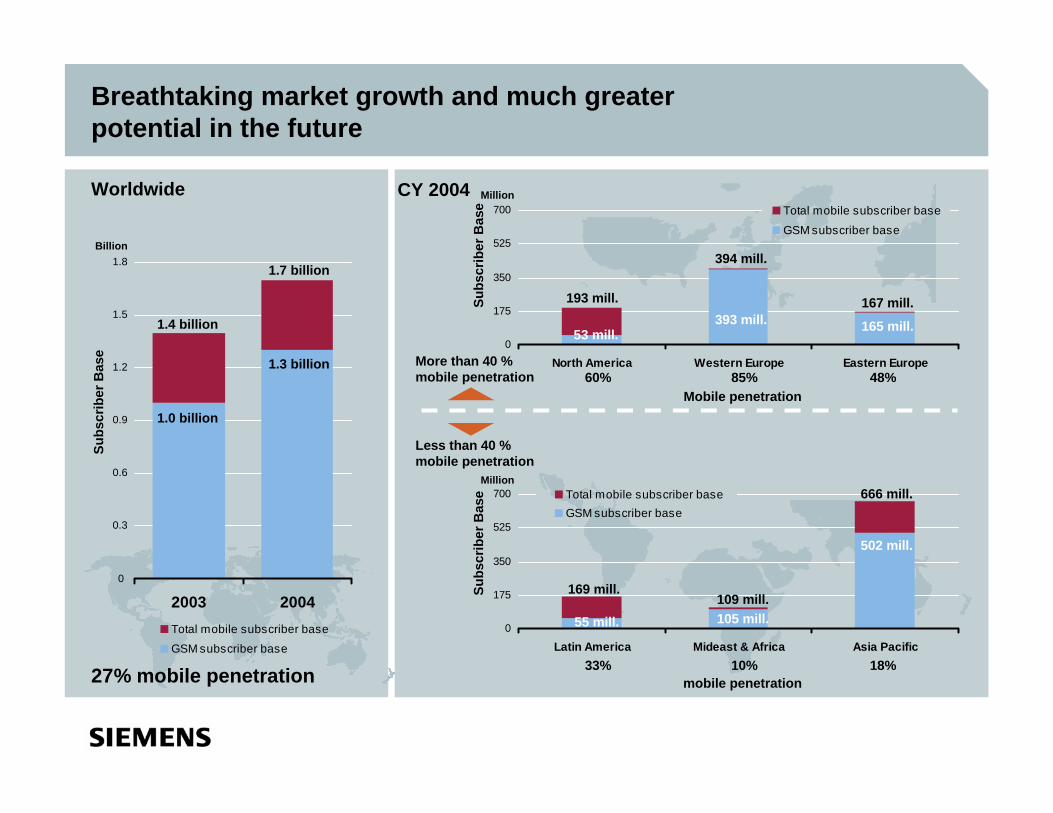
Breathtaking market growth and much greater potential in the future
Worldwide
More than 40 % mobile penetration
Less than 40 % mobile penetration
0,0
0,3
0,6
0,9
1,2
1,5
1,8
2003 2004Total mobile subscriber baseGSM subscriber base
1.0 billion
1.4 billion
Billion
1.3 billion
1.7 billion
27% mobile penetration
0
175
350
525
700
North America Western Europe Eastern Europe
Total mobile subscriber base
GSM subscriber base
48%85%60%
Subs
crib
er B
ase
Subs
crib
er B
ase
193 mill.
53 mill.
394 mill.
393 mill.167 mill.
165 mill.
Subs
crib
er B
ase
169 mill.
55 mill.109 mill.105 mill.
666 mill.
502 mill.
18%10%33%
Mobile penetration
CY 2004
mobile penetration
Million
1.8
1.5
1.2
0.9
0.6
0.3
0
Million
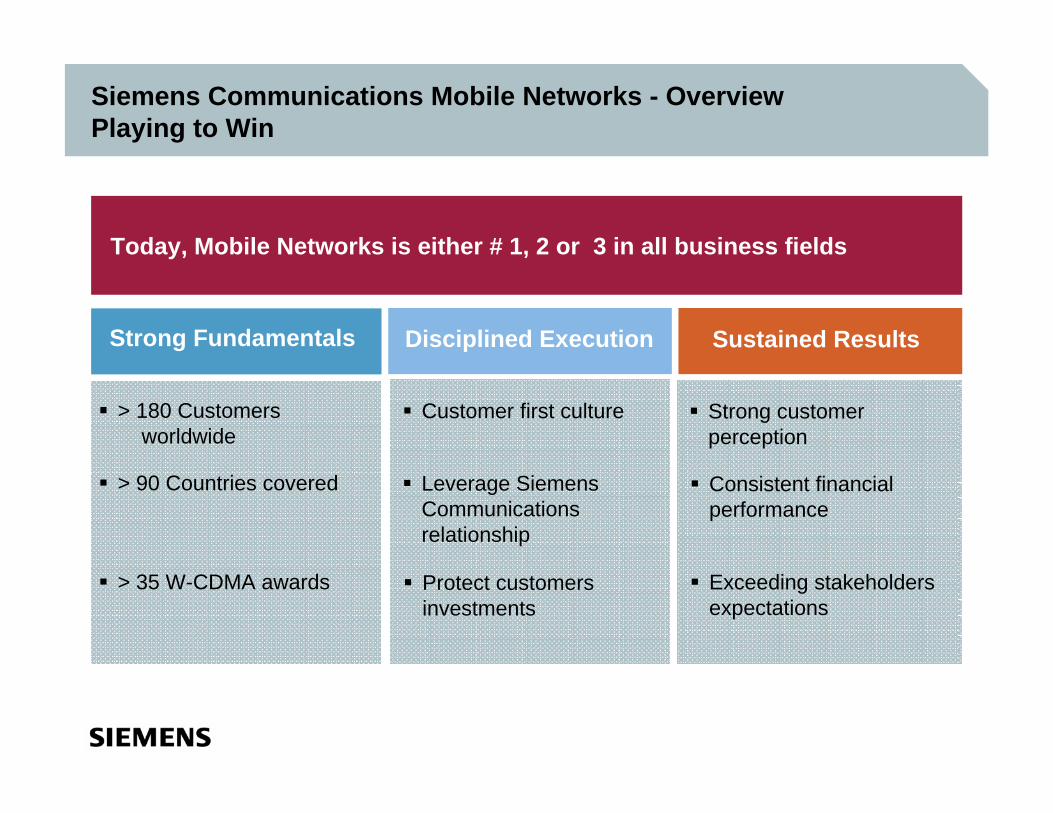
Siemens Communications Mobile Networks - OverviewPlaying to Win
Today, Mobile Networks is either # 1, 2 or 3 in all business fields
Strong Fundamentals Disciplined Execution Sustained Results
> 180 Customersworldwide
Customer first culture Strong customer perception
> 90 Countries covered
> 35 W-CDMA awards
Leverage Siemens Communications relationship
Protect customers investments
Consistent financial performance
Exceeding stakeholders expectations
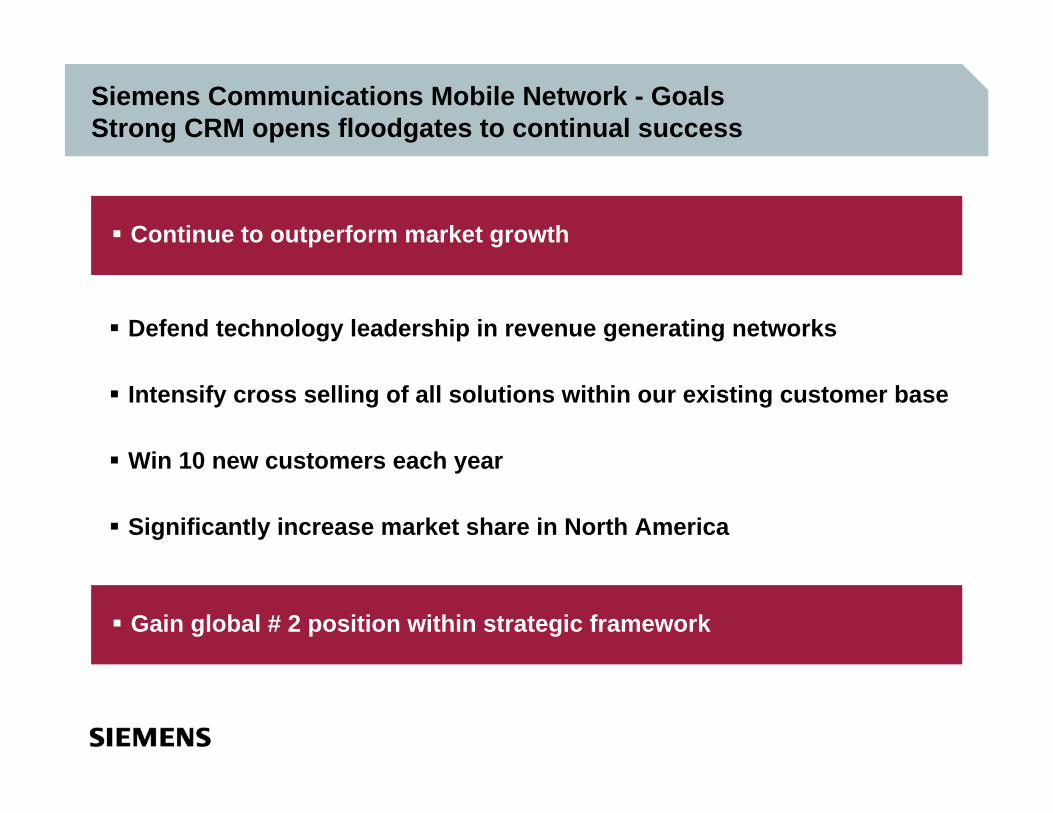
Siemens Communications Mobile Network - GoalsStrong CRM opens floodgates to continual success
Continue to outperform market growth
Defend technology leadership in revenue generating networks
Intensify cross selling of all solutions within our existing customer base
Win 10 new customers each year
Significantly increase market share in North America
Gain global # 2 position within strategic framework
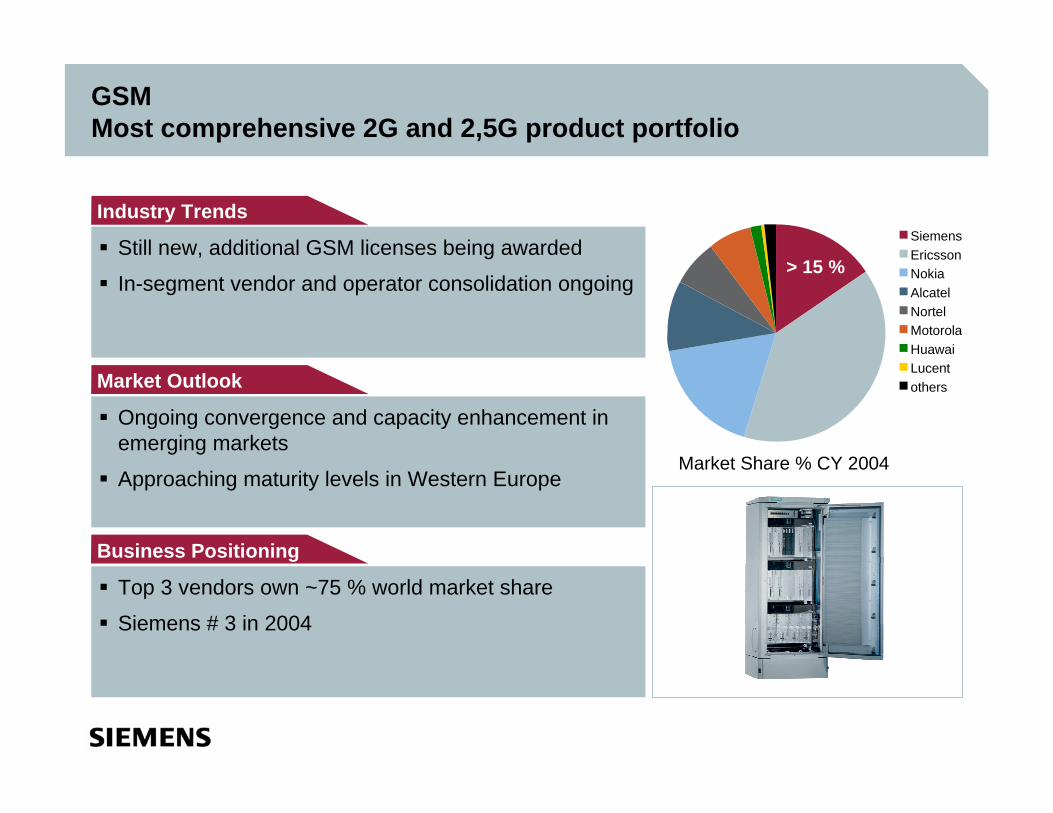
GSMMost comprehensive 2G and 2,5G product portfolio
Market Share % CY 2004
Still new, additional GSM licenses being awarded
In-segment vendor and operator consolidation ongoing
Industry Trends
Ongoing convergence and capacity enhancement in emerging markets
Approaching maturity levels in Western Europe
Market Outlook
Top 3 vendors own ~75 % world market share
Siemens # 3 in 2004
Business Positioning
> 15 %
SiemensEricssonNokiaAlcatelNortelMotorolaHuawaiLucentothers
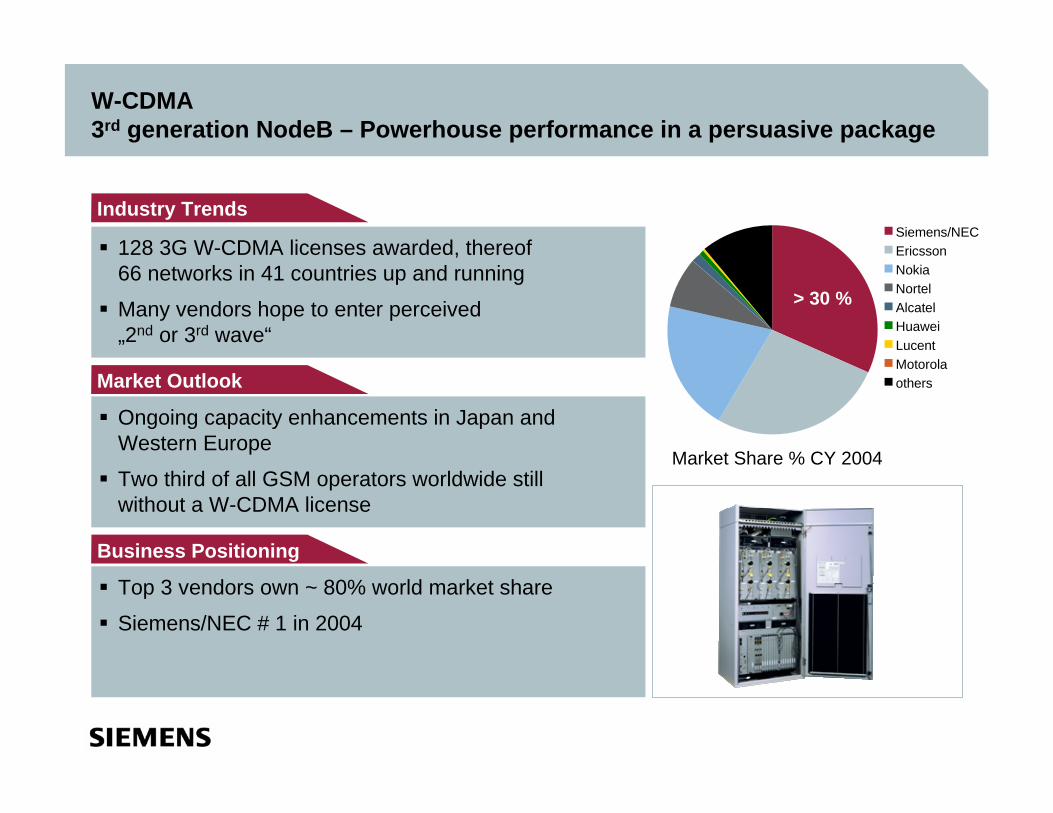
W-CDMA3rd generation NodeB – Powerhouse performance in a persuasive package
128 3G W-CDMA licenses awarded, thereof 66 networks in 41 countries up and running
Many vendors hope to enter perceived „2nd or 3rd wave“
Ongoing capacity enhancements in Japan and Western Europe
Two third of all GSM operators worldwide still without a W-CDMA license
Top 3 vendors own ~ 80% world market share
Siemens/NEC # 1 in 2004
Industry Trends
Market Outlook
Business Positioning
Market Share % CY 2004
> 30 %
Siemens/NECEricssonNokiaNortelAlcatelHuaweiLucentMotorolaothers
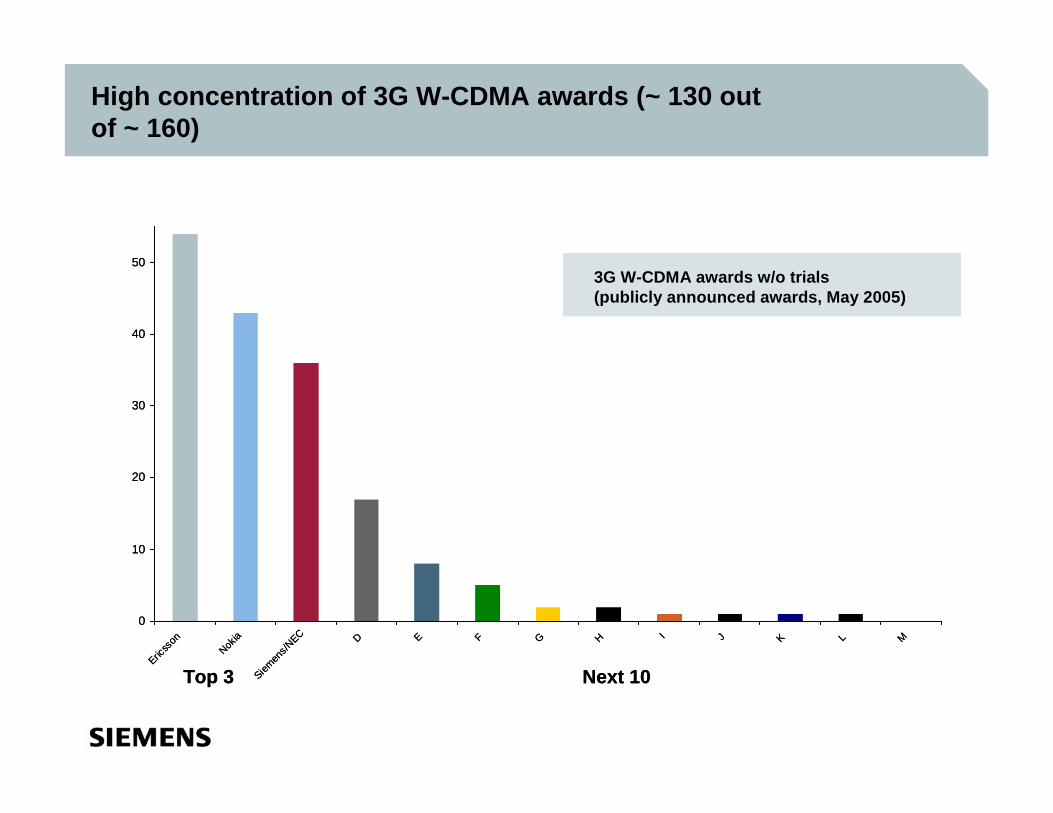
High concentration of 3G W-CDMA awards (~ 130 out of ~ 160)
0
10
20
30
40
50
Ericss
on
Nokia
Siemen
s/NEC D E F G H I J K L M
Top 3 Next 10
3G W-CDMA awards w/o trials(publicly announced awards, May 2005)
0
10
20
30
40
50
Ericss
on
Nokia
Siemen
s/NEC D E F G H I J K L M
Top 3 Next 10
3G W-CDMA awards w/o trials(publicly announced awards, May 2005)3G W-CDMA awards w/o trials(publicly announced awards, May 2005)
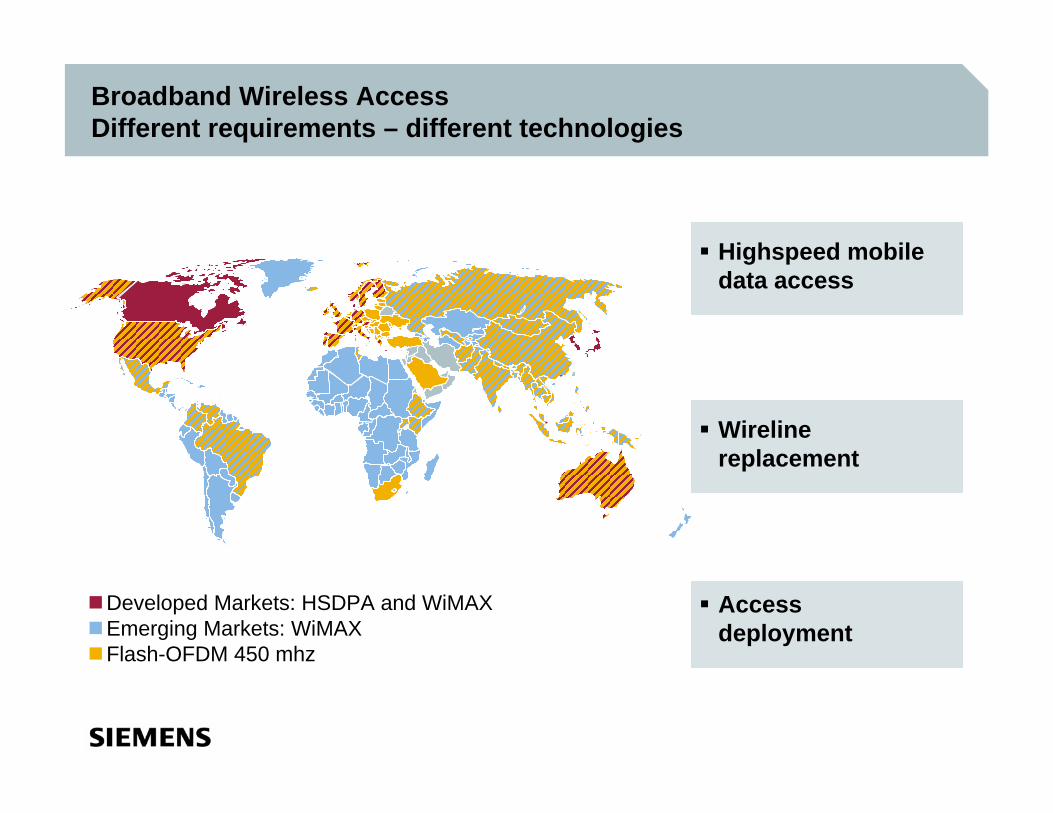
Broadband Wireless AccessDifferent requirements – different technologies
Developed Markets: HSDPA and WiMAXEmerging Markets: WiMAXFlash-OFDM 450 mhz
Highspeed mobile data access
Wireline replacement
Access deployment
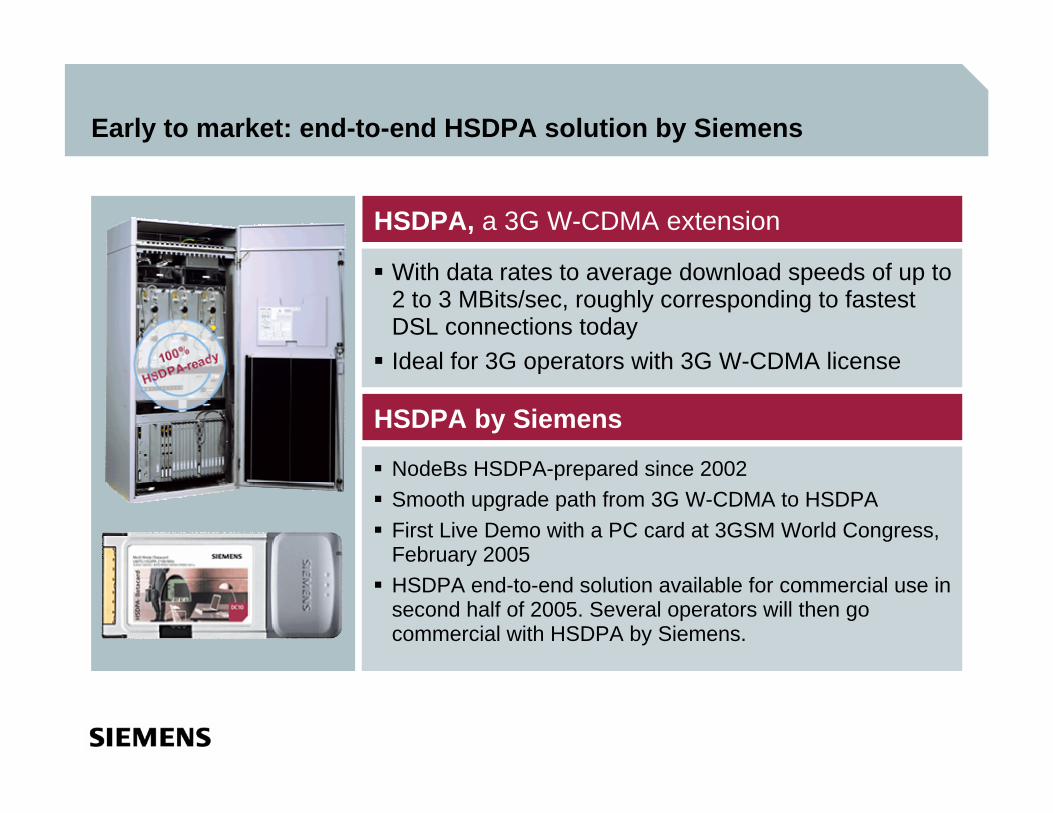
Early to market: end-to-end HSDPA solution by Siemens
With data rates to average download speeds of up to 2 to 3 MBits/sec, roughly corresponding to fastest DSL connections todayIdeal for 3G operators with 3G W-CDMA license
NodeBs HSDPA-prepared since 2002Smooth upgrade path from 3G W-CDMA to HSDPA First Live Demo with a PC card at 3GSM World Congress, February 2005HSDPA end-to-end solution available for commercial use in second half of 2005. Several operators will then go commercial with HSDPA by Siemens.
HSDPA, a 3G W-CDMA extension
HSDPA by Siemens
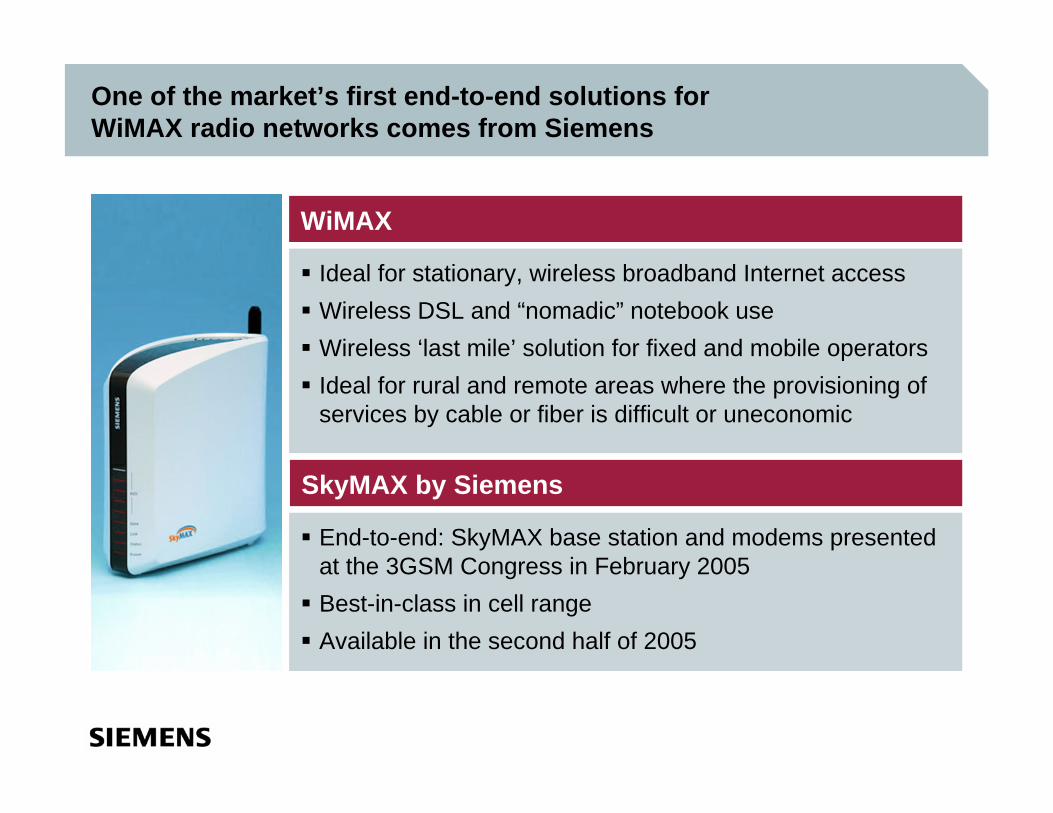
One of the market’s first end-to-end solutions for WiMAX radio networks comes from Siemens
Ideal for stationary, wireless broadband Internet accessWireless DSL and “nomadic” notebook useWireless ‘last mile’ solution for fixed and mobile operatorsIdeal for rural and remote areas where the provisioning of services by cable or fiber is difficult or uneconomic
End-to-end: SkyMAX base station and modems presented at the 3GSM Congress in February 2005Best-in-class in cell rangeAvailable in the second half of 2005
WiMAX
SkyMAX by Siemens
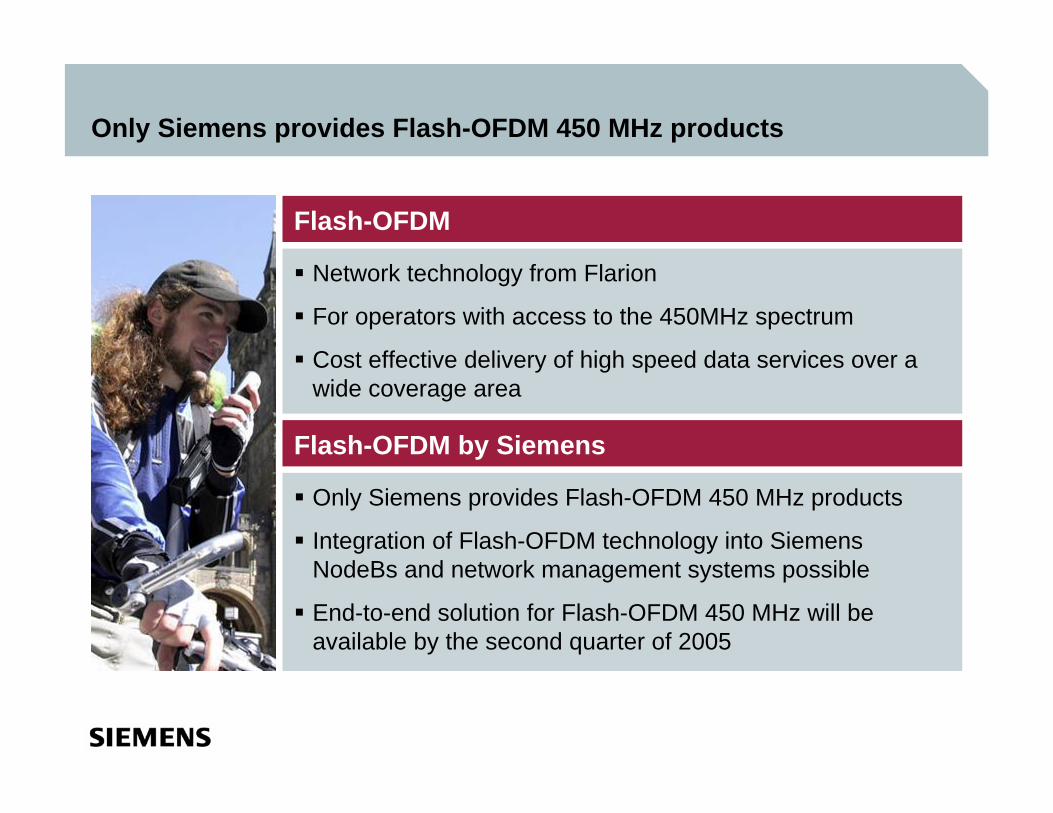
Only Siemens provides Flash-OFDM 450 MHz products
Network technology from Flarion
For operators with access to the 450MHz spectrum
Cost effective delivery of high speed data services over a wide coverage area
Flash-OFDM
Only Siemens provides Flash-OFDM 450 MHz products
Integration of Flash-OFDM technology into Siemens NodeBs and network management systems possible
End-to-end solution for Flash-OFDM 450 MHz will be available by the second quarter of 2005
Flash-OFDM by Siemens
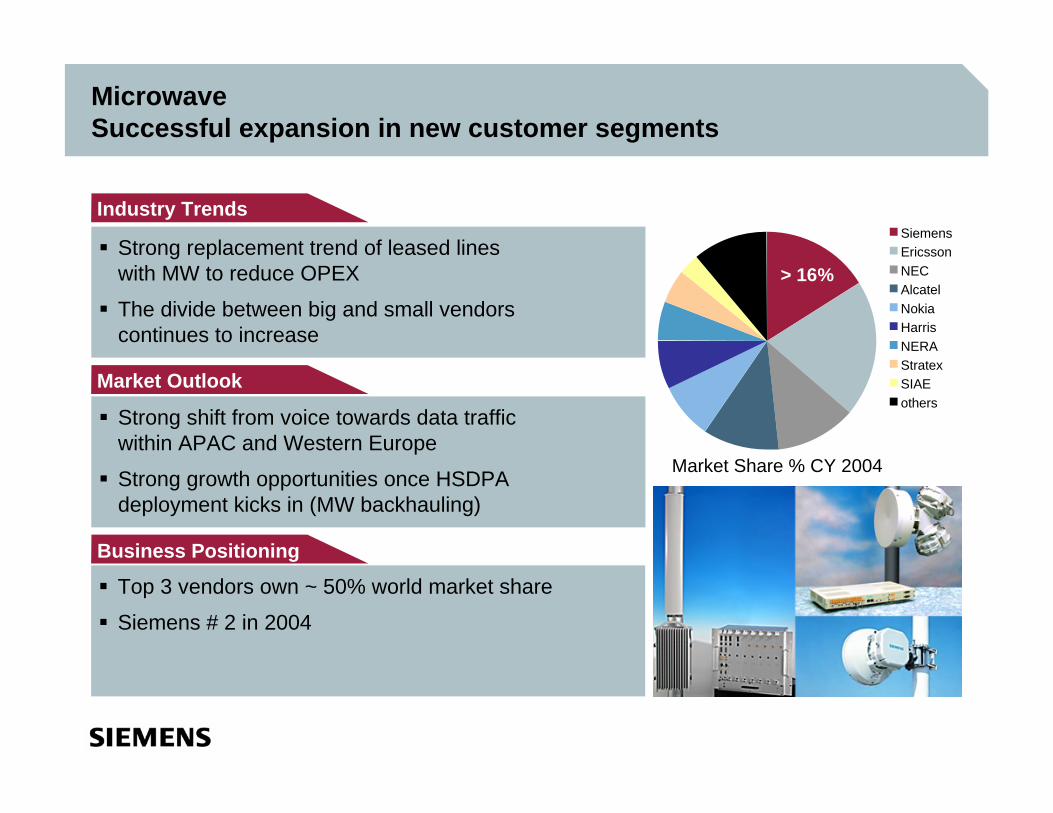
MicrowaveSuccessful expansion in new customer segments
Strong replacement trend of leased lines with MW to reduce OPEX
The divide between big and small vendors continues to increase
Strong shift from voice towards data traffic within APAC and Western Europe
Strong growth opportunities once HSDPA deployment kicks in (MW backhauling)
Positioning
Top 3 vendors own ~ 50% world market share
Siemens # 2 in 2004
Industry Trends
Market Outlook
Business Positioning
Market Share % CY 2004
> 16%
SiemensEricssonNECAlcatelNokiaHarrisNERAStratexSIAEothers
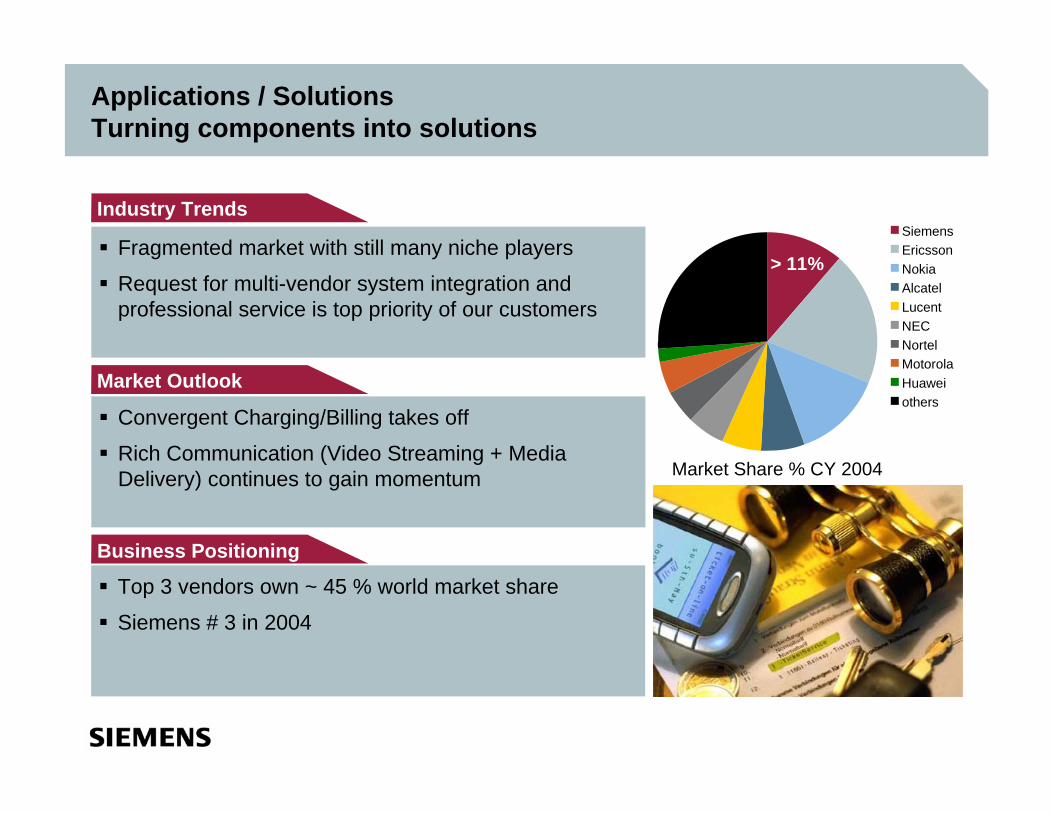
Applications / SolutionsTurning components into solutions
Fragmented market with still many niche players
Request for multi-vendor system integration and professional service is top priority of our customers
Convergent Charging/Billing takes off
Rich Communication (Video Streaming + Media Delivery) continues to gain momentum
Top 3 vendors own ~ 45 % world market share
Siemens # 3 in 2004
Industry Trends
Market Outlook
Business Positioning
Market Share % CY 2004
> 11%
SiemensEricssonNokiaAlcatelLucentNEC NortelMotorolaHuaweiothers
Summary
Continue to outperform market growth
Profitable Growth
Intensify cross selling of all solutions within our existing customer base
Defend technology leadership in revenue generating networks
Reconciliations and definitions
”Group profit from Operations” is reconciled to ”Income before income taxes” of Operations under ”Reconciliation to financial statements” on the table ”Segment information.” See ”Financial Reports/Fiscal 2005, Quarter 2 / Financial Statements” at our Investor Relations website under www.siemens.com
The allocated equity for SFS is determined and influenced by the respective credit ratings of the rating agencies and by the expected size and quality of its portfolio of leasing and factoring assets and equity investments and is determined annually. This allocation is designed to cover the risks of the underlying business and is in line with common credit risk management standards in banking. The actual risk profile of the SFS portfolio is monitored and controlled monthly and is evaluated against the allocated equity.
”ROE” (Return on equity) margin for SFS was calculated as SFS' income before income taxes divided by the allocated equity for SFS. Allocated equity for SFS as of September 30, 2004 was €1.015 billion. See also Siemens' Form 20-F at our Investor Relations website under www.siemens.com
Siemens ties a portion of its executive incentive compensation to achieving economic value added (EVA) targets. EVA measures the profitability of a business (using Group profit for the Operating Groups and income before income taxes for the Financing and Real estate businesses as a base) against the additional cost of capital used to run a business, (using Net capital employed for the Operating Groups and risk-adjusted equity for the Financing and Real estate businesses as a base). A positive EVA means that a business has earned more than its cost of capital, and is therefore defined as value-creating. A negative EVA means that a business is earning less than its cost of capital and is therefore defined as value-destroying. Other organizations that use EVA may define and calculate EVA differently.
A reconciliation of EVA may be found on our Investor Relations website under www.siemens.com
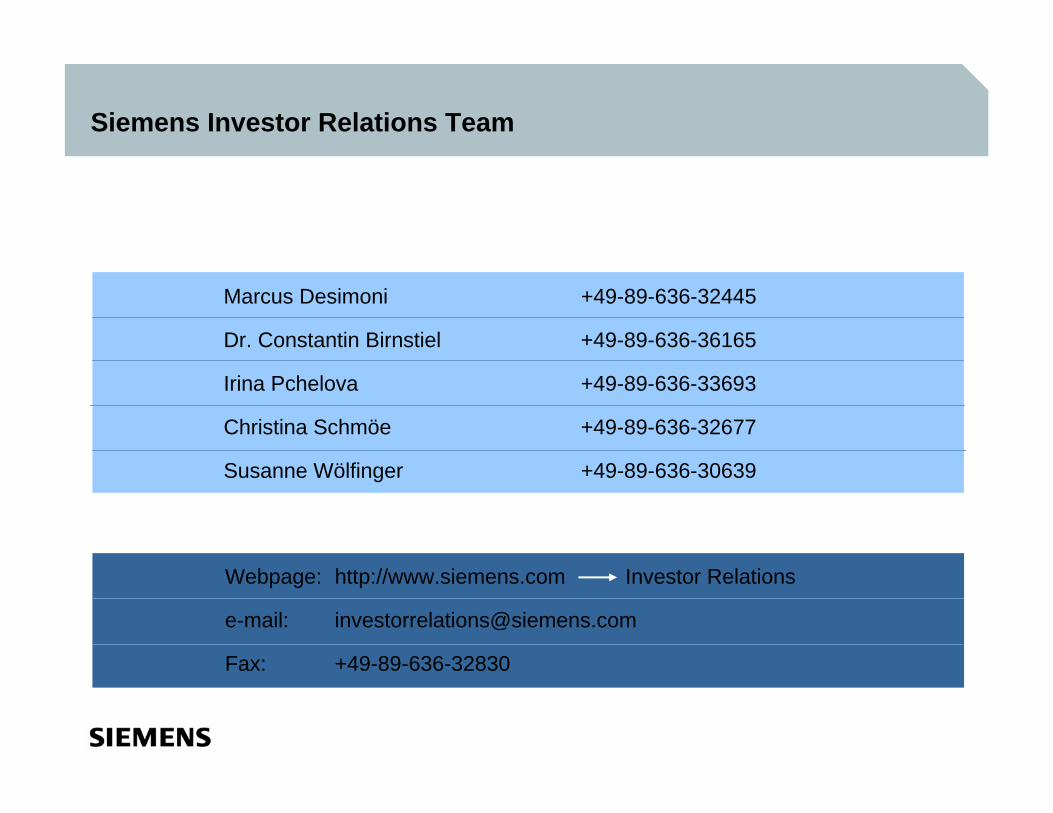
Siemens Investor Relations Team
Webpage: http://www.siemens.com Investor Relations
e-mail: [email protected]
Fax: +49-89-636-32830
Marcus Desimoni +49-89-636-32445
Dr. Constantin Birnstiel +49-89-636-36165
Irina Pchelova +49-89-636-33693
Christina Schmöe +49-89-636-32677
Susanne Wölfinger +49-89-636-30639