Embed Size (px)
Citation preview

Building on several of the tools already described, acompetitiveness positioning assessment providesstrategic direction to many of the actions that the
value chain implements to improve its competitiveness.This assessment and collaborative decision making informthe value chain’s leadership about the value chain’s productofferings, relative to competitors, in key markets. It alsoforms the foundation for developing a strategic vision and aclear, actionable plan for repositioning the industry in cur-rent markets and for penetrating new ones.
POSITIONING THE VALUE CHAIN
In a simple 2 x 2 matrix, the product or service of a company,value chain, or industry can be described in terms of productscope (complexity, value addition) and product differentia-tion (special qualities, lack of direct competitors). Productsand services in the lower left are basic commodities, subject tosevere price competition and very restricted profit margins.Products in the upper left have a lot of value added but maystill be under severe price competition. Products to theextreme right are highly differentiated and, in that respect,may be able to command higher prices and margins but havelittle value added. Of course, products and services in the topright are in “competitiveness nirvana,” commanding highprices and margins because of their complexity and specialqualities in the customer’s eye—all assuming, of course,that there is sufficient market demand to interest the valuechain participant.
One challenge for value chain participants is to decidewhere to position the chain’s products or services. Where isthe product currently positioned in the domestic or globalmarket? Where do we want it to be—and what are the qual-ity, service, and other requirements to be competitive in thatpositioning? What are the best global performers in any ofthe positions doing to be competitive? What are the profit
margins and likely market demand at each position? Whowill our competition be?
In the case of the cashmere industry (see figure 4.37),Mongolia produces the world’s best quality raw cashmere(wool from a breed of small goats) in the world. Mongoliaproduces very few value-added products (and virtuallynone of quality), so substantial exports are only in theform of raw cashmere or yarn. Mongolia exports most ofits cashmere to processors in Italy and Scotland, where thecashmere is processed and transformed into extremelyhigh-value garments and fashions. Figure 4.37 illustratesMongolia’s position in the world cashmere market relativeto major competitors and partners, with differentiationrepresented on the x-axis and product scope representedon the y-axis. (Note that this is an application of bench-marking introduced in tool 3). Each country’s marketshare as measured in revenues is represented by the relativesize of the circles. In most cases, higher profit per unit (andcertainly higher prices per unit) is implied by a position inthe top right corner. However, it is important for thisgraph to be interpreted in the context of local market con-ditions and the overall profit and profitability of the activ-ity.1 While the upper right quadrant is generally associatedwith high profitability, operations in the lower left may findthat high volumes of low value production may generatetotal profits that outweigh the premium pricing available atother positions.
China was also a major producer of finished cashmereproducts, but of lower quality than those produced inScotland and Italy. Seeking new and inexpensive sourcesof cashmere wool for their high-volume business, Chinesecashmere buyers competed with domestic wholesalersfor Mongolian wool stocks. However, Chinese buyers hadno incentive to encourage high quality as they planned tofeed low value-added industrial garment makers in China.Their advantage in the purchasing marketplace was to offer
105
Positioning Products and Value Chains for Greater Value and Competitiveness
TO O L 8
106 BUILDING COMPETITIVENESS IN AFRICA’S AGRICULTURE
immediate cash. With this incentive, Mongolian herdsmenwere ready to sell to Chinese buyers. The perceived need toprotect breed and wool quality suffered among herdsmenselling to undiscerning Chinese markets.
Mongolia’s downstream buyers recognized an oppor-tunity to increase the Mongolian product’s quality differ-entiation by offering price incentives for higher qualityand by implementing both a mark (certification) of quality
Box 4.10 Ecuadorian Cacao—Positioning the Value Chain for Greater Value and Competitiveness
Source: Lisa Carse and Martin Webber, J. E. Austin Associates, Inc.a Author interview with Karl Walk, purchaser for Blommer Chocolate, 2007.
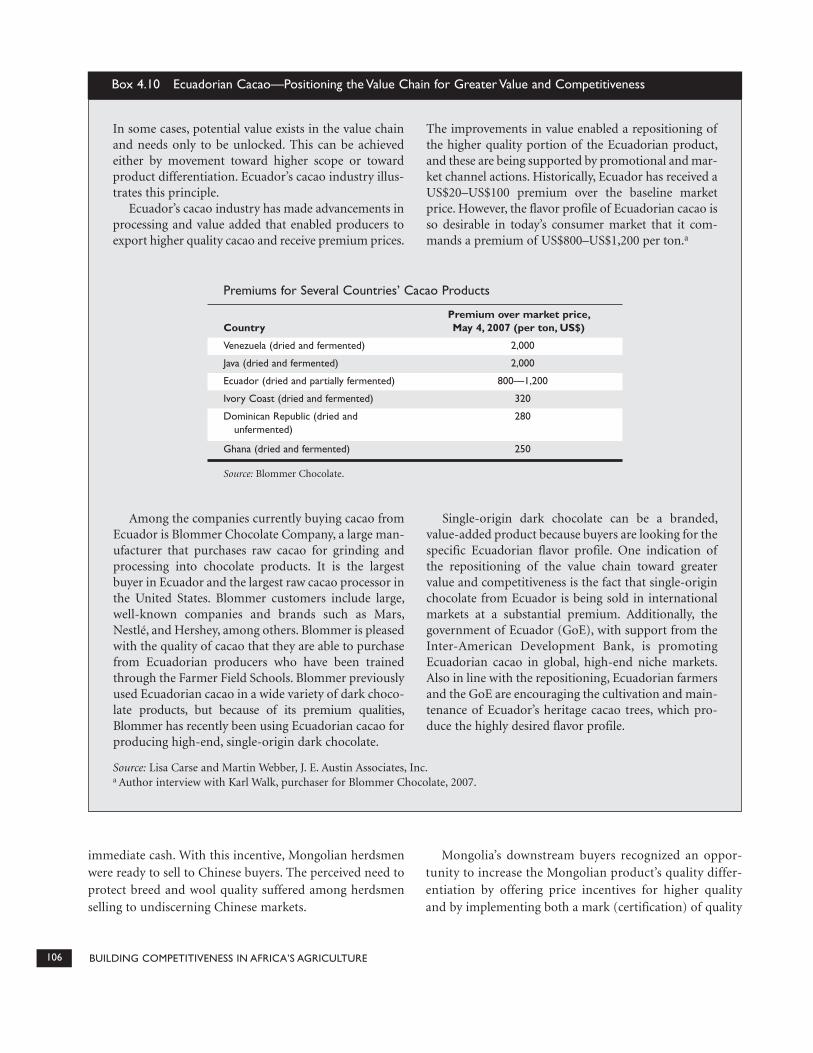
In some cases, potential value exists in the value chainand needs only to be unlocked. This can be achievedeither by movement toward higher scope or towardproduct differentiation. Ecuador’s cacao industry illus-trates this principle.
Ecuador’s cacao industry has made advancements inprocessing and value added that enabled producers toexport higher quality cacao and receive premium prices.
The improvements in value enabled a repositioning ofthe higher quality portion of the Ecuadorian product,and these are being supported by promotional and mar-ket channel actions. Historically, Ecuador has received aUS$20–US$100 premium over the baseline marketprice. However, the flavor profile of Ecuadorian cacao isso desirable in today’s consumer market that it com-mands a premium of US$800–US$1,200 per ton.a
Among the companies currently buying cacao fromEcuador is Blommer Chocolate Company, a large man-ufacturer that purchases raw cacao for grinding andprocessing into chocolate products. It is the largestbuyer in Ecuador and the largest raw cacao processor inthe United States. Blommer customers include large,well-known companies and brands such as Mars,Nestlé, and Hershey, among others. Blommer is pleasedwith the quality of cacao that they are able to purchasefrom Ecuadorian producers who have been trainedthrough the Farmer Field Schools. Blommer previouslyused Ecuadorian cacao in a wide variety of dark choco-late products, but because of its premium qualities,Blommer has recently been using Ecuadorian cacao forproducing high-end, single-origin dark chocolate.
Single-origin dark chocolate can be a branded,value-added product because buyers are looking for thespecific Ecuadorian flavor profile. One indication ofthe repositioning of the value chain toward greatervalue and competitiveness is the fact that single-originchocolate from Ecuador is being sold in internationalmarkets at a substantial premium. Additionally, thegovernment of Ecuador (GoE), with support from theInter-American Development Bank, is promotingEcuadorian cacao in global, high-end niche markets.Also in line with the repositioning, Ecuadorian farmersand the GoE are encouraging the cultivation and main-tenance of Ecuador’s heritage cacao trees, which pro-duce the highly desired flavor profile.
Premiums for Several Countries’ Cacao Products
CountryPremium over market price, May 4, 2007 (per ton, US$)
Venezuela (dried and fermented) 2,000
Java (dried and fermented) 2,000
Ecuador (dried and partially fermented) 800––1,200
Ivory Coast (dried and fermented) 320
Dominican Republic (dried andunfermented)
280
Ghana (dried and fermented) 250
Source: Blommer Chocolate.

TOOL 8: POSITIONING PRODUCTS AND VALUE CHAINS FOR GREATER VALUE AND COMPETITIVENESS 107
and a Mongolian brand. At the same time, design and man-ufacture of cashmere products in Mongolia was encouraged,which added value within the Mongolian industry.
The Mongolian cashmere industry understood theactions necessary to change its positioning in the value chainand acted to move to “the right” (greater differentiation) and
“upward” (more value added)—a more lucrative positioningwith less exposure to competitive pressures.
Once an objective is determined, value chain participantsmust decide which actions are necessary to achieve thedesired positioning. Boxes 4.10 and 4.11 provide briefexamples; case study 10 examines a case more deeply.
Leveraging Other Value Chain InitiativesBox 4.10 illustrated the concept of the hidden poten-tial in value chains. Key to realizing hidden potential invalue chains is the pursuit of greater product scopeand differentiation. Thailand’s Good AgriculturalPractices (GAP) cluster is an excellent example of suchan attempt.
Thailand’s agricultural sector is an important con-tributor to its economy. Thailand has one of the mostdeveloped agricultural product sectors in SoutheastAsia and has been a net exporter of agricultural prod-ucts for decades. It is known in international marketsfor the quality of its fresh and processed products, andproducers from both developed and developing coun-tries view it as a strong competitor.
The Thai GAP cluster carried out a major programto implement EurepGAP standards in western Thai-land to gain export certification to service its tradi-tional European supermarket business (discussed intool 9, box 4.12).The GAP cluster wanted to furtherleverage its achievement of EurepGAP standards indomestic Thai markets that have similar marketrequirements. Thailand has many large super- andhypermarkets in its urban areas, including foreign-owned retail outlets like Tesco and Carrefour thatdesire similar quality products for their customers.
Product PositioningAlthough value chain processes produced a qualityproduct that conformed to tough European standards,the Thai GAP cluster wanted to position those samequality products within local super- and hypermarketsin Thai urban areas. This would support a marketdiversification strategy that reduces the risks of relyingon exports linked to its investments in upgrading. Thecluster took some of the following initiatives to posi-tion itself as a quality vegetable producer:
1. Branding and certification: The cluster created thewestern cluster GAP logo and a grading process forits products, which was approved and certified by theDepartment of Agriculture. The logo and standardsappear on all producers’ packaging, and farmers areencouraged to promote the brand. The cluster hasalso done some local advertising of this brand name.
2. Unique shelf space: The cluster was able to workwith supermarkets to gain dedicated shelf space forits vegetables. This separated its products from theopen-air vegetables. This space was also brandedwith point-of-purchase (PoP) displays.
3. Packaging: The cluster created unique packagingthat highlighted product freshness and high quality,and it was also used to promote ready-to-eat vegeta-bles that were in demand by time-conscious urbanprofessionals.
SummaryTo leverage the quality improvements made withinthe value chain, the cluster positioned itself withinlocal markets that had similar requirements as exportmarkets by using branding, certification, unique shelfspace, and packaging that promoted quality andfreshness. These improvements are estimated to havegenerated a 50 percent increase in farmers’ bottomlines.
Businesses must make these choices with purpose,or they will simply be out-positioned by their com-petitors or buyers, which makes understanding thecompetition a critical aspect of repositioning as well.Movements to new positions do not have to happeninstantly, and it is often most appropriate to adoptchanges incrementally, for example, by adding differ-entiation through higher quality or better variety, andthen adding product scope through processing orimproved packaging.
Box 4.11 Thailand GAP Cluster—Positioning Products (and the Value Chain) for Greater Value andCompetitiveness
Source: Mike Ducker, J. E. Austin Associates, Inc.

108 BUILDING COMPETITIVENESS IN AFRICA’S AGRICULTURE
A STEP-BY-STEP SUMMARY OF TOOL 8:POSITIONING PRODUCTS AND VALUE CHAINSFOR GREATER VALUE AND COMPETITIVENESS
■ Assess and benchmark size and share of market. Collectnet sales for each product segment and each competitorin each product segment.
■ Assess and benchmark product scope (or product “offer”).Collect industry value added for each product and com-petitors’ products. If industry value added is not availableat the product level, the number and type of value-addedactivities taking place in-country can be substituted.
■ Assess and benchmark product differentiation. Prod-uct differentiation should be measured by a combina-tion of both the average price point at a given level ofvalue addition, as well as specific product attributesand customer perceptions of the sources of productvalue. Product attributes and customer perceptions arequalitative measurements but can be assessed quantita-tively through market research tools, such as consumersurveys.
■ Understand the possibilities and requirements for repo-sitioning the product, and develop a repositioning strat-egy. Repositioning a product in a more competitive spacerequires a combination of activities that both enhance
product differentiation and increase in-country, value-added activities.
NOTE
1. Once completed, the graph is strategically revealing; how-ever, compiling the information for the analysis is notstraightforward, apart from the size and segmentation of thecircles. Once basic sales data are compiled for the valuechain’s key product segments, the circles must then be posi-tioned on the graph. If available, the most accurate data tomeasure product scope is industry value added. In somecases, reliable data on value added for a specific industry maynot be available. In this case, product scope can be gauged byassessing the numbers and types of value-added activities thatoccur in-country. Product differentiation can be measured ina number of different ways. Market price can be a reflectionof the differentiation of a product in a given market, but thisis not always the case. Also, at the aggregated level, averageprice across a number of markets can be diluted and maskdifferentiation. As a result, differentiation should be mea -sured by a combination of both the average price point at agiven level of value addition as well as specific product attrib-utes and customer perception of the sources of product value.Product attributes and customer perception are qualitativemeasurements but can still be measured through marketresearch tools such as customer surveys.
DifferentiationLow cost
Rawcashmere
Cashmeregarments(high value
added)
Productscope
Cashmere and cashmere garment exports
Scotland
Italy
1999Mongolia
Afghanistan
Estimated 2003Goal
(low valueadded)
Cashmere exports Raw cashmere
Washed/dehaired Yarn and cloth garment
Figure 4.37 Product Positioning—Mongolian Cashmere Industry
Source: Nathan Associates Inc. and J. E. Austin Associates, Inc. for USAID.

INTRODUCTION
In the 1990s, export revenues from coffee, an impor-tant source of hard currency for Rwanda, declined.This case discusses a government-led initiative to
improve the competitive position of Rwandan coffee. Before2001, Rwanda was an unknown in the specialty/high-valuecoffee sector. Today, it is a sought-after supplier of spe-cialty coffees to Europe and the United States. This casetouches upon the successes of the government ofRwanda’s initiative and also speculates about the likelyoutcomes if the government had more closely followed itsown strategy.
FACTORS TO CONSIDER
When reviewing this case, it is important to keep these ques-tions in mind:
■ Where is Rwandan coffee positioned currently, and whatfactors influence that position?
■ Where does the industry want to go, and what are thequality, service, and other requirements to make it com-petitive in that positioning?
■ Who are the best global performers, and what puts themin this position?
■ What price points and profit margins exist in the variousquadrants?
BACKGROUND (1904–2001)
Coffee was introduced in Rwanda in 1904 and was firstexported in 1917; it was quickly seen as a major source ofincome for the country. In 1933, the cultivation of coffeewas made compulsory, and, in 1963, the government ofRwanda passed laws making it illegal to uproot coffee trees.
Because of coffee’s historical role as a principal sourceof foreign exchange for the country (averaging 56.7 per-cent of all exports in the 1990s) and its broad politicalsupport, the state was heavily involved in all stages of pro-duction, including marketing and dry milling. Nearly allproduction of coffee ceased, however, during the genocideof 1994. Regionally, Rwanda competed with its southernneighbor Burundi, yet Burundi’s coffee was considered tobe slightly better in quality than that of Rwanda. Neithercountry produced coffee that was considered specialtygrade, as in Ethiopia and Kenya. Despite the fact that someof the coffee grown in Rwanda, such as the Bourbon vari-etal, had specialty grade potential, all of Rwanda’s coffeewas considered below commodity grade, and, whenexported, was only used by roasters in blends of low-end,mass-produced coffee destined for Europe and the UnitedStates (table 4.14; figure 4.38).
Within the value chain, the GoR supported the coffeeindustry by establishing OCIR-CAFÉ (Rwanda CoffeeDevelopment Authority) and through it, distributedseedlings, fertilizer, phytosanitary products, and otherinputs to growers for free or at dramatically reduced prices.
109
Value Chain Strategies for MarketRepositioning—Rwandan CoffeeCarlton Jones and Martin Webber J. E. Austin Associates, Inc.
C A S E S T U DY 1 0

110 BUILDING COMPETITIVENESS IN AFRICA’S AGRICULTURE
Growers would apply the inputs to their crops and harvest,and sell semiwashed beans to RWANDEX, the monopolyresponsible for dry milling and exporting coffee. The GoRwas a majority owner of RWANDEX and set the prices thatgrowers received from their coffee sales. In fact, the GoRcontinued to set prices for coffee up until 1998. Though coffee producer associations existed in Rwanda, they wereagents of the state that distributed inputs and did little else.
GLOBAL COMPETITION DRIVES DOWN PRICESAND PRODUCTION
Coffee’s contribution to Rwanda’s foreign exchangedeclined in the 1990s. Production declined both before andafter the 1994 genocide, even as world prices reached near
record highs. During the same period, Vietnam and Brazilresponded to high prices by increasing output of commod-ity grade coffee. Beginning in 1997, this growth of supplydropped worldwide prices to historic lows. By 2001, averageglobal coffee prices were US$0.52/lb. Rwanda receivedUS$0.40/kg (US$0.18/lb.), which, on average, was belowthe price of production. With prices this low, each actor inthe Rwandan coffee value chain lost money: small growers,processors, exporters, and even the banks that providedlending.1
RWANDA’S IN-COUNTRY CONSTRAINTS
World coffee prices were not the only determining factor forthe decline in Rwanda’s coffee industry; the country’s coffee
(High valueadded)
(Low valueadded) Low cost
Rwanda 2000
Rwanda 1990
Vietnamb
Ethiopiaa
KenyaaGuatemalaa
Brazilb
Differentiation
Figure 4.38 Rwanda’s Coffee Product Position, 1990–2000
Source: J. E. Austin Associates, Inc.a Represents specialty coffee/not drawn to scale. b Represents commodity coffee/not drawn to scale.
Table 4.14 Rwandan Coffee Production
1986 1987 1988 1989 1990 1992 1993 1995 1996
Production(metric tons)
35,424 43,026 43,026 39,091 39,575 38,970 28,495 21,829 15,239
Standard coffee(percentage)
48.18 30.8 19.4 2 7 0.32 4.25 2.4 0.25
Ordinary coffeea
(percentage)38.59 60.2 75.7 94.7 86.9 93 88.7 92.7 82.9
Source: OCIR-CAFÉ 2006.a Ordinary coffee is nonexport grade, while standard coffee is exportable, commodity grade coffee. Neither is considered specialty grade.

111
production never recovered to 1992 production volumes(table 4.14) because its existing production process wasinefficient. This resulted from Rwanda’s disparate methodsof coffee farming, the poor health of its coffee trees, the lackof wet-milling stations, and the absence of incentives forreinvestment. Growers were not offered higher prices forbetter-quality beans, so they had little reason to invest inmore sophisticated processes of production, harvesting,cleaning, or separation of their bean harvests. Low coffeeyields coupled with poor price points influenced farmers tofocus on other, higher-margin crops, further diminishingRwandan coffee’s competitiveness in world markets.
Despite the constraints that led Rwanda to produce low-quality, low-quantity, commodity grade coffee, the GoRand donor partners believed that Rwanda possessed thecapacity, environmental conditions (elevation, climate, soilquality, Bourbon trees, and others), and political will toimprove its coffee position in world markets. What Rwandalacked was technical capacity, market information, and acoherent strategy.
REPOSITIONING THE OFFER FOR RWANDANCOFFEE
In response to the steady declines in production, quality,and export revenue, the GoR and its donor partners beganstrategy sessions aimed at improving Rwandan coffee’s
positioning in world markets. These sessions resulted incoffee-sector liberalization strategies that, when imple-mented, began the task of improving Rwandan coffee.Armed with market information, the private sector learnedthat higher-value coffee was very attractive to global mar-kets, that cupping/taste results indicated Rwanda had sig-nificant potential to produce specialty coffee, and thatRwanda could compete with higher-end producers such asEthiopia, Guatemala, and Kenya. The Rwandan reposition-ing strategy is illustrated in figure 4.39.
Contributing to Rwandan coffee repositioning
For Rwanda to move from being considered a commoditygrade to a specialty grade coffee producer, its coffee-producingsector needed to address three key areas:
■ Increase production, since production levels wereinsufficient to attract global demand. Activitiesincluded distributing improved inputs, supporting grow-ing associations, replanting coffee trees, and constructingwet-mill stations in Rwanda’s top 50 coffee-producingdistricts.
■ Improve quality. Activities included educating producerson quality and cupping, establishing quality-controlmechanisms, investing and technical assistance in wet-milltechniques and operational and financial management,
CASE STUDY 10: VALUE CHAIN STRATEGIES FOR MARKET REPOSITIONING—RWANDAN COFFEE 111
(High valueadded)
(Low valueadded) Low cost
Rwanda2000
Rwanda1990
2010a
Vietnamb
Ethiopiaa
KenyaaGuatemalaa
Brazilb
Differentiation
Figure 4.39 Rwanda’s Coffee Positioning Goals for 2010
Source: J. E. Austin Associates, Inc.a Represents specialty coffee/not drawn to scale. b Represents commodity coffee/not drawn to scale.

112 BUILDING COMPETITIVENESS IN AFRICA’S AGRICULTURE
improving infrastructure, strengthening cooperative andassociation management, strengthening existing institu-tions (like OCIR-CAFÉ), and providing financial mecha-nisms throughout the coffee value chain.
■ Promote the Rwandan brand. Activities included estab-lishing and improving market linkages through trade-show visits, sharing information about the local andglobal coffee markets with the private sector, and insti-tuting other innovative promotional activities.
These activities were carried out through a variety ofimplementing partners and sponsored by various donorpartners (see figure 4.40).
IMPLEMENTATION AND OUTCOMES
Through these interventions, Rwanda was effectively able toreposition its coffee and compete in higher-grade, higher-priced markets (see figure 4.41; tables 4.15 and 4.16). July2002 saw the country’s first sales of commercial volumes ofspecialty coffee, including a sale of 33 mt to CommunityCoffee in the United States. By March of the following year,privately financed and operated wet-mill facilities producedfully washed coffee. Production and quality continued toincrease, and after visits to and from trade show buyers,Rwandan specialty coffee made its first sale to Starbucks Cof-
fee Corporation in June 2004. In November 2005, Starbucksselected two privately owned wet-milling facilities for anexclusive distribution program, which provided coffee to5,000 Starbucks retail outlets.
In 1990, Rwanda’s commodity grade coffee fetchedUS$1.18/kg (0.54/lb.), but by 2001 its price had decreased toUS$0.40/kg (US$0.18/lb.). However, through the aboveinterventions, which were implemented with support fromthe Partnership to Enhance Agriculture in Rwanda throughLinkages and Agribusiness Development Activity in Rwandaprojects funded by USAID, specialty coffee production andits subsequent price both increased. Without the wet-millinginterventions, Rwanda’s ability to improve the quality of itsbeans from ordinary to standard and specialty would havebeen impossible. Also, if Rwanda had only tried to maximizeprofits and decrease costs within its value chain withoutattempting a repositioning strategy, it would have been moredifficult to obtain the same results.
RWANDAN COFFEE TODAY AND INTO THEFUTURE
In addition to the increased production and price/kg thatRwandan specialty coffee has realized, the new wet-millingstations created 4,000 new jobs, and 5,000 rural householdssaw their incomes more than double (Chemonics 2005).
Coffee Value Chain
Beans forexporting
Exporter
Processor
Farm
Dry milling Wet milling
Coffeecherries
Unwashedgreenbeans
Washedgreenbeans
Value Chaininterventions
Value Chaininterventions
Value Chaininterventions
Figure 4.40 Generic Coffee Value Chain
Source: J. E. Austin Associates, Inc.

113
Initial success from these interventions has sparked furtherdonor interest in supporting Rwanda’s value-added coffee sec-tor. Partnerships with the GoR have spawned plans to con-tinue increasing production through the construction of anadditional 164 wet-milling facilities. Continued investment inthe existing wet-mill facilities is required to make better use ofwater sources and to equip them with water recycling pumps.These, and other interventions, will allow Rwanda to continueto support its growing specialty coffee industry.
As Rwanda gets closer to 2010, continued product posi-tioning will be required to help chart new strategies for the
Rwandan coffee market (see figure 4.42). OCIR-CAFÉ hasdeveloped a plan to move away from standard coffee alto-gether and focus only on specialty varieties. Rwandanscould also choose to diversify their product offerings byseeking broader markets for standard coffee while simulta-neously maintaining focus on higher prices for specialtycoffee. This would leverage the Rwandan coffee sector’sincreased capacity and maturing coffee acumen and couldenable Rwanda to broaden its coffee production to morediverse markets.
In fact, this latter situation is ongoing, and Rwanda ismore than midway into its positioning strategy. However, itwill most likely have future opportunities to revisit its strat-egy and take advantage of future market opportunities.
Has Rwanda been successful in repositioning its coffeeindustry? In many aspects, yes. By understanding its posi-tion in world coffee markets and then implementing a strat-egy to reposition itself, Rwanda’s coffee industry has revital-ized itself and has improved the earning potential of manysmall growers.
CASE STUDY 10: VALUE CHAIN STRATEGIES FOR MARKET REPOSITIONING—RWANDAN COFFEE 113
Low cost Differentiation
(High valueadded)
(Low valueadded)
Brazil
Vietnam
Rwanda1990
Rwanda2000
Rwandan specialty coffee 2005
2005
EthiopiaKenya
Guatemala
Figure 4.41 Results of Rwandan Coffee’s Positioning Efforts, 2005
Source: J. E. Austin Associates, Inc.
Table 4.15 Rwandan Coffee Production and Prices, 2003–05
Year Metric tons produced Price/kg (US$)
2003 162 1.56
2004 747 2.40
2005 1,190 3.10
Source: OCIR-CAFÉ 2006.

114 BUILDING COMPETITIVENESS IN AFRICA’S AGRICULTURE
Table 4.16 Standard and Ordinary Coffee Percentages, 1998–2005
Year 1998 2000 2001 2002 2003 2004 2005
Production (tons) 14,268 16,098 18,267 19,796 14,175 29,000 17,000
Standard coffee (percentage) 7.40 19.5 18.5 29.28 32.4 40.0 45.0
Ordinary coffee (percentage) 80.5 72.4 75.0 58.57 55.0 50.0 45.0
Source: OCIR-CAFÉ 2006.
(High valueadded)
(Low valueadded) Low cost
Rwanda2000
Rwanda1990
2005
Vietnamb
Ethiopiaa
Kenyaa
2010+ Guatemalaa
Rwandan specialty coffee(i.e. Starbucks)
Brazilb
Differentiation
2010+
Figure 4.42 Rwanda’s Coffee Positioning, 2010 and Beyond
Source: J. E. Austin Associates, Inc.a Represents specialty coffee/not drawn to scale. b Represents commodity coffee/not drawn to scale.
NOTE
1. Rob Henning, OTF Group.

Meeting a variety of quality and performance stan-dards is integral to the success of agriculturalvalue chains. However, the importance of specific
qualities, standard measurements, and informational orother characteristics may not be readily apparent to all theactors in a value chain if they are not familiar with the tar-get market. Aside from normal ethical, consumer health,and safety requirements, the market side of the value chainpays increasing attention to standards and certifications.National and regional markets are imposing increasinglystrict requirements for basic market entry (for example,HACCP and EurepGAP). Powerful buyers and retailers,especially supermarkets, impose additional requirements ontheir supply chains.
As a result, the value chain must meet increasingly stringentrequirements relating to product health and safety, intrinsicproduct qualities (shape, color, taste, texture, and others),packaging and labeling, and accompanying information.
Value chains are also beginning to understand that meet-ing recognized standards is not just a condition for marketaccess but a powerful way to compete for market share andhigher unit values. Value chains can obtain price premiumsif they meet these standards, especially if they achieve val-ued product and production certifications. These certifica-tions can go well beyond market entry requirements andappeal to special customer segments that are willing to paypremium prices (see figure 4.43). Thus, value chains areincreasingly recognizing the opportunities inherent in pro-viding certified, organic, fair trade, bird-friendly, and otherhigh-standard products, as well as the value of marketingand quality-control initiatives that are promoted throughseals of quality.
Because a product is affected by many factors—fromfarm to market—achieving quality standards and certifica-
tions is a value chain issue, and the strategies must be valuechain–wide strategies.
VOCABULARY
■ International trade standards: Standards applicable totrade, imposed by trade agreement or market-governancefiat.
■ Value-added standards: Geared to the specific require-ments of niche or segmented markets; make a productmore specialized or unique.
■ Quality standards: Additional, specific buyer standardssuch as appearance, size, and packaging.
115
Applying Standards and Certifications to Achieve Greater Quality
TO O L 9
Internationalentry standards
and certifications(HACCP)
Prod
uct
valu
e
Up-marketvalue chainintegration
Up-marketfirm
specification
Value-addstandards andcertifications,(RainforestAlliance forSustainableAgriculture)
Figure 4.43 Standards Plotted against Product Value
Source: J.E. Austin Associates, Inc.

116 BUILDING COMPETITIVENESS IN AFRICA’S AGRICULTURE
INCREASING PRODUCT VALUE THROUGHSTANDARDS
Choosing and targeting standards should be part of astrategic market exercise. Many export markets have stan-dards and/or certifications that are needed for entry. Byachieving international certification or standards, localvalue chains have the opportunity to export to othercountries and select the market positioning of their prod-ucts. However, implementing standards does not auto-matically mean that the value chain can sell in thoseexport markets; the chains must still market and sell tocustomers in those countries.
Value-added standards allow for entry into certainniche markets; for example, Rainforest Alliance standardsfor coffee products appeal to many coffeehouses andspecialty marketers in the United States (see figure 4.44).Many individual importers and retailers have their ownquality standards that appeal to their particular customerbase.
Implementing the processes and systems to meet stan-dards does take resources, so it is important that the valuechain’s leaders and firms choose the most strategicallyappropriate target market segments. Comparing imple-mentation costs and the local value chain’s capacity toincorporate standards against the benefits of selling up-market is a strategic choice that must be considered beforeincorporating standards.
Elements of standards
Implementing standards within a value chain means dis-cussing three elements:
■ Certification bodies■ Information channels■ Management oversight and governance structures
CERTIFICATION BODIES
Many standards and certificates have international bodiesthat certify that products meet certain standards. Severalhave the ability to certify products and services in devel-oping countries, but cost and timing can be a major issuein bringing these international bodies into developingcountries. Therefore—and especially if large numbers ofproducers or exporters will receive certification—it isoften better to set up institutions in the local country.Although it is beyond the scope of this Guide to discuss
how to set up a certification body, it is worth noting thatseveral options are available:
■ Private companies■ Industry associations■ Nongovernmental organizations (NGOs)■ Government agencies
Governments are typically geared to certify products andservices to protect their citizens’ health and welfare, but aretypically not best suited to certify based on other criteria.NGOs, associations, and private firms around the worldhave successfully set up certification agencies based oninternational standards.
INFORMATION CHANNELS
Entrepreneurs—businesses and producers, in general—must be motivated to change the way they produce goodsand services to meet standards, and they need informationand economic incentives in order to do this. These incen-tives must include shared knowledge of the requirements(and ideally, the logic behind them), as well as price pointsthat reflect the additional costs and work involved in meet-ing requirements. There must also be trust within the valuechain that the process is stable.
One aspect of creating trust is ensuring that properinformation channels are available and being used; thesewill give small and medium enterprises and producersconfidence that they will obtain fair rewards for the costsof implementing new processes to meet standards. This
Internationalentry standards Target
market
National borders
Value-added standardsand certification
Internationalstandardslike HACCPand EurepGAPcan be a doorof opportunityto sell andmarket inexportmarkets
Value-addedstandardslike rainforestalliance canbe a door ofopportunity tosell andmarket tospecific niches
Figure 4.44 International and Value-Added Standards
Source: J.E. Austin Associates, Inc.

TOOL 9: APPLYING STANDARDS AND CERTIFICATIONS TO ACHIEVE GREATER QUALITY 117
means that the value chain must communicate formallyand informally. Formal communication can occur throughmeetings, cluster activities, integrated supply chain sys-tems, industry associations, conferences, and exchangingprice information. Informal channels can be created byhaving a transparent culture within the value chain, espe-cially within the SMEs’ supply base. For example, if afarmer sees another farmer in the village benefit from aninvestment to meet standards or gain a certificate, the sec-ond farmer is more likely to upgrade processes based on theobserved model.
MANAGEMENT OVERSIGHT AND GOVERNANCE
A value chain that is upgrading its standards requires someinstitution to take responsibility for managing the supplybase to meet standards and specifications. Because the valuechain is comprised of independent firms and actors thatoften have different motivations, this can be a difficult task.Credible governance, clearly able to link value chain perfor-mance to market rewards, is always needed if the supplyresponse of the value chain is to be coordinated and targetedto market needs.
Typically, there are three types of institutions for man-agement of the value chain:
■ Supply chain management instituted by an exporter,processor, or other lead firm
■ Associations and cooperatives■ Government agencies
The success of these various forms of oversight andgovernance rests with their ability to understand marketrequirements and translate them into in-chain procure-ment standards, communicate information effectively, andmotivate suppliers to respond with needed investmentsand operations.
LEAD FIRMS
Many lead firms have made a “mindset” change that allowsthem to view the effective management of their supplychain as an opportunity for growth creation and larger prof-its, rather than simply as an additional imposed cost. Thismindset shift is based on the fact that if the participants ina value chain work together, the value chain can more easilymeet changing market needs and reduce transaction costs.Therefore, the lead firm should take responsibility formanaging its supply base, which includes ensuring that that
base is certified or is meeting market standards. In frag-mented industries, lead firms are sometimes unable tomanage the supply chain to meet market standards, and sothe industry would then have to leverage other institutions.The need for a coordinated response within a fragmentedproduction environment is a key motivator for integrationand consolidation within value chains.
ASSOCIATIONS AND COOPERATIVES
In fragmented value chains, associations and cooperativescan help manage value chain elements to meet market stan-dards. These institutions are often important when firstimplementing standards in a value chain; institutions thatare producer owned, visible, and well known can build trustin the standardization process. Properly resourced, they canbe very effective in training and outreach activities. In somecases, involving a credible third-party institution (as in theexample of Kaesetsart University and the Thai GAP cluster,box 4.12) can help overcome initial mistrust between pro-ducers and processors/exporters and can help focus allparties on a coordinated approach to meeting standards.
GOVERNMENT AGENCIES
In many countries, and often in keeping with traditional, historical/colonial, or even philosophical backgrounds, gov-ernment has played the role of industry governance, includingstandard setting, inspection, extension, and communication.Marketing boards or authorities are one prominent set ofexamples. However, while some state-run agencies are effectivein their governance and oversight role—and, in some cases,even step in to redress serious sectoral problems—there arealso problems with such models. Government agencies areoften slow to understand and respond to market trends, lim-ited in their strategic focus, inflexible in promoting varyingstandards and price points, subject to public sector inefficien-cies and political and budget pressures, and liable to commu-nicate poorly with the value chain.
SUMMARY
It is a strategic decision to instill standards or certificationsinto the value chain based on target market requirements.The choice of standards and certifications needs to be aninformed one. To implement these, effective elements ofcertification bodies, information channels, and manage-ment oversight must be established.

118 BUILDING COMPETITIVENESS IN AFRICA’S AGRICULTURE
In the early 2000s, the GAP cluster in western Thailandwas able to reorient its production to meet the specificcertifications needed to enter European and U.S. mar-kets. This cluster was also able to develop and marketcertifications that add value to its products. Theseresults were achieved through close collaborationamong value chain participants.
Importance of Implementing EurepGAP through theValue ChainThailand has long been able to successfully export high-value horticulture products to Europe. Once EurepGAPcertification and traceability requirements were put inplace, however, Thai vegetable exports dropped by 20percent. The drop in exports was felt throughout thevalue chain—by exporters, packers, and growers. Theexporters and government made several attempts toimplement EurepGAP within the value chain, thoughwithout success. This was largely attributable to mis-trust among the exporters, government, and growers.
A cluster approach was used to provide training andcertification services by incorporating a local univer-sity, Kaesetsart University. The exporters collaboratedclosely in identifying market requirements, and theuniversity trained 2,000 growers on EurepGAP compli-ance, sending them to train other farmers. Growerswere more willing to accept the new processes whenpresented by a respected third party (the university)with information support from the exporters. Thisallowed the exporters to gain market share and increasetheir exports. The growers benefited by receiving a 50percent increase in their prices for certified products.
Use of Certification and Branding for Local MarketsTo further leverage the output of growers who partici-pated in the EurepGAP training and processes, the clus-ter developed a western Thailand GAP logo. The clusterworked on sophisticated packaging, branding, andsmaller packages that were geared toward the largesupermarkets in Thai cities. It is expected that eachparty in the value chain will gain greater value by lever-aging this certification and brand.
Box 4.12 Thailand GAP Cluster—Use of Standards and Certifications to Upgrade Value
Source: Mike Ducker, J. E. Austin Associates, Inc.
European markets
Exporters
Packers
Eure
pGA
P tr
ade
regu
latio
n
Vegetable growers
European market
Exporters
Packers
Vegetable growers Kaesetsart University
• Show leadership behind university• Help with brochures and communications
Expected results• Growers receive a 50% premium if certified• Increasing expected net income (2,000 growers) for the cluster over the next five years to US$2.2 million• Highly replicable
European markets
Exporters
Packers
Vegetable growers
Vegetable exports reduced by 20%
GAP trainingand certification
services
Figure 1: Thai Vegetable Export Value Chains
Source: J. E. Austin Associates, Inc.

TOOL 9: APPLYING STANDARDS AND CERTIFICATIONS TO ACHIEVE GREATER QUALITY 119
Box 4.13 Ecuadorian Cacao—Improving Quality at the Producer Level to Achieve Higher Market Prices
In 2003, the government of Ecuador (GoE) launchedan alternative development project focused on the bor-der region between Ecuador and Colombia, which is alocus for cultivation of illicit crops. An assessment ofthe income and employment potential of other currentcrops grown in the area pointed to five potential crops,including cacao.
There are two main types of cacao: forastero andcriollo. Forastero cacao accounts for approximately 95percent, most of the remaining 5 percent is criollo.a
Criollo cacao has traditionally been produced in LatinAmerica, while forastero cacao has been grown inAfrica and Asia. Cacao is graded based on several crite-ria, including mold content, level of fermentation, andpercentage of cocoa butter, all of which affect the flavorprofile of the chocolate produced. Criollo cacao is gen-erally more flavorful, but it does not necessarily alwayscommand a premium. Cacao buyers and processorspay more attention to the local characteristics that cre-ate the particular flavor profile of the product, ratherthan to the type of cacao grown.b
Ecuador mainly grows criollo cacao, and its flavorprofile is particularly well suited to producing fine darkchocolate, a market segment that has grown exponen-tially during recent years.b However, quality controlproblems and poor handling practices destroyed theconductivity of fine flavor and aroma in about 50 per-cent of the harvest in Ecuador. This meant that eventhough Ecuador was growing the criollo variety, 50percent of the crop could not be sold at a higher priceor was unfit for export.
Cacao buyers typically do not buy directly fromproducers (see figure 1), preferring to work throughcollection centers. This is due to the fact that cacaois not a plantation crop, and there is largely anabsence of associations that can sell cacao in suffi-cient quantity.
A value chain analysis revealed several constraints inthe cacao sector, including poor production technol-ogy, mixing different types of beans without qualitydifferentiation, and selling wet and unfermentedcacao.c Fermentation changes cacao’s flavor profile—sometimes positively and sometimes not. Ecuador’scriollo cacao naturally possesses a desirable flavor pro-file for higher-end dark chocolate products, so produc-ers sought to address quality problems as well as reducepostharvest losses.
Prices and Production of Cacao Farmer FieldSchools, supported by USAID, helped educate farmersto better cultivate and protect their trees, add value totheir product by differentiating between types of beans,and to ferment and dry the beans. Farmers who providevalue-added services receive a higher price for theirbeans; those who sell beans after fermenting and dryingthem can receive US$60 per quintal, versus US$28–30
Importers
Packers/exporters
Farm
Ecua
dor
USA
Smallholder cacaoproducers
Buyers, chocolateproducers
Collectioncenters
Exporters
4,5004,0003,5003,0002,5002,000$/
t
To
ns (1000)1,500
500
1971
–72
1974
–75
1977
–78
1980
–81
1983
–84
1986
–87
1989
–90
1992
–93
1995
–96
1998
–99
2001
–2
2004
–50
1,000
4,5004,0003,5003,0002,5002,0001,500
5000
1,000
Prices ($/t) Gross crop (in thousand tons)
(Box continues on the following page.)
Figure 1: Ecuadorian Cacao Value Chain
Source: J. E. Austin Associates, Inc.
Figure b: Prices and Production of Cacao, 1971–72 to2004–05
Source: UNCTAD, based on the data from the International CocoaOrganization, quarterly bulletin of cocoa statistics.

120 BUILDING COMPETITIVENESS IN AFRICA’S AGRICULTURE
Box 4.13 Ecuador Cacao—Improving Quality at the Producer Level to Achieve Higher Market Prices (continued)
per quintal if unprocessed.d Cacao beans are sold on theNew York and London exchanges, where a baseline mar-ket price is offered; then, premiums or discounts areapplied depending on the country of origin, the qualityof the shipments, and other factors. Between 50 percentand 75 percent of Ecuadorian production is currently ofsufficient quality to be sold at a higher price.
As described in box 4.10, Ecuador has historicallyreceived a US$20–US$100 premium over the baseline
4,000
3,500
3,000
2,500
In t
hous
ands
of to
ns
2,000
1,500
1,000
500
1990
–91
1991
–92
1992
–93
1993
–94
1994
–95
1995
–96
1996
–97
1997
–98
1998
–99
1999
–200
0
2000
–1
2001
–2
2002
–3
2003
–4
2004
–5
2005
–60
Côte d́ Ivoire Ghana Indonesia Nigeria Brazil
Cameroon Ecuador Malaysia Others
market price. However, because of its desirable flavorprofile, Ecuadorian cacao currently commands a pre-mium of US$800–US$1,200 per ton.b Through theFarmer Field Schools, farmers learned how to addmore value to their product by maintaining bean qual-ity, fermenting, and drying the beans before takingthem to the collection centers. These actions have led tothe production of higher quality cacao and, in turn, tothe farmers who receive a higher price for their cacao.
Prices of Various Countries’ Cacao Products
CountryPremium over market price, May 4, 2007 (per ton, US$)
Venezuela (fermented) 2,000
Java (fermented) 2,000
Ecuador (partially fermented) 800–1,200
Ivory Coast (fermented) 320
Dominican Republic (unfermented) 280
Ghana (fermented) 250
Note: This is the same table that appears in box 4.10.
a http://www.unctad.org/infocomm/anglais/cocoa/quality.htm.b Author interview with Karl Walk, purchaser for Blommer Chocolate, 2007.c The process of drying cacao reduces the likelihood of developing mold; currently, the U.S. Department of Agriculture rejectsshipments of cacao that exceed 4 percent mold content.d Technical Evaluation of the Ecuador Northern Border Income and Employment Project Implemented by ARD, Inc.
Figure 3: World Production of Cacao Beans
Source: Lisa Carse, J. E. Austin Associates, Inc.; UNCTAD, based on the data from the International Cocoa Organization, quarterly bulletin of cocoa statistics.

TOOL 9: APPLYING STANDARDS AND CERTIFICATIONS TO ACHIEVE GREATER QUALITY 121
A STEP-BY-STEP SUMMARY OF TOOL 9:APPLYING STANDARDS AND CERTIFICATIONSTO ACHIEVE GREATER QUALITY
■ Analyze market data for price premiums associatedwith individual standards and quality certifications. Inaddition to quantifying opportunities within existingmarkets, look at the potential for certifications to openup new niche markets. Identify the market risks of notmeeting standards or certifications.
■ Contact other businesses that have obtained certifica-tion, particularly lead firms, to discuss the economics ofvalue added relative to traditional production.
■ Identify and understand the technical requirements tomeet standards or certification, and evaluate the actions
and costs that will be necessary. Contact certificationbodies to discuss the time and resources necessary toobtain certification.
■ Identify the process, pricing, training, and other require-ments to meet standards or certifications.
■ Assess the firm level and value chain capacity for qual-ity control. Also assess the quality and consistency ofservices provided by other value chain actors needed toobtain and maintain certification. Assess value chainlinkages and relationships to identify key elements thatneed coordination, and the actors that will ensurecoordination.
■ Investigate public sector support and services for pro-ducers and enterprises seeking certification or value-added production.

122
POINTS TO CONSIDER
This case study looks at certification processes thathelp ensure safety and quality for the final con-sumers of Nile perch. The case considers the Nile
perch export value chain in Uganda, which extends from LakeVictoria fishermen to dinner tables in Europe and around theworld, and how quality and safety issues impact the valuechain. The Ugandan value chain successfully improved itsquality management when faced with potentially losing itssizable European market. This case also highlights the valuethat different certifications have within the value chain.
BACKGROUND
Opportunistic growth in the 1990s led to an undisciplinedvalue chain (figure 4.45) that caused sector quality issues.
In the early 1990s, Kenya, and then Uganda, startedexporting Nile perch to Europe. Fish became a majorUgandan export during the mid-1990s. Despite the prof-itability of these initial years, the Ugandan fish industryfailed to invest in quality control measures central to thevalue chain’s long term strength.
From 1997 to 2000, several health incidents in the Euro-pean Union and in Uganda caused the EU to place numer-ous bans and restrictions on Nile perch imports (and otherfish) from Uganda, as well as on other countries thatexport fish from Lake Victoria. (See box on the Nile PerchCertification Timeline for details.) Problems first surfaced
when Spanish and Italian authorities found contaminationin Nile perch and issued bilateral bans. These steps forcedthe European Commission to send several missions toUganda to test the product and the processes within thevalue chain. Some of the problems that were identifiedfrom these missions included:
■ Fish-processing plants failed to meet conditions laid outin EU regulations
■ The Uganda National Bureau of Standards (UNBS) issuedhealth certificates incorrectly
■ Lack of microbiological tests to support governmenthealth certificates
■ Lack of routine government monitoring for presence ofchemicals in fish and water
■ Lack of sanitary infrastructure and fencing at landingsites
■ Fish handling was not hygienic throughout the chain
In response to the missions’ findings, two Ugandan pro-cessing plants were prohibited from exporting Nile perch tothe EU.
In 1999, the Ugandan press reported instances of fish poi-soning in Lake Victoria. The UNBS notified the EU that itcould not guarantee the safety of fish exports, and the EUthen banned all fish imports from Lake Victoria. The EUimport bans had wide-ranging effects in Uganda; in additionto lower fish exports and export revenue, fishing communi-ties suffered tremendous damage, as did fish processors and
Ugandan Nile Perch Quality Managementand Certification Michael Ducker and Martin WebberJ. E. Austin Associates, Inc.
C A S E S T U DY 1 1

CASE STUDY 11: UGANDAN NILE PERCH QUALITY MANAGEMENT AND CERTIFICATION 123
related service industries (packaging, transport, and others).As a result of the bans, three plants closed down completely.The remaining plants worked at 20 percent capacity, while60–70 percent of employees were laid off.
INTERVENTION
The EU bans shut off the supply of a product that wasmuch in demand in the EU marketplace, and the markethad few substitutes. Pressures on both the demand andsupply sides of the market therefore provided majorincentives for actors throughout the value chain to facethe problem. The members of the Uganda Fish Processorsand Exporters Association (UFPEA), European fishimporters, the government of Uganda (GoU), and the EUworked together and took action to deal with the issues.The GoU and UFPEA had several working group meet-ings to design an action plan. Their major initiative wasto restructure the government agencies responsible for
managing Uganda’s certification process. Since Europewas the fish’s major destination, the government andindustry wanted its certification process to match theEurepGAP process.
CREATING A EUREPGAP CERTIFICATIONPROCESS IN UGANDA
The GoU streamlined its fish regulatory and inspectionsystems, with the Department of Fisheries (DFR) formallybecoming the sole competent authority for fish safetyissues. DFR would be responsible for certifying fishexports as EurepGAP compliant, and it needed to achieveHACCP accreditation to regulate the value chain toEurepGAP standards.
The DFR completely revised its guidelines as well as itsmonitoring and inspection systems. A manual of standardoperating procedures was established to guide inspections,and training programs were carried out for inspectors.
February 1997: Spain and Italy claim that their authori-ties have detected high levels of bacterial contamination,and impose bilateral ban on fishery product imports.
March 1997: EU inspection confirms “serious micro-biological contamination.”
April 1997: EU requires mandatory tests on imports ofNile perch from three East African countries.
December 1997–June 1998: Following an outbreak ofcholera in East Africa, the EU bans fresh fish imports andimposes mandatory tests on frozen fish from East Africa.
November–December 1998: EC sends a Food and Vet-erinary Office mission to Uganda to assess compliancein production conditions; two processing plants arefound not compliant. The two noncompliant plants areremoved from the list of approved establishments. Inthe same month, the Ugandan press reports instancesof fish poisoning in Lake Victoria.
March 1999: Based on press reports, a number of dis-trict authorities ban fish sales. UNBS notifies the EUthat it cannot guarantee the safety of fish exports.
April 1999: EU meets in Brussels with representativesof authorities from Kenya, Tanzania, and Uganda todiscuss test results; the EU announces a ban on freshand frozen fish from the three countries.
August 1999: EU mission assesses resources andcapabilities of competent authority in Uganda inrelation to control of pesticide residues; mission pro-vides 10 recommendations; UNBS responds to EUreport but does not provide all requested documen-tation or details. A private laboratory is established inKampala, accredited to perform pesticide-monitor-ing tests; industry adopts the “voluntary code ofpractice” for quality control; Department of Fisheries(DFR) revises inspection manual. Transfer of compe-tent authority from UNBS to DFR.
July 2000: Ban lifted when the EU accepts guaranteesthat Uganda has put in required procedures for safetyof exports; country qualifies for temporary certifica-tion in List II (see About EU Fish Import Lists box).
May 2001: Uganda goes back to List I (see About EU Fish Import Lists box).
Nile Perch Certification Timeline
Source: DISS 2005.

124 BUILDING COMPETITIVENESS IN AFRICA’S AGRICULTURE
In 2008, DFR’s central offices were staffed with 17 inspec-tors who monitor the overall system and operations at pro-cessing plants. Another 20 or so inspectors operate at the 14 landing sites that are approved as sources of fish forexport. These inspectors issue local fish-health inspectioncertificates that are required to move fish from a landing siteto a processing factory. These certificates contain informationon both the supplier and buyer of fish at the landing site andon the fish’s origin. However, DFR did not have the capacityto handle quality control with the fishermen or at many ofthe landing sites away from major urban centers. There are
600 total landing sites in Uganda, but only 14 are approvedfor export. As a result, different monitoring procedures wereput in place at the local level, including the formation ofcommittees at landing sites and Beach Management Units(BMUs) that started registering boats and gear. Thisapproach follows what, in fisheries, is known as comanage-ment—power-sharing between state and local communitiesand a shift of responsibilities from the former to the latter.In this framework, BMUs are supposed to coordinate withlocal governments via the formation of Lake ManagementOrganizations (Ponte 2005). As of 2004, BMU-managedlanding sites were not authorized to export to Europe, somany processors, agents, and traders transfer fish at one ofthe 14 approved landing sites.
THE IMPORTANT ROLE OF PESTICIDELABORATORIES IN THE CERTIFICATIONPROCESS
The EurepGAP certification process requires biochemicaltests to check for pesticide residue. No laboratory in Ugandacould perform the pesticide residue test, so samples werebeing shipped to Belgium, where a Belgian firm, Chemipher(U) Ltd., did the tests. Chemipher recognized that there wassustained business for them in Uganda, so they opened alaboratory there. Having a local lab helped streamline thecertification process and reduce costs.
ISO 9001 CERTIFICATION
Many of the fish processors and exporters wanted to addanother layer of quality standards to their production, mostly
European markets
Fish processors/exporters
Landing sites
Fishermen
Figure 4.45 Ugandan Nile Perch Value Chain
Source: J. E. Austin Associates, Inc.
In 1998, the EU started segregating fish-exportingcountries into three lists. List I countries couldexport fishery products to the EU from any estab-lishment approved by the competent authority.List II countries were authorized to export on thebasis of a specific list of approved establishments.List III countries were deemed unable to provideguarantees of appropriate inspection and monitor-ing. In order to export from these countries, addi-tional documentation and checks were needed andonly individual establishments approved by the EUcould export.
About EU Fish Import Lists

CASE STUDY 11: UGANDAN NILE PERCH QUALITY MANAGEMENT AND CERTIFICATION 125
to demonstrate (and to help the market perceive) that theywere serious about quality. With the assistance of a USAID-financed project1 that trained the fish processors in ISO 9001(a subset of ISO 9000, see figure 4.46) processes, the proces-sors were then certified by an outside consulting firm.
INDUSTRY-LEVEL CERTIFICATIONS
The association of fish processors, UFPEA, has adopted avoluntary code of Good Manufacturing Practices (GMPs).The fish processors implemented HACCP and good qualitymanagement systems (see figure 4.47) with support fromEU funding, and 11 processors were upgraded to handle fishfor export (see figure 4.48). The voluntary GMPs were mon-itored by UFPEA and proved helpful in improving proces-sors’ practices.
THE RESULTS: A MORE COMPETITIVE INDUSTRYTHAN ITS NEIGHBORS—AND ONE THAT HASGAINED A REPUTATION FOR GOOD QUALITY
In short, compliance with EU standards (including HACCPprocedures) by the Ugandan fish industry in reaction to theimport bans resulted in:
■ Streamlined regulation under a single, strong, and com-petent authority (DFR)
■ Formulation of a new fisheries policy■ Improved monitoring and inspection systems supported
by inspection manuals, standard operating procedures,and the training of inspectors
■ Regional efforts for the harmonization of handling pro-cedures in the three countries sharing Lake Victoria
■ Upgrading of a (small) number of landing sites andplans for upgrading a substantial number of others
■ Upgrading of processing plants’ procedures and layouts■ Opening up of the U.S. market, which also requires
HACCP compliance■ Installation of two local laboratories (Chemipher and
UNBS) and general improvement of service provision tothe industry
■ Increased number of processing plants and improvedexport performance (see figure 4.49)
LESSONS LEARNED
■ There was and still is a strong incentive for the valuechain and government to work together to ensure a qual-ity product. The potential total losses of poor qualitymanagement were apparent to all parties.
■ Paradoxically, banning the supply of all Nile perch fromthe Lake Victoria region created incentives for Europeanfish importers and the EU itself to support Ugandabecause there were few replacement sources.
Fishermen
Testing and certifyingMovement of product
Landing sitesFish logistics(transport andmiddlemen)
Fish processors/exporters European markets
Individual Ugandanfish processors andexporters
ISO certification board
Figure 4.46 ISO 9000 Certification Process
Source: J. E. Austin Associates, Inc., 2007.

126 BUILDING COMPETITIVENESS IN AFRICA’S AGRICULTURE
Testing and certifying
Movement of product
Fishermen Landing sitesFish logistics
(transport andmiddlemen)
Fish processors/exporters European markets
Ugandan FishProcessors andExportersAssociationgood agriculturalpractices
Individualfish
processors
HACCP
Figure 4.47 Good Manufacturing Practice and HACCP
Source: Stefano Ponte, “Bans, Tests, and Alchemy: Food Safety Standards and the Ugandan Fish Export Industry.” Danish Institute for InternationalStudies 2005.
Figure 4.48 HACCP Implementation
Company code
HAACPcomplaint
begins
HAACPcompliance
begins
Number of plants
upgradeda
Length of process
of achievingcompliance(months)
Total estimated cumulative
expenditure to reach HACCP
compliance, capital cost (thousands
of US$)Extra recurrent
costs (US$/year)b
A Y 1998 2 12 39,600
B Y 2001 1 12
C Y 1997 1 48 1,927 65,800
D Y 1997 1 12 1,000
E Y 2000 1 24 45,000
F Y 1995 1 36 72,000
G Y 1998 2 36 1,000 70,000
H Y 1997 1 12 1,500 80,000
I Y 2000 1 12 200 43,000Average 11 23 1,125 59,343
Source: Stefano Ponte, “Bans, Tests, and Alchemy: Food Safety Standards and the Ugandan Fish Export Industry.” Danish Institute for International Studies 2005.a Plants built after 2001 (already to HACCP specifications) are not included here.b Estimate includes product testing, extra quality management labor, materials, and annual training.
■ Recognition of the importance of quality management,and of building a secure reputation for quality, led toactions beyond the minimum needed, such as imple-menting ISO 9001 and GMPs.
■ The fish processors and exporters were natural actors totake the lead in determining and disseminating informa-tion about the standards required within the value chain.They were responsible for a large part of the value-added

CASE STUDY 11: UGANDAN NILE PERCH QUALITY MANAGEMENT AND CERTIFICATION 127
process and were the portion of the value chain mostknowledgeable about export markets’ requirements. Theycould serve as the “control point” for the rest of the valuechain. The government had reason to listen to them becausethey employed a large number of people and recognizablycontrolled the market linkage that tens of thousands ofpeople working within the value chain helped to supply.
■ There is multilayer monitoring at the fish processing andexport stages, but monitoring is much weaker at thelanding sites and with the fishermen. Currently, localgovernments do not have the capacity to do much mon-itoring, so the exporters and processors have most of the
responsibility to ensure that they receive fish that meetsthe EU market’s quality requirements.
■ Fishermen and fish traders also understand andremember that markets can be “turned off ” and, conse-quently, have incentives to supply fish that meets qual-ity requirements.
NOTE
1. Under the SPEED project, this and other assistance tothe fish industry was provided by J. E. Austin Associates,Inc., and the prime contractor, Chemonics Inc.
0
5,000
10,000
15,000
20,000
25,000
1997 1998 1999 2000 2001 2002 2003 2004 2005Year
Tons
0
20,000
40,000
60,000
80,000
100,000
120,000
Euro
s (t
hous
ands
)
Tons Value
Figure 4.49 Uganda’s Nile Perch Exports
Source : EUROSTAT data, calculations by J. E. Austin Associates, Inc.

Profitable value chains are supported by services thatallow the chain to grow, be more efficient, andenhance its competitiveness. The overall objective is
to improve the depth and breadth of services currently beingprovided to the value chain, enabling them to be commer-cially sustainable, and to help those services emerge wherethey are not being provided. The availability of new and bet-ter services should enhance the profitability of the wholevalue chain. Commercially sustainable services will typicallyinvolve specialization on the part of the service deliverer;thus, there are important linkages with the deepening of thevalue chain, as discussed in Tool 4, Upgrading and Deepen-ing the Value Chain.
The range of services that can add value and strength toa value chain is vast. Examples include input supply, market
information and product development support, businessmanagement and consulting, transportation and logistics,quality assurance (including certifications), skills, extensionsand training, veterinary services, and credit and other finan-cial services. Box 4.14 describes an example of an enter-prise-linked extension services model. Box 4.15 describesthe actors of a sector organization.
It is absolutely in the interest of businesses, entrepre-neurs, and associations to ensure provision and access toservices that would enhance their value chain’s profitability.In many cases, demand for services can also offer opportu-nities for small and medium enterprises to enter the valuechain market as suppliers.
In the specific case of financial services, relationshipsbetween value chain actors can also enable financial flows by
129
Identifying Needed Support Services for the Value Chain
TO O L 1 0
Uganda’s cotton production dramatically decreasedduring the 1970s, and the sector has not yet fully recov-ered. Supported by USAID,a the government of Uganda(GoU) sought to increase Uganda’s cotton productionand revenue by encouraging small farmers to growmore and higher quality cotton. Greater productionwould enable ginneries to operate closer to full capac-ity. By involving private business in serving the needs ofthe farmers at the input and financing stages, the gin-neries were able to encourage farmers to increase thesupply of cotton available to the ginneries. This wasaccomplished through a model that has been success-fully replicated through eight lead ginners representingthe interests of supporting ginners in eight designatedcotton production zones; the model has also beenextended to other sectors.
The Enterprise-Linked Extension Model for the cot-ton industry begins with a ginnery that is performing atundercapacity, where there is nevertheless marketdemand for cotton. For example, the Nykatonzi gin-nery has a productive capacity of 20,000 bales per year,yet in the early 2000s, it was only processing about10,000 bales annually.b
The farmers already had supplier relationships withthe ginneries; however, the industry and the GoU rec-ognized that these farmers needed extension services ifthey were going to produce cotton in sufficient quanti-ties for the ginneries to operate efficiently.
Inputs and service needs were identified by analyz-ing the underperformance of the sector compared withhistoric levels, including value chain and GAP assess-ments. Farmers did not have access to needed inputs,
Box 4.14 Ugandan Cotton—Enterprise-Linked Extension Services Model
(Box continues on the following page.)

130 BUILDING COMPETITIVENESS IN AFRICA’S AGRICULTURE
and they lacked the technical knowledge to increasetheir yields. The identified needs included:
■ Training and extension■ Technical advice■ Access to inputs■ Financing of inputs■ A guaranteed buyer
Since output could be boosted through the use ofthese inputs, the ginneries worked with stockists toprovide these inputs to the farmers. The purchaseagreements between the ginnery and the farmer pro-vided a risk-mitigation mechanism for the stockists’investment. The farmers’ need to purchase these inputsled to the development of financial services programsfor the farmers. The ginneries worked with financialservice providers to give the farmers access to the finan-cial resources they needed. All of these steps were ableto take place because the farmers had guaranteed buy-ers in the ginneries through purchase agreements.
For extension services, ginneries were encouragedto communicate their needs and engage directly withfarmers. The ginners, with support from the USAID/Agricultural Productivity Enhancement Program(APEP), set up demonstration plots and trained farm-ers in cotton production techniques, including the useof fertilizers and pesticides; farmers were trained bylead farmers, collaborating farmers, and site coordi-nators. An employee of the ginnery, called a site coor-dinator, oversees the plots, coordinates field trips,provides information to farmers, and supervises lead
farmers who act as extension agents. Lead farmerspass on cotton-production technologies to collabo-rating farmers for adoption through trainings, fielddays, and hands-on exercises. Technical advice is pro-vided by the ginneries and USAID/APEP.
The benefits to the ginneries included increased andmore reliable cotton supply, greater operational effi-ciency, and greater loyalty among farmers to the gin-nery. The benefits to the farmer included increasedproduction, productivity, and profits; greater knowl-edge of the market; sophisticated production tech-niques; and a guaranteed buyer for their supply. Themodel has successfully increased cotton productionand revenues in Uganda. More ginneries are in opera-tion, and farmers have been able to increase their yieldsthreefold to around 600 kg/hectare. As a best practicesbenchmark, Australian yields in 2005 were 2,080kg/hectare.
ResultsThe model successfully increased cotton productionand revenues in Uganda. It has now also been repli-cated in several sectors, including maize and sunflow-ers. In the maize sector, corporate linkages have beenstrengthened, farmers have been economicallyempowered, and support services have been created.Production and sales volume of maize remain high,and quality has improved. In the sunflower sector, anadditional US$6 million dollars in farm income hasbeen generated in three years, with 35,000 farmersjoining a dedicated production system.c
Box 4.14 Ugandan Cotton—Enterprise-Linked Extension Services Model (continued)
Sources: Lisa Carse and Martin Webber, J. E. Austin Associates, Inc.; Uganda Bureau of Statistics.a Initially the SPEED (Support for Private Enterprise Expansion and Development) Project, and subsequently APEP. Both projects were implemented by Chemonics, Inc.b Ralph Chaffee, April 2, 2002, Enterprise-Linked Extension Services in Uganda; SPEED Project.c Mark Wood, USAID/APEP Project, 27 March, 2007.
making the potential client more attractive to traditionalfinancial institutions. The benefits of these buyer-suppliervalue chain relationships—specifically, a more secure mar-ket and improved skills—make potential borrowers (suppli-ers) more creditworthy to financial institutions.
Services can be delivered through many appropriatemechanisms. Services along the value chain can be providedby both public and private entities; commercially sustainable
approaches are certainly preferable. Additionally, servicesmay be delivered as part of another commercial transaction,such as in the case of embedded services. For example, aprocessor extends credit in the form of “virtual” workingcapital to a small farmer when the processor provides seeds,fertilizer, or pesticides as part of an outgrower scheme.1 Inthis context, for example, formal financial institutions canenter the equation and make credit flows available, perhaps

TOOL 10: IDENTIFYING NEEDED SUPPORT SERVICES FOR THE VALUE CHAIN 131
World trade in spices, their related products, and herbalhealth care products are estimated to be US$200 billionper year with an annual growth rate of over 5 percent.In Sri Lanka, growing and processing spices providescash income to over 400,000 smallholders and manyprocessors. Sri Lanka commands over 80 percent of theworld’s true cinnamon production and exports closeto 13,000 mt per year in the form of quills in differ-ent grades, mainly in bulk form, at a value of US$50million.
Cinnamon zeylanicum, the source of the spice, is asmall, unassuming evergreen that is native to SriLanka’s west and southwest. Cinnamon has beenpopular for ages, imported to Egypt as early as 2000BC. Demand for cinnamon helped drive the Euro-pean “age of discovery” beginning with Vasco daGama’s first trip to Asia in 1497. There is “true” Ceyloncinnamon, and there are other spices which are incor-rectly referred to as cinnamon, such as Cassia (C. aro-maticum), Indonesian cinnamon (C. burmannii), andothers (e.g. C. loureirii). The price differential betweentrue cinnamon and Cassia is 4:1. While European andLatin American markets distinguish the varieties, theU.S. market does not. Thus, in the U.S., low-quality cas-sia sells for a fraction of the price of the Sri Lankanproduct.
Members of the spice industry cluster formed theSri Lankan Spice Council (TSC) in 2001 to establish SriLanka as one of the top five branded, value-addedspices and allied products marketers in the world. TSChas worked hard to differentiate its Ceylon cinnamonfrom lower-quality substitutes. One problem that TSCaddressed was that Ceylon cinnamon and Cassia areclassified under the same Harmonized System (HS)code of the World Customs Organization (WCO). Incollaboration with the U.S. Department of Commerceand Sri Lanka Customs, and after deliberations with theWCO, TSC succeeded in obtaining a separate subhead-ing for “Ceylon cinnamon” in the HS code.
TSC has carried out several actions to improveproduct quality and market access. TSC carried out amarket analysis to locate the best sales prospects forwhole spices and to identify the kind of bottling andpackaging that is required for optimal value creation inthe United States. TSC has also worked with local spicesmallholders and suppliers to improve postharvesthandling and management of spices in order toincrease the quality of spices that are delivered to SriLankan exporters.
Box 4.15 Sri Lankan Cinnamon
38,000
40,000
42,000
44,000
46,000
48,000
50,000
1999 2000 2001 2002 2003 2004
Valu
e (U
S$ t
hous
ands
)
Smallholderproducers
70% of production(400,000)
Import agent/broker
Exporters/traders
The spicecouncil
Medium and largeproducers
30% of production
Processor
Manufacturer/food service company
Specialtygrinder
Retail market
Value Chainintervention
• international classification• market analysis• training center• branding
Figure 1: Value of Sri Lankan Cinnamon Exports
Figure 2: Cinnamon Exports’ Value Chain
Source: Michael Gorman, J. E. Austin Associates, Inc., andFAOSTAT data.
Source: J. E. Austin Associates, Inc.

132 BUILDING COMPETITIVENESS IN AFRICA’S AGRICULTURE
even extending the offer to other financial services (savings,transfers, and longer-term loans). This would extend thedepth, breadth, and sustainability of the services that werepreviously provided (mainly short-term working capital).
To implement this tool, it is useful to map the particularservices that are currently being provided (their sustainabil-ity, quality, and location within the chain), as well as those ser-vices that are potentially viable that can improve the chain’sperformance. Figure 4.50 provides an example of what theresulting map could look like.
The mapping is, of course, related to Tool 2, DesigningInformed Strategies across the Value Chain, as well as to Tool3, Conducting Benchmarking and Gap Assessments of ValueChains. Indeed, sound value chain analysis involves mappingthe actors and, by benchmarking against competitors, identi-fying needed services that could enhance the value chain. Thefocus here, though, is in implementing the results of analyti-cal methods, and, given its importance and potential, thisimplementation is treated as a separate tool in this section.
Once the map of current and potential services is com-plete, interventions can be developed to introduce a servicefor which there is potential demand within the chain, as wellas to improve the quantity, quality, and sustainability ofthose currently being offered.
Entrepreneurs, businesses, and practitioners will need tocarry out feasibility analyses and develop business plans.
Within development projects, the approach will ofteninvolve one or more pilot initiatives carried out in closecollaboration with value chain participants, providing ade-quate support to encourage emergence of the market forservice. In most cases, services that are provided on a mar-ket basis will be more sustainable, as well as those providedby specialized institutions. As many of the services are fromsound, replicable businesses, they can be good examples ofthe replicable business models discussed in tool 5.
A STEP-BY-STEP SUMMARY OF TOOL 10:IDENTIFYING NEEDED SUPPORT SERVICES FORTHE VALUE CHAIN
■ Along the value chain, map services that are currentlybeing provided as well as those services that are poten-tially viable and can lead to improvements in the chain’sperformance. Benchmarking and analyzing gaps againstother value chains are particularly useful tools for identi-fying potential services not being provided.
■ Include in the map indications of the services’ sustain-ability, quality, and location within the chain.
■ Conduct feasibility studies and develop business plans tointroduce services for which there is potential demandwithin the chain and to improve the quantity, quality,and sustainability of those currently being offered. In
Exportmarkets
Domestic massmarkets
Institutionalcustomers
Nichemarkets Local
markets
Whole-sale
Finalproducttraders
Large-scaleprocessors
Primaryproducers
Facilitationof linkages
Productdiversification
Producercoordination
Inputsupplies
Financialservices
Marketinformation
Upgradingstandards
Small-scaleprocessors
Intermediatetraders
Figure 4.50 Mapping Actual and Potential Business and Financial Services
Source: Albu and Griffith (2005), “Mapping the Market: A Framework for Rural Enterprise Development Policy and Practice,” at www.practicalaction.org/?id=mapping_the_market.

TOOL 10: IDENTIFYING NEEDED SUPPORT SERVICES FOR THE VALUE CHAIN 133
most cases, services that are provided on a market basiswill be more sustainable, as well as those provided byspecialized institutions.
NOTE
1. The term “outgrower scheme” is often reserved forschemes where agribusiness has considerable control over
the smallholder production process, providing a largenumber of services, such as input credits, tillage, spraying,and harvesting. The smallholder provides land and laborin return for this comprehensive extension/input package.The high-value horticulture export sector is currently thefocus of considerable development of outgrower schemes(for example, Hortico in Zimbabwe and Homegrownin Kenya).

INTRODUCTION
Commercially viable extension services can be vitalto a value chain’s health. In the case of Zambia’scotton industry, support services were provided
in a variable market that featured too many independentcotton traders and service providers, ultimately resulting insignificant loan defaults, decreases in production, and thefailure of many service providers. This case examines how alarge private firm identified and altered the way it providedextension services to small growers, helping to stabilize andreinvigorate Zambia’s cotton value chain.
POINTS TO CONSIDER
When reviewing this case, consider the following questions:
■ What led to the need to provide support services?■ When is it appropriate to consider implementing differ-
ent models?■ What role does the private sector play in implementation?
BACKGROUND
From the late 1970s until 1994, Zambia’s cotton purchasing,processing, and marketing was controlled by the state-ownedLint Company of Zambia (LINTCO). During that period,LINTCO purchased seed cotton from an estimated 140,000small farmers at a fixed price and extended services such asthe provision of certified seeds, pesticides, sprayers, bags, and
advice on growing techniques. LINTCO was the principlebuyer of seed cotton, the sole provider of extension services,and the sole distributor of inputs on credit. Production fluc-tuated during this period but generally trended downward(figure 4.51). By the early 1990s, LINTCO was operating at aloss, having accumulated substantial unpaid debts.
These trends began to change in 1994. Zambia’s president,Frederick Chiluba, implemented a wide-ranging restructur-ing of Zambia’s economy, including privatizing the cottonindustry through the Zambia Privatization Agency (ZPA).ZPA facilitated the sale of LINTCO to Lonrho Cotton andClark Cotton, two private ginners and exporters. The twofirms operated in different regions of the country, and bothworked through direct outgrower schemes that offered inputsand extension services on credit to farmers. When farmerssold their cotton to ginners, the cost of the inputs and servicesthey received before harvest was deducted from their sellingprice. Because both ginners operated in otherwise under-served markets, their practice of providing seed, other inputs,and services on credit involved minimal risk. Repaymentrates averaged 86 percent.
The expansion of cotton production attracted four newginners and delinters to the market.1 National cotton pro-duction increased through 1997.
To serve the increased demand for cotton, some ginnerscontracted with independent outgrower agents to recruit morefarmers to produce and source cotton to them. These out-grower agents received inputs from the ginners, distributed
Identifying Needed Support Services for the Value Chain—Zambian Cotton Carlton Jones and Martin WebberJ. E. Austin Associates, Inc.
C A S E S T U DY 1 2
134

CASE STUDY 12: IDENTIFYING NEEDED SUPPORT SERVICES FOR THE VALUE CHAIN—ZAMBIAN COTTON 135
Met
ric
To
ns
0
500
1,000
1,500
2,000
2,500
3,000
3,500
1990 1991 1992 1993 1994Year
0
500
1,000
1,500
2,000
2,500
3,000
3,500
Quantity (mt) Value (US$ thousands)
US
$ (1,000)
Figure 4.51 Zambian Cotton Exports, 1990–94
Source: FAOSTAT data.
Farm
Initial Processing
Additional ProcessingDryers
Spinners
GarmentManufacturers
Exporters Exporters
CottonGinners
Ginners extend servicesto farmers on credit inoutgrower schemes
Smallholder CottonseedProducers
Figure 4.52 Zambia's Cotton Value Chain
Source: J. E. Austin Associates, Inc.them to their farm networks on credit, and when harvesttime came, sold the cotton gathered from the farmers backto their respective ginners. In the same way that the increasedcotton production attracted new ginners, the apparent successof the outgrower agents attracted additional independentagents to the market. These agents purchased inputs fromother sources and offered them to any farmer on credit. Inreturn, that farmer would sell cotton back to the independ-ent agent, who would sell to any ginner willing to pay.
This unchecked proliferation of ginners and independ-ent agents led to many problems. By 1998, ginning capacityexceeded production by 50,000 tons per year (Tschirley,Zulu, and Shaffer 2004). With too many agents competingfor a limited number of farmers, sourcing was chaotic. Thiscompetition led to growing distrust and a lack of trans-parency in price setting, with agents and ginners vying tooutbid each other for cotton. Some farmers, despite havingagreed to outgrower contracts with specific ginners, soldtheir cotton to any agent willing to pay more than the con-tract price. Some agents purposefully sought to outbid out-grower contracts to acquire cotton. The entire value chainbecame volatile as ginners and outgrowers experiencedincreased incidences of defaulted loans. Some agents com-pensated for large portfolios of defaulted loans by markingup the inputs they sold to the remaining farmers who hadremained loyal. This made it even more difficult for thoseremaining farmers to make a profit and resulted in evenhigher rates of loan defaults.
By 1999, the entire Zambian cotton value chain was in acrisis (figures 4.52 and 4.53). At this time, Lonrho, whilenegotiating its own sale to Dunavant, began laying thegroundwork for a new service and extension model. At thetime of its sale, Lonrho was projected to post a US$2 million
per year shortfall. To lower the likelihood of their owndefault, the remaining ginners stopped making embeddedservice contracts with growers. In 2000, with no othermeans to finance production, farmer output decreased to50,000 mt, with just 2,500 mt exported (both less than halfof 1998 levels). Many of the outgrower agents that con-tributed to the repayment crisis closed down, and the entirevalue chain had an average credit default rate of 53 percent.Amaka Holdings, a ginning company, went out of business,leaving the remaining ginners to retool in an effort to sur-vive the market crash.
DUNAVANT’S DISTRIBUTOR MODEL
After taking over Lonrho’s operations, Dunavant, a privatelyheld U.S.-based cotton company, further implemented andperfected Lonrho’s service and extension model. The newapproach impacted Zambia’s cotton industry in two ways.First, the service-extension model showed that outgrowerschemes could work with little risk of loan defaults if theschemes were properly designed and managed. Second,Dunavant used its distributor model to significantly expandits production network (see figure 4.54).
Dunavant’s distributor model was very different from pre-vious schemes. In the past, Lonrho relied on a large numberof direct company employees, including almost 800 extensionagents, to carry out the required activities. Overhead in theprevious model was significant, and this burden was greatlyexacerbated when borrowers defaulted. In the new distributormodel, Dunavant used almost no direct-hire employees to
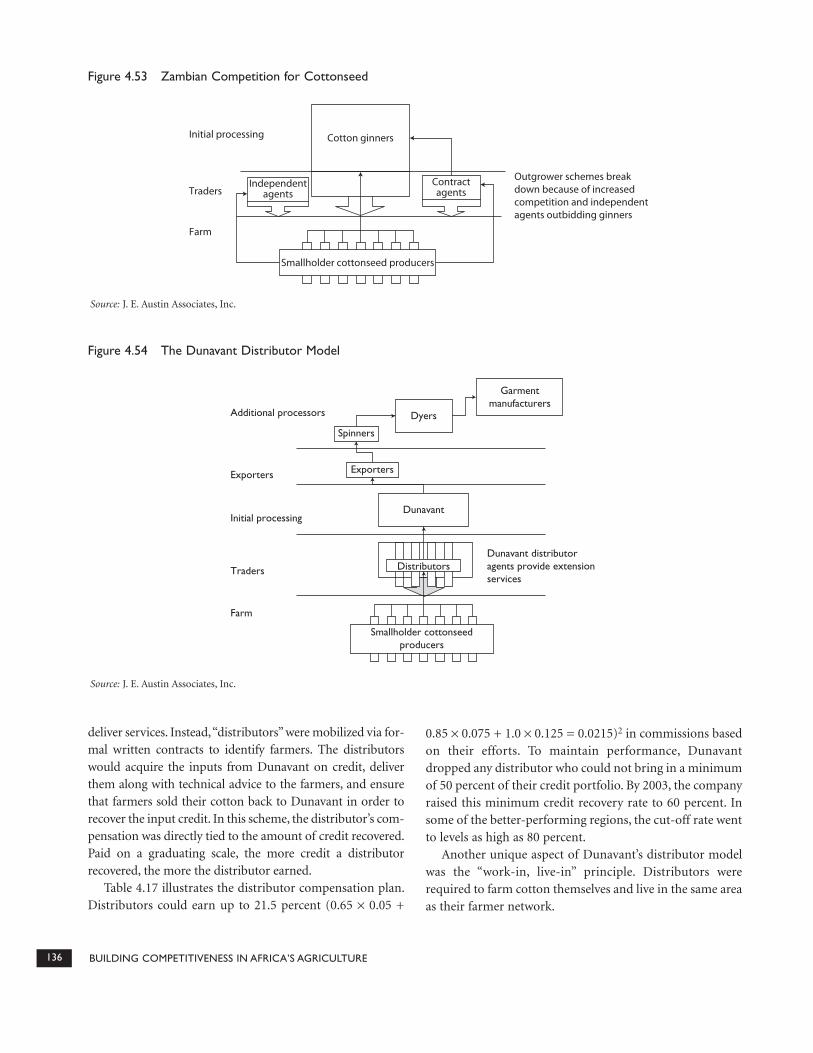
136 BUILDING COMPETITIVENESS IN AFRICA’S AGRICULTURE
deliver services. Instead, “distributors” were mobilized via for-mal written contracts to identify farmers. The distributorswould acquire the inputs from Dunavant on credit, deliverthem along with technical advice to the farmers, and ensurethat farmers sold their cotton back to Dunavant in order torecover the input credit. In this scheme, the distributor’s com-pensation was directly tied to the amount of credit recovered.Paid on a graduating scale, the more credit a distributorrecovered, the more the distributor earned.
Table 4.17 illustrates the distributor compensation plan.Distributors could earn up to 21.5 percent (0.65 × 0.05 +
0.85 × 0.075 + 1.0 × 0.125 = 0.0215)2 in commissions basedon their efforts. To maintain performance, Dunavantdropped any distributor who could not bring in a minimumof 50 percent of their credit portfolio. By 2003, the companyraised this minimum credit recovery rate to 60 percent. Insome of the better-performing regions, the cut-off rate wentto levels as high as 80 percent.
Another unique aspect of Dunavant’s distributor modelwas the “work-in, live-in” principle. Distributors wererequired to farm cotton themselves and live in the same areaas their farmer network.
Initial processing
Traders
Farm
Independentagents
Contractagents
Cotton ginners
Outgrower schemes breakdown because of increasedcompetition and independentagents outbidding ginners
Smallholder cottonseed producers
Figure 4.53 Zambian Competition for Cottonseed
Source: J. E. Austin Associates, Inc.
Additional processors
Garmentmanufacturers
Dyers
Spinners
Exporters
Dunavant
Dunavant distributoragents provide extensionservices
Distributors
Smallholder cottonseedproducers
Exporters
Initial processing
Traders
Farm
Figure 4.54 The Dunavant Distributor Model
Source: J. E. Austin Associates, Inc.

CASE STUDY 12: IDENTIFYING NEEDED SUPPORT SERVICES FOR THE VALUE CHAIN—ZAMBIAN COTTON 137
Dunavant showed its commitment to the success of theprogram by offering two types of training: credit manage-ment and cotton production and harvesting best practices.These courses laid a strong foundation of sound businessoperations and management for the distributors, allowingthem to assess farmers’ creditworthiness while rapidly grow-ing their portfolios.
As Dunavant’s distributor network grew, its outgrowernetwork followed suit with the average distributor handling65 growers each. In step with this growth was Dunavant’srealized increase in credit repayments. In the year prior tothe scheme’s implementation, Dunavant’s reported recoveryrate was 67 percent. After one year in the system, the rate
grew to 80 percent—in the second year, to 88 percent and,after three years, to 93 percent.
CONCLUSIONS: GROWTH OF A SECTOR
Dunavant’s successful rollout of its distributor model ofproviding services to farmers encouraged other ginners tofollow with similar arrangements. Not all ginners replicatedthe model exactly, and most did not place as rigorous anemphasis on training and distributor selection as Dunavant.Still others, such as Zambia’s other large ginner, Clark Cot-ton (Clark’s southern African holdings were purchased byCargill in 1996), maintained the old model and continuedto extend services to farmers via its own employees.
In all, the entire Zambian cotton value chain has experi-enced rapid growth since the sharp drop of the early 2000s(figure 4.55). This rapid recovery was led entirely by the pri-vate sector, in large part because of Dunavant’s ability to iden-tify, design, and deliver innovative ways to extend services tosmall farmers. As of the 2005–06 season, Dunavant was out-performing other Zambian ginners in terms of volume andproduced an estimated 115,000 mt of cotton lint. Clark/Cargillis second in the Zambian market with 60,000 mt.
Met
ric T
ons U
S$ (000)
0
10,000
20,000
30,000
40,000
50,000
60,000
70,000
1995 1996 1997 1998 1999 2000 2001 2002 2003 2004Year
0
10,000
20,000
30,000
40,000
50,000
60,000
70,000
80,000
90,000
Quantity (mt) Value (US$ thousands)
Figure 4.55 Zambia’s Cotton Lint Exports, 1995–2004
Source: FAOSTAT data.
Table 4.17 Dunavant Compensation Plan
Recovery percentage Compensation rate
65–84 5 percent of the total credit
85–99 Additional 7.5 percent of the total credit
100 Additional 12.5 percent of the total credit
Source: Dunavant, 2006.
NOTES
1. Amaka Holdings opened in 1997, but is now closed,having gone into receivership. Continental Ginnery opened
in 1997, Mulungushi Textiles (now Zambia China Mulun-gushi Textiles) opened in 1999. Northern Growers beganservice in 1986, and expanded in 1997.
2. Tschirley (2004).