Embed Size (px)
Citation preview
Positional Accuracy
February 15, 2006
Geog 458: Map Sources and Errors
Outlines
• What is positional accuracy?• Components of positional error• Statistical statement of positional error• Sources of positional error• Evolutions of positional standards• Testing positional accuracy• Documenting positional accuracy
measures
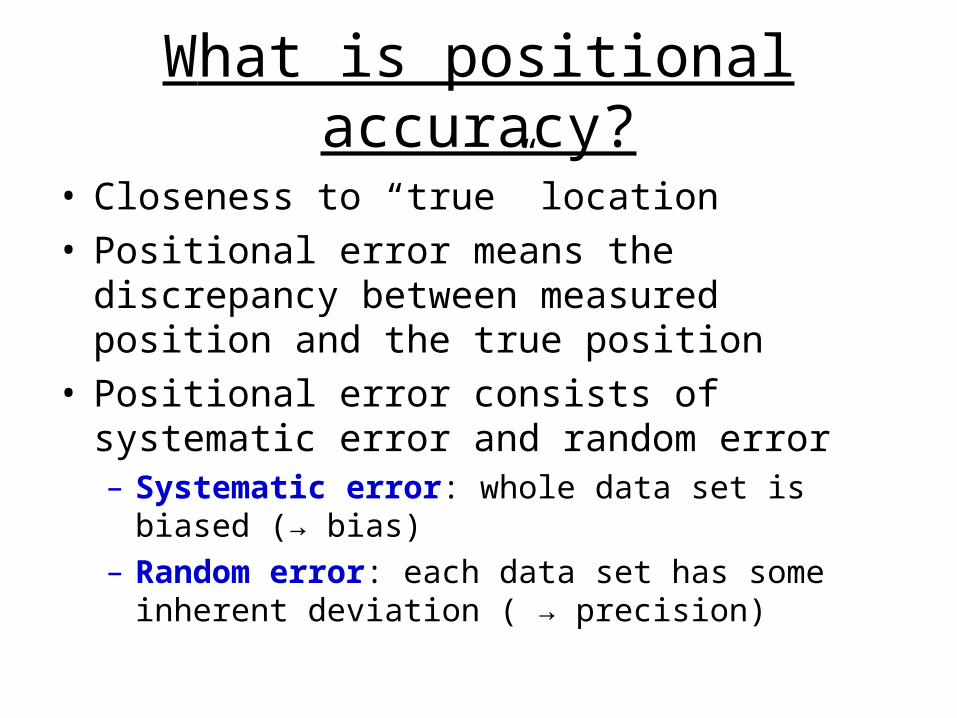
What is positional accuracy?
• Closeness to “true” location• Positional error means the discrepancy between
measured position and the true position• Positional error consists of systematic error and
random error– Systematic error: whole data set is biased (→ bias)– Random error: each data set has some inherent
deviation ( → precision)
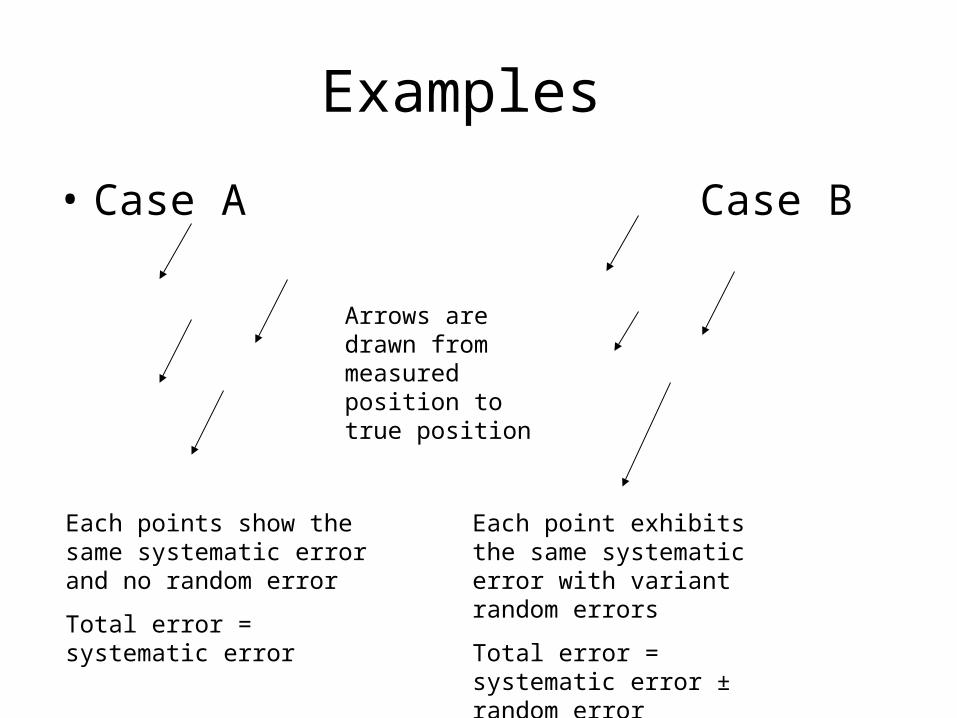
Examples
• Case A Case B
Arrows are drawn from measured position to true position
Each points show the same systematic error and no random error
Total error = systematic error
Each point exhibits the same systematic error with variant random errors
Total error = systematic error ± random error
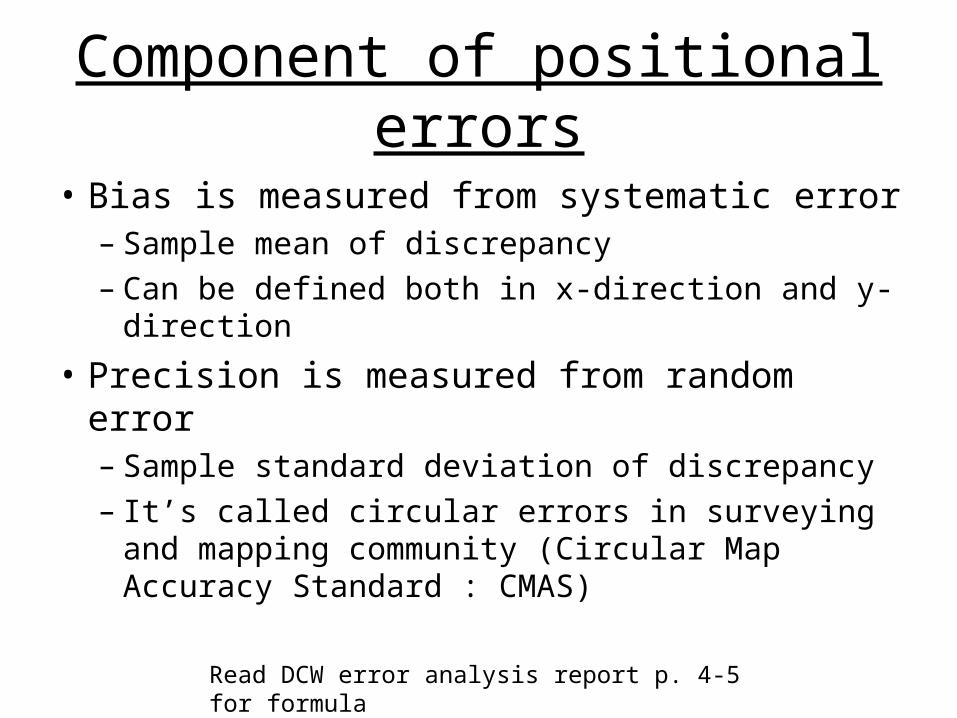
Component of positional errors
• Bias is measured from systematic error– Sample mean of discrepancy– Can be defined both in x-direction and y-
direction
• Precision is measured from random error– Sample standard deviation of discrepancy– It’s called circular errors in surveying and
mapping community (Circular Map Accuracy Standard : CMAS)
Read DCW error analysis report p. 4-5 for formula
Examples
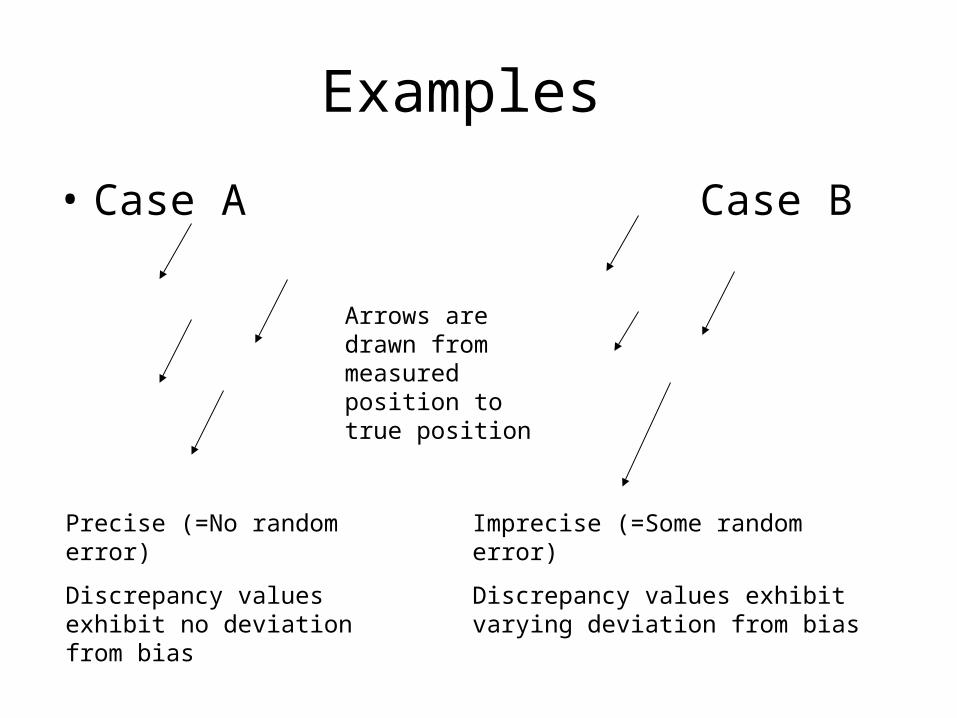
• Case A Case B
Arrows are drawn from measured position to true position
Precise (=No random error)
Discrepancy values exhibit no deviation from bias
Imprecise (=Some random error)
Discrepancy values exhibit varying deviation from bias
Statistical statement of positional errors
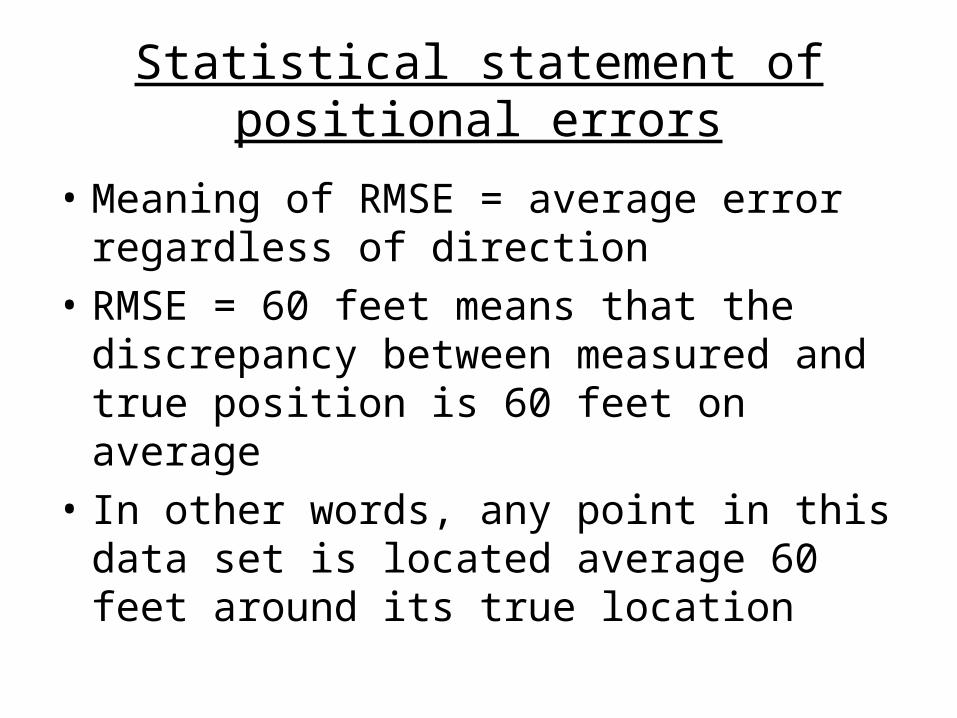
• Meaning of RMSE = average error regardless of direction
• RMSE = 60 feet means that the discrepancy between measured and true position is 60 feet on average
• In other words, any point in this data set is located average 60 feet around its true location
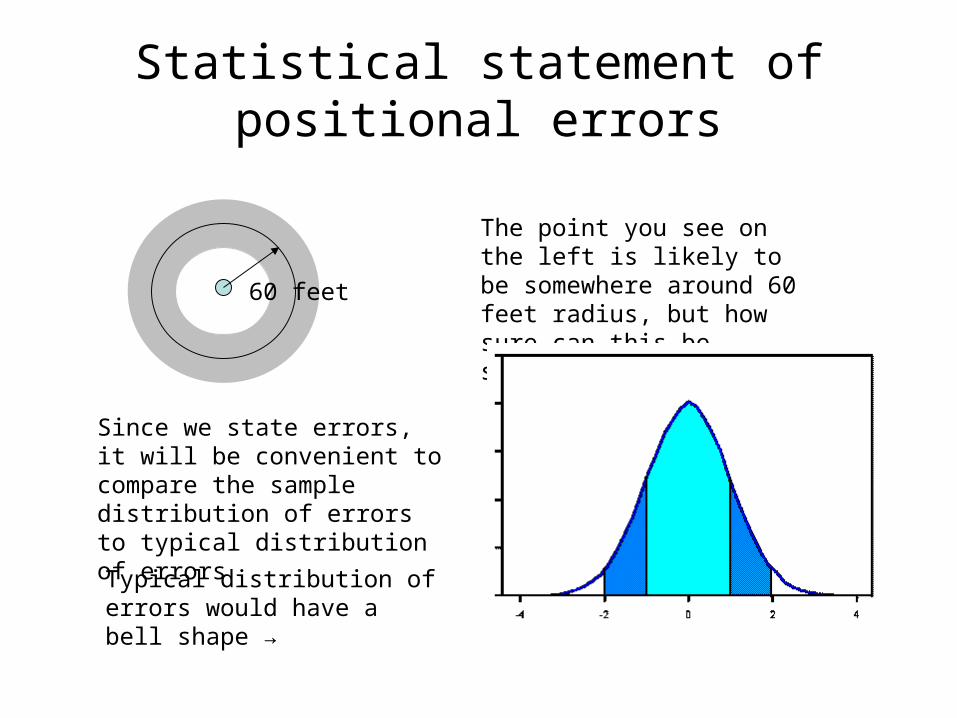
Statistical statement of positional errors
The point you see on the left is likely to be somewhere around 60 feet radius, but how sure can this be stated?
60 feet
Since we state errors, it will be convenient to compare the sample distribution of errors to typical distribution of errors
Typical distribution of errors would have a bell shape →
Statistical statement of positional errors
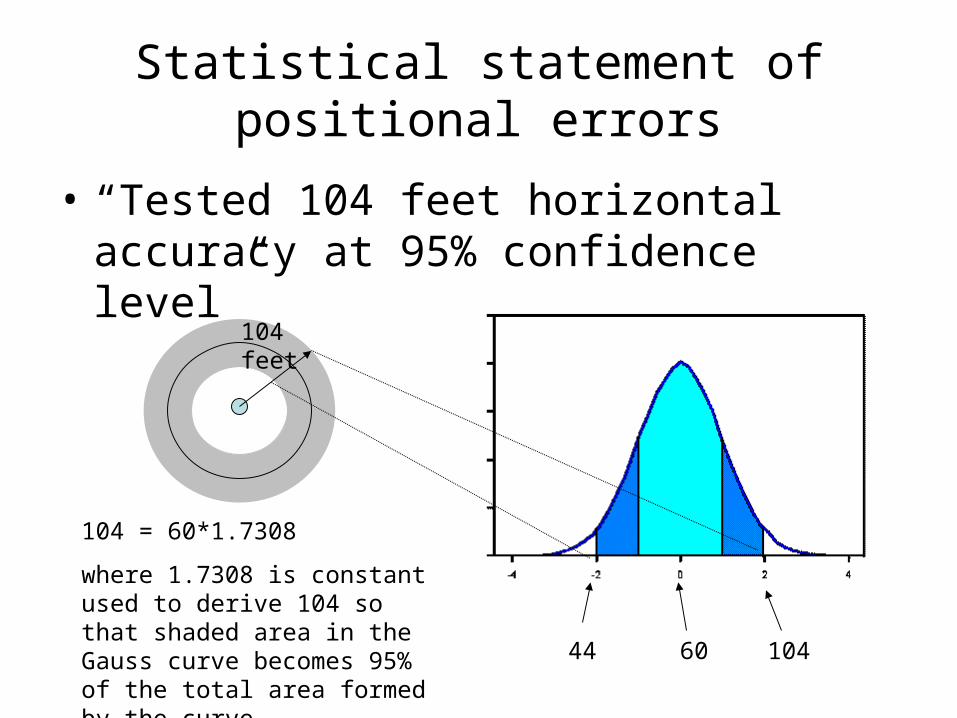
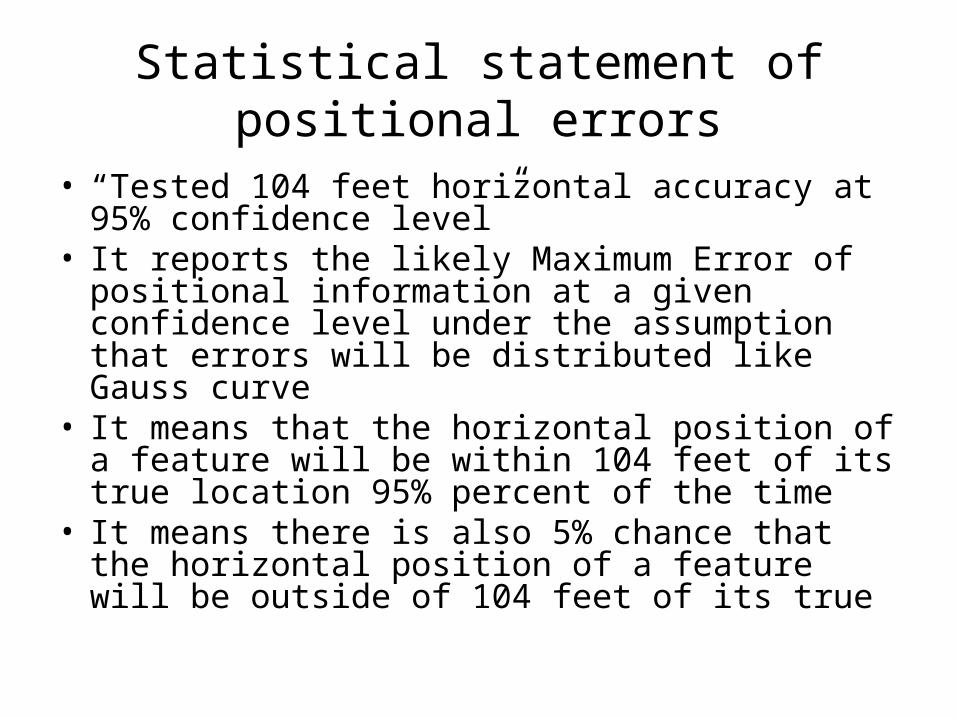
• “Tested 104 feet horizontal accuracy at 95% confidence level”
104 feet
60
104 = 60*1.7308
where 1.7308 is constant used to derive 104 so that shaded area in the Gauss curve becomes 95% of the total area formed by the curve 10444
Statistical statement of positional errors
• “Tested 104 feet horizontal accuracy at 95% confidence level”
• It reports the likely Maximum Error of positional information at a given confidence level under the assumption that errors will be distributed like Gauss curve
• It means that the horizontal position of a feature will be within 104 feet of its true location 95% percent of the time
• It means there is also 5% chance that the horizontal position of a feature will be outside of 104 feet of its true
Sources of positional errors• Source
– Surveying or measurement equipment errors– Measurements are of varying precisions– Equipments have inherently different resolutions
• Processing steps– Transformation between different coordinate systems– Rounding errors when data is stored in different formats– Location/accuracy of control points– Algorithms used for transformation
• Better look at a lineage report• To fully understand positional accuracy involves first identifying the
steps contributing to the determination of the database object’s coordinates
• How do we know which step introduces more errors relative to other steps? Error propagation analysis (then we can go back to the most problematic steps to fix it to improve the accuracy)
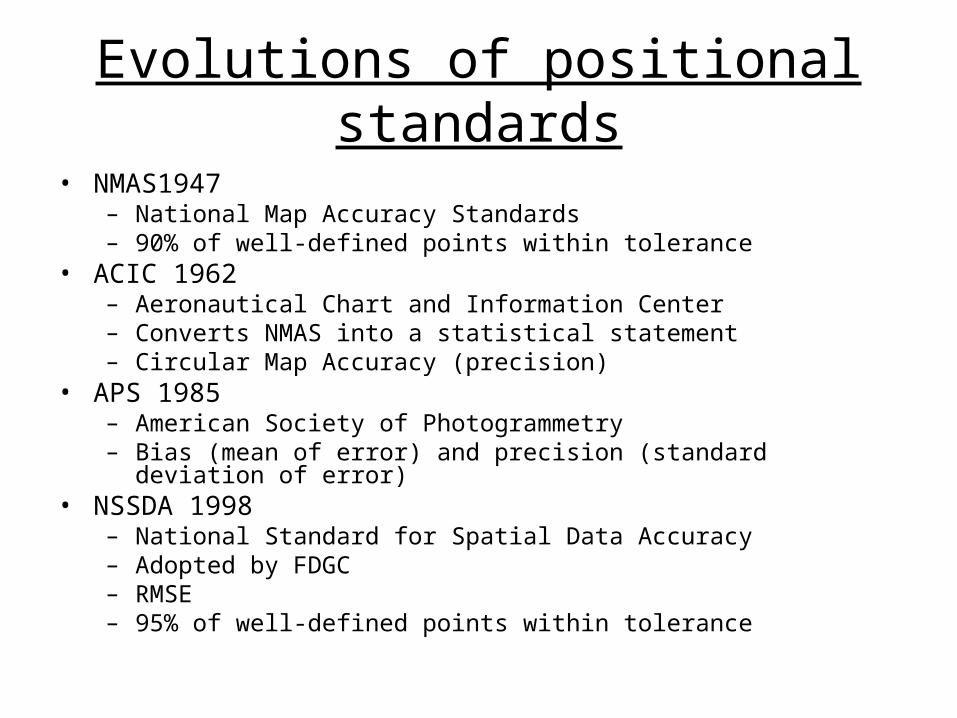
Evolutions of positional standards
• NMAS1947– National Map Accuracy Standards– 90% of well-defined points within tolerance
• ACIC 1962– Aeronautical Chart and Information Center– Converts NMAS into a statistical statement – Circular Map Accuracy (precision)
• APS 1985– American Society of Photogrammetry– Bias (mean of error) and precision (standard deviation of error)
• NSSDA 1998– National Standard for Spatial Data Accuracy– Adopted by FDGC– RMSE– 95% of well-defined points within tolerance
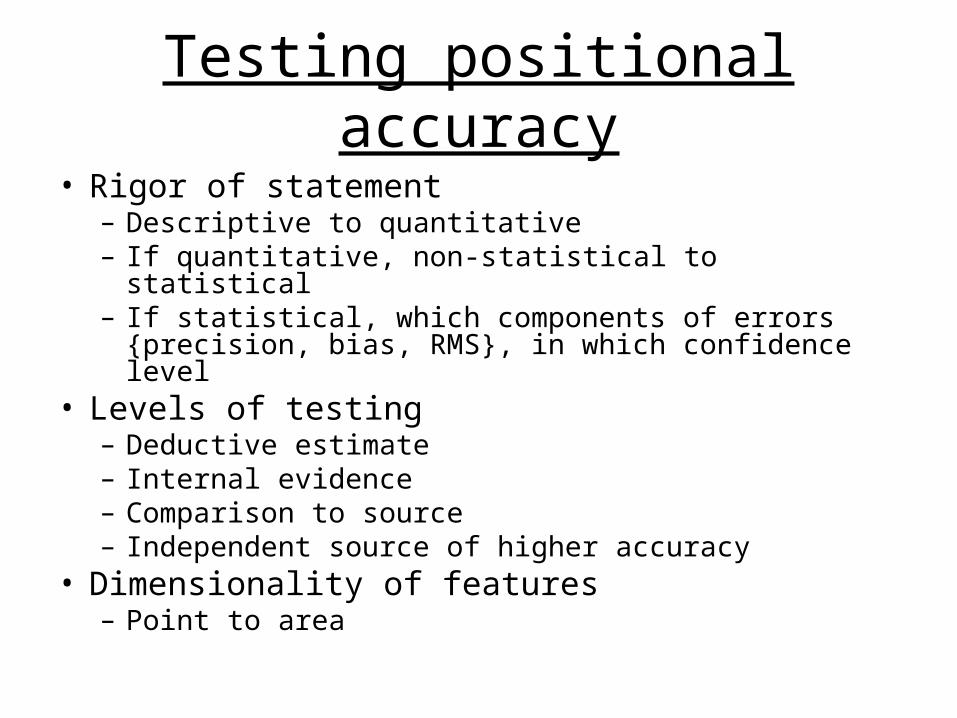
Testing positional accuracy
• Rigor of statement– Descriptive to quantitative – If quantitative, non-statistical to statistical– If statistical, which components of errors {precision,
bias, RMS}, in which confidence level • Levels of testing
– Deductive estimate– Internal evidence– Comparison to source– Independent source of higher accuracy
• Dimensionality of features– Point to area
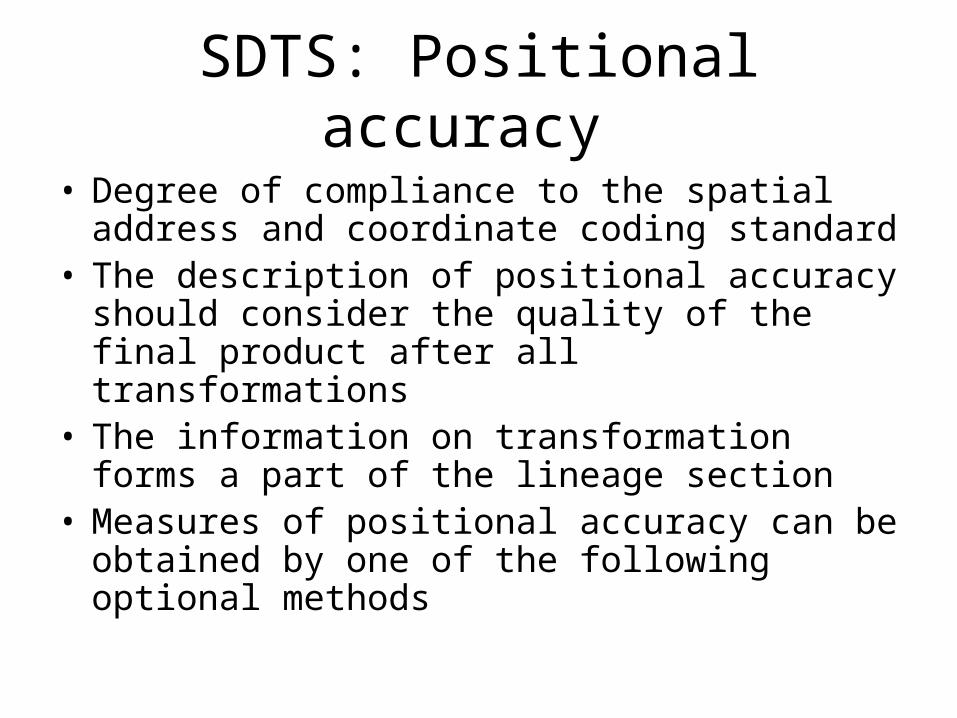
SDTS: Positional accuracy
• Degree of compliance to the spatial address and coordinate coding standard
• The description of positional accuracy should consider the quality of the final product after all transformations
• The information on transformation forms a part of the lineage section
• Measures of positional accuracy can be obtained by one of the following optional methods
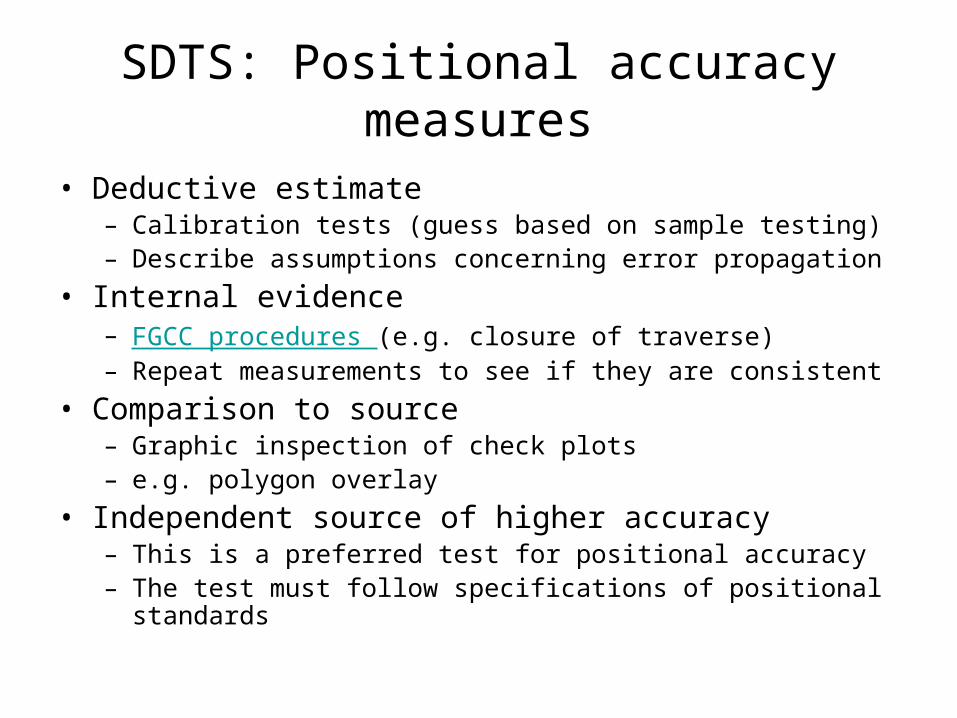
SDTS: Positional accuracy measures
• Deductive estimate– Calibration tests (guess based on sample testing)– Describe assumptions concerning error propagation
• Internal evidence– FGCC procedures (e.g. closure of traverse)– Repeat measurements to see if they are consistent
• Comparison to source– Graphic inspection of check plots– e.g. polygon overlay
• Independent source of higher accuracy– This is a preferred test for positional accuracy– The test must follow specifications of positional standards
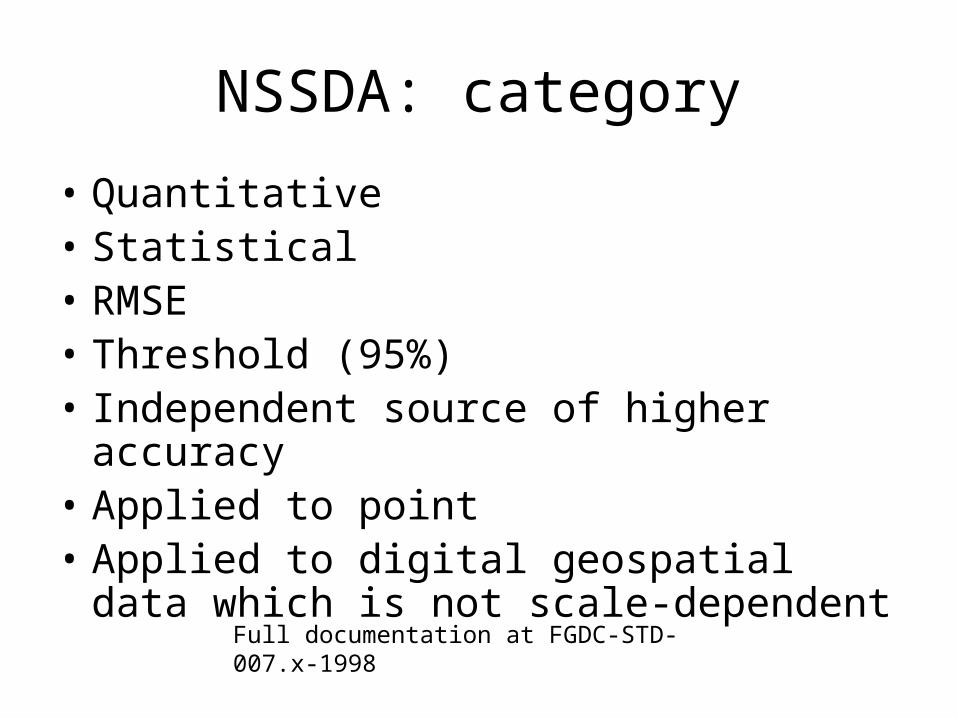
NSSDA: category
• Quantitative• Statistical• RMSE• Threshold (95%)• Independent source of higher accuracy• Applied to point• Applied to digital geospatial data which is
not scale-dependentFull documentation at FGDC-STD-007.x-1998
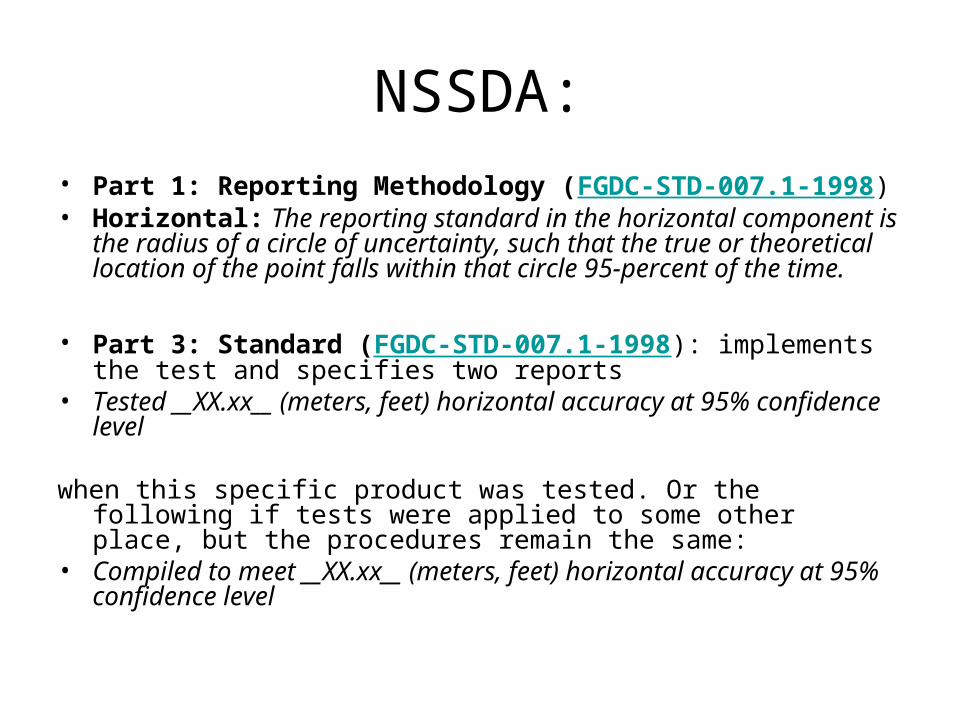
NSSDA:• Part 1: Reporting Methodology (FGDC-STD-007.1-1998)• Horizontal: The reporting standard in the horizontal component is
the radius of a circle of uncertainty, such that the true or theoretical location of the point falls within that circle 95-percent of the time.
• Part 3: Standard (FGDC-STD-007.1-1998): implements the test and specifies two reports
• Tested __XX.xx__ (meters, feet) horizontal accuracy at 95% confidence level
when this specific product was tested. Or the following if tests were applied to some other place, but the procedures remain the same:
• Compiled to meet __XX.xx__ (meters, feet) horizontal accuracy at 95% confidence level
NSSDA: procedure
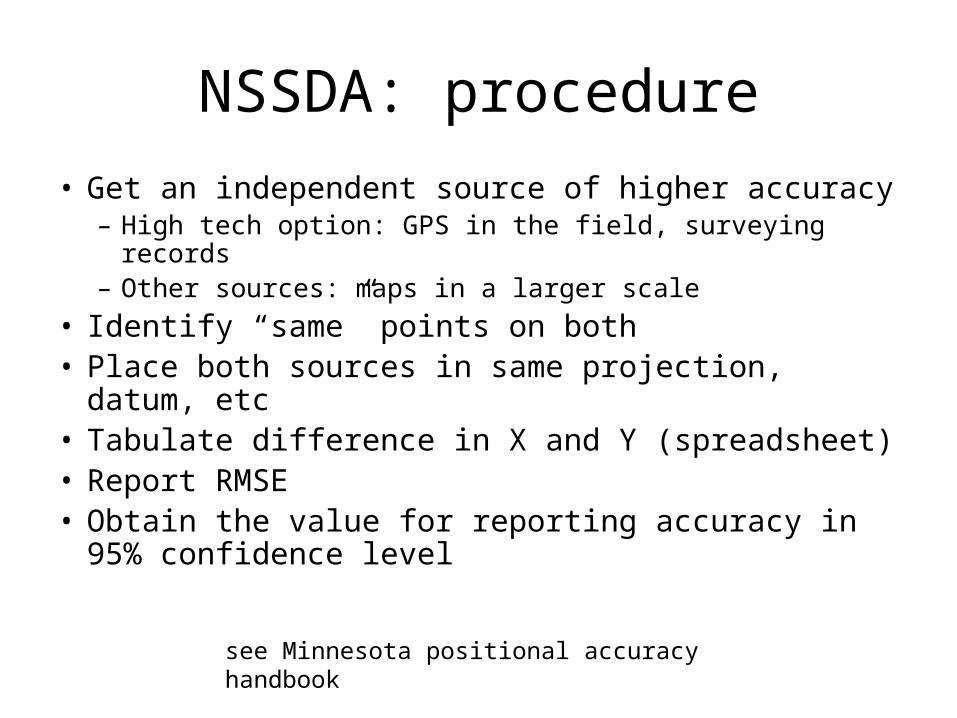
• Get an independent source of higher accuracy– High tech option: GPS in the field, surveying records– Other sources: maps in a larger scale
• Identify “same” points on both • Place both sources in same projection, datum,
etc• Tabulate difference in X and Y (spreadsheet)• Report RMSE• Obtain the value for reporting accuracy in 95%
confidence levelsee Minnesota positional accuracy handbook
NSSDA: procedure: details
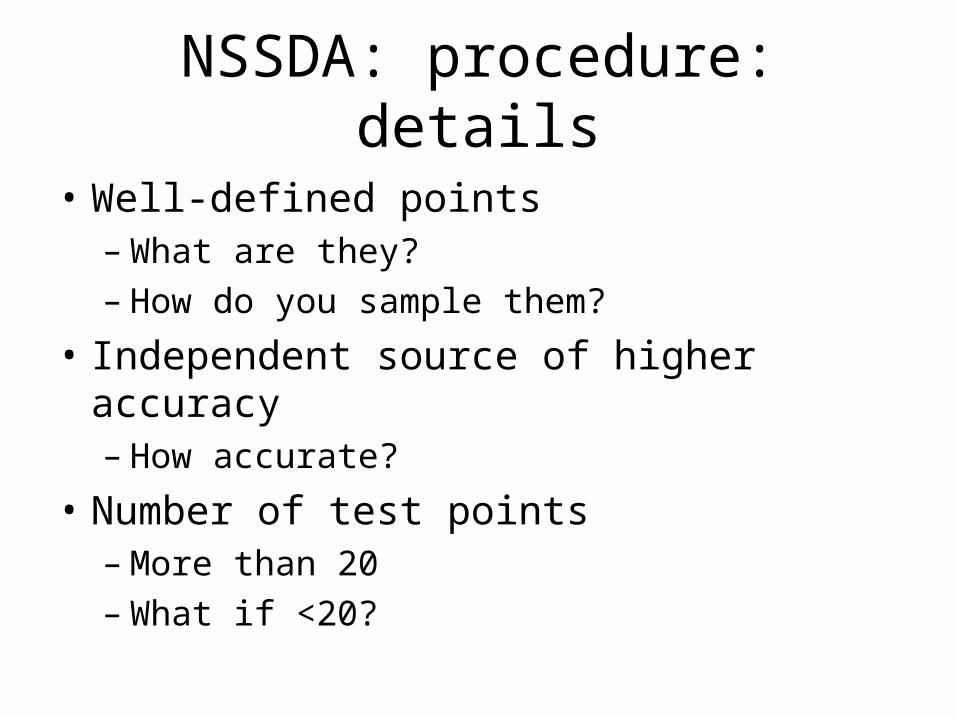
• Well-defined points– What are they?– How do you sample them?
• Independent source of higher accuracy– How accurate?
• Number of test points– More than 20– What if <20?
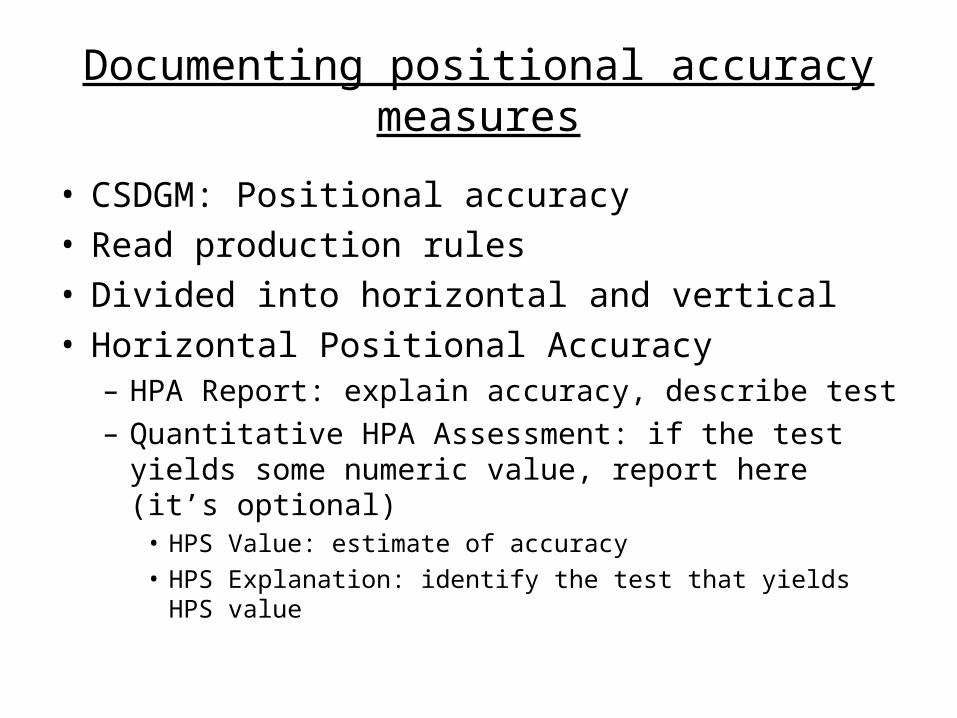
Documenting positional accuracy measures
• CSDGM: Positional accuracy• Read production rules• Divided into horizontal and vertical• Horizontal Positional Accuracy
– HPA Report: explain accuracy, describe test– Quantitative HPA Assessment: if the test yields some
numeric value, report here (it’s optional)• HPS Value: estimate of accuracy• HPS Explanation: identify the test that yields HPS value
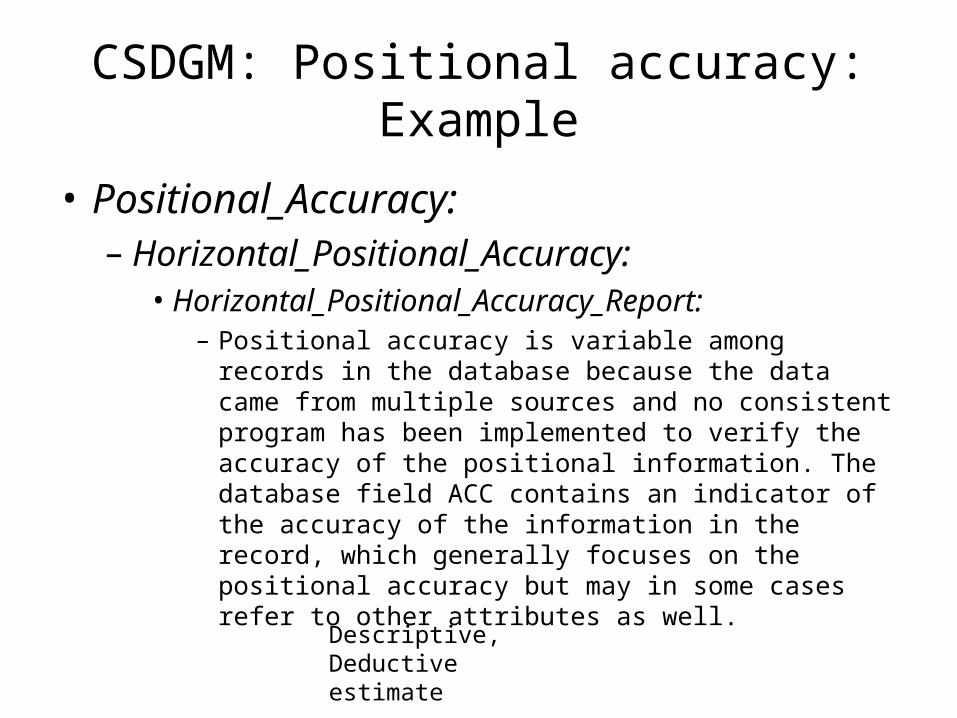
CSDGM: Positional accuracy: Example
• Positional_Accuracy: – Horizontal_Positional_Accuracy:
• Horizontal_Positional_Accuracy_Report: – Positional accuracy is variable among records in the
database because the data came from multiple sources and no consistent program has been implemented to verify the accuracy of the positional information. The database field ACC contains an indicator of the accuracy of the information in the record, which generally focuses on the positional accuracy but may in some cases refer to other attributes as well.
Descriptive, Deductive estimate
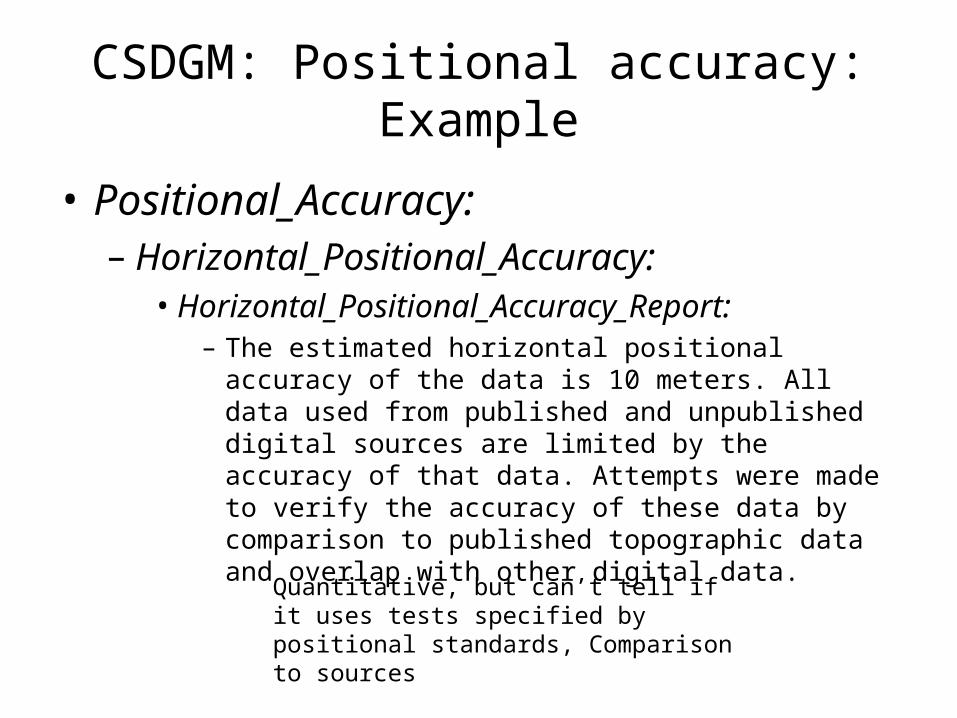
CSDGM: Positional accuracy: Example
• Positional_Accuracy: – Horizontal_Positional_Accuracy:
• Horizontal_Positional_Accuracy_Report: – The estimated horizontal positional accuracy of the data
is 10 meters. All data used from published and unpublished digital sources are limited by the accuracy of that data. Attempts were made to verify the accuracy of these data by comparison to published topographic data and overlap with other digital data.
Quantitative, but can’t tell if it uses tests specified by positional standards, Comparison to sources
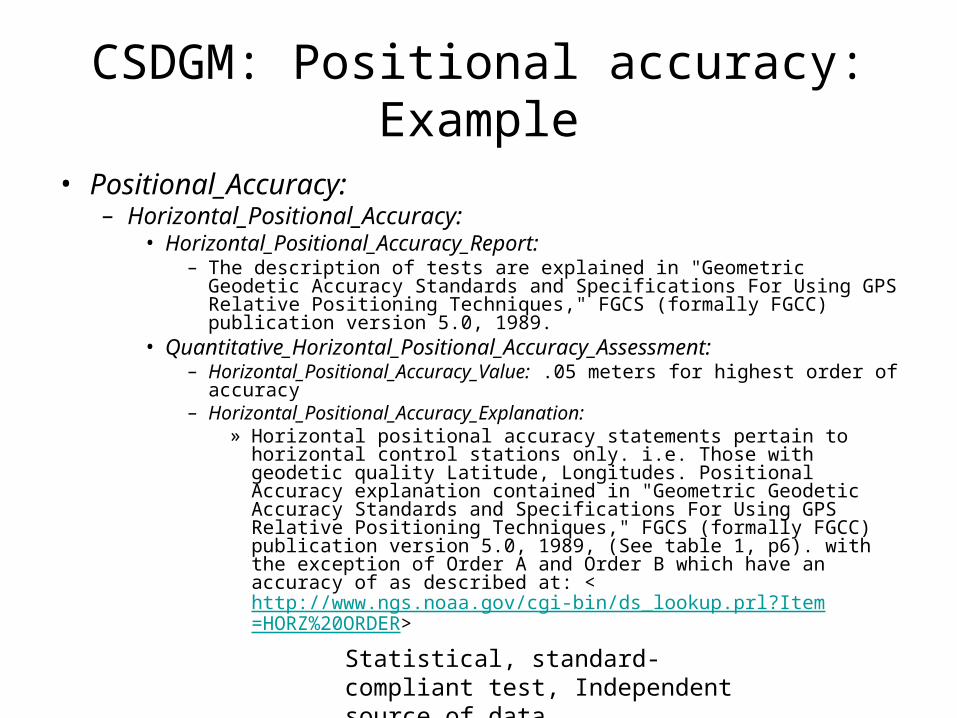
CSDGM: Positional accuracy: Example
• Positional_Accuracy: – Horizontal_Positional_Accuracy:
• Horizontal_Positional_Accuracy_Report: – The description of tests are explained in "Geometric Geodetic Accuracy
Standards and Specifications For Using GPS Relative Positioning Techniques," FGCS (formally FGCC) publication version 5.0, 1989.
• Quantitative_Horizontal_Positional_Accuracy_Assessment: – Horizontal_Positional_Accuracy_Value: .05 meters for highest order of
accuracy– Horizontal_Positional_Accuracy_Explanation:
» Horizontal positional accuracy statements pertain to horizontal control stations only. i.e. Those with geodetic quality Latitude, Longitudes. Positional Accuracy explanation contained in "Geometric Geodetic Accuracy Standards and Specifications For Using GPS Relative Positioning Techniques," FGCS (formally FGCC) publication version 5.0, 1989, (See table 1, p6). with the exception of Order A and Order B which have an accuracy of as described at: <http://www.ngs.noaa.gov/cgi-bin/ds_lookup.prl?Item=HORZ%20ORDER>
Statistical, standard-compliant test, Independent source of data


![Title 458 Title 458 WAC REVENUE, DEPARTMENT OFleg.wa.gov/CodeReviser/WACArchive/Documents/2005/WAC458A.pdf · (2005 Ed.) [Title 458 WAC—p. 1] Title 458 Title 458 WAC REVENUE, DEPARTMENT](https://img.pdfslide.us/doc/110x75/5bfc3f4009d3f2bc6e8b6469/title-458-title-458-wac-revenue-department-oflegwagovcodereviserwacarchivedocuments2005.jpg)