Embed Size (px)
Citation preview

SPECIAL SECTION ON EMERGING TECHNOLOGIES ON VEHICLE TO EVERYTHING (V2X)
Received November 15, 2018, accepted December 22, 2018, date of publication January 15, 2019, date of current version February 8, 2019.
Digital Object Identifier 10.1109/ACCESS.2019.2893136
Position-Specific Statistics of 60 GHz VehicularChannels During OvertakingERICH ZÖCHMANN 1,2,3, (Member, IEEE), MARKUS HOFER 4, (Student Member, IEEE),MARTIN LERCH2, (Student Member, IEEE), STEFAN PRATSCHNER1,2, (Student Member, IEEE),LAURA BERNADÓ4, (Member, IEEE), JIRI BLUMENSTEIN 3, (Member, IEEE),SEBASTIAN CABAN 2, SEUN SANGODOYIN 5, (Student Member, IEEE),HERBERT GROLL 2, (Student Member, IEEE), THOMAS ZEMEN 4, (Senior Member, IEEE),ALEŠ PROKEŠ3, MARKUS RUPP 2, (Fellow, IEEE), ANDREAS F. MOLISCH 5, (Fellow, IEEE),AND CHRISTOPH F. MECKLENBRÄUKER 2, (Senior Member, IEEE)1Christian Doppler Laboratory for Dependable Wireless Connectivity for the Society in Motion, Institute of Telecommunications, TU Wien, 1040 Vienna, Austria2Institute of Telecommunications, TU Wien, 1040 Vienna, Austria3Department of Radio Electronics, TU Brno, 616 00 Brno, Czech Republic4Center for Digital Safety & Security, AIT Austrian Institute of Technology, 1210 Vienna, Austria5Ming Hsieh Department of Electrical Engineering, University of Southern California, Los Angeles, CA 90007, USA
Corresponding author: Erich Zöchmann ([email protected])
This work was supported in part by the Austrian Federal Ministry for Digital and Economic Affairs, in part by the National Foundation forResearch, Technology and Development, in part by the Czech Science Foundation under Project 17-27068S and Project 17-18675S, and inpart by the National Sustainability Program under Grant LO1401. The work of S. Sangodoyin and A. F. Molisch was supported in part byNSF under Grant CNS-1457340, and in part by NIST under Grant 70NANB17H157. The authors acknowledge the TU Wien UniversityLibrary for financial support through its Open Access Funding Program. For this research, the infrastructure of the SIX Center was used.This work was carried out in the framework of COST Action CA15104 IRACON.
ABSTRACT The time-variant vehicle-to-vehicle radio propagation channel in the frequency band from59.75 to 60.25 GHz has been measured in an urban street in the city center of Vienna, Austria. We havemeasured a set of 30 vehicle-to-vehicle channel realizations to capture the effect of an overtaking vehicle.Our experiment was designed for characterizing the large-scale fading and the small-scale fading dependingon the overtaking vehicle’s position. We demonstrate that large overtaking vehicles boost the mean receivepower by up to 10 dB. The analysis of the small-scale fading reveals that the two-wave with diffusepower (TWDP) fading model is adequate. By means of the model selection, we demonstrate the regionswhere the TWDP model is more favorable than the customarily used the Rician fading model. Furthermore,we analyze the time selectivity of our vehicular channel. To precisely define the Doppler and delayresolutions, a multitaper spectral estimator with discrete prolate spheroidal windows is used. The delay andDoppler profiles are inferred from the estimated local scattering function. Spatial filtering by the transmittinghorn antenna decreases the delay and Doppler spread values. We observe that the RMS Doppler spread isbelow one-tenth of the maximum Doppler shift 2f v/c. For example, at 60 GHz, a relative speed of 30 km/hyields a maximum Doppler shift of approximately 3300 Hz. The maximum RMS Doppler spread of allobserved vehicles is 450 Hz; the largest observed RMS delay spread is 4 ns.
INDEX TERMS 5G mobile communication, automotive engineering, communication channels, fadingchannels, intelligent vehicles, millimeter wave propagation, millimeter wave measurement, multipathchannels, RMS delay spread, RMS Doppler spread, parameter extraction, time-varying channels, two-wavewith diffuse power fading, wireless communication.
I. INTRODUCTIONThe idea of automated cars represents a tremendous attrac-tion to both, industry and the research community. Morethan ten years ago, a first forward collision warning sys-tem based on a millimeter wave (mmWave) automotiveradar was commercialized [3]. Nowadays, reliable mmWave
communication systems, supporting vehicle-to-vehicle infor-mation exchange, are anticipated to be among the keyenablers for automated vehicles [4]. Due to the large availablebandwidth at mmWave bands, even raw sensor data exchangebetween vehicles is possible [4]. Millimeter wave vehic-ular communications has two main distinctive features as
142162169-3536 2019 IEEE. Translations and content mining are permitted for academic research only.
Personal use is also permitted, but republication/redistribution requires IEEE permission.See http://www.ieee.org/publications_standards/publications/rights/index.html for more information.
VOLUME 7, 2019

E. Zöchmann et al.: Position-Specific Statistics of 60 GHz Vehicular Channels During Overtaking
compared to sub-6-GHz vehicular communications. Firstly,the use of directive antennas – at least at one link end – andsecondly, the much higher maximumDoppler shift. This highmaximum Doppler shift, being directly proportional to thecarrier frequency, is also viewed as a possible stumblingstone for vehicular mmWave communications. It is, however,shown theoretically in [5] and [6] that directional antennas,anticipated for mmWaves, act as spatial filters. The Dopplerspread, and hence the time-selectivity, may be drasticallydecreased by beamforming. Experimentally, this has firstbeen demonstrated in our prior work [2].
A. LITERATURE REVIEWThe analysis of static mmWave channels is already welladvanced, see for example [7]–[29]. For static environments,frequency-domain channel sounding methods based on vec-tor network analyzers are frequently used [30]. However,channel sounding concepts with sufficient sampling rates ofthe time-varying channel have been so far only treated by afew research papers [1], [2], [31]–[34].
Interestingly, mmWave frequency bands have been can-didates for vehicular communications already for severaldecades [35], [36]. Millimeter wave train-to-infrastructurepath loss is measured in [35], mmWave vehicle-to-vehiclecommunication performance is studied in [36]. Both worksuse narrowband transmissions. In [37] and [38], the focusis on inter-vehicle path loss results. Recent advances onmmWave circuit technology [39] renewed the interest invehicular mmWave communications [40] and for joint vehic-ular communication and radar [41]. In [42], vehicle-to-vehicle (V2V) channel measurements at 38GHz and 60GHz,using a channel sounder with 1GHz bandwidth, have beenconducted. The antennas in [42] were put into the bumpers,thereby the dominating multipath components (MPCs) arethe line-of-sight (LOS) component, a road reflection, anda delayed component reflected at the guard rails. In [43],73GHz V2V large-scale fading and small-scale fading anal-ysis is provided for approaching vehicles. Intra-vehicularDoppler spectra of vibrations appearing while the vehicle isin operation are shown in [44] and [45]. In [46], signal-to-noise ratio (SNR) fluctuations for 60GHz transmissions with5MHz bandwidth in a vehicle-to-infrastructure scenario areinvestigated. Time-varying receive power and time-varyingsmall-scale fading for vehicular channels at 5.6GHz areaddressed in [47].
B. CONTRIBUTIONS OF THIS PAPERWith this article, we contribute to the dynamic mmWavevehicle-to-vehicle channel research by analyzing the effectof an overtaking vehicle on the mmWave V2V wide-band (510MHz) channel. Our experiment in a real-worldstreet environment is designed to make the experimentas controllable as possible. The wireless link is alwaysLOS and unblocked. We demonstrate that the size and therelative position of the overtaking vehicle greatly influ-ences the large-scale and small-scale fading parameters.
Furthermore, Doppler dispersion is strongly suppressed bythe transmit horn antenna. The data we analyze consist ofchannel impulse responses (CIRs) during the overtaking sit-uations with 30 vehicles. For the statistical analysis we dif-ferentiate between cars, sport utility vehicles (SUVs), andtrucks.
C. ORGANIZATION OF THIS PAPERIn Section II, we present our measurement scenario in detail.In Section III, we analyze the receive power fluctuations asa function of the relative position of the overtaking vehicle.Regardless of the position of the overtaking vehicle and itssize, approximately 50% of the receive power belongs to thechannel tap corresponding to the LOS delay. Accordingly,in the following Section IV, we analyze the small-scale fadingof the LOS tap. The two-wave with diffuse power (TWDP)model is briefly introduced and we show that it explainsour data very well. In Section V, we focus on delay andDoppler dispersion. The analysis of the root mean square(RMS) Doppler spread is based on the local scattering func-tion (LSF). The obtained RMSDoppler spread values are thencompared against RMS Doppler spread values of commonlyused models. We conclude with simple channel modelingguidelines.
D. NOTATIONWe mention here only notation that is not commonly inuse. Estimated quantities are marked with ˆ(·). Functions withdiscrete input variables are denoted by square brackets f [·];functions with continuous inputs are denoted by parenthesesf (·). The floor function is indicated via b·c and the ceilingfunction is indicated via d·e. ‘‘Corresponds to’’ is symbolizedwith ,.
II. SCENARIO DESCRIPTIONWe havemeasured a set of 60GHz vehicle-to-vehicle channelrealizations to capture the effect of an overtaking vehicle. Themotivation for our setup is the scenario of two cars driving,one behind the other, keeping constant distance, and commu-nicating via a 60GHz mmWave link. A third vehicle thenovertakes this car platoon and thus influences the wirelesschannel, depending on the overtaking car’s relative position.1
The vehicular channel data evaluated for this contributionconsists of 30 different measurement runs. We are observingthe effect of overtaking vehicles with excess speeds of up to13m/s. At the transmitter (TX) site, a horn antenna with an18◦ half power beam width is used and aligned towards thereceiver (RX) car. Surrounding buildings are filtered out bythe directive horn antenna. At the RX site, a custom-builtomni-directional (λ/4) monopole antenna is used. The RXhas an omni-directional pattern so that scattered2 waves fromthe passing vehicle are not filtered out. This situation occurs,
1Similar results will be obtained, if the car platoon overtakes a vehicle.2By scattering we refer to any kind of wave interaction such as diffuse
reflection or diffraction.
VOLUME 7, 2019 14217
E. Zöchmann et al.: Position-Specific Statistics of 60 GHz Vehicular Channels During Overtaking
FIGURE 1. Bird’s-eye view of the measurement site. TX and RX are static.The overtaking car is moving relative to the static vehicles with excessspeed v . This models a moving car platoon being overtaken by a singlevehicle. The overtaking vehicle is sketched at a bumper to bumperdistance of d = 0 m.
for example, in directional neighbor discovery [48], whereonly one link end applies beamforming. Our RX equipmentis put into a static (parked) car. The RX antenna is fixedto the left rear car window. Our TX is approximately 15mbehind the RX car. Single reflections at the TX car do notoccur because of the directivity of the horn antenna, whiledouble reflections involving the TX car are below the receiversensitivity. Hence, the TX car is omitted and replaced by asimple tripod mounting. The TX and RX placement is shownin Figs. 1 and 2.
To simplify the measurements, we do not move TX andRX, but rather keep them static, and have the overtaking caremulated by regular street traffic passing by. As indicatedabove, this approach is valid because interaction by housesand other static objects are negligible due to the directivity ofthe TX horn antenna. Due to the spatial filtering, Doppler ismainly determined by the relative velocity of the overtakingvehicle. Our case corresponds to a ‘‘moving frame of refer-ence’’. Keeping TX and RX static makes a very accurate time
and frequency synchronization possible. The frequency syn-chronization is achieved via a 10MHz reference signal dis-tribution to all clocks. The time synchronization is achievedwith amarker signal that triggers the receiver when the sound-ing signal is transmitted. A measurement is triggered oncethe overtaking vehicle is driving through a first light barrier,positioned at dstart. The distance dstart is measured from therear bumper of the parked receiver car. The mean velocityof the overtaking vehicle is estimated through a second lightbarrier, positioned 3m after the first one. We measured thetime 1t it took for the vehicle to arrive at the second lightbarrier. By means of the mean velocity estimate v and thestarting point dstart, we estimate the position of the overtakingvehicle at all time points m to
d[m] = v · mTsnap + dstart =3m1t
m Tsnap + dstart , (1)
where Tsnap is the snapshot rate, provided in Appendix B.We hence take the front bumper of the overtaking vehicleand the rear bumper of the parked receiver car as referenceplanes. The distance d is thus referred to as the ‘‘bumperto bumper distance’’. The range of interest is marked viameter marks on the left-hand side in Fig 1. Memory space islimiting the recording time of our 510MHz broadband signalto 720ms. Due to this limitation, the recorded measurementsdo not necessarily cover all distances of interest. To cover thedistances shown in Fig. 1, the light barriers, triggering themeasurements, are placed at three different positions. In otherwords, dstart is varied. An exemplary light barrier position tocover the larger distances is illustrated in Fig 1.
III. RECEIVE POWER FLUCTUATION (LARGE-SCALEFADING) DURING OVERTAKINGWehave built a dedicated channel sounder for this experiment(for details see Appendix B) that provides estimates of thetime-variant transfer function H [m, q]. The time index isdenoted by m ∈ {0, . . . , S − 1} and the frequency indexis denoted by q ∈ {0, . . . ,K − 1}, where K = 103. Thetime-variant CIR h[m, n] with delay index n is obtained viaan inverse discrete Fourier transform3. The CIR h exhibits asparse structure. Therefore, the median of all samples of h isused as estimator of the noise floor [49]. All values of the CIRbelow a threshold that is 6 dB above this noise floor are set tozero.
Similar as in [47], we estimate the large-scale fading byapplying a moving average filter of length Lf. Likewise,we assume that the fading process is stationary as long as themovement of the scattering object (the overtaking vehicle) iswithin Lc , 50 λ = 50 · 5mm = 0.25m. The filter lengthLf depends on the velocity of the overtaking vehicles andis always chosen to cover Lc and to extend it to the earlierand later time point by 1L = 10 samples [47]. It hence
3We do not apply window functions so that the temporal resolution willnot be degraded. This will be important for the data evaluation in Section IV.
14218 VOLUME 7, 2019
E. Zöchmann et al.: Position-Specific Statistics of 60 GHz Vehicular Channels During Overtaking
FIGURE 2. Measurement site. TX and RX are static. Urban street traffic is passing by. At this snapshot, the overtakingvehicle is at a bumper to bumper distance of approximately d = 6 m.
calculates to
Lf = Lc + 21L =⌊
50λv · Tsnap
⌋+ 2 · 10 . (2)
The estimate of the time-varying secondmoment �[m] is thencalculated as
�[m] =1
IU[m]− IL[m]+ 1
IU[m]∑m′=IL[m]
K−1∑n=0
∣∣h[n,m′]∣∣2 , (3)
where the lower and the upper sum index are
IL[m] = max(0, dm− (Lf /2)e) , (4)
IU[m] = min(dm+ (Lf /2)e, S − 1) . (5)
Our scenario is dominated by the LOS component. As wekeep TX and RX static, this component will always appearat the same delay tap, called nLOS. To analyze the strength ofthe LOS delay tap relative to all taps, we estimate the secondmoment of the LOS tap as well.
�LOS[m] =1
IU[m]−IL[m]+1
IU[m]∑m′=IL[m]
∣∣h[nLOS,m′]∣∣2 . (6)
The delay index nLOS is calculated based on the measuredTX–RX distance. Both estimates �[m] and �LOS[m] areparameterized by the time indexm. All time-dependent quan-tities are equally well parameterized by the relative posi-tion estimate (1). With an abuse of notation we denote, forexample,
�[d] = �[d−1[d]
]. (7)
A. STATISTICAL EVALUATION AND DISCUSSIONIn this sub-section, we perform the statistical evaluation ofthe large-scale fading and then discuss the results. The exper-iment was conducted for 30 different vehicles, from whichwe derive ensemble statistics.
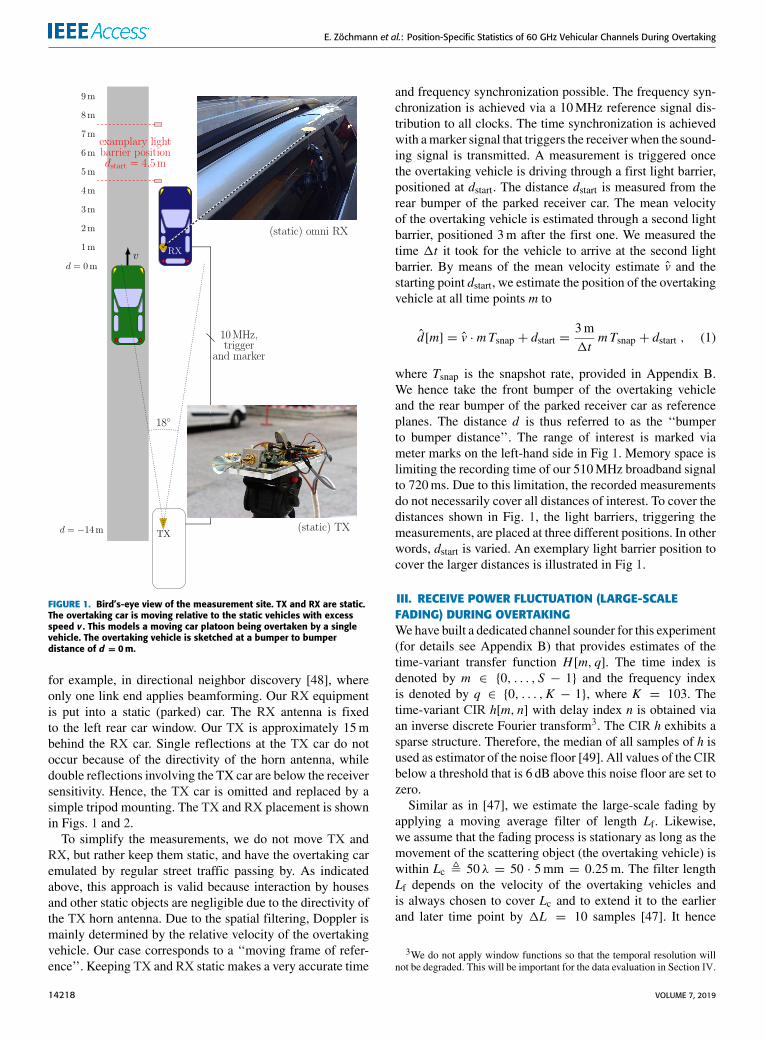
The first quantity of interest is the position-specific relativeLOS tap gain, that is �LOS[d]/�[d]. This quantity is eval-uated as boxplot in the top panel of Fig. 3. Our evaluation
is based on a window size of Lc = 50 λ = 0.25m length.For sake of illustration, we plot the graphs on a meter basedgrid by rounding d to the nearest integer meter value. In allthe boxplots of our contribution, the bottom and top edges ofthe box indicate the 25th and 75th percentiles. The whiskersshow the 5th and 95th percentiles. All observations outside thewhiskers are marked with crosses. The bottom panel of Fig. 3shows the number of samples we obtain for each meter bin.Please note that the maximum number of samples (per bin) is120, since we observed 30 vehicles and obtain 4 samples permeter.
We observe that the LOS tap captures most of the chan-nel gain and never drops below −4 dB. Cars (in red) andSUVs (in green) show a similar trend. For both vehicle types,the relative gain of the LOS tap increases when the overtakingcar is at larger distances d . The additional MPC due to theovertaking vehicle fades out and the limiting value is reachedafter d > 5m. Trucks show a different trend. If a truck is closeto the RX, the relative gain of the LOS tap is increased, butfor larger distances it approaches a lower limiting value. Thisis intuitively explained by strong MPCs generated at the sidewall of trucks. Whenever a truck is ‘‘close enough’’, theseMPCs are not resolved in the time domain and are binned inthe LOS tap.
To further study the above mentioned side-wall wave inter-action effect, we analyze the gain increase of the LOS tapversus the distance. The gain increase relative to no vehiclepresence (indicated as d →∞) is plotted in the middle panelof Fig. 3. Cars and SUVs show no effect. In contrast, overtak-ing trucks potentially boost the LOS gain bymore than 10 dB.The median result shows an increase of approximately 2 dB.
IV. SMALL-SCALE FADING OF THE LOS TAPDURING OVERTAKINGAs we discussed in the section above, the LOS tap is thedominating contribution of the channel gain. Here, we areinterested in the small-scale fading behavior of this LOS tap.To suppress large-scale fading effects, the channel is nor-malized by the square root of the estimated second moment,
VOLUME 7, 2019 14219

E. Zöchmann et al.: Position-Specific Statistics of 60 GHz Vehicular Channels During Overtaking
FIGURE 3. (top) Box plot of the LOS tap gain relative to the gain of all taps. When cars and SUVs are close to the RXantenna (d = 1 m), additional MPCs are created, thus decreasing the relative LOS gain. For trucks the converse is truebecause strong interactions with the side wall (scattering, diffraction) add power to the LOS tap. (middle) Box plot of theLOS tap gain increase by an overtaking vehicle compared to ‘‘no vehicle present’’. When cars and SUVs pass by, the LOS tapis hardly affected. The side walls of trucks strongly reflect impinging waves. (bottom) Number of samples used for theevaluation above.
that is
h[m, nLOS] =h[m, nLOS]√�LOS[m]
. (8)
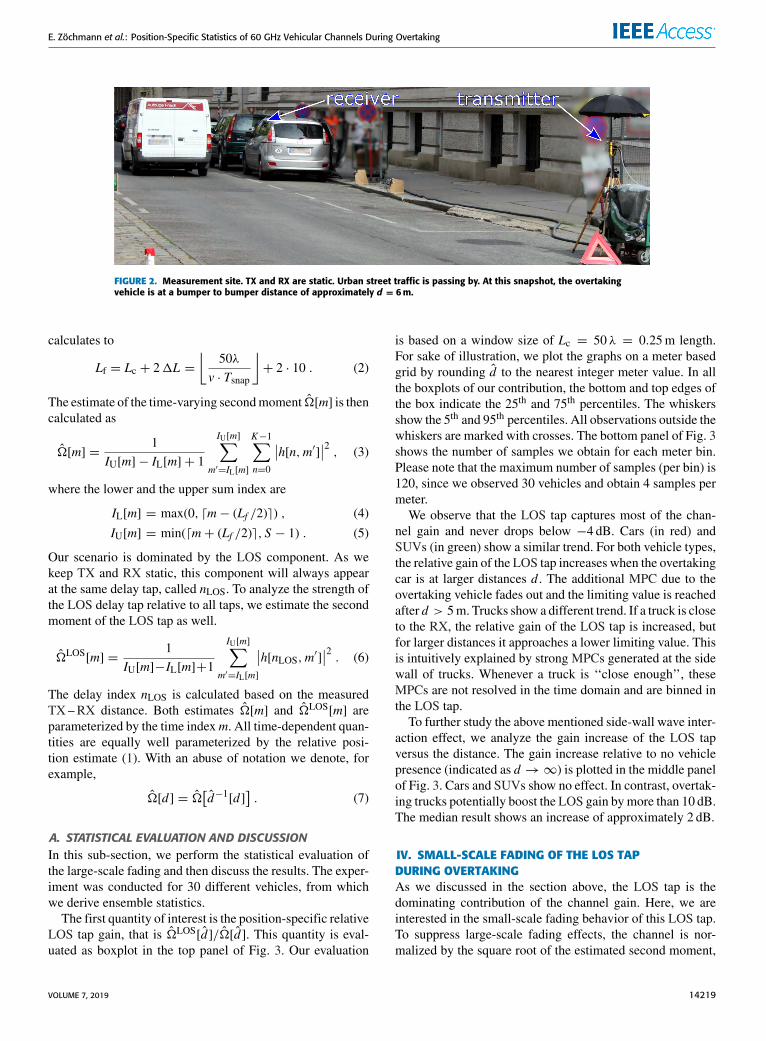
As a demonstrative example, we provide the channel impulseresponses and estimates of the secondmoment for an overtak-ing truck, see Fig. 4 for a photograph of the truck and Fig. 5for the LOS channel estimates. Before we study the small-scale fading statistics, we note that there is an oscillation withevolving instantaneous frequency visible in Fig. 5. The oscil-lations of the red curve with time-varying beating frequencycan be explained by the Doppler shift changing with d , seeFig. 6 for the spectrogram4 of |h[m, nLOS]| − 1.
4The spectrogram uses a Kaiser window of length 256 and shape param-eter α = 5. The Kaiser window approximates the discrete prolate spheroidal(DPS) sequence window [50, p. 232 ff.], that will be later extensively usedfor the Doppler analysis in Section V.
A. GEOMETRIC ARGUMENTATION FORTWDP SMALL-SCALE FADINGThe TWDP small-scale fading model assumes fading due tothe interference of two strong radio signals and numeroussmaller, so called diffuse, signals. In our case, the two strongradio signals are the unblocked LOS and a scattered com-ponent from an overtaking vehicle that arrives at the samedelay tap. Our measurement bandwidth of BW = 510MHzallows to resolveMPCs that are separated by a delay of1τ ≈1/BW ≈ 2 ns or a travel distance of 1s ≈ c0/BW ≈ 60 cm.Every MPC separated less than these values is not resolvedand interpreted as fading. We define the Fresnel ellipsoids fortheMPCs arriving at the same time tap (bin) as the componentcorresponding to LOS
|τLOS − τrefl| ≤1
BW. (9)
14220 VOLUME 7, 2019

E. Zöchmann et al.: Position-Specific Statistics of 60 GHz Vehicular Channels During Overtaking
FIGURE 4. Webcam snapshot of the exemplary overtaking truck (d ≈ 5 m).
FIGURE 5. Result of the post-processing of the LOS tap for the exemplarytruck shown in Fig. 4. The lower, blue curve shows the LOS channel taph[nLOS] including large-scale fading. The green, smooth curve shows theestimated large-scale fading
√�LOS. The black dashed line is the
estimate of the channel gain without a vehicle present. The red curveshows the normalized LOS channel tap h[nLOS], that is, the small-scalefading only. The oscillatory behavior stops at approximately 5 m.
FIGURE 6. Spectrogram of the normalized LOS channel tap (|h[nLOS]| − 1)from Fig. 5. The oscillatory behavior is best explained by the two strong,yellow traces in the spectrogram.
In Fig. 7, this ellipse is shown in red. The green car in Fig. 7shows the maximum distance values (d ≈ 4.5m) for whichan overtaking car is producing TWDP fading. Figure 7 also
FIGURE 7. Scaled sketch (1:5000). The LOS tap fades if another object iswithin the red filled ellipse (semi-minor axis equals 2.1 m). The green carin this figure is sketched such that it just produces TWDP fading. If the cargoes further on, its scattered component will be at the next channel tap.
shows the half power beam width of the TX horn. Thisillustrates that the distance region 0 . . . 4m leads to a signalcreated by wave interaction with the overtaking vehicle that isnot much weaker than the LOS component. Hence, we expecttwo MPCs at the same order of magnitude. In the regionbefore, for example, −5 . . . 0m the ellipsoid condition toexperience TWDP fading is fulfilled but spatial filtering bythe horn antenna suppresses the scattered component. Byinspecting Fig. 5 again, one observes that the oscillatorybehavior fades out after 5m, as the overtaking truck is arather short one. In the following subsection we briefly intro-duce the mathematics of the TWDP model. In Section IV-C,we focus on maximum likelihood estimation (MLE) of themodel parameters and perform model selection to draw even-tually statistical conclusions.
B. MATHEMATICAL DESCRIPTION OF TWDP FADINGTWDP fading was first introduced in [51]. A more extensivemathematical descriptionwas provided in [52]. For the conve-nience of the reader, we briefly summarize [52]. The TWDPfading model in the complex-valued baseband is given as
rcomplex = V1ejφ1 + V2ejφ2 + X + jY , (10)
VOLUME 7, 2019 14221

E. Zöchmann et al.: Position-Specific Statistics of 60 GHz Vehicular Channels During Overtaking
FIGURE 8. Comparison of Rician, and TWDP fading. The TWDPdistribution with 1 = 1 deviates strongly from the Rice distribution.Smaller 1 values do not affect the shape of the distribution as severely.
where V1 > 0 and V2 ≥ 0 are the deterministic amplitudesof the non-fluctuating components. The phases φ1 and φ2 areindependent and uniformly distributed in (0, 2π ). The diffusecomponents are modeled via the law of large numbers asX + jY , where X ,Y ∼ N (0, σ 2) are independent Gaussianrandom variables. The K -factor is defined analogously tothe Rician K-factor as the power ratio of the non-fluctuatingcomponents and the diffuse components
K =V 21 + V
22
2σ 2 . (11)
The parameter1 describes the amplitude relationship amongthe non-fluctuating components
1 =2V1V2V 21 + V
22
. (12)
The 1-parameter is bounded between 0 and 1 and equals1 iff both amplitudes are equal. Iff 1 = 0, TWDP fadingdegenerates to Rician fading. This transition fromTWDP fad-ing to Rician fading is smooth. If the second non-fluctuatingcomponent becomes very small, it can be absorbed equallywell in the diffuse components. This is discussed in detail inAppendix C.
The cumulative distribution function (CDF) of theenvelope of (10) is
FTWDP (r;K ,1) =
1−12π
2π∫0
Q1
(√2K [1+1 cos (α)],
rσ
)dα , (13)
where Q1(·, ·) is the Marcum Q-function. Figure 8 showsan example of the probability density function (PDF)fTWDP(r;K ,1) and CDF FTWDP (r;K ,1) of the TWDP fadingdistribution.
C. MAXIMUM LIKELIHOOD ESTIMATIONOF K AND 1 AND MODEL SELECTIONBased on the filtered envelope measurement data of the LOSdelay r[m] =
∣∣h[m, nLOS]∣∣, we are seeking the TWDPfading distribution of which the observed realizations appear
most likely. To do so, we estimate the parameter tuple(K [m],1[m]) via MLE
(K [m], 1[m]) = argmaxK ,1
m+(Lc/2)−1∑m′=m−(Lc/2)
ln fTWDP (r[m′];K ,1)
(14)
For the MLE, we take all samples within the assumed sta-tionary length of Lc , 50λ. The maximization is imple-mented as exhaustive search on a (K ,1) grid specified inAppendix C. We also perform MLE for the Rician K -factor.To do so, we restrict the maximization (14) to the parametertuple (K ,1 ≡ 0). Taking the data of the exemplary truck(Figs. 4 to 6), the estimated CDFs and their evolution is shownin Fig. 9. The three smallest distances (in Fig. 9) show CDFswhere the truck is in proximity of the receive antenna. Therewe observe fading that is not well explained by a Rician fit.The proposed TWDP fading model shows a superior fit. Onlythe last example at a distance of 6m clearly fades accordingto a Rice distribution. Of course, TWDP fits must always bebetter than Rician fits as the Rician model is a special case ofTWDP. However, the TWDP model introduces an additionalparameter, which is not desirable.
Thus, to select between Rician fading and TWDP fading,we employ Akaike’s information criterion (AIC). The AIC isa rigorous way to estimate the Kullback-Leibler divergence,the relative entropy based on MLE [53]. Given the MLEfitted parameter tuple (K [m], 1[m]) of TWDP fading andRician fading, we calculate the sample size N corrected AIC[53, p. 66] for Rician fading (1 ≡ 0) and TWDP fading
AIC[m]=−2m+(Lc/2)−1∑m′=m−(Lc/2)
ln fTWDP (r[m′]; K , 1)+2U+
2U (U + 1)N − U − 1
,
(15)
where the model orders U for Rician and TWDP fading are1 and 2, respectively. We choose between Rician fading andTWDP fading based on the lower AIC value. Due to themodel order penalization in the AIC we avoid over-fitting.For our exemplary truck, the fitted parameters as well as theselected model are shown in Fig. 10.
D. STATISTICAL EVALUATION AND DISCUSSIONIn this sub-section, we show the ensemble statistics of small-scale fading. Depending on the selected model, we take eitherthe TWDPK -factor or the RicianK -factor. For Rician fits weset 1 ≡ 0. Notice, however, that we rely then on the successof the model selection algorithm. Especially for very small1-parameters, very likely, we decide for Rician fading andhence bias the found 1-parameters towards smaller values.This is discussed in Appendix C.
Figure 11 illustrates the fittedK -factors and1-parameters.The K -factor is smaller if the vehicle is closer to the RXantenna (closer to the rear bumper of the car). If the vehiclepasses the static RX car, the K -factor saturates. Basicallythe LOS tap does not fade any longer. As mentioned above,
14222 VOLUME 7, 2019

E. Zöchmann et al.: Position-Specific Statistics of 60 GHz Vehicular Channels During Overtaking
FIGURE 9. CDF evolution over distance. The data is again from ourexample, see Figs. 4 to 7. For distances smaller than 5 m, TWDP fadingleads to a superior fit. At first glance, the Rician model seems to achieve agood fit as well, however, the K -factors of both models are not in thesame order of magnitude. Rician fading underestimates the power in thenon-fluctuating components.
the vehicle size is translated to the distance d . For longervehicles such as trucks, it takes longer until theK -factor startsrising. SUVs lie in between cars and trucks.
Next, we focus on the1-parameter. We see that the lengthof the vehicle also affects this parameter. We observe TWDPfading, that is, 1 > 0, whenever a part of the vehicle is still
FIGURE 10. MLE fitted parameter tuple (K , 1) for the exemplary truckchannel from Fig. 5. The Rician K -factor (blue dashed line)underestimates the power within the non-fluctuating components. If AICselects TWDP fading, a red diamond marks the parameter tuple. If Ricianfading is selected, a blue circle is used. The black vertical lines illustratethe positions evaluated in Fig. 9.
close to the RX antenna. The longer the vehicle, the longerthis effect is visible. Remember that the median 1 value hasa slight negative bias, as we set 1 to zero if we decide forRician fading. This explains why the SUV median is zero at2m, although the 1 values are spread out; since in case ofSUVs, the AIC decides for Rician fading more than half ofthe time. The AIC model selection decisions are color-codedin the histogram in the bottom panel of Fig. 11. The histogramin lighter shades is identical to the histogram of Figure 3. Thedarker shades show the number of samples where the AICdecided for TWDP fading. Again, looking at the maximumdistances where TWDP fading occurs, we see a correlationwith the vehicle length.
V. DELAY-DOPPLER DISPERSION EVALUATED VIATHE LOCAL SCATTERING FUNCTIONTo study the delay-Doppler dispersion of our vehicular chan-nel, we characterize the channel by the LSF, as explainedin [47], [54], and [55]. Similar to the previous sections,we assume that the fading process is locally stationary withina region of M samples in time and all samples in frequencydomain. We hence estimate the LSF for consecutive station-arity regions in time. We use a multitaper based estimator inorder to obtain multiple independent spectral estimates fromthe same measurement and being able to average them. Theestimate of the LSF is defined as [54]
C[kt ; n, p] =1IJ
IJ−1∑w=0
∣∣∣H(Gw)[kt ; n, p]∣∣∣2 . (16)
By p ∈ {−K/2, . . . ,K/2} we denote the Doppler index, andas in the previous sections, we denote by n ∈ {0, . . . ,M − 1}the delay index. The delay and Doppler shift resolutions aregiven by τs = 1/(K1f ) and νs = 1/(MTsnap). The time index
VOLUME 7, 2019 14223

E. Zöchmann et al.: Position-Specific Statistics of 60 GHz Vehicular Channels During Overtaking
FIGURE 11. (top) Boxplot of the Rician fading and TWDP fading K -factor. The closer the vehicle to the RX and the larger thevehicle, the stronger are the diffuse components. (middle) Boxplots of the 1-parameter. The larger the vehicle, the strongeris the second non-fluctuating component. For example, 1 = 0.2 (for trucks) correponds to a second non-fluctuatingcomponent that is 20 dB smaller than the LOS component, see Fig. 15 in Appendix C. (bottom) Histogram of all samplesobserved and the TWDP samples. This shows the TWDP selection ratio.
of each stationarity region is kt ∈ {0, . . . , b(S/M − 1c)}and corresponds to the center of the stationarity regions. Thewindowed spreading functionH(Gw) is calculated by
H(Gw)[kt ; n, p]
=
M/2−1∑m=−M/2
K/2∑q=−K/2
H [m+Mkt , q]Gw[m, q] e−j2π(pm−nq),
(17)
where the tapers Gw[m, q] are the DPS sequences [56],explained in detail in [54]. The number of tapers in timedomain is I = 3 and in frequency domain J = 3 .We set M = 233 which corresponds to a stationarity
region of 30ms in time. The power delay profile (PDP)and the Doppler spectral density (DSD) are calculated as a
summation (marginalization) of the LSF over the Dopplerdomain or delay domain [54],
PDP[kt ; n] =M/2−1∑p=−M/2
C[kt ; n, p] , (18)
DSD[kt ; p] =K−1∑n=0
C[kt ; n, p] . (19)
Based on the PDP and DSD, we analyze the time-varying RMS delay spread and the RMS Doppler spread.To obtain these quantities, we use the formulas (10) – (13)from [54].
Our measurements were carried out in a street with30 km/h speed limit. The average vehicle speed is in thisorder, but some vehicles significantly deviate from the
14224 VOLUME 7, 2019

E. Zöchmann et al.: Position-Specific Statistics of 60 GHz Vehicular Channels During Overtaking
average speed. To compare vehicles at different speed,the Doppler profile of each vehicle is first normalized w.r.t.to its maximum Doppler shift
νmax =2vλ. (20)
Next the Doppler profile is re-scaled to a common speed ofv = 30 km/h ≈ 8.33m/s. The data post-processing for ourexemplary truck is shown in Fig. 12. Figure 12(a) shows thePDP as it evolves over distance. A bandwidth of 510MHzis not sufficient to distinguish the MPCs in the time-domain.A small channel gain increase in the delay range 10 − 30 nsis visible after approximately 5m. Figure 12(c) shows thecorresponding DSD. The additional MPCs from the overtak-ing truck are clearly visible as negative Doppler shift traces.Note that these traces are already partially demonstratedin Fig. 6. Figure 12(b) shows the respective RMS spreadvalues.
A. STATISTICAL EVALUATION AND DISCUSSIONThe results for the whole data ensemble are illustratedin Fig. 13. The bottom panel shows again the number ofsamples used for the evaluation at each individual position.Note, that the histogram is slightly different to the previousones. Previously we performed the evaluation on 50λ inspace, which equals 30ms evaluation time exactly only fora vehicle at a speed of v ≈ 8.25m/s = 29.7 km/h.The RMS delay spread, illustrated in the top panel of
Fig. 13, is only slightly affected by an overtaking vehicle.There is only a total swing of 1.5 ns for the median valuesof the truck. If a truck is close to the RX antenna (at approx.1m to 2m) it shadows the background, boosts the alreadydominating LOS delay and στ is smallest. Cars and SUVsbarely alter στ . For both vehicle types the median swing isless than 1 ns. Generally, the RMS delay spread values ofdifferent vehicles are all in the same order.
The RMS Doppler spread of cars and SUVs at distancesclose to the antenna (< 3m) is mainly due to phase noiseof our equipment. Cars show the strongest effect on σν atapproximately 3m to 4m. SUVs show their maximum abit later at around 4m to 5m. At larger distances the MPCbelonging to the overtaking car (SUV) fades out. Note thesimilarity of σν for cars and SUVs after 6m. In this regiononly the rear part of the vehicles is illuminated. Trucks pro-duce an RMS Doppler spread twice as strong as cars and asSUVs. Again, due to trucks’ larger extent the maximumRMSDoppler spread occurs later, at approximately 7m.
Keep in mind, however, that due to the spatial filter-ing of the horn antenna combined with the existence ofa strong LOS, the RMS Doppler spread is less than 12%of the maximum Doppler shift (σν ≤ 0.12 νmax). In themedian case, σν is even below one-tenth of the maximumDoppler shift νmax. For comparison, a Doppler shift uni-formly distributed in (−νmax, 0) yields σν = νmax/
√12 ≈
0.3 νmax, a Doppler shift distributed according to a half-Jakes’spectrum yields σν = νmax
√(π2 − 22)/(2π )2 ≈ 0.4 νmax,
FIGURE 12. Post-processing steps to obtain the RMS delay spread andRMS Doppler spread from the LSF.(a) Time aligned PDP of the exemplarytruck. The time resolution obtained with 510 MHz bandwidth is notsufficient to resolve strong MPCs. (b)Estimated RMS delay spread (top)and estimated RMS Doppler spread (bottom) are calculated on a 30 mstime grid. (c)DSD of the exemplary truck. MPC reflected at the truck areclearly visible via their Doppler shift.
and a Doppler shift according to a Jakes’ spectrum evenσν = νmax/
√2 ≈ 0.7 νmax. Modeling σν with these models
is therefore not appropriate. The calculations of the RMS
VOLUME 7, 2019 14225

E. Zöchmann et al.: Position-Specific Statistics of 60 GHz Vehicular Channels During Overtaking
FIGURE 13. (top) Box plots of RMS delay spread as a function of bumper to bumper distance. The position of the overtakingvehicle does not have a strong impact on the RMS delay spread. (middle) Box plots of RMS Doppler spread re-scaled to acommon vehicle speed of 30 km/h at the left axis. RMS Doppler spread normalized to the maximum Doppler shift islabelled at the right axis. The black dotted line shows the estimate for the RMS Doppler spread obtained through the phasenoise of our measurement system. The RMS Doppler spread of cars and SUVs is only twice as much the values obtainedwith the phase noise only. In system without ‘‘perfect’’ frequency synchronization or worse reference clocks, the increasemight not be visible. (bottom) Number of samples used for the evaluation above based on 30 ms sample lengths.
Doppler spread values for known distributions is provided inAppendix D.
VI. CONCLUSIONThe size of the overtaking vehicle plays a crucial rolefor the statistics of the vehicular channel during an over-taking maneuver. Our statistical evaluation of an overtak-ing process has shown that large-scale fading is essentiallyonly influenced by very large objects such as trucks andbuses. Large vehicles potentially increase the receive powerthrough scattering on their side wall by several dB. Forsmaller vehicles, a change of large-scale fading was notobserved.
Rician fading is a good model for small-scale fading,unless a vehicle is in the ‘‘bandwidth ellipse’’ in whichcase the TWDP distribution provides a better fit. The larger
the vehicle, the larger is the 1-parameter. With the sameK -factor, TWDP fading experiences deeper fades than pre-dicted with a Rice distribution.
Furthermore, we have seen that the RMS delay spread ishardly affected by overtaking vehicles. This parameter doesnot need to be modeled position specific.
The analysis of Doppler dispersion has shown that theincreased Doppler effect at millimeter waves is not directlytranslated to the RMS Doppler spread in our scenario. TheRMS Doppler spread is extremely low due to spatial filteringof the horn antenna and the very strong LOS component.Only for large vehicles, this value increases significantlyduring overtaking. Note that the observed maximum value isa lot smaller than standard models (uniform, Jakes) wouldpredict. The maximum observed RMS Doppler spread isapproximately four times larger than the phase noise of our
14226 VOLUME 7, 2019

E. Zöchmann et al.: Position-Specific Statistics of 60 GHz Vehicular Channels During Overtaking
measurement system. A commercial system without ‘‘per-fect’’ frequency synchronization or worse reference clockswill very likely not experience this relatively small increaseof the RMS Doppler spread at all.
APPENDIX A: ACRONYMSAIC Akaike’s information criterionAWG arbitrary waveform generatorCDF cumulative distribution functionCIR channel impulse responseDFT discrete Fourier transformDPS discrete prolate spheroidalDSD Doppler spectral densityLO local oscillatorLOS line-of-sightLSF local scattering functionMLE maximum likelihood estimationmmWave millimeter waveMPC multipath componentOEW open-ended waveguidePDP power delay profilePDF probability density functionPLL phase-locked loopRF radio frequencyRMS root mean squareRX receiverSA signal analyzerSNR signal-to-noise ratioSUV sport utility vehicleTWDP two-wave with diffuse powerTX transmitterV2V vehicle-to-vehicle
APPENDIX B: MEASUREMENT SETUPThe hardware setup is illustrated in Fig. 14. Our trans-mitter consists of an arbitrary waveform generator (AWG).Once triggered, it continuously repeats a baseband soundingsequence. This baseband sequence described in the followingsubsection is up-converted by an external mixer module. Theexternal mixer module employs a synthesizer phase-lockedloop (PLL) for generating the internal local oscillator (LO).The synthesizer PLL is fed by a 285.714MHz reference, anduses a counter (divider) value of 210 to generate the centerfrequency of f0 = 59.99994GHz. Our receiver is a Rohde andSchwarz signal analyzer (SA) R&S FSW67. Its sensitivityis PSA,min = −150 dBm/Hz at 60GHz. All radio frequency(RF) devices are synchronized with a 10MHz reference.
When a vehicle passes the first light barrier, the AWGis triggered and plays back the baseband sequence and asample synchronous marker signal. The marker triggers therecording of the receive samples. We directly access theIQ samples at a rate of 600MSamples/s. From the receiveIQ samples we calculate the time-variant channel transferfunction H ′[m′, q] by a discrete Fourier transform (DFT).This transforms the channel convolution into a multiplicationin the frequency domain. Here m′ denotes the symbol time
FIGURE 14. Measurement setup.
index and q = 0, . . . , 102 the frequency index. After coherentaveraging over N baseband symbols, we divide the resultingchannel transfer function by the calibration function, obtainedfrom back-to-back measurements, to equalize the frequencycharacteristics of our equipment.
EXCITATION SIGNALThe excitation signal generated by the AWG is a multi-tone waveform. The use of a multi-tone waveform affordsus several advantages such as i) ideally flat frequencyspectrum, ii) design flexibility, iii) controllable crest fac-tor, and iv) high SNR through processing gain. Theseadvantages are important for channel transfer functionextraction. Using an approach similar to a procedure imple-mented in [57], the excitation signal is given by x(n) =
Re(∑K/2
k=1 ejπ k2
K e−j2πknQ), where n = 0, . . . ,Q−1 is the time
index and k the sub-carrier index. Tominimize the crest factorof the signal, the tone phases are chosen quadratic. The crestfactor is reduced in order to maximize the average transmittedpower while ensuring that all RF components encountered bythe excitation signals operate in their linear regions.
For the geometry of our scenario, the excess length (w.r.t.LOS length) of the MPC resulting from an overtaking car ison the order of 15m. Ignoring multiple reflections betweenthe parked RX car and the overtaking car, we assume thatthe path length difference will never be larger than 30m.Thus, 100 ns is our maximum excess delay. To make the sym-bols shorter and less susceptible to inter-carrier interferencecaused by phase noise and Doppler, we choose the sub-carrierspacing 1f as large as possible. To still obey the samplingtheorem in the frequency domain, we need to fulfil 1f ≤
VOLUME 7, 2019 14227

E. Zöchmann et al.: Position-Specific Statistics of 60 GHz Vehicular Channels During Overtaking
(1/(2τmax)) = 5MHz, where τmax is the maximum excessdelay. With our sampling rate of 600MSamples/s this givesQ = 121 sub-carriers spaced by 1f = 600MHz/121 =4.96MHz. Due to the sharp (anti-aliasing) filter of the SA,from the Q = 121 sub-carriers we effectively utilize onlyK = 103 sub-carriers, which is equal to a measurementbandwidth BW ≈ 510MHz. With these parameters thedelay resolution of the channel sounder is τmin = 1/BW ≈1.96 ns. The receiver sensitivity is approximated toPRX,min =
PSA,min + 10 log10(1f )+ 10 log10 K = −63 dBm.
LINK BUDGET AND OTHER LIMITATIONSFor the LOS component, the propagation loss includingantenna gains sums up to PL = 75.5 dB. For the design ofour setup, we assume that reflected paths are PR = 10 dBweaker than the LOS component. Next, we require an SNRat each sub-carrier of the reflected component of SNRrefl =
10 dB. These requirements directly translate to the necessarytransmit power PTX,min = PRX,min + PL + PR + SNRrefl =
32.5 dBm. The maximum power of the TX module is 7 dBm.Thus, an additional processing gain of 25.5 dB is needed.The processing gain is realized by coherently averaging overN = {480, 560, 640} multi-tone symbols. The number ofaveraging symbols is chosen such that the averaged chan-nel is still aliasing free. The least processing gain for fastvehicles (N = 480) is 27 dB. Remember, our multi-tonesystem has a sub-carrier spacing of 1f = 4.96MHz anda sounding sequence length of τsym = 1/1f = 202 ns.The overall pulse length including 480 repetitions, sums upto Tsnap = 96.8µs. Applying the sampling theorem for theDoppler support, we obtain a maximum alias-free Dopplerfrequency of νmax = 1/(2Tsnap) = 5.2 kHz, which limits thespeed of overtaking cars to vcar = (λνmax)/2 = 12.9m/s =46.5 km/h . This value is sufficient for our measurements,as the street, were the measurements took place, has a speedlimit of 30 km/h. Our receiver is limited to a memory depthof approximately 420MSamples or equivalently, with a sam-pling rate of 600MSamples/s, we are recording Trec =720ms of the channel evolution. At 12.9m/s this equalsa driving distance of 9.29m. An overview of the channelsounder parameters is given in Table 1.
APPENDIX C: THE TRANSITION OF TWDP FADINGTO RICIAN FADINGTo study the TWDP to Rice distribution transition, we firstexpress the1-parameter, defined in (12) through amplitudes,via the power ratio
δP =V 22
V 21
, V2 ≤ V1 ⇒ δP ≤ 1. (21)
Equation (12) becomes now
1(δP) =2√δP
1+ δP(22)
The expression (22) is demonstrated in Fig. 15with δP plottedin decibels.
TABLE 1. Channel sounder parameters.
For δP < −20 dB even an exponential power decrease isbarely translated to different 1 values.
For 1 → 0, depending on the K -factor, the secondmuch weaker component might be no longer large enough tochange the distribution sufficiently from the Rician distribu-tion. Mathematically this is expressed through the variance ofthe diffuse components. Given that � ≡ 1, σ solely dependson the K -factor [58]
σ 2=
12(1+ K )
. (23)
For K � 0, the power of the diffuse components(in decibels) is
20 log10 σ ≈ −10 log10 K − 3 dB . (24)
Hence, TWDP fading differs from Rician fading only if10 log10 δP � −10 log10 K − 3 dB, otherwise the secondnon-fluctuating component appears as strong as the diffusecomponents.
This behavior directly translates to the model selectionalgorithm. To demonstrate this, we run Monte Carlo simu-lations with synthetic data. Our test data is generated equiv-alently to the search grid used for MLE. The K -factor islinearly spaced in {0, 1, . . . , 100} and logarithmically spacedwith 150 points for each decade above K = 100. The1-parameter is linearly spaced in {0, 0.1, . . . , 1}. We gen-erate 300 realizations of each pair (K ,1) and perform thefitting and selection approach of subsection IV-C. A suc-cess is defined whenever AIC decides correctly for theTWDPmodel. The success rate of TWDP selection is plottedin Fig. 16. We plotted on top (as red dashed line) the relation-ship (22). From the considerations above, we already knowthat the K -factor must be at least above 3 dB. Observe thatthe transition region matches fairly well with those values,where the power of the second non-fluctuating component
14228 VOLUME 7, 2019

E. Zöchmann et al.: Position-Specific Statistics of 60 GHz Vehicular Channels During Overtaking
FIGURE 15. The 1-parameter as a function of the power ratio δP of bothnon-fluctuating waves.
FIGURE 16. Success rate of selecting TWDP fading for all parametertuples (K ,1) of the grid search space. Whenever the secondnon-fluctuating component is in the order of the diffuse components,the AIC model selection fails. The red dashed line replaces δP of (22) with(1/K ) to show this border.
becomes as strong at the diffuse components. However, thereis a minimum 1 ≈ 0.1 where TWDP fading selection failseven for K → ∞. From Fig. 15 we read that this valuecorresponds to a power difference of the LOS component andthe reflected component of approximately 25 dB. With theproposed approach we are hence not capable of selecting theappropriate fading distribution for smaller, weak-reflectingvehicles. The found 1-parameter for the statistical analysisin Subsection IV-D is therefore biased towards lower values.
APPENDIX D: RMS DOPPLER SPREAD OFKNOWN DISTRIBUTIONSIn this appendix, we derive the normalized RMS Dopplerspread values σν for known Doppler distributions. This yieldsa reference for our statistical analysis.
UNIFORM DISTRIBUTION (- LEFT SIDE)Based on 3D uniform scattering the Doppler spectrumbecomes a symmetric uniform distribution. This is simplythe left half of it. Hence, the Doppler is uniformly distributedwithin (−νmax, 0).
σ 2ν =
0∫−νmax
1νmax
ν2dν − ν2 =ν2max
12(25)
σν
νmax=
1√12=
1
2√3≈ 0.2887 (26)
JAKES’ SPECTRUMThis assumes that the angle of arrival is uniformly dis-tributed (in a plane). Through the non-linear cosine rela-tionship between the angle of arrival and the Doppler shift,the Doppler spectrum becomes the ‘‘double horn’’
P(ν) =1
π√ν2max − ν
2. (27)
The RMS Doppler spread is
σ 2ν =
1πνmax
νmax∫−νmax
1√1−
(ννmax
)2 ν2dν = ν2max
2. (28)
σν
νmax=
1√2≈ 0.7071 (29)
HALF JAKES’ (- LEFT SIDE)The half Jakes’ distribution sets all positive Doppler shift tozero. Here, we re-use the result from above. We only need tocalculate the mean of a half Jakes’ distribution.
ν =1
πνmax
νmax∫−νmax
1√1−
(ννmax
)2 νdν = −νmax
π(30)
Reusing the result from above, the 2nd moment of the half-Jakes is ν
2max2 ·
12 . Hence,
σ 2ν =
ν2max
4− ν2 = ν2max
π2− 22
(2π )2(31)
σν
νmax=
√π2 − 22
(2π)2≈ 0.3856 (32)
ACKNOWLEDGMENTThis paper was presented at the Proceedings of the 12thEuropean Conference on Antennas and Propagation, 2018 [1]and at the Proceedings of IEEE-APS Topical Conferenceon Antennas and Propagation in Wireless Communications,2018 [2].
VOLUME 7, 2019 14229

E. Zöchmann et al.: Position-Specific Statistics of 60 GHz Vehicular Channels During Overtaking
REFERENCES[1] E. Zöchmann et al., ‘‘Measured delay and Doppler profiles of overtaking
vehicles at 60 GHz,’’ in Proc. 12th Eur. Conf. Antennas Propag. (EuCAP),2018, pp. 1–5.
[2] E. Zöchmann et al., ‘‘Statistical evaluation of delay and Doppler spreadin 60 GHz vehicle-to-vehicle channels during overtaking,’’ in Proc.IEEE-APS Top. Conf. Antennas Propag. Wireless Commun. (APWC),Sep. 2018, pp. 1–4.
[3] T. Tokumitsu, M. Kubota, K. Sakai, and T. Kawai, ‘‘Application of GaAsdevice technology to millimeter-waves,’’ SEI Tech. Rev., no. 79, pp. 57–65,Oct. 2014.
[4] J. Choi, V. Va, N. González-Prelcic, R. Daniels, C. R. Bhat, andR. W. Heath, Jr., ‘‘Millimeter-wave vehicular communication to supportmassive automotive sensing,’’ IEEE Commun. Mag., vol. 54, no. 12,pp. 160–167, Dec. 2016.
[5] V. Va, J. Choi, and R.W. Heath, Jr., ‘‘The impact of beamwidth on temporalchannel variation in vehicular channels and its implications,’’ IEEE Trans.Veh. Technol., vol. 66, no. 6, pp. 5014–5029, Jun. 2017.
[6] J. Lorca, M. Hunukumbure, and Y. Wang, ‘‘On overcoming the impactof Doppler spectrum in millimeter-wave V2I communications,’’ in Proc.IEEE Globecom Workshops (GC Wkshps), Dec. 2017, pp. 1–6.
[7] P. L. C. Cheong, ‘‘Multipath component estimation for indoor radio chan-nels,’’ in Proc. IEEE Global Telecommun. Conf. (GLOBECOM), vol. 2,Nov. 1996, pp. 1177–1181.
[8] F. J. Velez, L. M. Correia, and J. M. Brázio, ‘‘Frequency reuse and systemcapacity in mobile broadband systems: Comparison between the 40 and60 GHz bands,’’Wireless Pers. Commun., vol. 19, no. 1, pp. 1–24, 2001.
[9] A. G. Siamarou, ‘‘Wideband propagation measurements and channelimplications for indoor broadband wireless local area networks at the60 GHz band,’’Wireless Pers. Commun., vol. 27, no. 1, pp. 89–98, 2003.
[10] C. R. Anderson and T. S. Rappaport, ‘‘In-building wideband partition lossmeasurements at 2.5 and 60 GHz,’’ IEEE Trans. Wireless Commun., vol. 3,no. 3, pp. 922–928, May 2004.
[11] F. J. Velez, M. Dinis, and J. Fernandes, ‘‘Mobile broadband systems:Research and visions,’’ IEEE Veh. Technol. Soc. News, vol. 52, no. 2,pp. 4–12, May 2005.
[12] N. Moraitis and P. Constantinou, ‘‘Measurements and characterizationof wideband indoor radio channel at 60 GHz,’’ IEEE Trans. WirelessCommun., vol. 5, no. 4, pp. 880–889, Apr. 2006.
[13] S. Ranvier, J. Kivinen, and P. Vainikainen, ‘‘Millimeter-wave MIMOradio channel sounder,’’ IEEE Trans. Instrum. Meas., vol. 56, no. 3,pp. 1018–1024, Jun. 2007.
[14] S. Geng, J. Kivinen, X. Zhao, and P. Vainikainen, ‘‘Millimeter-wave propa-gation channel characterization for short-range wireless communications,’’IEEE Trans. Veh. Technol., vol. 58, no. 1, pp. 3–13, Jan. 2009.
[15] P. F. M. Smulders, ‘‘Statistical characterization of 60-GHz indoor radiochannels,’’ IEEE Trans. Antennas Propag., vol. 57, no. 10, pp. 2820–2829,Oct. 2009.
[16] K. Haneda, C. Gustafson, and S. Wyne, ‘‘60 GHz spatial radio trans-mission: Multiplexing or beamforming?’’ IEEE Trans. Antennas Propag.,vol. 61, no. 11, pp. 5735–5743, Nov. 2013.
[17] C. Gustafson, K. Haneda, S. Wyne, and F. Tufvesson, ‘‘On mm-wave mul-tipath clustering and channel modeling,’’ IEEE Trans. Antennas Propag.,vol. 62, no. 3, pp. 1445–1455, Mar. 2014.
[18] S. Salous, S. M. Feeney, X. Raimundo, and A. A. Cheema, ‘‘WidebandMIMO channel sounder for radio measurements in the 60 GHz band,’’IEEE Trans. Wireless Commun., vol. 15, no. 4, pp. 2825–2832, Apr. 2016.
[19] J. Lee, J. Liang, M.-D. Kim, J.-J. Park, B. Park, and H. K. Chung,‘‘Measurement-based propagation channel characteristics for millimeter-wave 5G Giga communication systems,’’ Electron. Telecommun. Res.Inst. J., vol. 38, no. 6, pp. 1031–1041, 2016.
[20] J. Vehmas, J. Jarvelainen, S. Le Hong Nguyen, R. Naderpour, andK. Haneda, ‘‘Millimeter-wave channel characterization at Helsinki airportin the 15, 28, and 60 GHz bands,’’ in Proc. IEEE 84th Veh. Technol.Conf. (VTC-Fall), Sep. 2016, pp. 1–5.
[21] E. Zöchmann, M. Lerch, S. Caban, R. Langwieser, C. F. Mecklenbräuker,and M. Rupp, ‘‘Directional evaluation of receive power, Rician K-factorand RMS delay spread obtained from power measurements of 60 GHzindoor channels,’’ in Proc. IEEE-APS Top. Conf. Antennas Propag. Wire-less Commun. (APWC), Sep. 2016, pp. 246–249.
[22] G. R. MacCartney and T. S. Rappaport, ‘‘A flexible millimeter-wave chan-nel sounder with absolute timing,’’ IEEE J. Sel. Areas Commun., vol. 35,no. 6, pp. 1402–1418, Jun. 2017.
[23] J. Ko et al., ‘‘Millimeter-wave channel measurements and analysis forstatistical spatial channel model in in-building and urban environments at28 GHz,’’ IEEE Trans. Wireless Commun., vol. 16, no. 9, pp. 5853–5868,Sep. 2017.
[24] D. Dupleich et al., ‘‘Influence of system aspects on fading at mm-waves,’’ IET Microw., Antennas Propag., vol. 12, no. 4, pp. 516–524,2018.
[25] F. Fuschini et al., ‘‘Analysis of in-roommm-Wave propagation: Directionalchannel measurements and ray tracing simulations,’’ J. Infr., Millim., Ter-ahertz Waves, vol. 38, no. 6, pp. 727–744, 2017.
[26] X. Wu et al., ‘‘60-GHz millimeter-wave channel measurements and mod-eling for indoor office environments,’’ IEEE Trans. Antennas Propag.,vol. 65, no. 4, pp. 1912–1924, Apr. 2017.
[27] B. Ai et al., ‘‘On indoor millimeter wave massive MIMO channels: Mea-surement and simulation,’’ IEEE J. Sel. Areas Commun., vol. 35, no. 7,pp. 1678–1690, Jul. 2017.
[28] E. Zöchmann, M. Lerch, S. Pratschner, R. Nissel, S. Caban, and M. Rupp,‘‘Associating spatial information to directional millimeter wave chan-nel measurements,’’ in Proc. IEEE 86th Veh. Technol. Conf. (VTC-Fall),Sep. 2017, pp. 1–5.
[29] J. Blumenstein et al., ‘‘In-vehicle channel measurement, characterization,and spatial consistency comparison of 30–11 GHz and 55–65 GHz fre-quency bands,’’ IEEE Trans. Veh. Technol., vol. 66, no. 5, pp. 3526–3537,May 2017.
[30] A. Chandra et al., ‘‘Frequency-domain in-vehicle UWB channel model-ing,’’ IEEE Trans. Veh. Technol., vol. 65, no. 6, pp. 3929–3940, Jun. 2016.
[31] P. B. Papazian, C. Gentile, K. A. Remley, and N. Golmie, ‘‘A radio channelsounder for mobile millimeter-wave communications: System implemen-tation and measurement assessment,’’ IEEE Trans. Microw. Theory Techn.,vol. 64, no. 9, pp. 2924–2932, Sep. 2016.
[32] E. Zöchmann, S. Caban, M. Lerch, and M. Rupp, ‘‘Resolving the angularprofile of 60 GHz wireless channels by delay-Doppler measurements,’’ inProc. IEEE Sensor Array Multichannel Signal Process. Workshop (SAM),Jul. 2016, pp. 1–5.
[33] C. U. Bas et al. (2018). ‘‘Real-time Millimeter-Wave MIMO channelsounder for dynamic directional measurements.’’ [Online]. Available:https://arxiv.org/abs/1807.11921
[34] C. U. Bas et al., ‘‘Dynamic double directional propagation channel mea-surements at 28 GHz—Invited paper,’’ in Proc. IEEE 87th Veh. Technol.Conf. (VTC Spring), Jun. 2018, pp. 1–6.
[35] H. Meinel and A. Plattner, ‘‘Millimetre-wave propagation along railwaylines,’’ IEE Proc. F Commun., Radar Signal Process., vol. 130, no. 7,pp. 688–694, Dec. 1983.
[36] A. Kato, K. Sato, M. Fujise, and S. Kawakami, ‘‘Propagation characteris-tics of 60-GHz millimeter waves for ITS inter-vehicle communications,’’IEICE Trans. Commun., vol. 84, no. 9, pp. 2530–2539, 2001.
[37] S. Takahashi, A. Kato, K. Sato, and M. Fujise, ‘‘Distance dependence ofpath loss for millimeter wave inter-vehicle communications,’’ Radioengi-neering, vol. 13, no. 4, pp. 8–13, 2004.
[38] A. Yamamoto, K. Ogawa, T. Horimatsu, A. Kato, and M. Fujise, ‘‘Path-loss prediction models for intervehicle communication at 60 GHz,’’ IEEETrans. Veh. Technol., vol. 57, no. 1, pp. 65–78, Jan. 2008.
[39] T. S. Rappaport, J. N. Murdock, and F. Gutierrez, Jr., ‘‘State of the artin 60-GHz integrated circuits and systems for wireless communications,’’Proc. IEEE, vol. 99, no. 8, pp. 1390–1436, Aug. 2011.
[40] V. Va, T. Shimizu, G. Bansal, and R. W. Heath, Jr., ‘‘Millimeter wavevehicular communications: A survey,’’ Found. Trends Netw., vol. 10, no. 1,pp. 1–113, Jun. 2016.
[41] P. Kumari, J. Choi, N. González-Prelcic, and R. W. Heath, Jr., ‘‘IEEE802.11ad-based radar: An approach to joint vehicular communication-radar system,’’ IEEE Trans. Veh. Technol., vol. 67, no. 4, pp. 3012–3027,Apr. 2018.
[42] M. G. Sánchez, M. P. Táboas, and E. L. Cid, ‘‘Millimeter wave radio chan-nel characterization for 5G vehicle-to-vehicle communications,’’Measure-ment, vol. 95, pp. 223–229, Jan. 2017.
[43] H. Wang, X. Yin, X. Cai, H. Wang, Z. Yu, and J. Lee, ‘‘Fading char-acterization of 73 GHz millimeter-wave V2V channel based on realmeasurements,’’ in Proc. 13th Int. Workshop Commun. Technol. Vehi-cles, Nets4Cars/Nets4Trains/Nets4Aircraft, Madrid, Spain, May 2018,pp. 159–168.
[44] A. Prokes, J. Vychodil, M. Pospisil, J. Blumenstein, T. Mikulasek, andA. Chandra, ‘‘Time-domain nonstationary intra-car channel measurementin 60 GHz band,’’ in Proc. Int. Conf. Adv. Technol. Commun. (ATC), 2016,pp. 1–6.
14230 VOLUME 7, 2019
E. Zöchmann et al.: Position-Specific Statistics of 60 GHz Vehicular Channels During Overtaking
[45] J. Blumenstein, A. Prokes, J. Vychodil, M. Pospisil, and T. Mikulasek,‘‘Time-varying K factor of the mm-Wave vehicular channel: Velocity,vibrations and the road quality influence,’’ in Proc. IEEE 28th Annu. Int.Symp. Pers., Indoor, Mobile Radio Commun. (PIMRC), Oct. 2017, pp. 1–5.
[46] A. Loch, A. Asadi, G. H. Sim, J. Widmer, and M. Hollick, ‘‘mm-Waveon wheels: Practical 60 GHz vehicular communication without beamtraining,’’ inProc. 9th Int. Conf. Commun. Syst. Netw. (COMSNETS), 2017,pp. 1–8.
[47] L. Bernadó, T. Zemen, F. Tufvesson, A. F. Molisch, andC. F. Mecklenbräuker, ‘‘Time-and frequency-varying K -factor ofnon-stationary vehicular channels for safety-relevant scenarios,’’ IEEETrans. Intell. Transp. Syst., vol. 16, no. 2, pp. 1007–1017, Apr. 2015.
[48] R. Ramanathan, J. Redi, C. Santivanez, D. Wiggins, and S. Polit, ‘‘Ad hocnetworking with directional antennas: A complete system solution,’’ IEEEJ. Sel. Areas Commun., vol. 23, no. 3, pp. 496–506, Mar. 2005.
[49] E. S. Sousa, V. M. Jovanovic, and C. Daigneault, ‘‘Delay spread mea-surements for the digital cellular channel in Toronto,’’ IEEE Trans. Veh.Technol., vol. 43, no. 4, pp. 837–847, Nov. 1994.
[50] F. F. Kuo and J. F. Kaiser, System Analysis By Digital Computer. NewYork,NY, USA: Wiley, 1966.
[51] G. D. Durgin, T. S. Rappaport, and D. A. deWolf, ‘‘New analytical modelsand probability density functions for fading in wireless communications,’’IEEE Trans. Commun., vol. 50, no. 6, pp. 1005–1015, Jun. 2002.
[52] M. Rao, F. J. Lopez-Martinez, M.-S. Alouini, and A. Goldsmith, ‘‘MGFapproach to the analysis of generalized two-ray fading models,’’ IEEETrans. Wireless Commun., vol. 14, no. 5, pp. 2548–2561, May 2015.
[53] K. P. Burnham and D. R. Anderson, Model Selection and MultimodelInference: A Practical Information-Theoretic Approach. New York, NY,USA: Springer, 2003.
[54] L. Bernadó, T. Zemen, F. Tufvesson, A. F. Molisch, andC. F. Mecklenbräuker, ‘‘Delay and Doppler spreads of nonstationaryvehicular channels for safety-relevant scenarios,’’ IEEE Trans. Veh.Technol., vol. 63, no. 1, pp. 82–93, Jan. 2014.
[55] D. J. Thomson, ‘‘Spectrum estimation and harmonic analysis,’’ Proc.IEEE, vol. 70, no. 9, pp. 1055–1096, Sep. 1982.
[56] D. Slepian, ‘‘Prolate spheroidal wave functions, Fourier analysis, anduncertainty—V: The discrete case,’’ Bell Syst. Tech. J., vol. 57, no. 5,pp. 1371–1430, May/Jun. 1978.
[57] S. Sangodoyin, J. Salmi, S. Niranjayan, and A. F. Molisch, ‘‘Real-timeultrawidebandMIMO channel sounding,’’ inProc. 6th Eur. Conf. AntennasPropag. (EUCAP), 2012, pp. 2303–2307.
[58] D. Kim, H. Lee, and J. Kang, ‘‘Comments on ‘‘Near-body shadowinganalysis at 60 GHz,’’’’IEEE Trans. Antennas Propag., vol. 65, no. 6,p. 3314, Jun. 2017.
ERICH ZÖCHMANN (M’18) received the B.Sc.and Dipl.Ing. (M.Sc.) degrees (Hons.) in electricalengineering from TU Wien, in 2013 and 2015,respectively. From 2013 to 2015, he was a ProjectAssistant with the Institute of Telecommunica-tions, where he co-developed the Vienna LTE-Auplink link level simulator and conducted researchon physical layer signal processing for 4G mobilecommunication systems. From 2017 to 2018, hewas a Visiting Scholar with The University of
Texas at Austin. His current interests include experimental characterizationand modeling of millimeter-wave propagation, physical layer signal process-ing, array signal processing, compressed sensing, and convex optimization.
MARKUS HOFER received the Dipl.Ing. degree(Hons.) in telecommunications from TU Wien,in 2013. He is currently pursuing the Ph.D. degreein telecommunications. From 2013 to 2015, hewas a Researcher with the TelecommunicationsResearch Center Vienna (FTW), Signal and Infor-mation Processing Department. Since 2015, he hasbeen a Junior Scientist with the Research Groupfor Ultra-Reliable Wireless Machine-to-MachineCommunications, AIT Austrian Institute of Tech-
nology. His research interests include low-latency wireless communications,vehicular channel measurements, modeling and emulation, time-variantchannel estimation, mmwave, massive MIMO, cooperative communicationsystems, and interference management.
MARTIN LERCH received the master’s degreein electrical engineering from TU Wien, wherehe is currently with the Institute of Telecommu-nications, developing test beds and measurementmethodologies for controlled and reproduciblewireless experiments at high velocities.
STEFAN PRATSCHNER was born in Vienna, Aus-tria, in 1990. He received the B.Sc. degree in elec-trical engineering and the M.Sc. degree (Hons.) intelecommunications from TU Wien, in 2014 and2016, respectively, where he is currently pursuingthe Ph.D. degree with a main focus on massiveMIMO technologies for mobile communications.Since 2013, he has been a Project Assistant withthe Institute of Telecommunications, TU Wien.
LAURA BERNADÓ received the M.Sc. degree intelecommunications engineering from the Techni-cal University of Catalonia (UPC), Spain, in 2007,and the Ph.D. degree from TU Wien, in 2012.She is currently a Scientist with the Austrian Insti-tute of Technology. Her research interests includethe characterization and modeling of fast time-varying and non-stationary fading processes forultra-reliable and low-latency communications forfuture radio communication systems.
JIRI BLUMENSTEIN (M’17) received the Ph.D.degree from the Brno University of Technology,in 2013. In 2011, he was a Researcher withthe Institute of Telecommunications, TU Wien.He has cooperated with several companies, includ-ing Racom, Volkswagen, and ON Semiconductorin the area of applied research of wireless systemsand in the area of the fundamental research fundedby the Czech Science Foundation. He is currentlya Researcher with the Department of Radio Elec-
tronics, Brno University of Technology. His research interests include signalprocessing, physical layer of communication systems, channel characteriza-tion and modeling, and wireless system design.
SEBASTIAN CABAN received themaster’s degreein business administration from the University ofVienna, Vienna, Austria, and the master’s andPh.D. degrees in telecommunications from TUWien. His current research interest includes mea-surements in wireless communications.
VOLUME 7, 2019 14231

E. Zöchmann et al.: Position-Specific Statistics of 60 GHz Vehicular Channels During Overtaking
SEUN SANGODOYIN received the B.Sc. degreein electrical engineering from Oklahoma StateUniversity, in 2007, and the M.Sc. and Ph.D.degrees in electrical engineering from the Uni-versity of Southern California, in 2009 and2018, respectively. He is currently a Postdoc-toral Research Fellow with the Georgia Insti-tute of Technology. His research interests includemillimeter-wave (measurement-based) MIMOchannel modeling and analysis, terahertz commu-
nications, UWB MIMO radar, parameter estimation, body area networks,and stochastic dynamical systems.
HERBERT GROLL received the B.Sc. andDipl.Ing. (M.Sc.) degrees in electrical engineeringfrom TU Wien, in 2014 and 2017, respectively,where he is currently pursuing the Ph.D. degree,under the supervision of Prof. C. Mecklenbräuker.His research interest includes vehicular wirelesscommunication with an emphasis on millimeter-wave propagation for future wireless systems.
THOMAS ZEMEN was with FTW Forschungs-zentrum Telekommunikation Wien, Austria, andSiemens, Austria. He is currently a Senior Sci-entist with the AIT Austrian Institute of Tech-nology, where he is also leading the ReliableWireless Communications Group. He is also anExternal Lecturer with TU Wien. He has authoredfour books chapters, 37 journal papers, more than110 conference communications, as well as twopatents. His research interests include wireless
ultra-reliable low-latency communications, massive MIMO systems, time-variant channel measurements, modeling and real-time emulation, as well assoftware-defined radio rapid prototyping. He has served as an Editor for theIEEE TRANSACTIONS ON WIRELESS COMMUNICATIONS, from 2011 to 2017.
ALEŠ PROKEŠ received the M.Sc., Ph.D., andthe Habilitation degrees from the Brno Universityof Technology (BUT), in 1988, 1999, and 2006,respectively. Since 1990, he has been with theFaculty of Electrical Engineering and Communi-cation, BUT, where he is currently a Professor.Since 2013, he has been the Head of the ResearchCenter of Sensor, Information and Communica-tion Systems, Radio-Frequency Systems Group.He has (co)authored 30 journal publications and
more than 40 conference papers. His research interests include measurementand modeling of channels for V2X communication, optimization, and designof optical receivers and transmitters for free-space optics (FSO) systems,influence of atmospheric effects on optical signal propagation, evaluationof FSO availability and reliability, higher order non-uniform sampling andsignal reconstruction, and software-defined radio.
MARKUS RUPP received the Dipl.Ing. degreefrom the University of Saarbrücken, Germany, in1988, and the Dr.Ing. degree from the TechnischeUniversität Darmstadt, Germany, in 1993. Until1995, he held a Postdoctoral position with theUniversity of California at Santa Barbara, SantaBarbara, CA, USA. From 1995 to 2001, he waswith the Wireless Technology Research Depart-ment, Nokia Bell Labs, Holmdel, NJ, USA. Since2001, he has been a Full Professor of digital signal
processing in mobile communications with TU Wien.
ANDREAS F. MOLISCH was with TU Vienna,AT&T (Bell) Labs, Lund University, and Mit-subishi Electric Research Labs. He is currentlythe Solomon Golomb - Andrew and Erna ViterbiChair Professor with the University of SouthernCalifornia. He is the author of four books, 19 bookchapters, more than 240 journal papers, 320 con-ference papers, as well as 80 patents. His researchinterests include wireless communications, withan emphasis on wireless propagation channels,
multi-antenna systems, ultrawideband signaling and localization, novel mod-ulation methods, and caching for wireless content distribution. He is a Fellowof the National Academy of Inventors, the IEEE, AAAS, and IET, as wellas a member of the Austrian Academy of Sciences. He was a recipient ofnumerous awards.
CHRISTOPH F. MECKLENBRÄUKER (S’88–M’97–SM’08) received the Dipl.Ing. degree(Hons.) in electrical engineering from TU Wien,in 1992, and the Dr.Ing. degree (Hons.) fromthe Ruhr-Universität Bochum, Bochum, Germany,in 1998. From 1997 to 2000, he was with SiemensAG, Austria, where he was engaged in the stan-dardization of the radio access network for UMTS.From 2000 to 2006, he was a Senior Research withthe Telecommunications Research Center Vienna
(FTW), Vienna. In 2006, he joined the Institute of Communications andRadio Frequency Engineering, TU Wien, as a Full Professor. From 2009 to2016, he led the Christian Doppler Laboratory for Wireless Technologiesfor Sustainable Mobility. He has authored approximately 250 papers ininternational journals and conferences, for which he has also served as areviewer. He holds several patents in the field of mobile cellular networks.His current research interests include radio interfaces for peer-to-peer net-works (vehicular connectivity and sensor networks), ultra-wideband radio,and MIMO transceivers. He is a member of the Antennas and PropagationSociety, the Intelligent Transportation Society, the Vehicular TechnologySociety, the Signal Processing society, VDE, and EURASIP. He is theCouncilor of the IEEE Student Branch Wien. His doctoral dissertationreceived the Gert-Massenberg Prize, in 1998.
14232 VOLUME 7, 2019