Embed Size (px)
Citation preview

THIS REPORT CONTAINS ASSESSMENTS OF COMMODITY AND TRADE ISSUES MADE BY
USDA STAFF AND NOT NECESSARILY STATEMENTS OF OFFICIAL U.S. GOVERNMENT
POLICY
-
Date:
GAIN Report Number:
Post:
Report Categories:
Approved By:
Prepared By:
Report Highlights:
High input costs, stiff competition from imports combined with water limitations explains the decline in
area planted to rice in Portugal. Warmer than usual temperatures boosted crop development in summer
2017, but negatively affected yields, which are anticipated to remain at similar levels to those achieved
in the previous season.
Marta Guerrero
Agricultural Specialist
Rachel Bickford
Agricultural Attaché
Grain and Feed
Portuguese Rice Imports Pick up as Production Declines
Madrid
Portugal
SP1735
11/13/2017
Public Voluntary

Portuguese Rice Imports Pick up as Production Declines Page 2 out of 13
Table of Contents:
Reference .................................................................................................................................. 2
Executive Summary ................................................................................................................. 3
Area and Production................................................................................................................ 3
Rice Varieties ............................................................................................................................ 5
Rice Processing Industry ......................................................................................................... 6
Consumption and Marketing .................................................................................................. 6
Trade ......................................................................................................................................... 8
Portugal’s Specific Rice Policy ............................................................................................... 9
Annex I. Import Tariffs for Rice .......................................................................................... 11
Annex II. Summary of EU Rice Import Preferential Regimes and Other Measures ...... 11
Related Reports ...................................................................................................................... 13
Reference
Abbreviations:
ACP Africa, Caribbean and Pacific
CAP Common Agricultural Policy
EBA Everything But Arms
EU European Union
FAS Foreign Agricultural Service
Ha Hectares ( 1 ha = 2.471 acres)
HS Harmonized Codes
INE Portuguese National Institute for Statistics
MS Member State(s)
MT Metric ton (1,000 kg)
MY Marketing Year: January to December
N/A: Not available
(HS) Harmonized Codes for Rice:
100610 -Rice in the Husk (Paddy or Rough):
100620 - Rice Husked (Brown):
100630 - Milled rice
100640 - Milled rice, broken kernels
Conversion factor used in this report
Rough or Paddy rice (100610) trade data x 0.70 =milled equivalent basis
Brown rice (100602) trade data x 0.88 = milled equivalent basis
Portuguese Rice Imports Pick up as Production Declines Page 3 out of 13
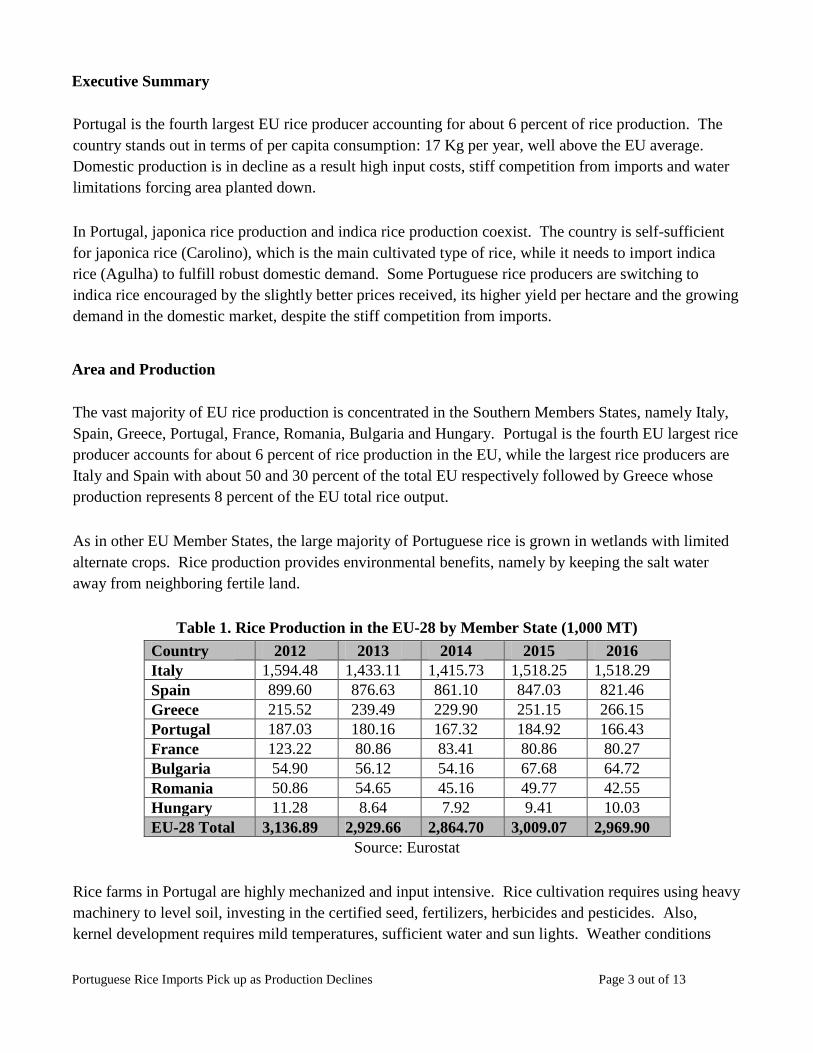
Executive Summary
Portugal is the fourth largest EU rice producer accounting for about 6 percent of rice production. The
country stands out in terms of per capita consumption: 17 Kg per year, well above the EU average.
Domestic production is in decline as a result high input costs, stiff competition from imports and water
limitations forcing area planted down.
In Portugal, japonica rice production and indica rice production coexist. The country is self-sufficient
for japonica rice (Carolino), which is the main cultivated type of rice, while it needs to import indica
rice (Agulha) to fulfill robust domestic demand. Some Portuguese rice producers are switching to
indica rice encouraged by the slightly better prices received, its higher yield per hectare and the growing
demand in the domestic market, despite the stiff competition from imports.
Area and Production
The vast majority of EU rice production is concentrated in the Southern Members States, namely Italy,
Spain, Greece, Portugal, France, Romania, Bulgaria and Hungary. Portugal is the fourth EU largest rice
producer accounts for about 6 percent of rice production in the EU, while the largest rice producers are
Italy and Spain with about 50 and 30 percent of the total EU respectively followed by Greece whose
production represents 8 percent of the EU total rice output.
As in other EU Member States, the large majority of Portuguese rice is grown in wetlands with limited
alternate crops. Rice production provides environmental benefits, namely by keeping the salt water
away from neighboring fertile land.
Table 1. Rice Production in the EU-28 by Member State (1,000 MT)
Country 2012 2013 2014 2015 2016
Italy 1,594.48 1,433.11 1,415.73 1,518.25 1,518.29
Spain 899.60 876.63 861.10 847.03 821.46
Greece 215.52 239.49 229.90 251.15 266.15
Portugal 187.03 180.16 167.32 184.92 166.43
France 123.22 80.86 83.41 80.86 80.27
Bulgaria 54.90 56.12 54.16 67.68 64.72
Romania 50.86 54.65 45.16 49.77 42.55
Hungary 11.28 8.64 7.92 9.41 10.03
EU-28 Total 3,136.89 2,929.66 2,864.70 3,009.07 2,969.90
Source: Eurostat
Rice farms in Portugal are highly mechanized and input intensive. Rice cultivation requires using heavy
machinery to level soil, investing in the certified seed, fertilizers, herbicides and pesticides. Also,
kernel development requires mild temperatures, sufficient water and sun lights. Weather conditions

Portuguese Rice Imports Pick up as Production Declines Page 4 out of 13
along with pest incidence are critical to determine final yields. Portugal boasts of a Mediterranean
climate with Atlantic influence. Under these conditions, rice must be grown in irrigation. The reduced
number of rice-specific pesticides in the EU represents one of the main sector challenges.
Alternatives to rice in Portugal consist mainly in tomatoes for processing and corn production. Water
limitations may lead to switching to less water demanding crops such as sunflower or rapeseed.
Within Portugal, there are three main rice producing regions: the Mondego Valley in northern Portugal;
the central valleys of Tejo and Sorraia; and the Sado Valley further south. A few rice productions
outside this main areas, namely in the Vale do Vouga (Aveiro) and in Algarve.
In Portugal, area planted to rice followed an upward trend until 2011 when, it started shrinking.
Low market prices combined with high input costs and increased limitations in the use of modern inputs
for rice crop protection are seen as the main drivers for the area reduction.
Dry spring conditions allowed for proper rice sowing operations. However, water restrictions in some
river basins in the Southern half of the country in 2017 (i.e. Sado Valley), has negatively impacted rice
plantings (Graph 1 and Table 2).
Table 2. Rice Area in Portugal (1,000 Ha)
Year 2012 2013 2014 2015 2016 2017e
Area (1,000 Ha) 31 30 29 29 29 26
Source: INE
Pyriculariosis incidence in 2017 has been rather mild. Warmer than usual temperatures boosted
summer crop development, but negatively affected yields, which are anticipated to remain at similar
levels to those achieved in the previous season.
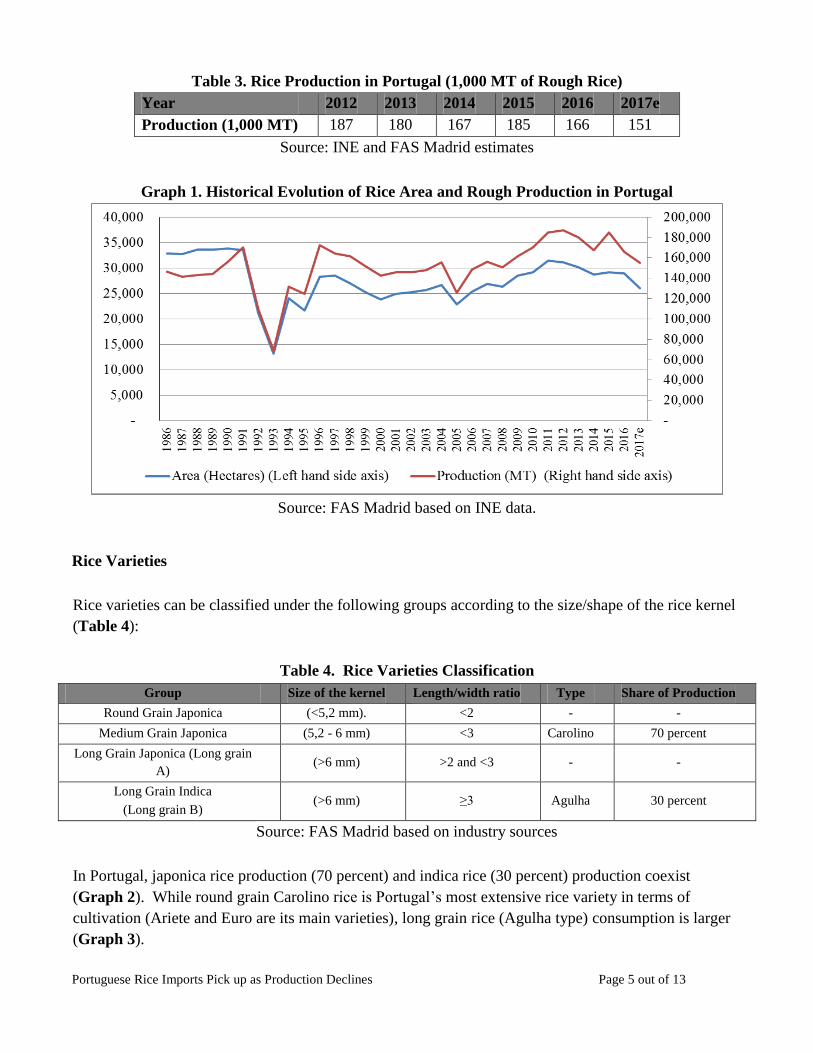
According to the latest official statistics Portugal’s rough rice production in 2017 may reach 151,000
MT (Table 3).
Portuguese Rice Imports Pick up as Production Declines Page 5 out of 13
Table 3. Rice Production in Portugal (1,000 MT of Rough Rice)
Year 2012 2013 2014 2015 2016 2017e
Production (1,000 MT) 187 180 167 185 166 151
Source: INE and FAS Madrid estimates
Graph 1. Historical Evolution of Rice Area and Rough Production in Portugal
Source: FAS Madrid based on INE data.
Rice Varieties
Rice varieties can be classified under the following groups according to the size/shape of the rice kernel
(Table 4):
Table 4. Rice Varieties Classification
Group Size of the kernel Length/width ratio Type Share of Production
Round Grain Japonica (<5,2 mm). <2 - -
Medium Grain Japonica (5,2 - 6 mm) <3 Carolino 70 percent
Long Grain Japonica (Long grain
A) (>6 mm) >2 and <3 - -
Long Grain Indica
(Long grain B) (>6 mm) ≥3 Agulha 30 percent
Source: FAS Madrid based on industry sources
In Portugal, japonica rice production (70 percent) and indica rice (30 percent) production coexist
(Graph 2). While round grain Carolino rice is Portugal’s most extensive rice variety in terms of
cultivation (Ariete and Euro are its main varieties), long grain rice (Agulha type) consumption is larger
(Graph 3).

Portuguese Rice Imports Pick up as Production Declines Page 6 out of 13
According to official statistics, area planted to Carolino, whose production is intended for the local
market, has suffered a sharper decline compared to Agulha rice, driven by the slightly better prices
received by long grain rice, its higher yield per hectare and the growing demand in the domestic market,
despite the stiff competition from imported rice.
Broadly speaking, Carolino varieties are grown in the central (Tejo) and northern (Mondego) valleys,
whereas Agulha is mainly grown in southern Portugal (Sado Valley).
Graph 2. Japonica and Indica Rice Area Evolution in Portugal (1,000 Ha)
Source: FAS Madrid based on INE data.
Rice Processing Industry
The Portuguese rice processing industry is comprised of eight Small and Medium Size private
companies, located in production areas that supply major retailer groups. Agricultural Cooperatives
play a limited role in rice processing. At the farm level though, they manage nearly 60 percent of the
production.
Official conversion rates are available at EU Commission Regulation (EC) 1312/2008. According to
industry sources, the conversion factor to from rough rice into milled rice is estimated to rank from 0.7
to 0.72, including whole and broken kernels. The polishing process approximately represents 2 percent
losses. As a consequence, the overall rice milling rate ranks from 0.68 to 0.7.
Consumption and Marketing
Portugal’s per capita rice consumption amounts to nearly 17 Kg per year, well above the EU’s average
per capita consumption. According to INE data, overall Portugal’s rice consumption has remained grew

Portuguese Rice Imports Pick up as Production Declines Page 7 out of 13
since the beginning of the economic crisis in 2008 and trended down towards stabilization over the past
five years.
There, tough are two different rice market segments in Portugal with different behaviors (Graph 3):
Japonica varieties, led by the domestic rice type Carolino, are more suitable for Portugal
traditional cuisine due its cooking characteristics, namely its capacity to absorb. However, its
consumption is smaller and declining in favor of long varieties. The country is nearly self-
sufficient in this market segment.
Indica varieties (Auglha) have the largest market share. Portugal’s self-sufficiency rate for this
variety is below 20 percent. Consequently, the country needs to import this type of rice to meet
its needs. Consumption of indica varieties along with non-traditional types of rice varieties (such
as risotto, wild rice, basmati) and ready-to-eat rice portions, continues to grow due to its cheaper
market price, adaptation to new eating habits, and the adoption of non-traditional dishes.
Graph 3. Portugal’s Milled Rice Consumption by Type of Rice
Source: FAS Madrid based on INE data.
At the retail level, the rice market in Portugal is dominated by two large retail groups, whose brands are
well established in the market that face stiff competition from store private labels, which according to
sources, represent nearly 70 percent in value of total domestic consumption.
Additional information on Portuguese’s Retail Sector can be found at SP1518.

Portuguese Rice Imports Pick up as Production Declines Page 8 out of 13
Trade
Portugal is the only rice producing Member State who needs to import significant amounts of rice to
meet its robust internal demand. The large majority of imports are Indica type, as the country as a
deficit of this type of rice.
Rice imports, under preferential trade agreements, have continuously increased over the past five years.
Main origins of Portuguese rice imports include third countries such as ACP Countries (Guyana,
Suriname), India, Cambodia and Thailand. EBA countries such as Cambodia and Myanmar are seen as
a growing threat by Portuguese rice producers (Table 6).
This stiff competition from imported rice, along with the high input costs, the limited number of active
matters available for rice farmers and water constraints in certain regions are among the driving factors
of the country’s total rice area decline.
Table 6. Country of Origin of Portugal’s Rice Imports (MT)
Country of Origin 2012 2013 2014 2015 2016
EU-28 47,814 39,425 32,902 56,865 35,567
Guyana 8,336 26,864 33,795 72,723 104,673
Suriname 8,518 6,862 15,372 - 10,771
Cambodia 2,326 4,396 6,876 10,237 9,597
India 6,280 4,753 4,277 11,728 8,301
Thailand 1,413 1,446 1,709 3,634 5,836
Pakistan 23 975 1,546 3,895 3,491
Myanmar - 1,000 2,125 1,449 2,825
Vietnam 50 5,234 4,456 50 1,514
Other 37,137 18,261 8,266 2,224 323
Total 111,897 109,216 111,324 162,805 182,898
Source: GTA. HS code 1006.
Japonica rice production marketing opportunities in Portugal are low due to limited domestic demand.
However, the Portuguese rice industry has managed to grow in overseas markets. Other EU Member
States such as the Spain, France and the United Kingdom are the main destination of the Portuguese’s
rice exports. Turkey, leads Portuguese rice exports outside the EU, followed by some Portuguese
Speaking and Middle East Countries (Table 7).
Table 7. Country of Destination of Portugal’s Rice Exports (MT)
Country of Destination 2012 2013 2014 2015 2016
EU-28 16,328 21,262 25,030 37,387 53,227
Turkey 0 5076 38,676 11,334 12,294
Portuguese Rice Imports Pick up as Production Declines Page 9 out of 13
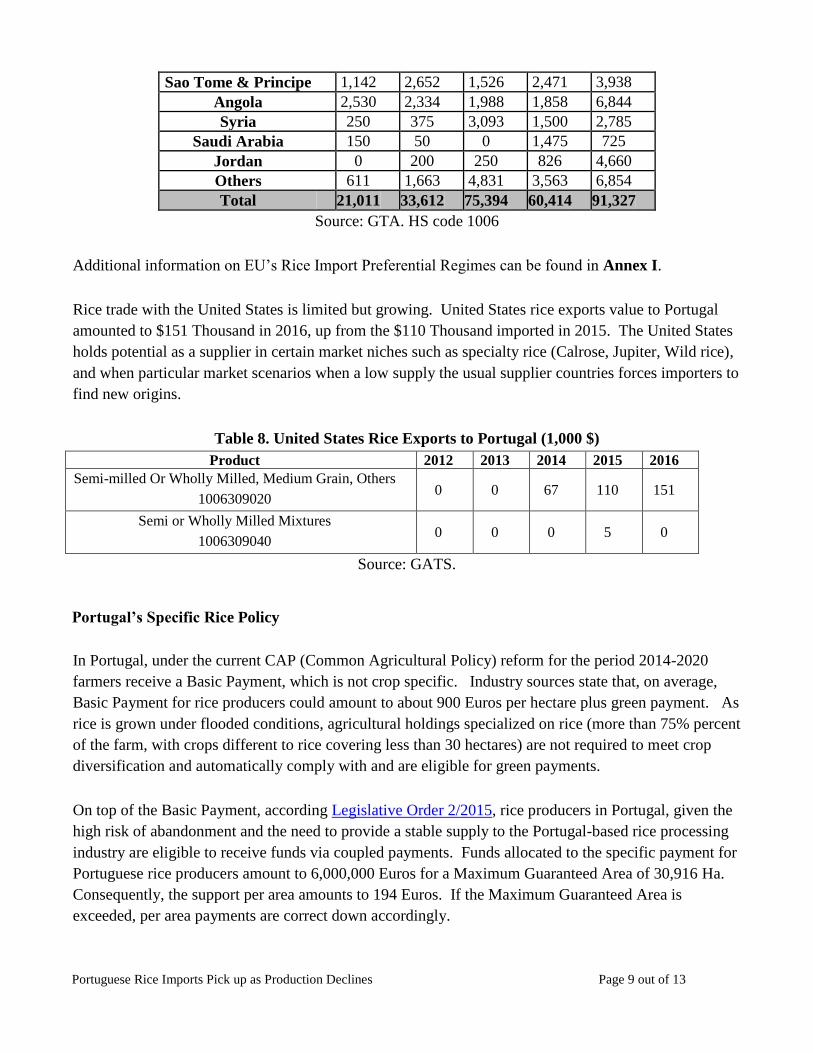
Sao Tome & Principe 1,142 2,652 1,526 2,471 3,938
Angola 2,530 2,334 1,988 1,858 6,844
Syria 250 375 3,093 1,500 2,785
Saudi Arabia 150 50 0 1,475 725
Jordan 0 200 250 826 4,660
Others 611 1,663 4,831 3,563 6,854
Total 21,011 33,612 75,394 60,414 91,327
Source: GTA. HS code 1006
Additional information on EU’s Rice Import Preferential Regimes can be found in Annex I.
Rice trade with the United States is limited but growing. United States rice exports value to Portugal
amounted to $151 Thousand in 2016, up from the $110 Thousand imported in 2015. The United States
holds potential as a supplier in certain market niches such as specialty rice (Calrose, Jupiter, Wild rice),
and when particular market scenarios when a low supply the usual supplier countries forces importers to
find new origins.
Table 8. United States Rice Exports to Portugal (1,000 $)
Product 2012 2013 2014 2015 2016
Semi-milled Or Wholly Milled, Medium Grain, Others
1006309020 0 0 67 110 151
Semi or Wholly Milled Mixtures
1006309040 0 0 0 5 0
Source: GATS.
Portugal’s Specific Rice Policy
In Portugal, under the current CAP (Common Agricultural Policy) reform for the period 2014-2020
farmers receive a Basic Payment, which is not crop specific. Industry sources state that, on average,
Basic Payment for rice producers could amount to about 900 Euros per hectare plus green payment. As
rice is grown under flooded conditions, agricultural holdings specialized on rice (more than 75% percent
of the farm, with crops different to rice covering less than 30 hectares) are not required to meet crop
diversification and automatically comply with and are eligible for green payments.
On top of the Basic Payment, according Legislative Order 2/2015, rice producers in Portugal, given the
high risk of abandonment and the need to provide a stable supply to the Portugal-based rice processing
industry are eligible to receive funds via coupled payments. Funds allocated to the specific payment for
Portuguese rice producers amount to 6,000,000 Euros for a Maximum Guaranteed Area of 30,916 Ha.
Consequently, the support per area amounts to 194 Euros. If the Maximum Guaranteed Area is
exceeded, per area payments are correct down accordingly.

Portuguese Rice Imports Pick up as Production Declines Page 10 out of 13
On July 17 2017, Portugal along with other seven EU rice producing Member States1 requested the EC
to take action and curb duty-free Asian rice export to the EU that result in stiff competition for domestic
growers. Among the measures proposed by the Ministers of the eight producing Member States the
Safeguard Clause enforcement as well as implementing the Country of Origin Labeling for EU grown
rice, and carrying out EU rice consumption promotion were pointed out.
1 Signatories to the petition include: Italy, Spain, France, Bulgaria, Greece, Hungary, Romania and Portugal.

Portuguese Rice Imports Pick up as Production Declines Page 11 out of 13
Annex I. Import Tariffs for Rice
Table 7. Rice Import Tariffs to the EU
HS Code Type of Rice Duty (Euros/MT)
100610 Rice in The Husk (Paddy Or Rough) 211
100620 Rice Husked (Brown) 30 or 42.2 or 65*
100630 Milled rice 145 or 175**
100640 Milled rice, broken kernels 65
Source: TARIC
*For husked (Brown) rice there are three different duty levels:
if the imported quantities, excluding Basmati husked rice, are below the lowest threshold (382226 MT for
a full marketing year or 191,113 MT for the first six months), a duty of 30 Euros/MT is applied during the
subsequent semester.
if the imported quantities are above the highest threshold (517,130 MT for a full marketing year, 258,565
MT for the first six months), the duty is fixed at 65 Euros/MT.
if the quantities imported are between both thresholds, the duty is fixed at 42.5 Euros/MT.
**For milled and semi-milled rice: if the imported quantities are below the threshold (387,743 MT for a full
marketing year corresponding or 182,239 t for the first six months of a marketing year) the duty is fixed at 145 €/t, above the threshold at 175 Euros/MT.
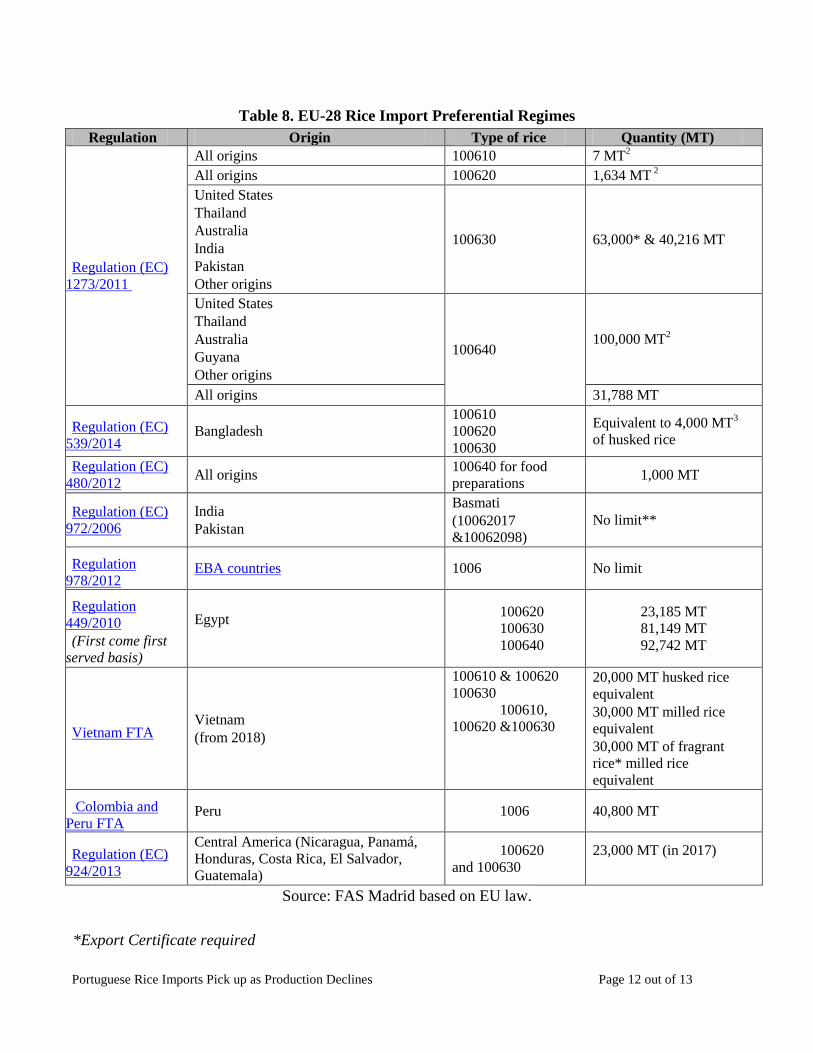
Annex II. Summary of EU Rice Import Preferential Regimes and Other Measures
A summary of the EU’s preferential rice import regimes can be found in Table 8. All quantities but the
7 MT, the 1,634 MT and 100,000 MT and under Regulation (EC) 1273/20112 and the 4,000 from
Bangladesh3 may be imported to the EU at a zero duty.
2 With an ad valorem duty fixed at 15 percent and a reduction of 30.77 percent in the duty fixed respectively.
When the country of origin is Thailand, an Export Certificate is required. 3 Different rates of reduced duty apply for codes 100610, 100620 and 100630.
Portuguese Rice Imports Pick up as Production Declines Page 12 out of 13
Table 8. EU-28 Rice Import Preferential Regimes
Regulation Origin Type of rice Quantity (MT)
Regulation (EC)
1273/2011
All origins 100610 7 MT2
All origins 100620 1,634 MT 2
United States
Thailand
Australia
India
Pakistan
Other origins
100630 63,000* & 40,216 MT
United States
Thailand
Australia
Guyana
Other origins
100640 100,000 MT
2
All origins 31,788 MT
Regulation (EC)
539/2014 Bangladesh
100610
100620
100630
Equivalent to 4,000 MT3
of husked rice
Regulation (EC)
480/2012 All origins
100640 for food
preparations 1,000 MT
Regulation (EC)
972/2006
India
Pakistan
Basmati
(10062017
&10062098)
No limit**
Regulation
978/2012 EBA countries 1006 No limit
Regulation
449/2010
(First come first
served basis)
Egypt
100620
100630
100640
23,185 MT
81,149 MT
92,742 MT
Vietnam FTA Vietnam
(from 2018)
100610 & 100620
100630
100610,
100620 &100630
20,000 MT husked rice
equivalent
30,000 MT milled rice
equivalent
30,000 MT of fragrant
rice* milled rice
equivalent
Colombia and
Peru FTA Peru 1006 40,800 MT
Regulation (EC)
924/2013
Central America (Nicaragua, Panamá,
Honduras, Costa Rica, El Salvador,
Guatemala)
100620
and 100630
23,000 MT (in 2017)
Source: FAS Madrid based on EU law.
*Export Certificate required

Portuguese Rice Imports Pick up as Production Declines Page 13 out of 13
** Certificate of Authenticity required.
According to Commission Implementing Decision 2011/884 on emergency measures regarding
unauthorized genetically modified rice in rice products originating from China, since January 1st 2015,
rice imports from China must be accompanied by a safety certificate and an analytical report showing
that the products have been tested free from the presence of non-authorized GMOs.
Related Reports
Report Date
Released
Italian Rice Overview 2017 06/26/2017
Declining Rice Area and New Eating Habits Create Opportunities in Spain’s Rice
Market
02/28/2017
Italy - Rice Area Update 2016 12/04/2016
Italy’s Rice Production to Increase in MY 2015-16 12/24/2015
Rice Market in the Iberian Peninsula 08/29/2012
Italian Grain and Feed Report 2012 05/10/2012