Embed Size (px)
Citation preview
PortugalTRAVEL & TOURISM
SOWING THE SEEDS OF GROWTH
The 2005 Travel & Tourism Economic Research
28.07
CHAIRMAN:
Vincent A. WolfingtonChairmanCarey International, Inc
VICE CHAIRMEN:
Jean-Marc Espalioux Chairman of Management Board& CEOAccor
Jonathan S LinenVice ChairmanAmerican Express Company
EXECUTIVE COMMITTEE:
Akbar Al BakerCEOQatar Airways
Peter ArmstrongPresident & CEORocky Mountaineer Railtours
David BabaiChairmanGullivers Travel Associates
Sebastián EscarrerVice ChairmanSol Meliá
Manuel Fernando Espírito SantoChairmanEspírito Santo Tourism
Edouard EttedguiGroup Chief ExecutiveMandarin Oriental Hotel Group
Maurice Flanagan CBEVice Chairman & GroupPresidentThe Emirates Group
Michael FrenzelChairmanTUI AG
Stephen P. HolmesVice Chairman Cendant Corporation
David House Group PresidentAmerican Express Company
InterContinental Hotels Group
Richard R KelleyChairmanOutrigger Enterprises, Inc
Geoffrey J W KentChairman & CEOAbercrombie & Kent
J W Marriott, JrChairman & CEOMarriott International, Inc
David MichelsChief Executive Hilton Group plcHilton International
David MongeauVice Chairman CIBC World Markets
Curtis NelsonPresident & COOCarlson Companies
Mike NessPresidentThe Travel Corporation
P R S OberoiChairmanThe Oberoi Group
Alan ParkerChief ExecutiveWhitbread PLC
Lalit SuriChairman & Managing DirectorBharat Hotels Ltd
Jonathan TischChairman & CEOLoews Hotels
GLOBAL MEMBERS:
Giovanni AngeliniCEO & Managing DirectorShangri-La Hotels & Resorts
Ted BalestreriChairman & CEOCannery Row Company
Simón Barceló VadellChairman & CEOBarceló Hotels and Resorts
Henrik BartlManaging Director & Head ofReal Estate Structured FinanceAareal Bank AG
Jürgen BaumhoffCEOQatar National Hotels Company
Raymond BicksonManaging DirectorThe Taj Group of Hotels
Regis Bulot Chairman of the Board Relais & Chateaux
Marilyn Carlson NelsonChairman & CEOCarlson Companies
U Gary CharlwoodFounder, Chairman & CEOUniglobe Travel (International) Inc
Alex ChristouPartner, Travel ServicesAccenture
Jennie ChuaChairman & CEORaffles International Ltd
David CliftonManaging Director, Europe & AsiaInterval International
Jim ComptonSenior VP, MarketingContinental Airlines
Fernando ConteChairman & CEOIberia, Airlines of Spain
Glen DavidsonSenior VP, Worldwide TravelInsurance & Related ServicesAmerican International Group, Inc
Alain DemissyPresident of the ExecutiveCommitteeMondial Assistance Group
Rod EddingtonChief Executive British Airways plc
Rakesh GangwalChairman, President & CEOWorldspan
Laurence GellerChairman & CEOStrategic Hotel Capital
Naresh GoyalChairman Jet Airways
Maurice H GreenbergChairman & CEOAmerican International Group, Inc
Stelios Haji-IoannouChairman & FoundereasyGroup (UK) Ltd.
Murray HennessyCEOAvis Europe Plc
Brent HobermanCo-Founder & CEOlastminute.com
James HoganPresident & Chief ExecutiveGulf Air
Raimund HoschPresident & CEOMesse Berlin GmbH
Nuno Trigoso JordãoPresident & CEOSonae Turismo Gestao e Servicos
Samuel KatzChairman & CEOTravel Distribution ServicesDivisionCendant Corporation
Nigel KnowlesManaging PartnerDLA
Krishna KumarVice ChairmanThe Taj Group of Hotels
Gerald LawlessChief Executive Jumeirah International
Dave LucasPresident & CEOBlue Wave Solutions
Lusotur S. A.
Manuel MartinPartnerCyberDodo Productions Ltd
Wolfgang MayrhuberCEOLufthansa German Airlines
Paul McManusPresident & CEOThe Leading Hotels of the World
Armin MeierPresident & CEOKuoni Travel Holding Ltd
Alan MulallyExecutive Vice PresidentThe Boeing Company
John M Noel President & CEOThe Noel Group
Tom NutleyChairmanReed Travel Exhibitions
Jean Gabriel PérèsPresident & CEOMövenpick Hotels & Resorts
Dionísio PestanaChairmanGroup Pestana
Fernando PintoCEOTAP Air Portugal
Wolfgang Prock-SchauerChief Executive OfficerJet Airways
David RadcliffeChief ExecutiveHogg Robinson plc
Kurt RitterPresident & CEORezidor SAS Hospitality
Christopher RodriguesCEOVisa International
Peter RogersPresident & CEODiners Club International
Carl RudermanChairmanUniversal Media
Mary SalfenGeneral Manager, Global Travel& Transportation IndustryIBM
Bruno SchöpferChairman of the BoardMövenpick Hotels & Resorts
Per SetterbergCEOGlobal Refund Group
Eric J SpeckExecutive Vice President& Chief Marketing OfficerSabre Holdings Corporation
Jean-Cyril SpinettaChairman & CEOAir France
David SteinChairmanThe Stein Group
Barry SternlichtChairman & CEOStarwood Hotels & Resorts
Ron StringfellowCEOTsogo Sun Group
Ian SwainPresidentSwain Tours
Andrew C TaylorPresident & CEOEnterprise Rent-a-Car
Kathleen TaylorPresident, Worldwide BusinessOperationsFour Seasons Hotels and Resorts
José Antonio TazónPresident & CEOAmadeus Global TravelDistribution
Jeffrey TofflerChairmanCoventry Partners
Simon Vincent CEOOpodo
Daniela WagnerManaging Director, Internationaloctopustravel.com
Philip WolfCEOPhoCusWright, Inc.
Peter YesawichChairman & CEOYesawich, Pepperdine, Brown & Russell
HONORARY MEMBERS:
André Jordan
Lord Marshall of Knightsbridge
Sir Frank Moore, AOChairmanTaylor Byrne Tourism Group
Frank OlsonChairman of the BoardThe Hertz Corporation
Gérard PélissonCo-Chairman, Supervisory BoardAccor SA
Henry Silverman Chairman Cendant Corporation
Tommaso ZanzottoPresidentTZ Associates Ltd
CHAIRMAN EMERITUS:
James D Robinson IIIGeneral PartnerRRE VenturesWTTC Chairman (1990-1994)
IMMEDIATE PAST CHAIRMAN:
Sir Ian ProsserRetired ChairmanInterContinental Hotels GroupWTTC Chairman (2001-2003)
FORMER CHAIRMEN
Harvey Golub Retired Chairman & CEOAmerican Express CoWTTC Chairman (1996 – 2001)
Robert H. BurnsChairmanRobert H Burns Holdings LimitedWTTC Chairman (1994 – 1996)
PRESIDENT:
Jean-Claude Baumgarten
14 February 2004
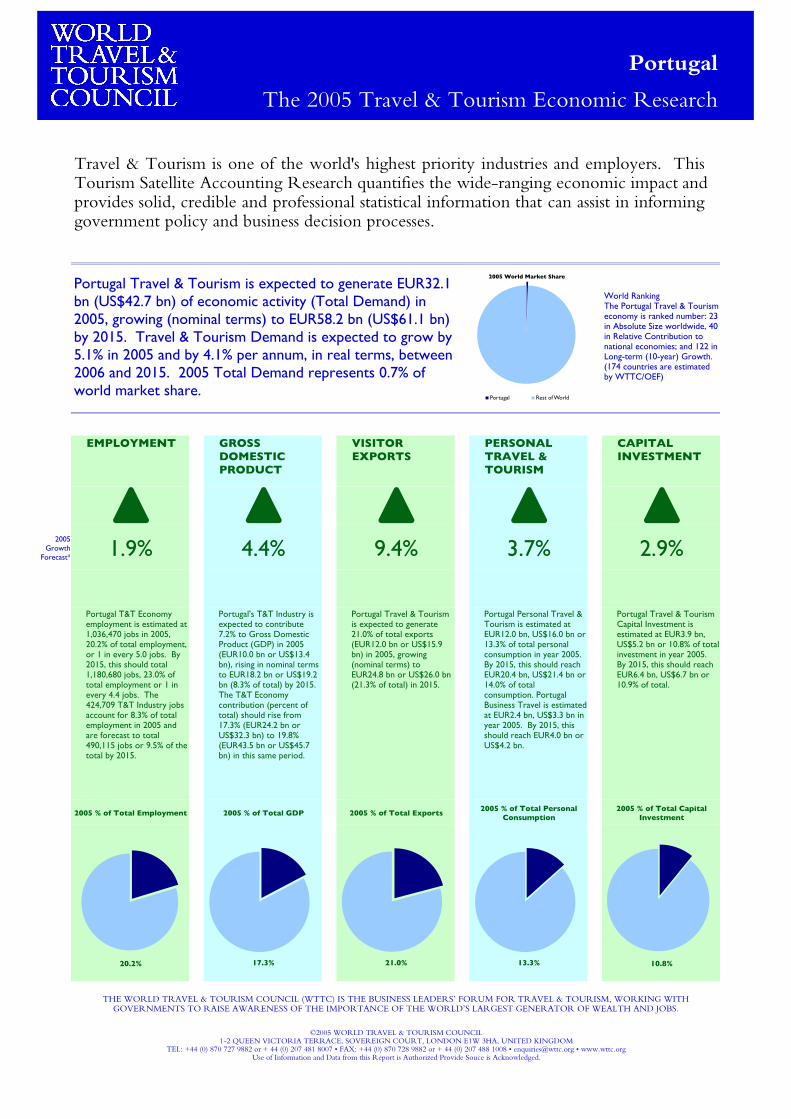
World RankingThe Portugal Travel & Tourism economy is ranked number: 23 in Absolute Size worldwide, 40 in Relative Contribution to national economies; and 122 in Long-term (10-year) Growth. (174 countries are estimated by WTTC/OEF)
EMPLOYMENT GROSS DOMESTIC PRODUCT
VISITOR EXPORTS
PERSONAL TRAVEL & TOURISM
CAPITAL INVESTMENT
H H H H H2005
Growth Forecast* 1.9% 4.4% 9.4% 3.7% 2.9%
Portugal T&T Economy employment is estimated at 1,036,470 jobs in 2005, 20.2% of total employment, or 1 in every 5.0 jobs. By 2015, this should total 1,180,680 jobs, 23.0% of total employment or 1 in every 4.4 jobs. The 424,709 T&T Industry jobs account for 8.3% of total employment in 2005 and are forecast to total 490,115 jobs or 9.5% of the total by 2015.
Portugal's T&T Industry is expected to contribute 7.2% to Gross Domestic Product (GDP) in 2005 (EUR10.0 bn or US$13.4 bn), rising in nominal terms to EUR18.2 bn or US$19.2 bn (8.3% of total) by 2015. The T&T Economy contribution (percent of total) should rise from 17.3% (EUR24.2 bn or US$32.3 bn) to 19.8% (EUR43.5 bn or US$45.7 bn) in this same period.
Portugal Travel & Tourism is expected to generate 21.0% of total exports (EUR12.0 bn or US$15.9 bn) in 2005, growing (nominal terms) to EUR24.8 bn or US$26.0 bn (21.3% of total) in 2015.
Portugal Personal Travel & Tourism is estimated at EUR12.0 bn, US$16.0 bn or 13.3% of total personal consumption in year 2005. By 2015, this should reach EUR20.4 bn, US$21.4 bn or 14.0% of total consumption. Portugal Business Travel is estimated at EUR2.4 bn, US$3.3 bn in year 2005. By 2015, this should reach EUR4.0 bn or US$4.2 bn.
Portugal Travel & Tourism Capital Investment is estimated at EUR3.9 bn, US$5.2 bn or 10.8% of total investment in year 2005. By 2015, this should reach EUR6.4 bn, US$6.7 bn or 10.9% of total.
2005 % of Total Employment 2005 % of Total GDP 2005 % of Total Exports2005 % of Total Personal
Consumption2005 % of Total Capital
Investment
20.2% 17.3% 21.0% 13.3% 10.8%
©2005 WORLD TRAVEL & TOURISM COUNCIL1-2 QUEEN VICTORIA TERRACE, SOVEREIGN COURT, LONDON E1W 3HA, UNITED KINGDOM
TEL: +44 (0) 870 727 9882 or + 44 (0) 207 481 8007 • FAX: +44 (0) 870 728 9882 or + 44 (0) 207 488 1008 • [email protected] • www.wttc.orgUse of Information and Data from this Report is Authorized Provide Souce is Acknowledged.
Portugal
The 2005 Travel & Tourism Economic Research
Portugal Travel & Tourism is expected to generate EUR32.1 bn (US$42.7 bn) of economic activity (Total Demand) in 2005, growing (nominal terms) to EUR58.2 bn (US$61.1 bn) by 2015. Travel & Tourism Demand is expected to grow by 5.1% in 2005 and by 4.1% per annum, in real terms, between 2006 and 2015. 2005 Total Demand represents 0.7% of world market share.
Travel & Tourism is one of the world's highest priority industries and employers. ThisTourism Satellite Accounting Research quantifies the wide-ranging economic impact andprovides solid, credible and professional statistical information that can assist in informinggovernment policy and business decision processes.
THE WORLD TRAVEL & TOURISM COUNCIL (WTTC) IS THE BUSINESS LEADERS’ FORUM FOR TRAVEL & TOURISM, WORKING WITH GOVERNMENTS TO RAISE AWARENESS OF THE IMPORTANCE OF THE WORLD’S LARGEST GENERATOR OF WEALTH AND JOBS.
2005 World Market Share
Portugal Rest of World

This 2005 report for Portugal is the fifth set of Tourism Satellite Accounting research that Oxford Economic Forecasting (OEF) has prepared for WTTC.
The first, commissioned in 2001, re-engineered the models previously developed during the 1990s. The second, prepared in 2002, served an important role in helping to quantify the tragic events of September 11, 2001 on Travel & Tourism. The third in 2003, significantly upgraded and enhanced the quality, sophistication and precision of the TSA research and presented a second (worse case) scenario for the Iraq War. The fourth in 2004, increased the world coverage by adding 13 countries not previously included in the TSA research, and presented even greater analysis of the results in this report.
Based on the UN standard for Satellite Accounting, this new TSA research quantifies all aspects of Travel & Tourism demand, from personal consumption to business purchases, capital investment, government spending and exports. It then translates this information into economic concepts of production, such as gross domestic product and employment, which can be compared with other industries and the economy as a whole to provide credible statistical information that will assist in policy and business decision processes.
The message from this year's reserch is generally positive on a global basis for a healthy return to growth. On a more specific basis in 2005, Portugal's Travel & Tourism Industry is expected to generate 7.2% of GDP and 424,709 jobs, while the broader Travel & Tourism Economy is expected to total 17.3% of GDP and 1,036,470 jobs.
This 2005 research is serving to help us build a crisis forecasting model that will assist the industry, governments and the media understand the possible impact of natural disasters like the Indian Ocean Tsunami, health related events like SARS in 2004, war and conflict events like the 1990 Gulf War or terrorism events like 9/11. The more we understand about the breadth, longevity and severity of these various events, the better we predict the potential impact and prepare for recovery.
As always, this 2005 research updates the historical results based on the most current data sources, estimates the current performance of Portugal's Travel & Tourism, and provides short- and long-term forecasts based on the most recent national and international data sources and econometric models developed by Oxford Econometric Forecasting.
Looking ahead, the forecast for Travel & Tourism Demand is expected to total 5.1% real growth in 2005, and 4.1% real growth per annum between 2006 and 2015.
This WTTC research quantifies and documents the Travel & Tourism economics for Portugal, the first step towards addressing mission-critical issues such as tourism management, tourism marketing and promotion, tourism infrastructure, taxation, aviation policy and much more.
We hope that by raising awareness of previous performance, current conditions and the, as yet unrealized, potential of Travel & Tourism in Portugal, this report will act as a catalyst, encouraging industry and government to continue to work together to create the conditions necessary to realize the industry’s true promise.
Jean-Claude Baumgarten Vincent A. WolfingtonPresident, World Travel & Tourism Council Chairman, World Travel & Tourism Council
Chairman Emeritus, Carey International, Inc.
With the Chief Executives of more than one hundred of the world’s leading companies inmembership, WTTC has a unique mandate and overview on all matters related to success in Travel &Tourism.
THE WORLD TRAVEL & TOURISM COUNCIL (WTTC) IS THE BUSINESS LEADERS’ FORUM FOR TRAVEL & TOURISM, WORKING WITH GOVERNMENTS TO RAISE AWARENESS OF THE IMPORTANCE OF THE WORLD’S LARGEST GENERATOR OF WEALTH AND JOBS.

CONTENTSTRAVEL & TOURISM – SOWING THE SEEDS OF GROWTH
WTTC MEMBERSHIP
ONE PAGE SUPER SUMMARY NEW
PRESIDENT AND CHAIRMAN’S MESSAGE
ECONOMIC IMPACT...............................................................................................................................................................6
GROWTH .................................................................................................................................................................................................7
TRAVEL & TOURISM SATELLITE ACCOUNTTOURISM SATELLITE ACCOUNTING ..........................................................................................................................................................8
WTTC’S APPROACH TO TSA RESEARCH...................................................................................................................................................9
TSA CONCEPTS & STRUCTURE IMPROVED ................................................................................................................................ 10-11
T&T DEMAND AND SUPPLY IMPROVED ...............................................................................................................................................12
TRAVEL & TOURISM’S ECONOMIC IMPACT IMPROVED ...............................................................................................................14
NATIONAL, REGIONAL, AND WORLD SUMMARY TABLES...............................................................................................................15
TOTAL DEMAND......................................................................................................................................................................................... 16-17
EMPLOYMENT............................................................................................................................................................................................. 18-19
GROSS DOMESTIC PRODUCT................................................................................................................................................................ 20-21
CAPITAL INVESTMENT............................................................................................................................................................................. 22-23
PERSONAL & BUSINESS ............................................................................................................................................................................ 24-25
EXPORTS ....................................................................................................................................................................................................... 26-27
GOVERNMENT NEW ............................................................................................................................................................................. 28-29
RANKING AND RANGE..................................................................................................................................................................................30
CONTRIBUTION AND GROWTH ...............................................................................................................................................................31
SATELLITE ACCOUNT TABLES............................................................................................................................................................... 32-33
2005/2004 VARIANCE CHARTS ............................................................................................................................................................... 34-35
WORLD AT A GLANCE IMPROVED ................................................................................................................................................... 36-38
OXFORD ECONOMIC FORECASTING......................................................................................................40
ACKNOWLEDGMENTS......................................................................................................................................................41
Use of Material is Authorized, Provided Source is Acknowledged
1-2 Queen Victoria Terrace, Sovereign Court, London E1W 3HA, United Kingdom,
Tel +44-870-727-9882 or +44-207-481-8007, Fax +44-870-728-9882 or +44-207-488-1008, enquires @wttc.org • www.wttc.org
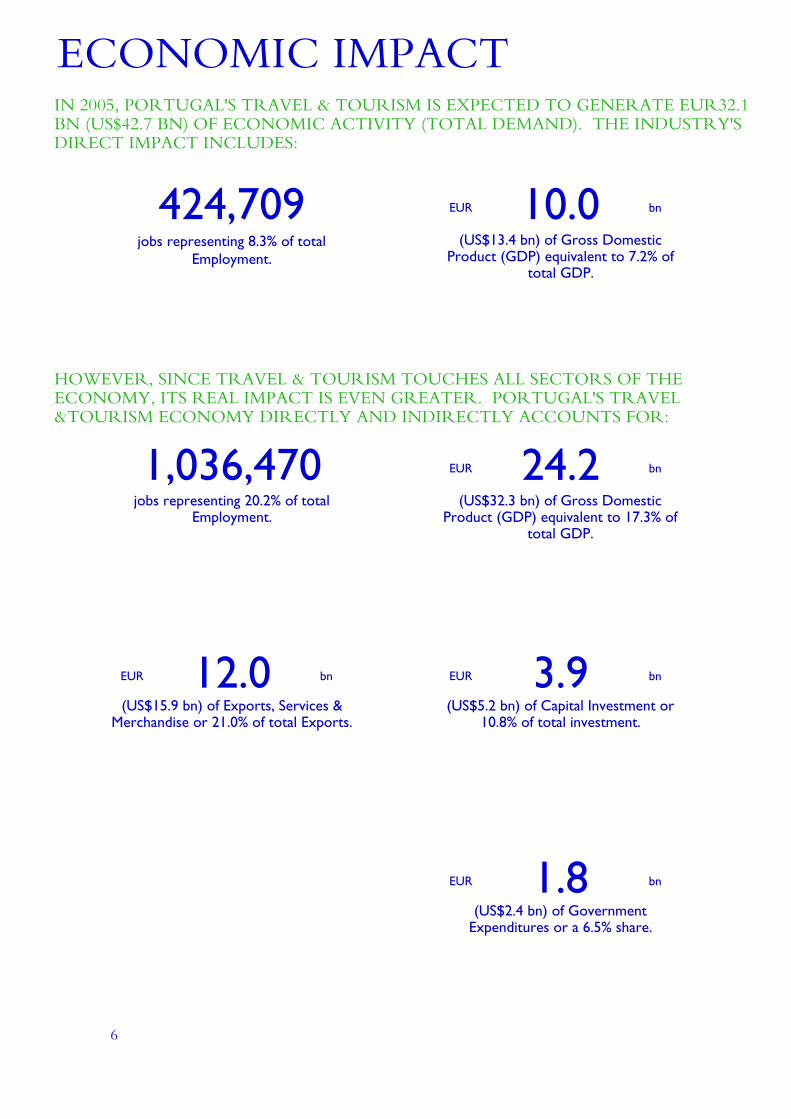
EUR 10.0 bn
EUR 24.2 bn
EUR 12.0 bn EUR 3.9 bn
EUR 1.8 bn
6
(US$13.4 bn) of Gross Domestic Product (GDP) equivalent to 7.2% of
total GDP.
HOWEVER, SINCE TRAVEL & TOURISM TOUCHES ALL SECTORS OF THE ECONOMY, ITS REAL IMPACT IS EVEN GREATER. PORTUGAL'S TRAVEL &TOURISM ECONOMY DIRECTLY AND INDIRECTLY ACCOUNTS FOR:
(US$15.9 bn) of Exports, Services & Merchandise or 21.0% of total Exports.
(US$5.2 bn) of Capital Investment or 10.8% of total investment.
(US$2.4 bn) of Government Expenditures or a 6.5% share.
ECONOMIC IMPACT
1,036,470jobs representing 20.2% of total
Employment.(US$32.3 bn) of Gross Domestic
Product (GDP) equivalent to 17.3% of total GDP.
IN 2005, PORTUGAL'S TRAVEL & TOURISM IS EXPECTED TO GENERATE EUR32.1 BN (US$42.7 BN) OF ECONOMIC ACTIVITY (TOTAL DEMAND). THE INDUSTRY'S DIRECT IMPACT INCLUDES:
jobs representing 8.3% of total Employment.
424,709
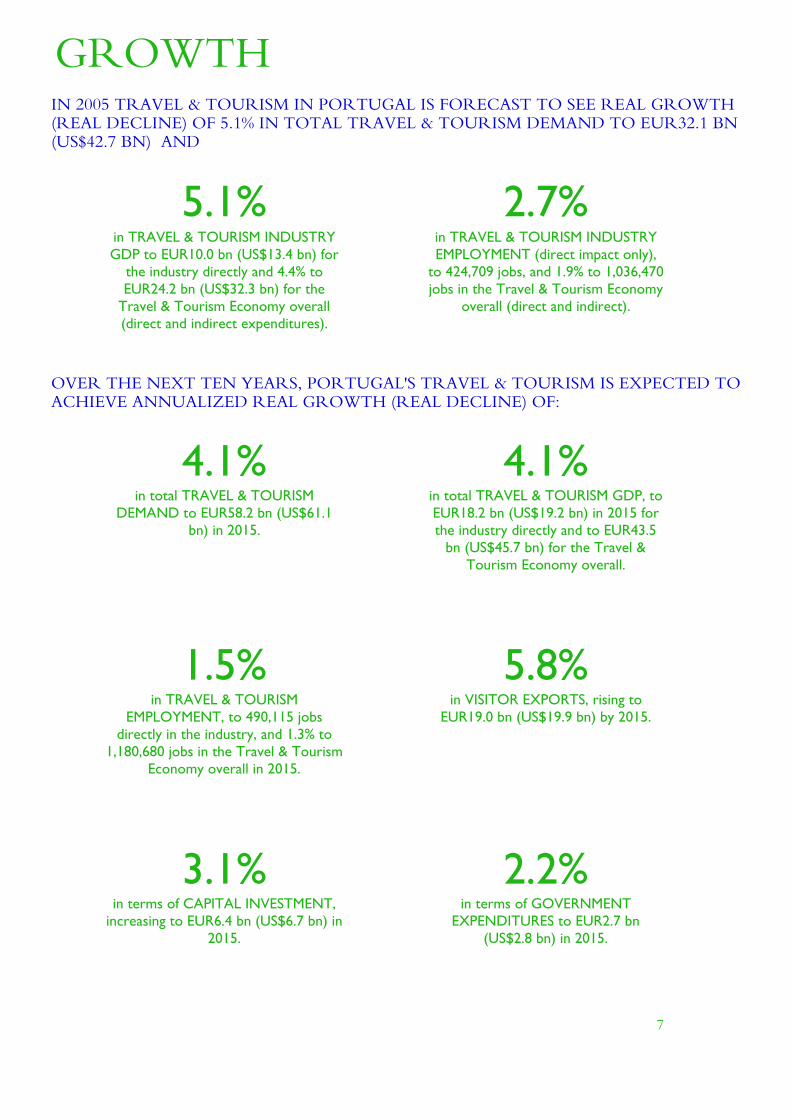
2.7%
4.1% 4.1%
1.5% 5.8%
3.1% 2.2%
7
5.1%in TRAVEL & TOURISM INDUSTRY GDP to EUR10.0 bn (US$13.4 bn) for
the industry directly and 4.4% to EUR24.2 bn (US$32.3 bn) for the
Travel & Tourism Economy overall (direct and indirect expenditures).
in TRAVEL & TOURISM INDUSTRY EMPLOYMENT (direct impact only),
to 424,709 jobs, and 1.9% to 1,036,470 jobs in the Travel & Tourism Economy
overall (direct and indirect).
GROWTHIN 2005 TRAVEL & TOURISM IN PORTUGAL IS FORECAST TO SEE REAL GROWTH (REAL DECLINE) OF 5.1% IN TOTAL TRAVEL & TOURISM DEMAND TO EUR32.1 BN (US$42.7 BN) AND
in terms of CAPITAL INVESTMENT, increasing to EUR6.4 bn (US$6.7 bn) in
2015.
in terms of GOVERNMENT EXPENDITURES to EUR2.7 bn
(US$2.8 bn) in 2015.
OVER THE NEXT TEN YEARS, PORTUGAL'S TRAVEL & TOURISM IS EXPECTED TO ACHIEVE ANNUALIZED REAL GROWTH (REAL DECLINE) OF:
in total TRAVEL & TOURISM DEMAND to EUR58.2 bn (US$61.1
bn) in 2015.
in total TRAVEL & TOURISM GDP, to EUR18.2 bn (US$19.2 bn) in 2015 for the industry directly and to EUR43.5
bn (US$45.7 bn) for the Travel & Tourism Economy overall.
in TRAVEL & TOURISM EMPLOYMENT, to 490,115 jobs
directly in the industry, and 1.3% to 1,180,680 jobs in the Travel & Tourism
Economy overall in 2015.
in VISITOR EXPORTS, rising to EUR19.0 bn (US$19.9 bn) by 2015.
TRAVEL & TOURISMSATELLITE ACCOUNTTOURISM SATELLITE ACCOUNTING
THIS REPORT FOLLOWS THE CONCEPT OF SATELLITE ACCOUNTINGDEFINED IN THE TOURISM SATELLITE ACCOUNT: RECOMMENDEDMETHODOLOGICAL FRAMEWORK (TSA:RMF), AND DEVELOPED UNDER THEAUSPICES OF THE WORLD TOURISM ORGANIZATION.
Over the last three decades, countries have estimated the economic impact of Travel &Tourism through a range of measures using a variety of definitions and methodologies. Suchapproaches have prevented meaningful comparisons among nations. Even for the same nationover different periods of time, they have frustrated business and government attempts to drawvalid conclusions about the nature and course of Travel & Tourism demand in nationaleconomies. This regime has obscured the substantial, positive role the industry plays innational economies and has thwarted business and government attempts to optimize economicprogrammes and policies.
The World Travel & Tourism Council (WTTC) recognized the dearth of crucial Travel& Tourism intelligence from the time of its establishment in 1990 and it published the firstdetailed estimates of world tourism's economic impact that same year.
Since then WTTC has worked to improve its methodologies and to encourage individualcountries to enhance their measurement and understanding of tourism’s impact on theirnational economies. Furthermore, in the spirit of joining forces to enhance worldcomprehension of the role of Travel & Tourism in national economies, WTTC has stronglysupported the programmes of the World Tourism Organization (WTO) to improve tourismstatistics worldwide.
WTTC’S RESEARCHWTTC and its economic consultants/research partners – Oxford Economic Forecasting,(OEF), since 1999, and Global Insight (previously known as DRI•WEFA), from 1990-1999 –have developed and published research on the economic contribution of Travel & Tourism tothe world, regional and national economies.
Starting in 1990,WTTC’s research team has been working to develop practical, real-worldmodels to illustrate Travel & Tourism’s economic contribution based on the needs of privatesector leaders, public sector policy-makers and industry researchers, and on the interpretationof the system of national accounts. The research is now firmly anchored in the internationalstandard for tourism satellite accounting that was developed by WTO, OECD and Eurostat,and approved by the United Nations Statistical Commission in 2000. It was launched at theTSA Conference held in Vancouver in May 2001 and published as The Tourism SatelliteAccount: Recommended Methodological Framework (TSA:RMF) in 2001.
Since 1999, WTTC's research has assumed the conceptual framework of the UN-approved standard with a number of discretionary extensions, and it combines the mostsophisticated economic modelling and forecasts available with the most up-to-date, publiclyavailable data to generate a comprehensive implementation of Travel & Tourism satelliteaccounting.
The 2005 update of the WTTC TSA research is the fifth annual update undertaken forWTTC by OEF. In carrying out the work, OEF has drawn extensively on the methodologydeveloped over the years by WTTC to develop TSAs as operational tools. OEF has also takenthe opportunity in a number of areas to review and enhance the modelling techniques,assumptions used and data sources applied, and this research for 2005 is no exception.
8
WTTC’S APPROACH TOTSA RESEARCHWTTC HAS ENDEAVOURED TO IMPLEMENT AND PRODUCE THE MOSTCOMPREHENSIVE TSA PROVIDED FOR WITHIN THE TSA:RMF, BYDEVELOPING THE SPECIFIC CONCEPT OF THE ‘TRAVEL & TOURISMINDUSTRY’ IN ADDITION TO THE BROADER CONCEPT OF THE ‘TRAVEL &TOURISM ECONOMY’.
WTTC advocates full implementation of the TSA as defined in the TSA:RMF in order toachieve the highest level of benefits for industry and governments. These include: A wealth of customer and consumer information on tourism-related purchases (before,
during and after trips – whether domestic or international, imported or exported – as wellas services, durables and non-durables) that has never been identified until now;
Comprehensive documentation and analysis of the full tourism-product service chain andgovernment’s ability to deliver quality and timely service to visitors;
Linkages between Travel & Tourism and other sectors of the economy such as agricultureand manufacturing to illustrate the flow-through of spending;
Complete outlook for public works that benefit visitors and Travel & Tourism companiesin order to leverage public sector plans and priorities for growth;
Focused opportunities for domestic production, as well as incentives from the publicsector, to aid in the growth of businesses that help alleviate trade balance issues;
Demand- and supply-side information on employment that allows for human resourceplanning and development.
WTTC has worked towards developing a comprehensive TSA – not because it is eager toexaggerate the size of Travel & Tourism’s impact, but because the information that can begarnered from the exercise by governments and industry is crucial for making intelligent andinformed policy and business decisions. WTTC believes that history will document itspioneering implementation of the simulated TSA as one of the most important turning pointsfor Travel & Tourism’s long overdue economic recognition.
In the WTTC research, no country receives special treatment or favours. WTTC usesinternationally available data sources and the same scope of tourism satellite accounting for allcountries, as well as the same basic assumptions through the same system of models. WTTC’sTSA research utilizes a universal and internally consistent modelling framework and generatesharmonized results and forecasts for more than 174 countries around the world. Details of themethodology used by WTTC/OEF in its TSA research are available on WTTC's website(www.wttc.org).
9
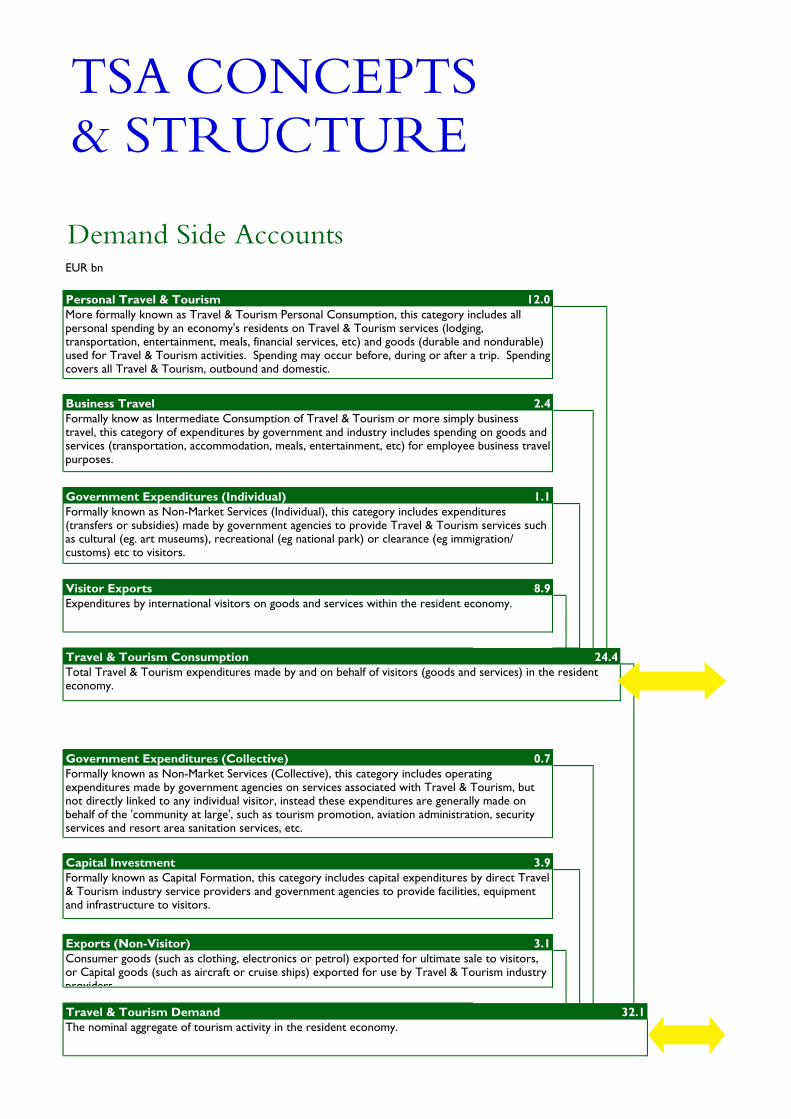
EUR bn
Personal Travel & Tourism 12.0
Business Travel 2.4
Government Expenditures (Individual) 1.1
Visitor Exports 8.9
Travel & Tourism Consumption
Government Expenditures (Collective) 0.7
Capital Investment 3.9
Exports (Non-Visitor) 3.1
Travel & Tourism Demand
Expenditures by international visitors on goods and services within the resident economy.
Consumer goods (such as clothing, electronics or petrol) exported for ultimate sale to visitors, or Capital goods (such as aircraft or cruise ships) exported for use by Travel & Tourism industry providers.
TSA CONCEPTS& STRUCTURE
More formally known as Travel & Tourism Personal Consumption, this category includes all personal spending by an economy's residents on Travel & Tourism services (lodging, transportation, entertainment, meals, financial services, etc) and goods (durable and nondurable) used for Travel & Tourism activities. Spending may occur before, during or after a trip. Spending covers all Travel & Tourism, outbound and domestic.
Formally know as Intermediate Consumption of Travel & Tourism or more simply business travel, this category of expenditures by government and industry includes spending on goods and services (transportation, accommodation, meals, entertainment, etc) for employee business travel purposes.
Formally known as Non-Market Services (Individual), this category includes expenditures (transfers or subsidies) made by government agencies to provide Travel & Tourism services such as cultural (eg. art museums), recreational (eg national park) or clearance (eg immigration/ customs) etc to visitors.
Formally known as Non-Market Services (Collective), this category includes operating expenditures made by government agencies on services associated with Travel & Tourism, but not directly linked to any individual visitor, instead these expenditures are generally made on behalf of the 'community at large', such as tourism promotion, aviation administration, security services and resort area sanitation services, etc.
Formally known as Capital Formation, this category includes capital expenditures by direct Travel & Tourism industry service providers and government agencies to provide facilities, equipment and infrastructure to visitors.
24.4Total Travel & Tourism expenditures made by and on behalf of visitors (goods and services) in the resident economy.
32.1The nominal aggregate of tourism activity in the resident economy.
Demand Side Accounts
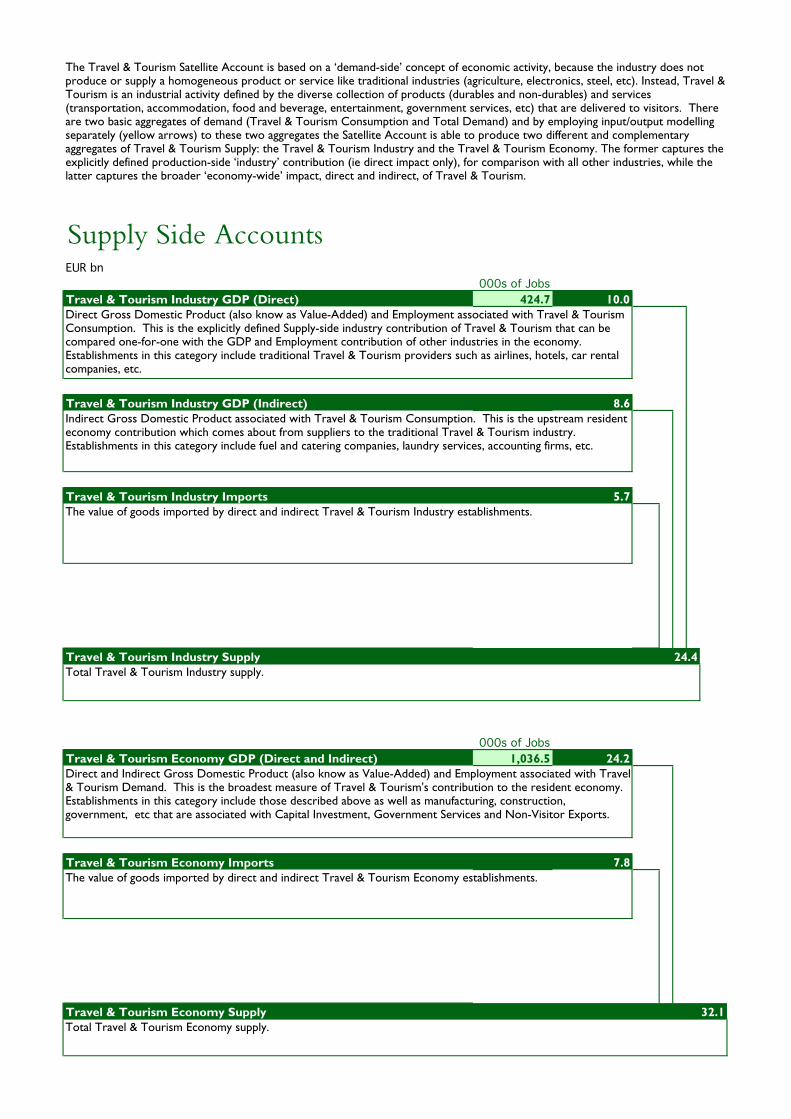
EUR bn000s of Jobs
Travel & Tourism Industry GDP (Direct) 424.7 10.0
Travel & Tourism Industry GDP (Indirect) 8.6
Travel & Tourism Industry Imports 5.7
Travel & Tourism Industry Supply
000s of JobsTravel & Tourism Economy GDP (Direct and Indirect) 1,036.5 24.2
Travel & Tourism Economy Imports 7.8
Travel & Tourism Economy SupplyTotal Travel & Tourism Economy supply.
The Travel & Tourism Satellite Account is based on a ‘demand-side’ concept of economic activity, because the industry does not produce or supply a homogeneous product or service like traditional industries (agriculture, electronics, steel, etc). Instead, Travel & Tourism is an industrial activity defined by the diverse collection of products (durables and non-durables) and services (transportation, accommodation, food and beverage, entertainment, government services, etc) that are delivered to visitors. There are two basic aggregates of demand (Travel & Tourism Consumption and Total Demand) and by employing input/output modelling separately (yellow arrows) to these two aggregates the Satellite Account is able to produce two different and complementary aggregates of Travel & Tourism Supply: the Travel & Tourism Industry and the Travel & Tourism Economy. The former captures the explicitly defined production-side ‘industry’ contribution (ie direct impact only), for comparison with all other industries, while the latter captures the broader ‘economy-wide’ impact, direct and indirect, of Travel & Tourism.
The value of goods imported by direct and indirect Travel & Tourism Economy establishments.
32.1
24.4Total Travel & Tourism Industry supply.
Direct Gross Domestic Product (also know as Value-Added) and Employment associated with Travel & Tourism Consumption. This is the explicitly defined Supply-side industry contribution of Travel & Tourism that can be compared one-for-one with the GDP and Employment contribution of other industries in the economy. Establishments in this category include traditional Travel & Tourism providers such as airlines, hotels, car rental companies, etc.
Indirect Gross Domestic Product associated with Travel & Tourism Consumption. This is the upstream resident economy contribution which comes about from suppliers to the traditional Travel & Tourism industry. Establishments in this category include fuel and catering companies, laundry services, accounting firms, etc.
The value of goods imported by direct and indirect Travel & Tourism Industry establishments.
Direct and Indirect Gross Domestic Product (also know as Value-Added) and Employment associated with Travel & Tourism Demand. This is the broadest measure of Travel & Tourism's contribution to the resident economy. Establishments in this category include those described above as well as manufacturing, construction, government, etc that are associated with Capital Investment, Government Services and Non-Visitor Exports.
Supply Side Accounts
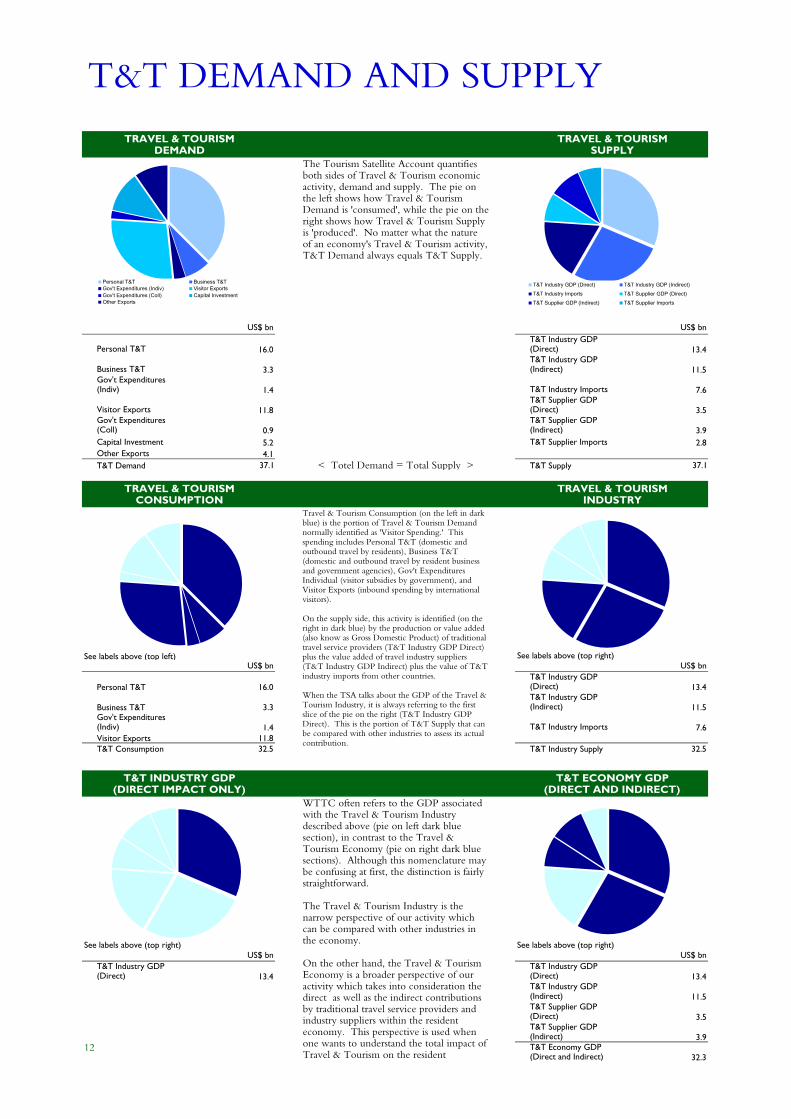
T&T DEMAND AND SUPPLY
The Tourism Satellite Account quantifies both sides of Travel & Tourism economic activity, demand and supply. The pie on the left shows how Travel & Tourism Demand is 'consumed', while the pie on the right shows how Travel & Tourism Supply is 'produced'. No matter what the nature of an economy's Travel & Tourism activity, T&T Demand always equals T&T Supply.
US$ bn US$ bn
Personal T&T 16.0T&T Industry GDP (Direct) 13.4
Business T&T 3.3T&T Industry GDP (Indirect) 11.5
Gov't Expenditures (Indiv) 1.4 T&T Industry Imports 7.6
Visitor Exports 11.8T&T Supplier GDP (Direct) 3.5
Gov't Expenditures (Coll) 0.9
T&T Supplier GDP (Indirect) 3.9
Capital Investment 5.2 T&T Supplier Imports 2.8Other Exports 4.1T&T Demand 37.1 < Totel Demand = Total Supply > T&T Supply 37.1
US$ bn US$ bn
Personal T&T 16.0T&T Industry GDP (Direct) 13.4
Business T&T 3.3T&T Industry GDP (Indirect) 11.5
Gov't Expenditures (Indiv) 1.4 T&T Industry Imports 7.6Visitor Exports 11.8T&T Consumption 32.5 T&T Industry Supply 32.5
US$ bn US$ bnT&T Industry GDP (Direct) 13.4
T&T Industry GDP (Direct) 13.4T&T Industry GDP (Indirect) 11.5T&T Supplier GDP (Direct) 3.5T&T Supplier GDP (Indirect) 3.9
12 T&T Economy GDP (Direct and Indirect) 32.3
TRAVEL & TOURISMDEMAND
TRAVEL & TOURISMSUPPLY
TRAVEL & TOURISMINDUSTRY
See labels above (top left)
TRAVEL & TOURISMCONSUMPTION
See labels above (top right)
Travel & Tourism Consumption (on the left in dark blue) is the portion of Travel & Tourism Demand normally identified as 'Visitor Spending.' This spending includes Personal T&T (domestic and outbound travel by residents), Business T&T (domestic and outbound travel by resident business and government agencies), Gov't Expenditures Individual (visitor subsidies by government), and Visitor Exports (inbound spending by international visitors).
On the supply side, this activity is identified (on the right in dark blue) by the production or value added (also know as Gross Domestic Product) of traditional travel service providers (T&T Industry GDP Direct) plus the value added of travel industry suppliers (T&T Industry GDP Indirect) plus the value of T&T industry imports from other countries.
When the TSA talks about the GDP of the Travel & Tourism Industry, it is always referring to the first slice of the pie on the right (T&T Industry GDP Direct). This is the portion of T&T Supply that can be compared with other industries to assess its actual contribution.
See labels above (top right) See labels above (top right)
T&T ECONOMY GDP(DIRECT AND INDIRECT)
T&T INDUSTRY GDP(DIRECT IMPACT ONLY)
WTTC often refers to the GDP associated with the Travel & Tourism Industry described above (pie on left dark blue section), in contrast to the Travel & Tourism Economy (pie on right dark blue sections). Although this nomenclature may be confusing at first, the distinction is fairly straightforward.
The Travel & Tourism Industry is the narrow perspective of our activity which can be compared with other industries in the economy.
On the other hand, the Travel & Tourism Economy is a broader perspective of our activity which takes into consideration the direct as well as the indirect contributions by traditional travel service providers and industry suppliers within the resident economy. This perspective is used when one wants to understand the total impact of Travel & Tourism on the resident economy.
Personal T&T Business T&TGov't Expenditures (Indiv) Visitor ExportsGov't Expenditures (Coll) Capital InvestmentOther Exports
T&T Industry GDP (Direct) T&T Industry GDP (Indirect)
T&T Industry Imports T&T Supplier GDP (Direct)
T&T Supplier GDP (Indirect) T&T Supplier Imports

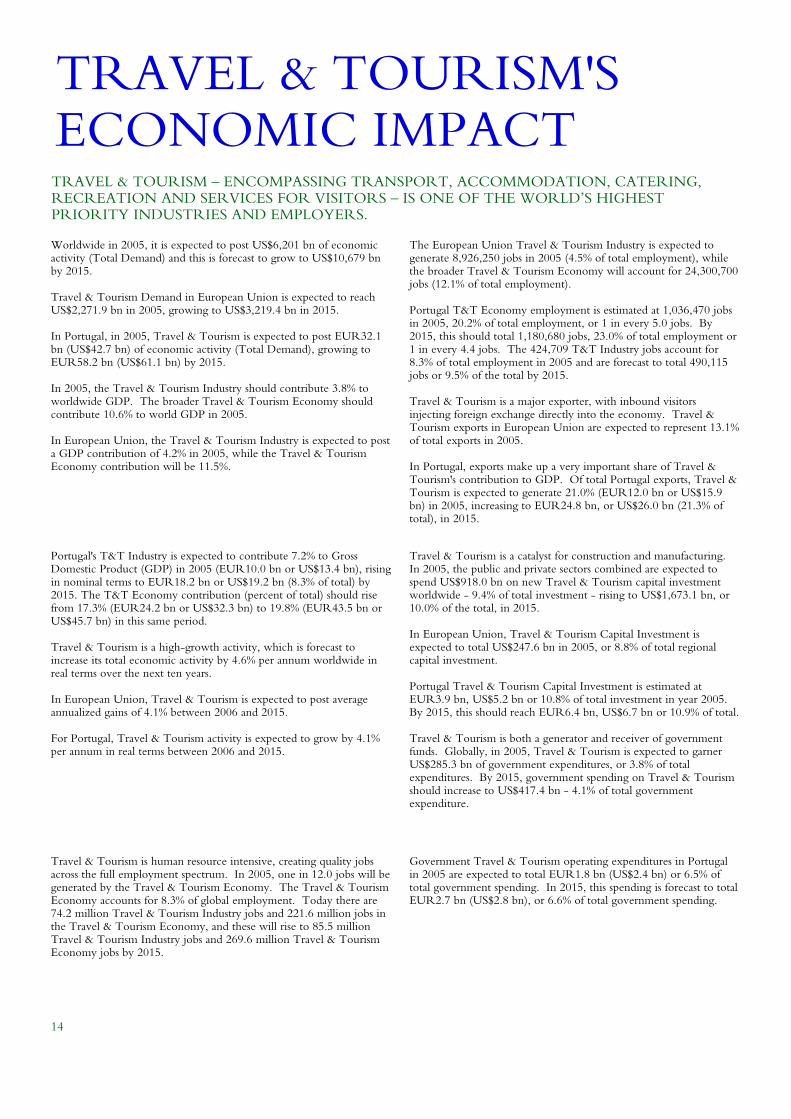
Worldwide in 2005, it is expected to post US$6,201 bn of economic activity (Total Demand) and this is forecast to grow to US$10,679 bn by 2015.
Travel & Tourism Demand in European Union is expected to reach US$2,271.9 bn in 2005, growing to US$3,219.4 bn in 2015.
In Portugal, in 2005, Travel & Tourism is expected to post EUR32.1 bn (US$42.7 bn) of economic activity (Total Demand), growing to EUR58.2 bn (US$61.1 bn) by 2015.
In 2005, the Travel & Tourism Industry should contribute 3.8% to worldwide GDP. The broader Travel & Tourism Economy should contribute 10.6% to world GDP in 2005.
In European Union, the Travel & Tourism Industry is expected to post a GDP contribution of 4.2% in 2005, while the Travel & Tourism Economy contribution will be 11.5%.
The European Union Travel & Tourism Industry is expected to generate 8,926,250 jobs in 2005 (4.5% of total employment), while the broader Travel & Tourism Economy will account for 24,300,700 jobs (12.1% of total employment).
Portugal T&T Economy employment is estimated at 1,036,470 jobs in 2005, 20.2% of total employment, or 1 in every 5.0 jobs. By 2015, this should total 1,180,680 jobs, 23.0% of total employment or 1 in every 4.4 jobs. The 424,709 T&T Industry jobs account for 8.3% of total employment in 2005 and are forecast to total 490,115 jobs or 9.5% of the total by 2015.
Travel & Tourism is a major exporter, with inbound visitors injecting foreign exchange directly into the economy. Travel & Tourism exports in European Union are expected to represent 13.1% of total exports in 2005.
In Portugal, exports make up a very important share of Travel & Tourism's contribution to GDP. Of total Portugal exports, Travel & Tourism is expected to generate 21.0% (EUR12.0 bn or US$15.9 bn) in 2005, increasing to EUR24.8 bn, or US$26.0 bn (21.3% of total), in 2015.
Portugal's T&T Industry is expected to contribute 7.2% to Gross Domestic Product (GDP) in 2005 (EUR10.0 bn or US$13.4 bn), rising in nominal terms to EUR18.2 bn or US$19.2 bn (8.3% of total) by 2015. The T&T Economy contribution (percent of total) should rise from 17.3% (EUR24.2 bn or US$32.3 bn) to 19.8% (EUR43.5 bn or US$45.7 bn) in this same period.
Travel & Tourism is a high-growth activity, which is forecast to increase its total economic activity by 4.6% per annum worldwide in real terms over the next ten years.
In European Union, Travel & Tourism is expected to post average annualized gains of 4.1% between 2006 and 2015.
For Portugal, Travel & Tourism activity is expected to grow by 4.1% per annum in real terms between 2006 and 2015.
Travel & Tourism is a catalyst for construction and manufacturing. In 2005, the public and private sectors combined are expected to spend US$918.0 bn on new Travel & Tourism capital investment worldwide - 9.4% of total investment - rising to US$1,673.1 bn, or 10.0% of the total, in 2015.
In European Union, Travel & Tourism Capital Investment is expected to total US$247.6 bn in 2005, or 8.8% of total regional capital investment.
Portugal Travel & Tourism Capital Investment is estimated at EUR3.9 bn, US$5.2 bn or 10.8% of total investment in year 2005. By 2015, this should reach EUR6.4 bn, US$6.7 bn or 10.9% of total.
Travel & Tourism is both a generator and receiver of government funds. Globally, in 2005, Travel & Tourism is expected to garner US$285.3 bn of government expenditures, or 3.8% of total expenditures. By 2015, government spending on Travel & Tourism should increase to US$417.4 bn - 4.1% of total government expenditure.
Travel & Tourism is human resource intensive, creating quality jobs across the full employment spectrum. In 2005, one in 12.0 jobs will be generated by the Travel & Tourism Economy. The Travel & Tourism Economy accounts for 8.3% of global employment. Today there are 74.2 million Travel & Tourism Industry jobs and 221.6 million jobs in the Travel & Tourism Economy, and these will rise to 85.5 million Travel & Tourism Industry jobs and 269.6 million Travel & Tourism Economy jobs by 2015.
Government Travel & Tourism operating expenditures in Portugal in 2005 are expected to total EUR1.8 bn (US$2.4 bn) or 6.5% of total government spending. In 2015, this spending is forecast to total EUR2.7 bn (US$2.8 bn), or 6.6% of total government spending.
14
TRAVEL & TOURISM'SECONOMIC IMPACTTRAVEL & TOURISM – ENCOMPASSING TRANSPORT, ACCOMMODATION, CATERING, RECREATION AND SERVICES FOR VISITORS – IS ONE OF THE WORLD’S HIGHEST PRIORITY INDUSTRIES AND EMPLOYERS.
2005 2015
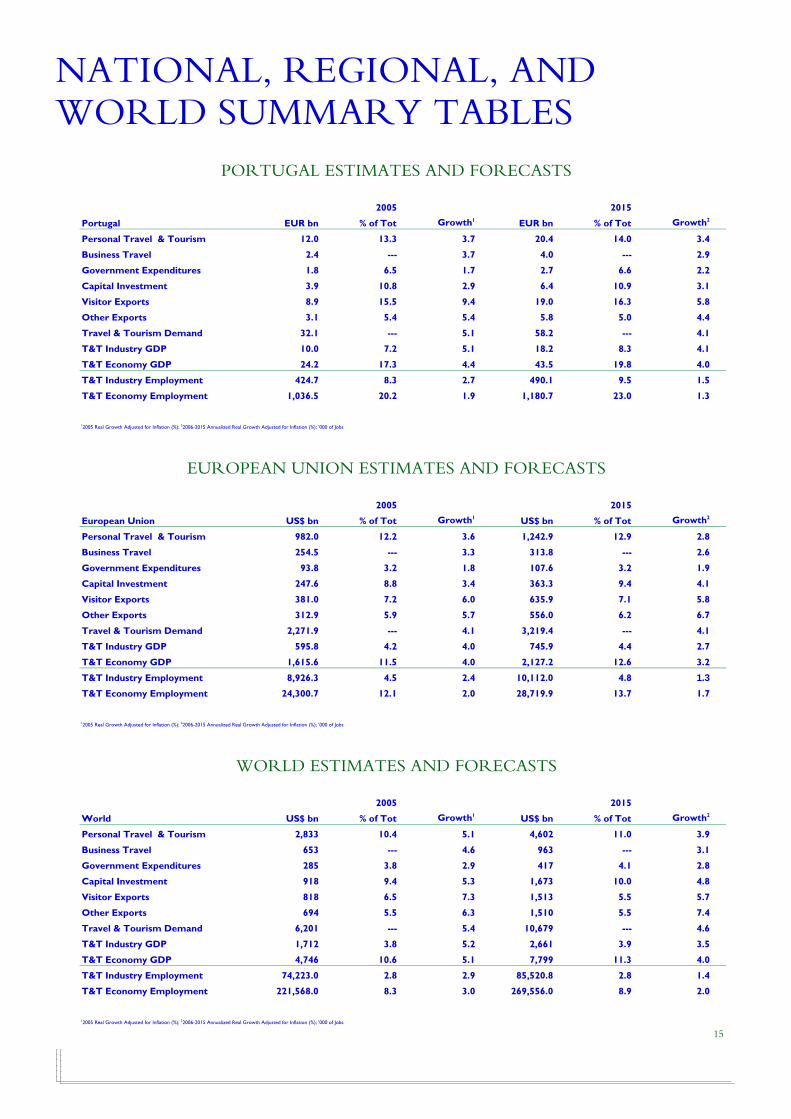
Portugal EUR bn % of Tot Growth1 EUR bn % of Tot Growth2
Personal Travel & Tourism 12.0 13.3 3.7 20.4 14.0 3.4
Business Travel 2.4 --- 3.7 4.0 --- 2.9
Government Expenditures 1.8 6.5 1.7 2.7 6.6 2.2
Capital Investment 3.9 10.8 2.9 6.4 10.9 3.1
Visitor Exports 8.9 15.5 9.4 19.0 16.3 5.8
Other Exports 3.1 5.4 5.4 5.8 5.0 4.4
Travel & Tourism Demand 32.1 --- 5.1 58.2 --- 4.1
T&T Industry GDP 10.0 7.2 5.1 18.2 8.3 4.1
T&T Economy GDP 24.2 17.3 4.4 43.5 19.8 4.0
T&T Industry Employment 424.7 8.3 2.7 490.1 9.5 1.5
T&T Economy Employment 1,036.5 20.2 1.9 1,180.7 23.0 1.3
12005 Real Growth Adjusted for Inflation (%); 22006-2015 Annualized Real Growth Adjusted for Inflation (%); '000 of Jobs
2005 2015
European Union US$ bn % of Tot Growth1 US$ bn % of Tot Growth2
Personal Travel & Tourism 982.0 12.2 3.6 1,242.9 12.9 2.8
Business Travel 254.5 --- 3.3 313.8 --- 2.6
Government Expenditures 93.8 3.2 1.8 107.6 3.2 1.9
Capital Investment 247.6 8.8 3.4 363.3 9.4 4.1
Visitor Exports 381.0 7.2 6.0 635.9 7.1 5.8
Other Exports 312.9 5.9 5.7 556.0 6.2 6.7
Travel & Tourism Demand 2,271.9 --- 4.1 3,219.4 --- 4.1
T&T Industry GDP 595.8 4.2 4.0 745.9 4.4 2.7
T&T Economy GDP 1,615.6 11.5 4.0 2,127.2 12.6 3.2
T&T Industry Employment 8,926.3 4.5 2.4 10,112.0 4.8 1.3
T&T Economy Employment 24,300.7 12.1 2.0 28,719.9 13.7 1.7
12005 Real Growth Adjusted for Inflation (%); 22006-2015 Annualized Real Growth Adjusted for Inflation (%); '000 of Jobs
2005 2015
World US$ bn % of Tot Growth1 US$ bn % of Tot Growth2
Personal Travel & Tourism 2,833 10.4 5.1 4,602 11.0 3.9
Business Travel 653 --- 4.6 963 --- 3.1
Government Expenditures 285 3.8 2.9 417 4.1 2.8
Capital Investment 918 9.4 5.3 1,673 10.0 4.8
Visitor Exports 818 6.5 7.3 1,513 5.5 5.7
Other Exports 694 5.5 6.3 1,510 5.5 7.4
Travel & Tourism Demand 6,201 --- 5.4 10,679 --- 4.6
T&T Industry GDP 1,712 3.8 5.2 2,661 3.9 3.5
T&T Economy GDP 4,746 10.6 5.1 7,799 11.3 4.0
T&T Industry Employment 74,223.0 2.8 2.9 85,520.8 2.8 1.4
T&T Economy Employment 221,568.0 8.3 3.0 269,556.0 8.9 2.0
12005 Real Growth Adjusted for Inflation (%); 22006-2015 Annualized Real Growth Adjusted for Inflation (%); '000 of Jobs
15
EUROPEAN UNION ESTIMATES AND FORECASTS
PORTUGAL ESTIMATES AND FORECASTS
WORLD ESTIMATES AND FORECASTS
NATIONAL, REGIONAL, ANDWORLD SUMMARY TABLES
0
0.2
0.4
0.6
0.8
1
1.2
TSA Concepts
Perc
ent
of T
otal
Cat
egor
y
0
0.2
0.4
0.6
0.8
1
1.2
TSA Concepts
Ann
ualiz
ed R
eal G
row
th

TOTAL DEMAND
* 2005 Regional Market Share is 1.88%
* 2005 World Market Share is 0.69%
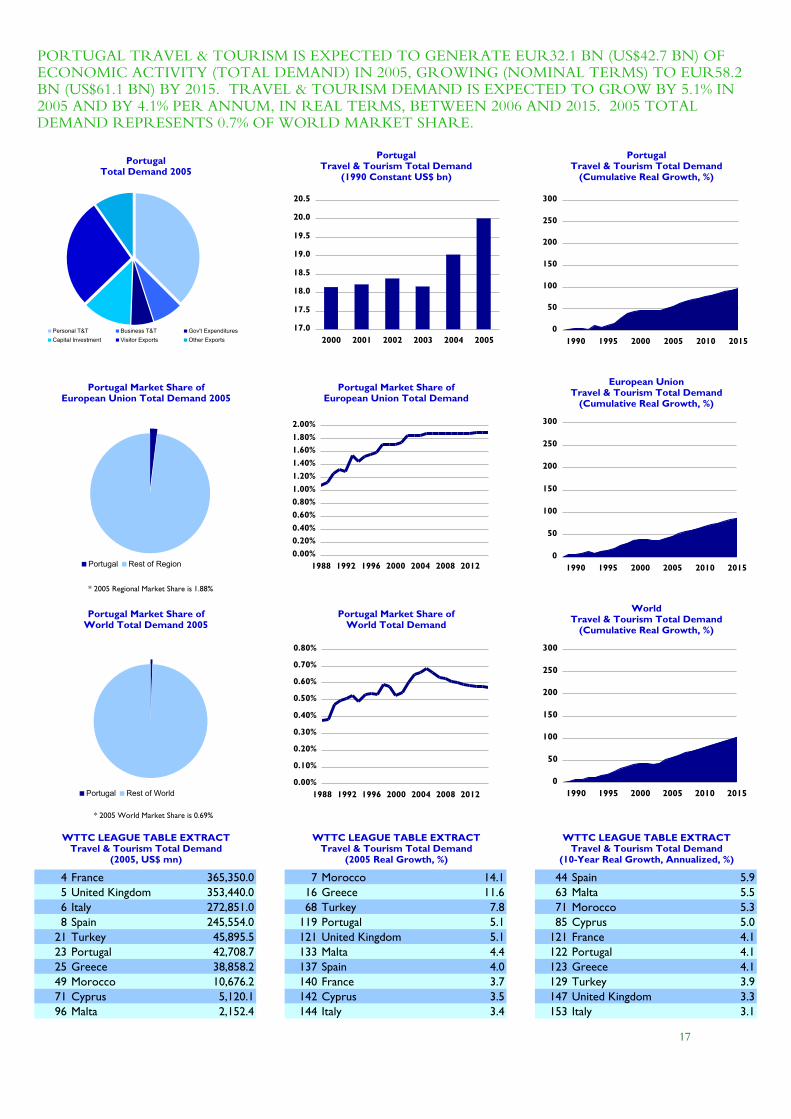
4 France 365,350.0 7 Morocco 14.1 44 Spain 5.95 United Kingdom 353,440.0 16 Greece 11.6 63 Malta 5.56 Italy 272,851.0 68 Turkey 7.8 71 Morocco 5.38 Spain 245,554.0 119 Portugal 5.1 85 Cyprus 5.0
21 Turkey 45,895.5 121 United Kingdom 5.1 121 France 4.123 Portugal 42,708.7 133 Malta 4.4 122 Portugal 4.125 Greece 38,858.2 137 Spain 4.0 123 Greece 4.149 Morocco 10,676.2 140 France 3.7 129 Turkey 3.971 Cyprus 5,120.1 142 Cyprus 3.5 147 United Kingdom 3.396 Malta 2,152.4 144 Italy 3.4 153 Italy 3.1
17
WTTC LEAGUE TABLE EXTRACTTravel & Tourism Total Demand
(2005 Real Growth, %)
WTTC LEAGUE TABLE EXTRACTTravel & Tourism Total Demand
(10-Year Real Growth, Annualized, %)
WorldTravel & Tourism Total Demand
(Cumulative Real Growth, %)
PORTUGAL TRAVEL & TOURISM IS EXPECTED TO GENERATE EUR32.1 BN (US$42.7 BN) OF ECONOMIC ACTIVITY (TOTAL DEMAND) IN 2005, GROWING (NOMINAL TERMS) TO EUR58.2 BN (US$61.1 BN) BY 2015. TRAVEL & TOURISM DEMAND IS EXPECTED TO GROW BY 5.1% IN 2005 AND BY 4.1% PER ANNUM, IN REAL TERMS, BETWEEN 2006 AND 2015. 2005 TOTAL DEMAND REPRESENTS 0.7% OF WORLD MARKET SHARE.
WTTC LEAGUE TABLE EXTRACTTravel & Tourism Total Demand
(2005, US$ mn)
PortugalTravel & Tourism Total Demand
(Cumulative Real Growth, %)
European UnionTravel & Tourism Total Demand
(Cumulative Real Growth, %)
Portugal Market Share ofWorld Total Demand
Portugal Market Share ofWorld Total Demand 2005
PortugalTotal Demand 2005
Portugal Market Share ofEuropean Union Total Demand 2005
PortugalTravel & Tourism Total Demand
(1990 Constant US$ bn)
Portugal Market Share ofEuropean Union Total Demand
Personal T&T Business T&T Gov't Expenditures
Capital Investment Visitor Exports Other Exports
Portugal Rest of Region0.00%0.20%0.40%0.60%0.80%1.00%1.20%1.40%1.60%1.80%2.00%
1988 1992 1996 2000 2004 2008 2012
Portugal Rest of World0.00%
0.10%
0.20%
0.30%
0.40%
0.50%
0.60%
0.70%
0.80%
1988 1992 1996 2000 2004 2008 2012
17.0
17.5
18.0
18.5
19.0
19.5
20.0
20.5
2000 2001 2002 2003 2004 20050
50
100
150
200
250
300
1990 1995 2000 2005 2010 2015
0
50
100
150
200
250
300
1990 1995 2000 2005 2010 2015
0
50
100
150
200
250
300
1990 1995 2000 2005 2010 2015

EMPLOYMENT

10 France 3,670.8 15 Malta 35.0 20 Spain 4.211 Spain 3,492.2 19 Cyprus 28.9 100 Morocco 2.114 United Kingdom 2,857.3 32 Spain 20.3 104 Greece 2.016 Italy 2,748.9 34 Portugal 20.2 107 France 2.025 Turkey 1,654.6 40 Greece 18.2 120 Malta 1.826 Morocco 1,526.2 46 France 15.1 140 Portugal 1.333 Portugal 1,036.5 48 Morocco 14.7 141 Cyprus 1.342 Greece 750.3 67 Italy 12.2 160 Turkey 0.7
113 Cyprus 107.5 88 United Kingdom 9.3 161 Italy 0.7134 Malta 50.7 111 Turkey 7.7 172 United Kingdom 0.0
19
PortugalTravel & Tourism Employment
('000s of Jobs)
European UnionTravel & Tourism Employment
('000s of Jobs)
PortugalTravel & Tourism Employment
(% of Total Employment)
European UnionTravel & Tourism Employment
(% of Total Employment)
Light Blue Line is T&T Industry Jobs; Dark Blue is T&T Economy JobsLight Blue Bar is T&T Industry Jobs; Light/Dark Blue Combination is T&T Economy Jobs
WorldTravel & Tourism Employment
('000s of Jobs)
PORTUGAL T&T ECONOMY EMPLOYMENT IS ESTIMATED AT 1,036,470 JOBS IN 2005, 20.2% OF TOTAL EMPLOYMENT, OR 1 IN EVERY 5.0 JOBS. BY 2015, THIS SHOULD TOTAL 1,180,680 JOBS, 23.0% OF TOTAL EMPLOYMENT OR 1 IN EVERY 4.4 JOBS. THE 424,709 T&T INDUSTRY JOBS ACCOUNT FOR 8.3% OF TOTAL EMPLOYMENT IN 2005 AND ARE FORECAST TO TOTAL 490,115 JOBS OR 9.5% OF THE TOTAL BY 2015.
WTTC LEAGUE TABLE EXTRACTTravel & Tourism Economy Employment
(2005, '000 of Jobs)
PortugalTravel & Tourism Employment(Cumulative Real Growth, %)
European UnionTravel & Tourism Economy Employment
(Cumulative Real Growth, %)
WTTC LEAGUE TABLE EXTRACTTravel & Tourism Economy Employment
(2005, % of Total Employment)
WTTC LEAGUE TABLE EXTRACTTravel & Tourism Economy Employment
(10-Year Real Growth, Annualized, %)
WorldTravel & Tourism Economy Employment
(Cumulative Real Growth, %)
WorldTravel & Tourism Employment
(% of Total Employment)
-50
0
50
100
150
200
250
300
1990 1995 2000 2005 2010 2015
-50
0
50
100
150
200
250
300
1990 1995 2000 2005 2010 2015
-50
0
50
100
150
200
250
300
1990 1995 2000 2005 2010 2015
0.0
200.0
400.0
600.0
800.0
1,000.0
1,200.0
2000 2001 2002 2003 2004 2005
0.0
5.0
10.0
15.0
20.0
25.0
1988 1992 1996 2000 2004 2008 2012
0.0
5,000.0
10,000.0
15,000.0
20,000.0
25,000.0
30,000.0
2000 2001 2002 2003 2004 2005
0.0
50,000.0
100,000.0
150,000.0
200,000.0
250,000.0
2000 2001 2002 2003 2004 2005
0.0
2.0
4.0
6.0
8.0
10.0
12.0
14.0
16.0
1988 1992 1996 2000 2004 2008 2012
0.01.02.03.04.05.06.07.08.09.0
10.0
1988 1992 1996 2000 2004 2008 2012

GROSSDOMESTICPRODUCT
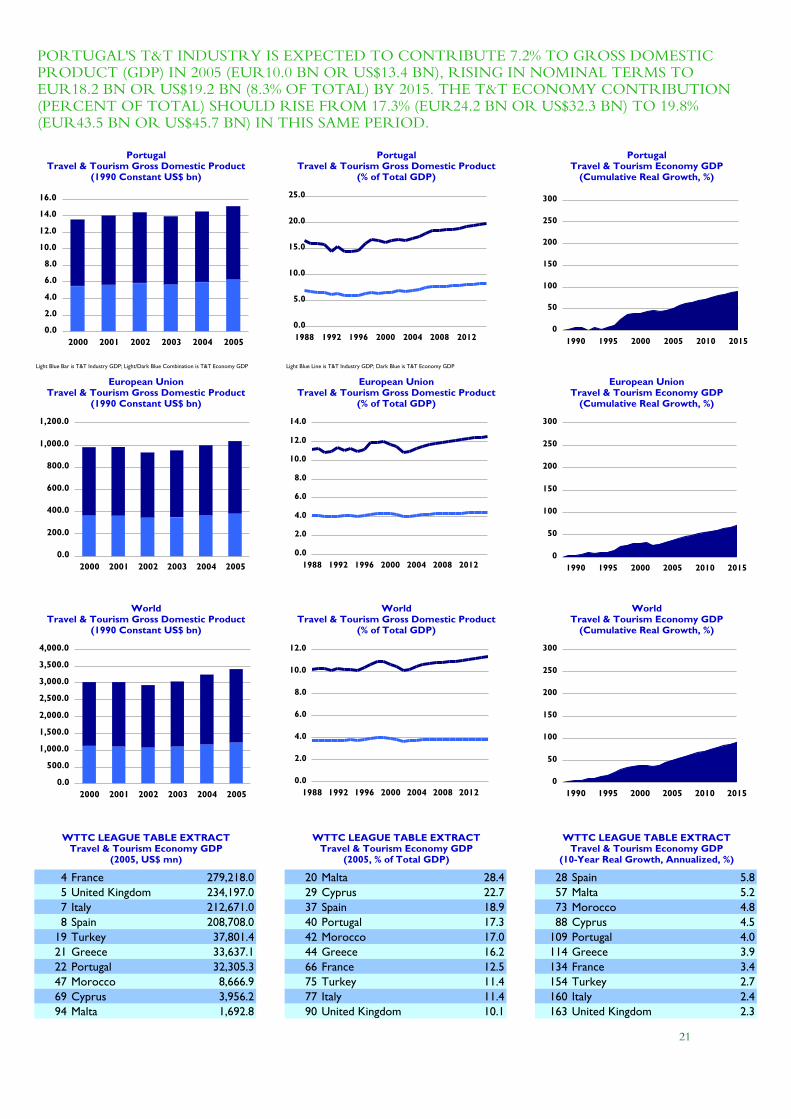
4 France 279,218.0 20 Malta 28.4 28 Spain 5.85 United Kingdom 234,197.0 29 Cyprus 22.7 57 Malta 5.27 Italy 212,671.0 37 Spain 18.9 73 Morocco 4.88 Spain 208,708.0 40 Portugal 17.3 88 Cyprus 4.5
19 Turkey 37,801.4 42 Morocco 17.0 109 Portugal 4.021 Greece 33,637.1 44 Greece 16.2 114 Greece 3.922 Portugal 32,305.3 66 France 12.5 134 France 3.447 Morocco 8,666.9 75 Turkey 11.4 154 Turkey 2.769 Cyprus 3,956.2 77 Italy 11.4 160 Italy 2.494 Malta 1,692.8 90 United Kingdom 10.1 163 United Kingdom 2.3
21
WTTC LEAGUE TABLE EXTRACTTravel & Tourism Economy GDP
(2005, % of Total GDP)
WTTC LEAGUE TABLE EXTRACTTravel & Tourism Economy GDP
(10-Year Real Growth, Annualized, %)
WorldTravel & Tourism Economy GDP
(Cumulative Real Growth, %)
PORTUGAL'S T&T INDUSTRY IS EXPECTED TO CONTRIBUTE 7.2% TO GROSS DOMESTIC PRODUCT (GDP) IN 2005 (EUR10.0 BN OR US$13.4 BN), RISING IN NOMINAL TERMS TO EUR18.2 BN OR US$19.2 BN (8.3% OF TOTAL) BY 2015. THE T&T ECONOMY CONTRIBUTION (PERCENT OF TOTAL) SHOULD RISE FROM 17.3% (EUR24.2 BN OR US$32.3 BN) TO 19.8% (EUR43.5 BN OR US$45.7 BN) IN THIS SAME PERIOD.
WTTC LEAGUE TABLE EXTRACTTravel & Tourism Economy GDP
(2005, US$ mn)
PortugalTravel & Tourism Economy GDP
(Cumulative Real Growth, %)
European UnionTravel & Tourism Economy GDP
(Cumulative Real Growth, %)
WorldTravel & Tourism Gross Domestic Product
(% of Total GDP)
WorldTravel & Tourism Gross Domestic Product
(1990 Constant US$ bn)
European UnionTravel & Tourism Gross Domestic Product
(1990 Constant US$ bn)
PortugalTravel & Tourism Gross Domestic Product
(1990 Constant US$ bn)
PortugalTravel & Tourism Gross Domestic Product
(% of Total GDP)
European UnionTravel & Tourism Gross Domestic Product
(% of Total GDP)
Light Blue Line is T&T Industry GDP; Dark Blue is T&T Economy GDPLight Blue Bar is T&T Industry GDP; Light/Dark Blue Combination is T&T Economy GDP
0
50
100
150
200
250
300
1990 1995 2000 2005 2010 2015
0
50
100
150
200
250
300
1990 1995 2000 2005 2010 2015
0
50
100
150
200
250
300
1990 1995 2000 2005 2010 2015
0.0
2.0
4.0
6.0
8.0
10.0
12.0
14.0
16.0
2000 2001 2002 2003 2004 2005
0.0
5.0
10.0
15.0
20.0
25.0
1988 1992 1996 2000 2004 2008 2012
0.0
200.0
400.0
600.0
800.0
1,000.0
1,200.0
2000 2001 2002 2003 2004 2005
0.0
500.0
1,000.0
1,500.0
2,000.0
2,500.0
3,000.0
3,500.0
4,000.0
2000 2001 2002 2003 2004 2005
0.0
2.0
4.0
6.0
8.0
10.0
12.0
14.0
1988 1992 1996 2000 2004 2008 2012
0.0
2.0
4.0
6.0
8.0
10.0
12.0
1988 1992 1996 2000 2004 2008 2012

CAPITALINVESTMENT
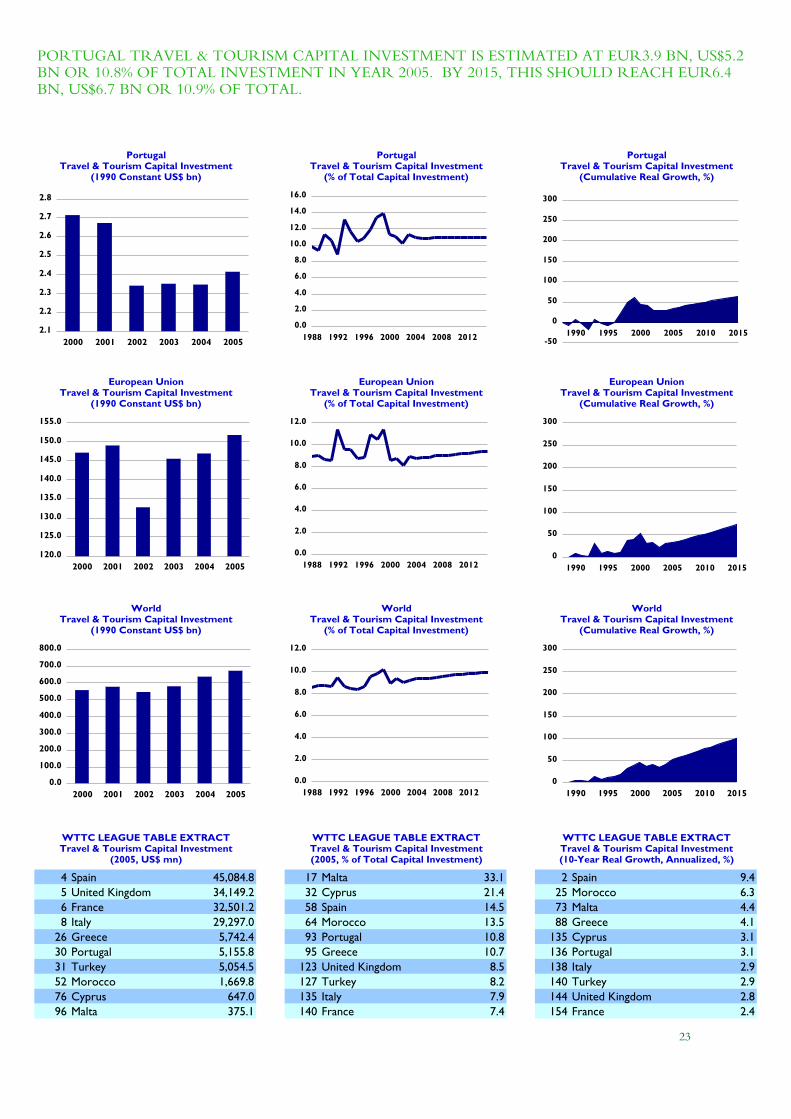
4 Spain 45,084.8 17 Malta 33.1 2 Spain 9.45 United Kingdom 34,149.2 32 Cyprus 21.4 25 Morocco 6.36 France 32,501.2 58 Spain 14.5 73 Malta 4.48 Italy 29,297.0 64 Morocco 13.5 88 Greece 4.1
26 Greece 5,742.4 93 Portugal 10.8 135 Cyprus 3.130 Portugal 5,155.8 95 Greece 10.7 136 Portugal 3.131 Turkey 5,054.5 123 United Kingdom 8.5 138 Italy 2.952 Morocco 1,669.8 127 Turkey 8.2 140 Turkey 2.976 Cyprus 647.0 135 Italy 7.9 144 United Kingdom 2.896 Malta 375.1 140 France 7.4 154 France 2.4
23
European UnionTravel & Tourism Capital Investment
(1990 Constant US$ bn)
PortugalTravel & Tourism Capital Investment
(1990 Constant US$ bn)
PortugalTravel & Tourism Capital Investment
(% of Total Capital Investment)
European UnionTravel & Tourism Capital Investment
(% of Total Capital Investment)
WorldTravel & Tourism Capital Investment
(1990 Constant US$ bn)
PORTUGAL TRAVEL & TOURISM CAPITAL INVESTMENT IS ESTIMATED AT EUR3.9 BN, US$5.2 BN OR 10.8% OF TOTAL INVESTMENT IN YEAR 2005. BY 2015, THIS SHOULD REACH EUR6.4 BN, US$6.7 BN OR 10.9% OF TOTAL.
WTTC LEAGUE TABLE EXTRACTTravel & Tourism Capital Investment
(2005, US$ mn)
PortugalTravel & Tourism Capital Investment
(Cumulative Real Growth, %)
European UnionTravel & Tourism Capital Investment
(Cumulative Real Growth, %)
WTTC LEAGUE TABLE EXTRACTTravel & Tourism Capital Investment(2005, % of Total Capital Investment)
WTTC LEAGUE TABLE EXTRACTTravel & Tourism Capital Investment(10-Year Real Growth, Annualized, %)
WorldTravel & Tourism Capital Investment
(Cumulative Real Growth, %)
WorldTravel & Tourism Capital Investment
(% of Total Capital Investment)
-50
0
50
100
150
200
250
300
1990 1995 2000 2005 2010 2015
0
50
100
150
200
250
300
1990 1995 2000 2005 2010 2015
0
50
100
150
200
250
300
1990 1995 2000 2005 2010 2015
2.1
2.2
2.3
2.4
2.5
2.6
2.7
2.8
2000 2001 2002 2003 2004 2005
0.0
2.0
4.0
6.0
8.0
10.0
12.0
14.0
16.0
1988 1992 1996 2000 2004 2008 2012
120.0
125.0
130.0
135.0
140.0
145.0
150.0
155.0
2000 2001 2002 2003 2004 2005
0.0
100.0
200.0
300.0
400.0
500.0
600.0
700.0
800.0
2000 2001 2002 2003 2004 2005
0.0
2.0
4.0
6.0
8.0
10.0
12.0
1988 1992 1996 2000 2004 2008 2012
0.0
2.0
4.0
6.0
8.0
10.0
12.0
1988 1992 1996 2000 2004 2008 2012

PERSONAL & BUSINESS
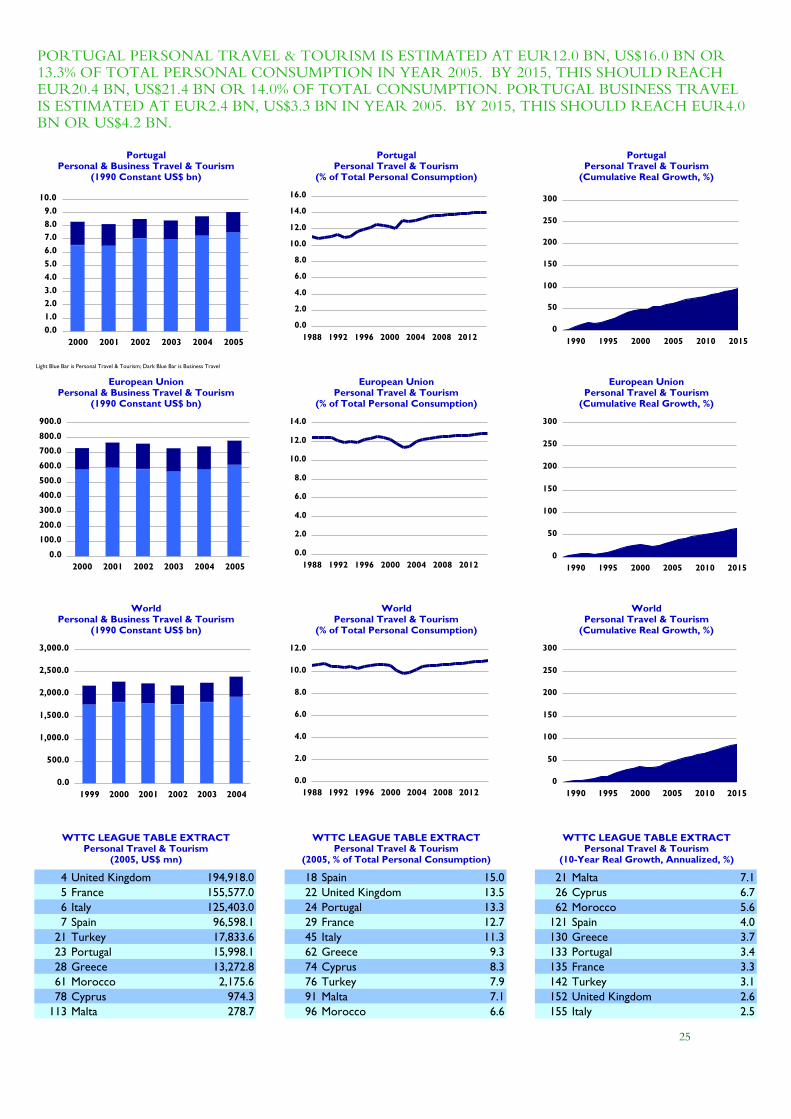
4 United Kingdom 194,918.0 18 Spain 15.0 21 Malta 7.15 France 155,577.0 22 United Kingdom 13.5 26 Cyprus 6.76 Italy 125,403.0 24 Portugal 13.3 62 Morocco 5.67 Spain 96,598.1 29 France 12.7 121 Spain 4.0
21 Turkey 17,833.6 45 Italy 11.3 130 Greece 3.723 Portugal 15,998.1 62 Greece 9.3 133 Portugal 3.428 Greece 13,272.8 74 Cyprus 8.3 135 France 3.361 Morocco 2,175.6 76 Turkey 7.9 142 Turkey 3.178 Cyprus 974.3 91 Malta 7.1 152 United Kingdom 2.6
113 Malta 278.7 96 Morocco 6.6 155 Italy 2.5
25
European UnionPersonal & Business Travel & Tourism
(1990 Constant US$ bn)
PortugalPersonal & Business Travel & Tourism
(1990 Constant US$ bn)
PortugalPersonal Travel & Tourism
(% of Total Personal Consumption)
European UnionPersonal Travel & Tourism
(% of Total Personal Consumption)
Light Blue Bar is Personal Travel & Tourism; Dark Blue Bar is Business Travel
WorldPersonal & Business Travel & Tourism
(1990 Constant US$ bn)
PORTUGAL PERSONAL TRAVEL & TOURISM IS ESTIMATED AT EUR12.0 BN, US$16.0 BN OR 13.3% OF TOTAL PERSONAL CONSUMPTION IN YEAR 2005. BY 2015, THIS SHOULD REACH EUR20.4 BN, US$21.4 BN OR 14.0% OF TOTAL CONSUMPTION. PORTUGAL BUSINESS TRAVEL IS ESTIMATED AT EUR2.4 BN, US$3.3 BN IN YEAR 2005. BY 2015, THIS SHOULD REACH EUR4.0 BN OR US$4.2 BN.
WTTC LEAGUE TABLE EXTRACTPersonal Travel & Tourism
(2005, US$ mn)
PortugalPersonal Travel & Tourism
(Cumulative Real Growth, %)
European UnionPersonal Travel & Tourism
(Cumulative Real Growth, %)
WTTC LEAGUE TABLE EXTRACTPersonal Travel & Tourism
(2005, % of Total Personal Consumption)
WTTC LEAGUE TABLE EXTRACTPersonal Travel & Tourism
(10-Year Real Growth, Annualized, %)
WorldPersonal Travel & Tourism
(Cumulative Real Growth, %)
WorldPersonal Travel & Tourism
(% of Total Personal Consumption)
0
50
100
150
200
250
300
1990 1995 2000 2005 2010 2015
0
50
100
150
200
250
300
1990 1995 2000 2005 2010 2015
0
50
100
150
200
250
300
1990 1995 2000 2005 2010 2015
0.01.02.03.04.05.06.07.08.09.0
10.0
2000 2001 2002 2003 2004 2005
0.0
2.0
4.0
6.0
8.0
10.0
12.0
14.0
16.0
1988 1992 1996 2000 2004 2008 2012
0.0
100.0
200.0
300.0
400.0
500.0
600.0
700.0
800.0
900.0
2000 2001 2002 2003 2004 2005
0.0
500.0
1,000.0
1,500.0
2,000.0
2,500.0
3,000.0
1999 2000 2001 2002 2003 2004
0.0
2.0
4.0
6.0
8.0
10.0
12.0
14.0
1988 1992 1996 2000 2004 2008 2012
0.0
2.0
4.0
6.0
8.0
10.0
12.0
1988 1992 1996 2000 2004 2008 2012
EXPORTS
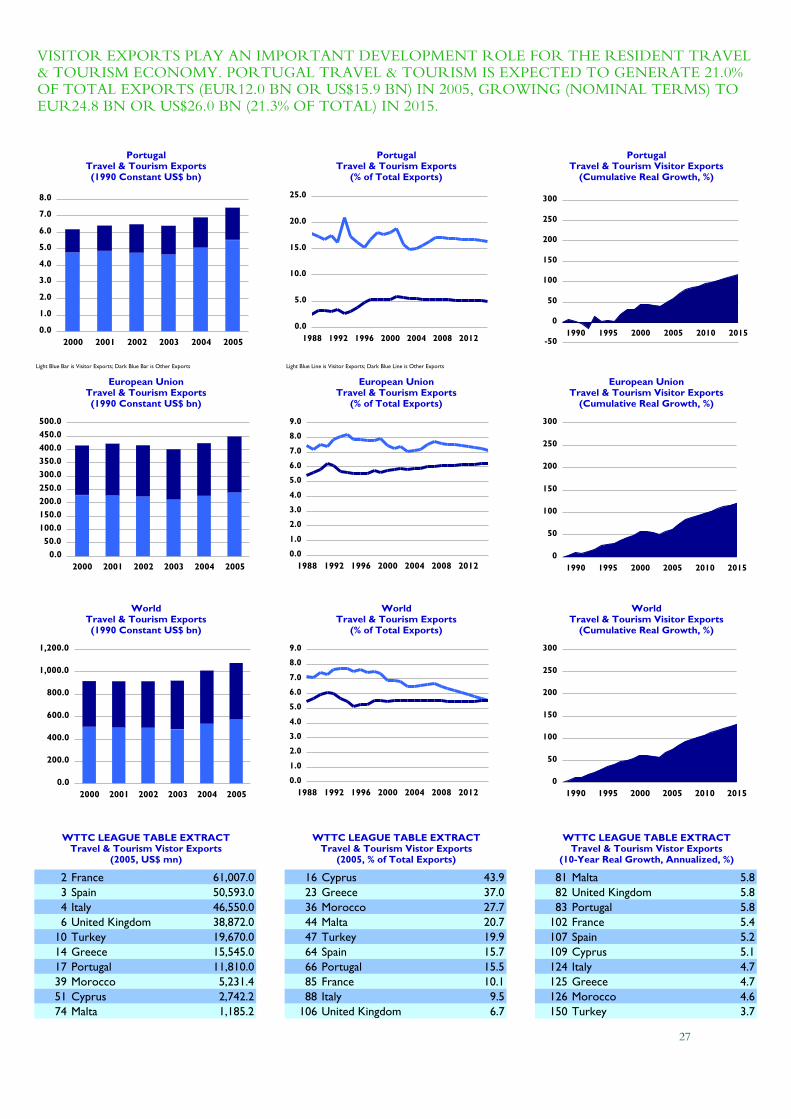
2 France 61,007.0 16 Cyprus 43.9 81 Malta 5.83 Spain 50,593.0 23 Greece 37.0 82 United Kingdom 5.84 Italy 46,550.0 36 Morocco 27.7 83 Portugal 5.86 United Kingdom 38,872.0 44 Malta 20.7 102 France 5.4
10 Turkey 19,670.0 47 Turkey 19.9 107 Spain 5.214 Greece 15,545.0 64 Spain 15.7 109 Cyprus 5.117 Portugal 11,810.0 66 Portugal 15.5 124 Italy 4.739 Morocco 5,231.4 85 France 10.1 125 Greece 4.751 Cyprus 2,742.2 88 Italy 9.5 126 Morocco 4.674 Malta 1,185.2 106 United Kingdom 6.7 150 Turkey 3.7
27
WTTC LEAGUE TABLE EXTRACTTravel & Tourism Vistor Exports
(2005, % of Total Exports)
WTTC LEAGUE TABLE EXTRACTTravel & Tourism Vistor Exports
(10-Year Real Growth, Annualized, %)
WorldTravel & Tourism Visitor Exports
(Cumulative Real Growth, %)
VISITOR EXPORTS PLAY AN IMPORTANT DEVELOPMENT ROLE FOR THE RESIDENT TRAVEL & TOURISM ECONOMY. PORTUGAL TRAVEL & TOURISM IS EXPECTED TO GENERATE 21.0% OF TOTAL EXPORTS (EUR12.0 BN OR US$15.9 BN) IN 2005, GROWING (NOMINAL TERMS) TO EUR24.8 BN OR US$26.0 BN (21.3% OF TOTAL) IN 2015.
WTTC LEAGUE TABLE EXTRACTTravel & Tourism Vistor Exports
(2005, US$ mn)
PortugalTravel & Tourism Visitor Exports
(Cumulative Real Growth, %)
European UnionTravel & Tourism Visitor Exports
(Cumulative Real Growth, %)
WorldTravel & Tourism Exports
(% of Total Exports)
WorldTravel & Tourism Exports(1990 Constant US$ bn)
European UnionTravel & Tourism Exports(1990 Constant US$ bn)
PortugalTravel & Tourism Exports(1990 Constant US$ bn)
PortugalTravel & Tourism Exports
(% of Total Exports)
European UnionTravel & Tourism Exports
(% of Total Exports)
Light Blue Bar is Visitor Exports; Dark Blue Bar is Other Exports Light Blue Line is Visitor Exports; Dark Blue Line is Other Exports
-50
0
50
100
150
200
250
300
1990 1995 2000 2005 2010 2015
0
50
100
150
200
250
300
1990 1995 2000 2005 2010 2015
0
50
100
150
200
250
300
1990 1995 2000 2005 2010 2015
0.0
1.0
2.0
3.0
4.0
5.0
6.0
7.0
8.0
2000 2001 2002 2003 2004 2005
0.050.0
100.0150.0200.0250.0300.0350.0400.0450.0500.0
2000 2001 2002 2003 2004 2005
0.0
200.0
400.0
600.0
800.0
1,000.0
1,200.0
2000 2001 2002 2003 2004 2005
0.0
5.0
10.0
15.0
20.0
25.0
1988 1992 1996 2000 2004 2008 2012
0.0
1.0
2.0
3.0
4.0
5.0
6.0
7.0
8.0
9.0
1988 1992 1996 2000 2004 2008 2012
0.0
1.0
2.0
3.0
4.0
5.0
6.0
7.0
8.0
9.0
1988 1992 1996 2000 2004 2008 2012

GOVERNMENT
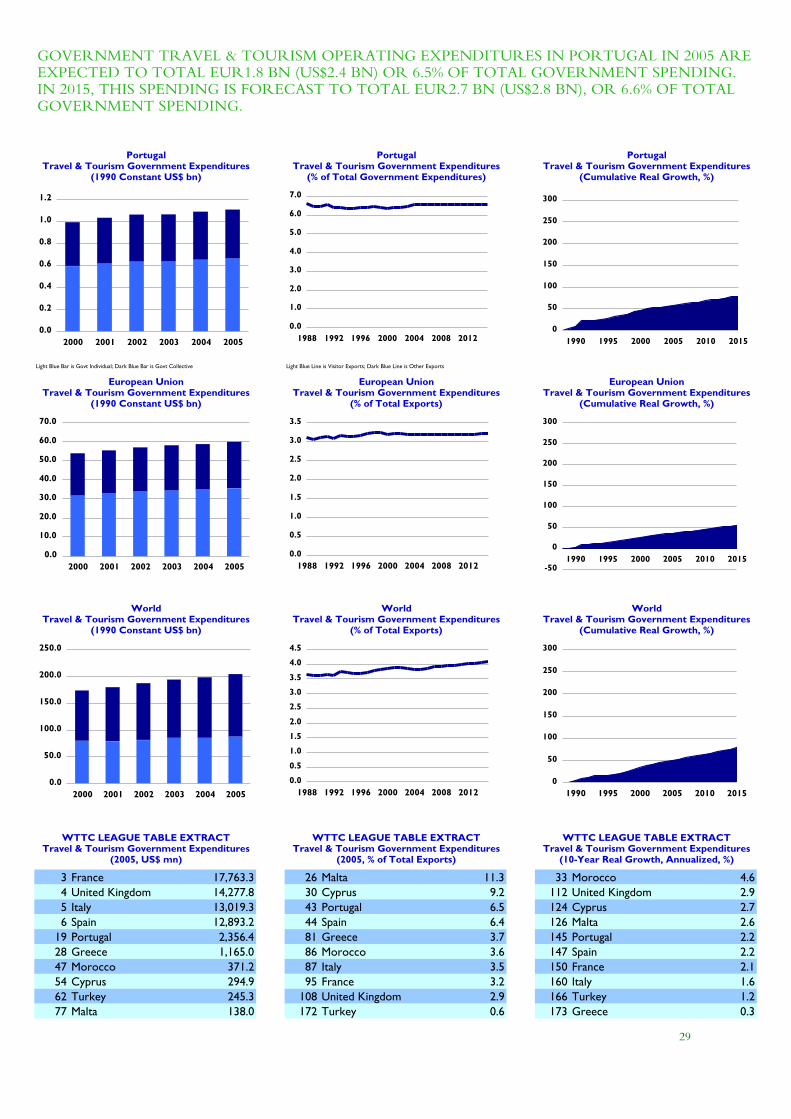
3 France 17,763.3 26 Malta 11.3 33 Morocco 4.64 United Kingdom 14,277.8 30 Cyprus 9.2 112 United Kingdom 2.95 Italy 13,019.3 43 Portugal 6.5 124 Cyprus 2.76 Spain 12,893.2 44 Spain 6.4 126 Malta 2.6
19 Portugal 2,356.4 81 Greece 3.7 145 Portugal 2.228 Greece 1,165.0 86 Morocco 3.6 147 Spain 2.247 Morocco 371.2 87 Italy 3.5 150 France 2.154 Cyprus 294.9 95 France 3.2 160 Italy 1.662 Turkey 245.3 108 United Kingdom 2.9 166 Turkey 1.277 Malta 138.0 172 Turkey 0.6 173 Greece 0.3
29
European UnionTravel & Tourism Government Expenditures
(1990 Constant US$ bn)
PortugalTravel & Tourism Government Expenditures
(1990 Constant US$ bn)
PortugalTravel & Tourism Government Expenditures
(% of Total Government Expenditures)
European UnionTravel & Tourism Government Expenditures
(% of Total Exports)
Light Blue Bar is Govt Individual; Dark Blue Bar is Govt Collective Light Blue Line is Visitor Exports; Dark Blue Line is Other Exports
GOVERNMENT TRAVEL & TOURISM OPERATING EXPENDITURES IN PORTUGAL IN 2005 ARE EXPECTED TO TOTAL EUR1.8 BN (US$2.4 BN) OR 6.5% OF TOTAL GOVERNMENT SPENDING. IN 2015, THIS SPENDING IS FORECAST TO TOTAL EUR2.7 BN (US$2.8 BN), OR 6.6% OF TOTAL GOVERNMENT SPENDING.
WTTC LEAGUE TABLE EXTRACTTravel & Tourism Government Expenditures
(2005, US$ mn)
PortugalTravel & Tourism Government Expenditures
(Cumulative Real Growth, %)
European UnionTravel & Tourism Government Expenditures
(Cumulative Real Growth, %)
WorldTravel & Tourism Government Expenditures
(% of Total Exports)
WorldTravel & Tourism Government Expenditures
(1990 Constant US$ bn)
WTTC LEAGUE TABLE EXTRACTTravel & Tourism Government Expenditures
(2005, % of Total Exports)
WTTC LEAGUE TABLE EXTRACTTravel & Tourism Government Expenditures
(10-Year Real Growth, Annualized, %)
WorldTravel & Tourism Government Expenditures
(Cumulative Real Growth, %)
0
50
100
150
200
250
300
1990 1995 2000 2005 2010 2015
-50
0
50
100
150
200
250
300
1990 1995 2000 2005 2010 2015
0
50
100
150
200
250
300
1990 1995 2000 2005 2010 2015
0.0
0.2
0.4
0.6
0.8
1.0
1.2
2000 2001 2002 2003 2004 2005
0.0
10.0
20.0
30.0
40.0
50.0
60.0
70.0
2000 2001 2002 2003 2004 2005
0.0
50.0
100.0
150.0
200.0
250.0
2000 2001 2002 2003 2004 2005
0.0
1.0
2.0
3.0
4.0
5.0
6.0
7.0
1988 1992 1996 2000 2004 2008 2012
0.0
0.5
1.0
1.5
2.0
2.5
3.0
3.5
1988 1992 1996 2000 2004 2008 2012
0.0
0.5
1.0
1.5
2.0
2.5
3.0
3.5
4.0
4.5
1988 1992 1996 2000 2004 2008 2012
RANKING AND RANGE
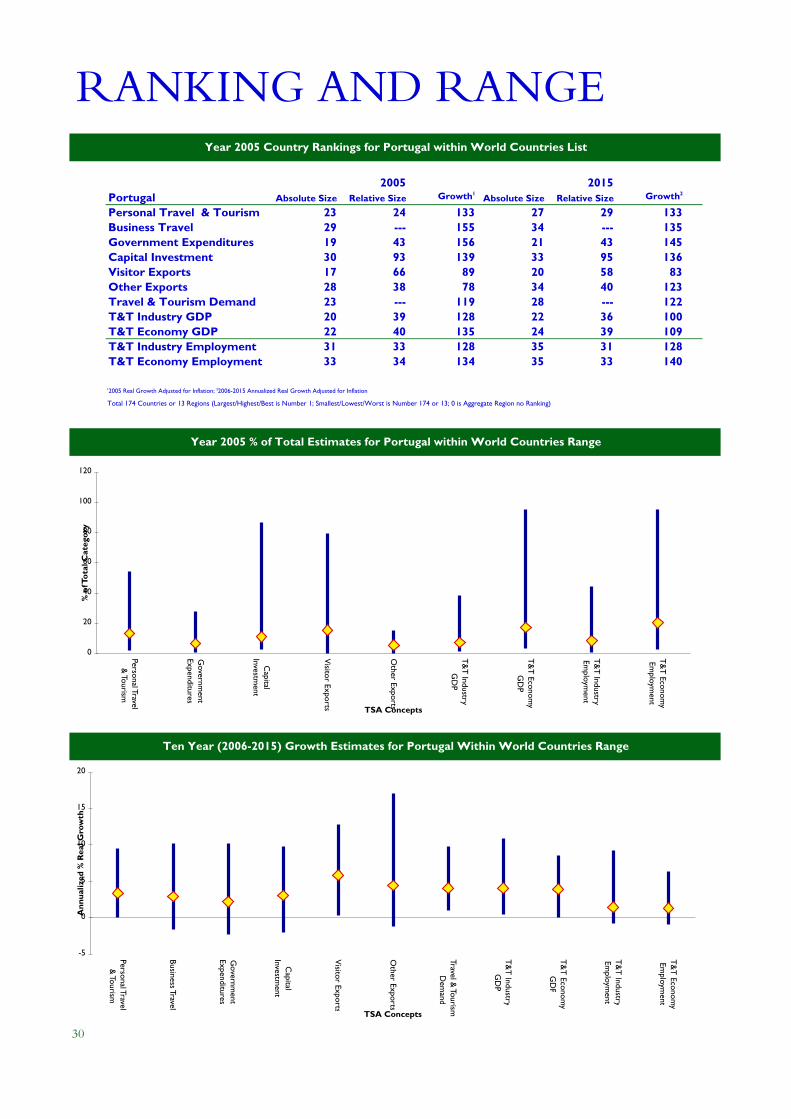
2005 2015Portugal Absolute Size Relative Size Growth1
Absolute Size Relative Size Growth2
Personal Travel & Tourism 23 24 133 27 29 133Business Travel 29 --- 155 34 --- 135Government Expenditures 19 43 156 21 43 145Capital Investment 30 93 139 33 95 136Visitor Exports 17 66 89 20 58 83Other Exports 28 38 78 34 40 123Travel & Tourism Demand 23 --- 119 28 --- 122T&T Industry GDP 20 39 128 22 36 100T&T Economy GDP 22 40 135 24 39 109T&T Industry Employment 31 33 128 35 31 128T&T Economy Employment 33 34 134 35 33 140
12005 Real Growth Adjusted for Inflation; 22006-2015 Annualized Real Growth Adjusted for Inflation
Total 174 Countries or 13 Regions (Largest/Highest/Best is Number 1; Smallest/Lowest/Worst is Number 174 or 13; 0 is Aggregate Region no Ranking)
30
Year 2005 Country Rankings for Portugal within World Countries List
Year 2005 % of Total Estimates for Portugal within World Countries Range
Ten Year (2006-2015) Growth Estimates for Portugal Within World Countries Range
0
20
40
60
80
100
120
Personal Travel &
Tourism
Governm
entExpenditures
Capital
Investment
Visitor Exports
Other Exports
T&T IndustryG
DP
T&T Econom
yG
DP
T&T Industry
Employm
ent
T&T Econom
yEm
ployment
TSA Concepts
% o
f Tot
al C
ateg
ory
-5
0
5
10
15
20
Personal Travel &
Tourism
Business Travel
Governm
entExpenditures
Capital
Investment
Visitor Exports
Other Exports
Travel & Tourism
Dem
and
T&T IndustryG
DP
T&T Econom
yG
DP
T&T Industry
Employm
ent
T&T Econom
yEm
ployment
TSA Concepts
Ann
ualiz
ed %
Rea
l Gro
wth
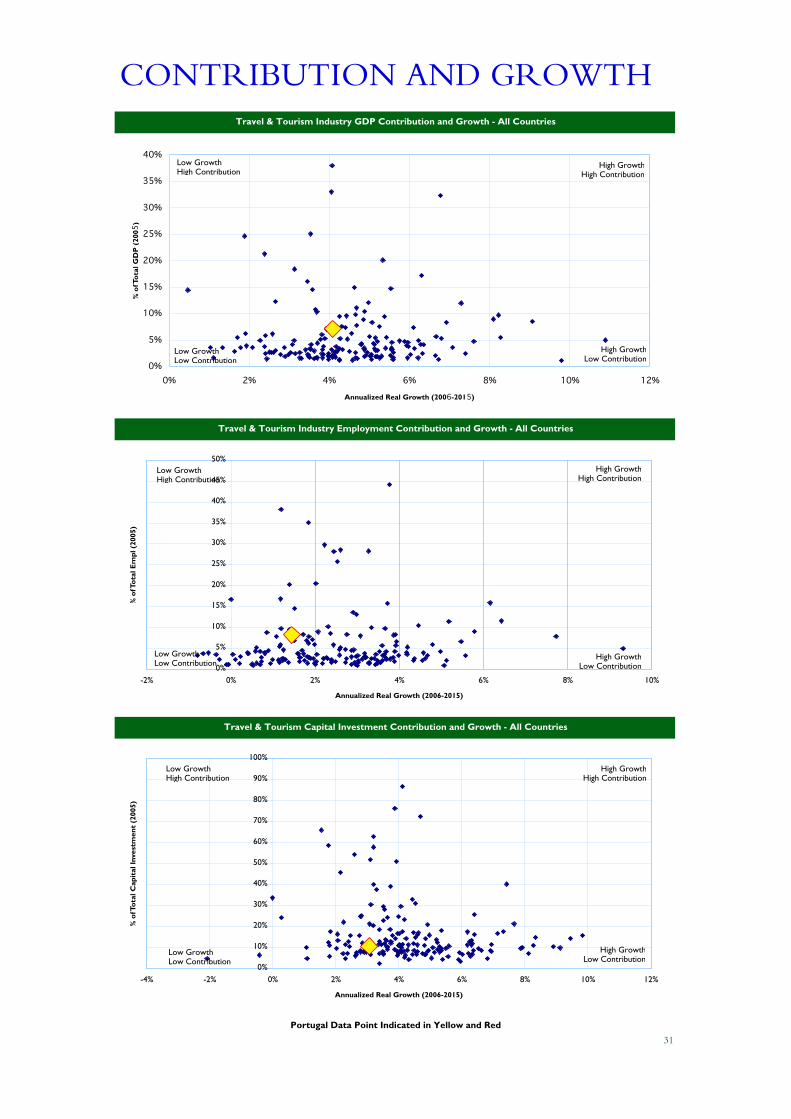
CONTRIBUTION AND GROWTHTravel & Tourism Industry GDP Contribution and Growth - All Countries
Travel & Tourism Industry Employment Contribution and Growth - All Countries
Travel & Tourism Capital Investment Contribution and Growth - All Countries
Portugal Data Point Indicated in Yellow and Red
31
0%
5%
10%
15%
20%
25%
30%
35%
40%
0% 2% 4% 6% 8% 10% 12%
Annualized Real Growth (2006-2015)
% o
f Tot
al G
DP
(20
05)
0%
5%
10%
15%
20%
25%
30%
35%
40%
45%
50%
-2% 0% 2% 4% 6% 8% 10%
Annualized Real Growth (2006-2015)
% o
f Tot
al E
mpl
(20
05)
High GrowthHigh Contribution
High GrowthLow Contribution
0%
10%
20%
30%
40%
50%
60%
70%
80%
90%
100%
-4% -2% 0% 2% 4% 6% 8% 10% 12%
Annualized Real Growth (2006-2015)
% o
f Tot
al C
apit
al In
vest
men
t (2
005)
Low GrowthLow Contribution
Low GrowthHigh Contribution
High GrowthLow Contribution
High GrowthHigh Contribution
Low GrowthHigh Contribution
Low GrowthLow Contribution
Low GrowthHigh Contribution
High GrowthHigh Contribution
High GrowthLow Contribution
Low GrowthLow Contribution
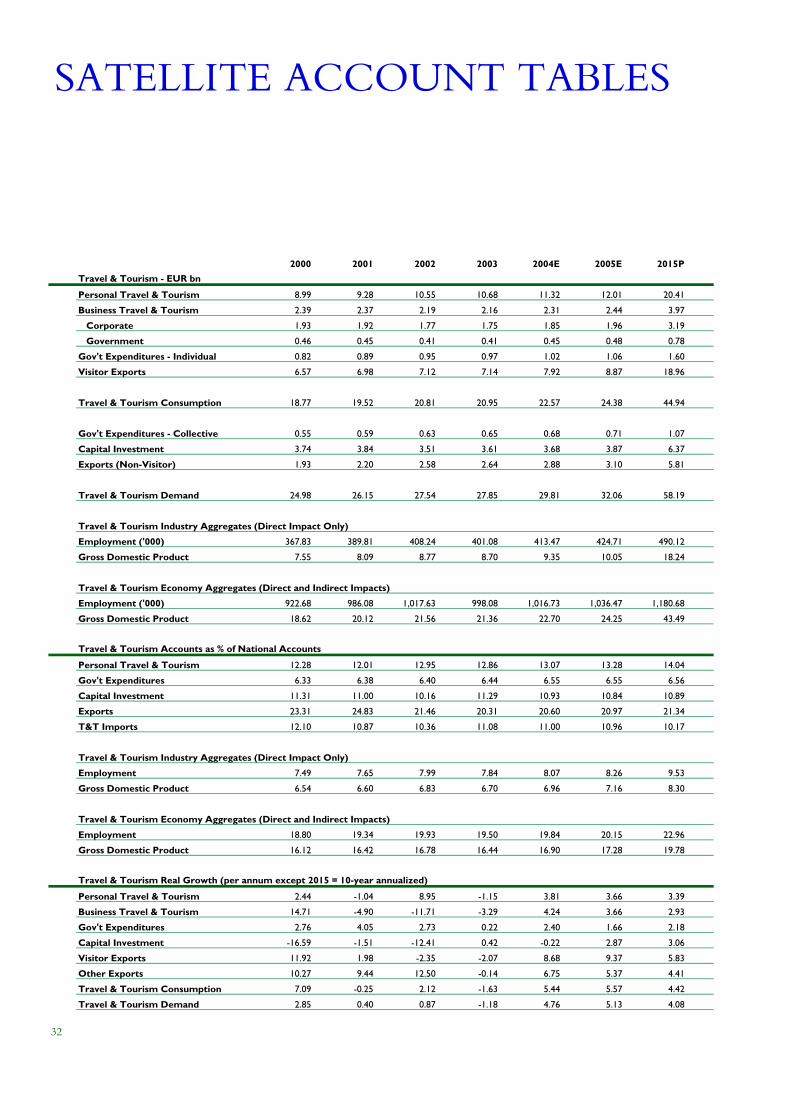
2000 2001 2002 2003 2004E 2005E 2015PTravel & Tourism - EUR bn
Personal Travel & Tourism 8.99 9.28 10.55 10.68 11.32 12.01 20.41
Business Travel & Tourism 2.39 2.37 2.19 2.16 2.31 2.44 3.97
Corporate 1.93 1.92 1.77 1.75 1.85 1.96 3.19
Government 0.46 0.45 0.41 0.41 0.45 0.48 0.78
Gov't Expenditures - Individual 0.82 0.89 0.95 0.97 1.02 1.06 1.60
Visitor Exports 6.57 6.98 7.12 7.14 7.92 8.87 18.96
Travel & Tourism Consumption 18.77 19.52 20.81 20.95 22.57 24.38 44.94
Gov't Expenditures - Collective 0.55 0.59 0.63 0.65 0.68 0.71 1.07
Capital Investment 3.74 3.84 3.51 3.61 3.68 3.87 6.37
Exports (Non-Visitor) 1.93 2.20 2.58 2.64 2.88 3.10 5.81
Travel & Tourism Demand 24.98 26.15 27.54 27.85 29.81 32.06 58.19
Travel & Tourism Industry Aggregates (Direct Impact Only)
Employment ('000) 367.83 389.81 408.24 401.08 413.47 424.71 490.12
Gross Domestic Product 7.55 8.09 8.77 8.70 9.35 10.05 18.24
Travel & Tourism Economy Aggregates (Direct and Indirect Impacts)
Employment ('000) 922.68 986.08 1,017.63 998.08 1,016.73 1,036.47 1,180.68
Gross Domestic Product 18.62 20.12 21.56 21.36 22.70 24.25 43.49
Travel & Tourism Accounts as % of National Accounts
Personal Travel & Tourism 12.28 12.01 12.95 12.86 13.07 13.28 14.04
Gov't Expenditures 6.33 6.38 6.40 6.44 6.55 6.55 6.56
Capital Investment 11.31 11.00 10.16 11.29 10.93 10.84 10.89
Exports 23.31 24.83 21.46 20.31 20.60 20.97 21.34
T&T Imports 12.10 10.87 10.36 11.08 11.00 10.96 10.17
Travel & Tourism Industry Aggregates (Direct Impact Only)
Employment 7.49 7.65 7.99 7.84 8.07 8.26 9.53
Gross Domestic Product 6.54 6.60 6.83 6.70 6.96 7.16 8.30
Travel & Tourism Economy Aggregates (Direct and Indirect Impacts)
Employment 18.80 19.34 19.93 19.50 19.84 20.15 22.96
Gross Domestic Product 16.12 16.42 16.78 16.44 16.90 17.28 19.78
Travel & Tourism Real Growth (per annum except 2015 = 10-year annualized)
Personal Travel & Tourism 2.44 -1.04 8.95 -1.15 3.81 3.66 3.39
Business Travel & Tourism 14.71 -4.90 -11.71 -3.29 4.24 3.66 2.93
Gov't Expenditures 2.76 4.05 2.73 0.22 2.40 1.66 2.18
Capital Investment -16.59 -1.51 -12.41 0.42 -0.22 2.87 3.06
Visitor Exports 11.92 1.98 -2.35 -2.07 8.68 9.37 5.83
Other Exports 10.27 9.44 12.50 -0.14 6.75 5.37 4.41
Travel & Tourism Consumption 7.09 -0.25 2.12 -1.63 5.44 5.57 4.42
Travel & Tourism Demand 2.85 0.40 0.87 -1.18 4.76 5.13 4.08
32
SATELLITE ACCOUNT TABLES
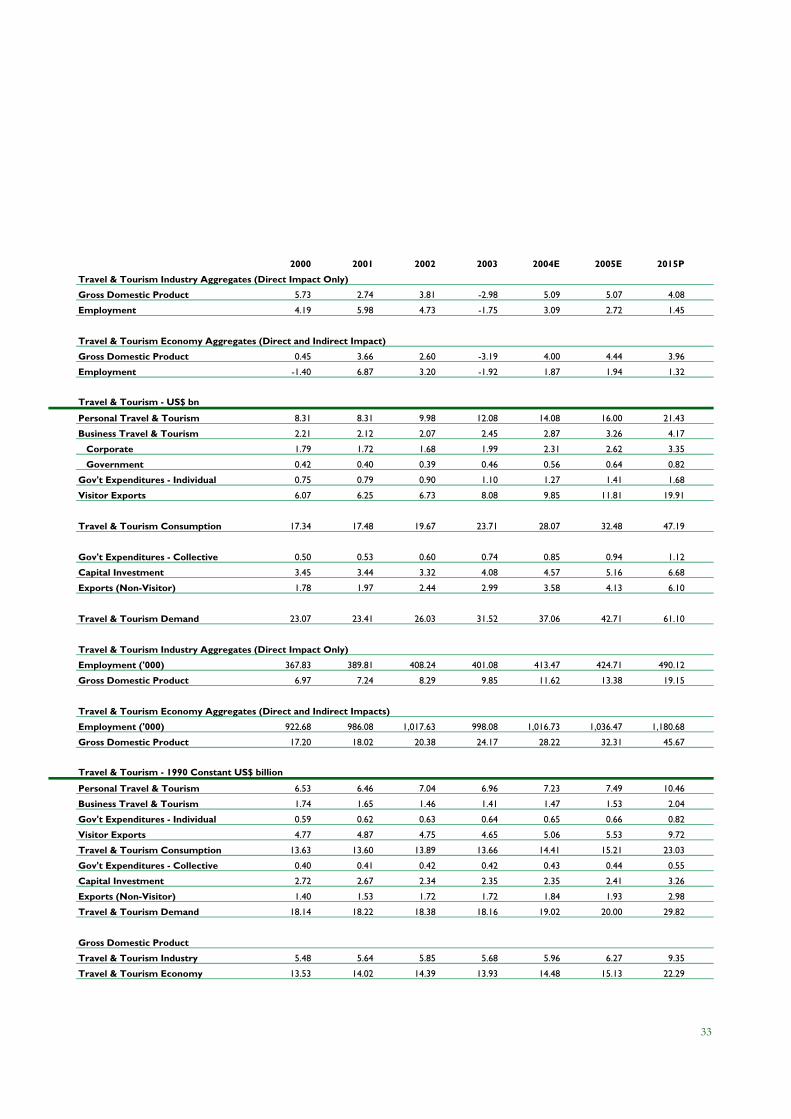
2000 2001 2002 2003 2004E 2005E 2015P
Travel & Tourism Industry Aggregates (Direct Impact Only)
Gross Domestic Product 5.73 2.74 3.81 -2.98 5.09 5.07 4.08
Employment 4.19 5.98 4.73 -1.75 3.09 2.72 1.45
Travel & Tourism Economy Aggregates (Direct and Indirect Impact)
Gross Domestic Product 0.45 3.66 2.60 -3.19 4.00 4.44 3.96
Employment -1.40 6.87 3.20 -1.92 1.87 1.94 1.32
Travel & Tourism - US$ bn
Personal Travel & Tourism 8.31 8.31 9.98 12.08 14.08 16.00 21.43
Business Travel & Tourism 2.21 2.12 2.07 2.45 2.87 3.26 4.17
Corporate 1.79 1.72 1.68 1.99 2.31 2.62 3.35
Government 0.42 0.40 0.39 0.46 0.56 0.64 0.82
Gov't Expenditures - Individual 0.75 0.79 0.90 1.10 1.27 1.41 1.68
Visitor Exports 6.07 6.25 6.73 8.08 9.85 11.81 19.91
Travel & Tourism Consumption 17.34 17.48 19.67 23.71 28.07 32.48 47.19
Gov't Expenditures - Collective 0.50 0.53 0.60 0.74 0.85 0.94 1.12
Capital Investment 3.45 3.44 3.32 4.08 4.57 5.16 6.68
Exports (Non-Visitor) 1.78 1.97 2.44 2.99 3.58 4.13 6.10
Travel & Tourism Demand 23.07 23.41 26.03 31.52 37.06 42.71 61.10
Travel & Tourism Industry Aggregates (Direct Impact Only)
Employment ('000) 367.83 389.81 408.24 401.08 413.47 424.71 490.12
Gross Domestic Product 6.97 7.24 8.29 9.85 11.62 13.38 19.15
Travel & Tourism Economy Aggregates (Direct and Indirect Impacts)
Employment ('000) 922.68 986.08 1,017.63 998.08 1,016.73 1,036.47 1,180.68
Gross Domestic Product 17.20 18.02 20.38 24.17 28.22 32.31 45.67
Travel & Tourism - 1990 Constant US$ billion
Personal Travel & Tourism 6.53 6.46 7.04 6.96 7.23 7.49 10.46
Business Travel & Tourism 1.74 1.65 1.46 1.41 1.47 1.53 2.04
Gov't Expenditures - Individual 0.59 0.62 0.63 0.64 0.65 0.66 0.82
Visitor Exports 4.77 4.87 4.75 4.65 5.06 5.53 9.72
Travel & Tourism Consumption 13.63 13.60 13.89 13.66 14.41 15.21 23.03
Gov't Expenditures - Collective 0.40 0.41 0.42 0.42 0.43 0.44 0.55
Capital Investment 2.72 2.67 2.34 2.35 2.35 2.41 3.26
Exports (Non-Visitor) 1.40 1.53 1.72 1.72 1.84 1.93 2.98
Travel & Tourism Demand 18.14 18.22 18.38 18.16 19.02 20.00 29.82
Gross Domestic Product
Travel & Tourism Industry 5.48 5.64 5.85 5.68 5.96 6.27 9.35
Travel & Tourism Economy 13.53 14.02 14.39 13.93 14.48 15.13 22.29
33
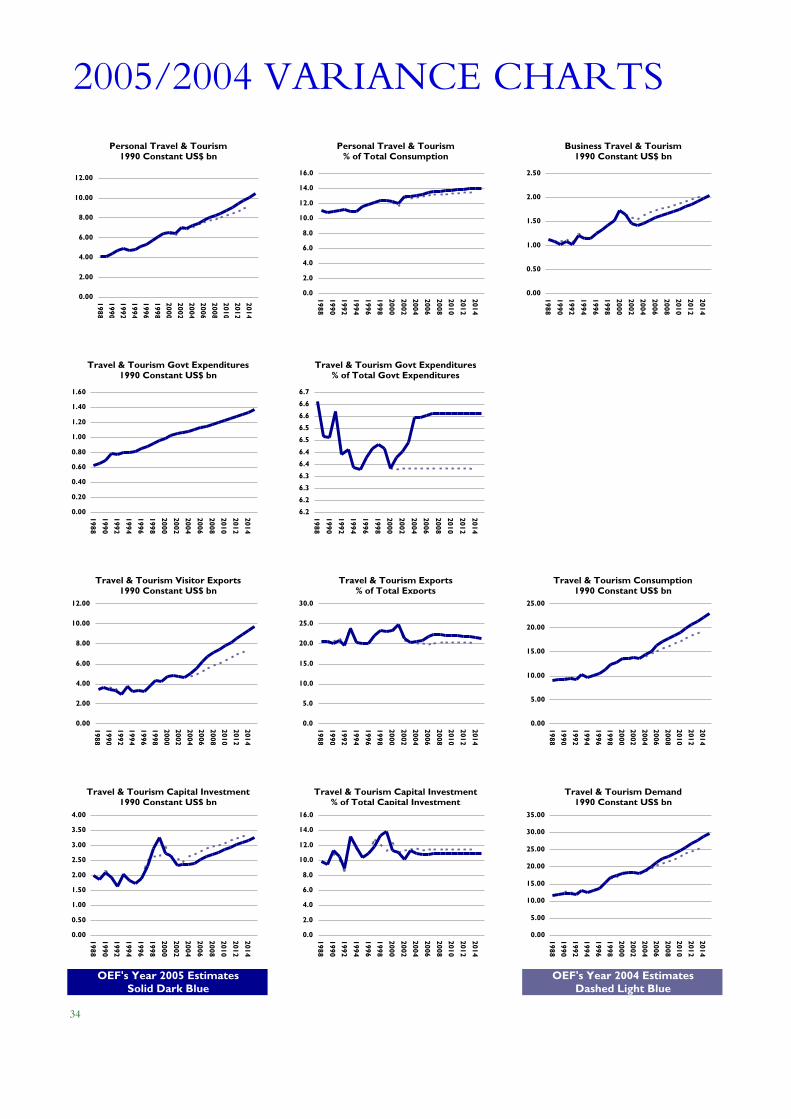
2005/2004 VARIANCE CHARTSPersonal Travel & Tourism
1990 Constant US$ bnPersonal Travel & Tourism
% of Total ConsumptionBusiness Travel & Tourism
1990 Constant US$ bn
Travel & Tourism Govt Expenditures1990 Constant US$ bn
Travel & Tourism Govt Expenditures% of Total Govt Expenditures
Travel & Tourism Visitor Exports1990 Constant US$ bn
Travel & Tourism Exports% of Total Exports
Travel & Tourism Consumption1990 Constant US$ bn
Travel & Tourism Capital Investment1990 Constant US$ bn
Travel & Tourism Capital Investment% of Total Capital Investment
Travel & Tourism Demand1990 Constant US$ bn
OEF's Year 2005 Estimates OEF's Year 2004 EstimatesSolid Dark Blue Dashed Light Blue
34
0.00
2.00
4.00
6.00
8.00
10.00
12.00
19881990199219941996199820002002200420062008201020122014
0.0
2.0
4.0
6.0
8.0
10.0
12.0
14.0
16.0
1988
1990
1992
1994
1996
1998
2000
2002
2004
2006
2008
2010
2012
2014
0.00
0.50
1.00
1.50
2.00
2.50
1988
1990
1992
1994
1996
1998
2000
2002
2004
2006
2008
2010
2012
2014
0.00
0.20
0.40
0.60
0.80
1.00
1.20
1.40
1.60
1988
1990
1992
1994
1996
1998
2000
2002
2004
2006
2008
2010
2012
2014
6.2
6.2
6.3
6.3
6.4
6.4
6.5
6.5
6.6
6.6
6.7
1988
1990
1992
1994
1996
1998
2000
2002
2004
2006
2008
2010
2012
2014
0.00
5.00
10.00
15.00
20.00
25.00
30.00
35.00
19881990
19921994
19961998
20002002
20042006
20082010
20122014
0.0
2.0
4.0
6.0
8.0
10.0
12.0
14.0
16.0
1988
1990
1992
1994
1996
1998
2000
2002
2004
2006
2008
2010
2012
2014
0.00
0.50
1.00
1.50
2.00
2.50
3.00
3.50
4.00
1988
1990
1992
1994
1996
1998
2000
2002
2004
2006
2008
2010
2012
2014
0.00
2.00
4.00
6.00
8.00
10.00
12.00
19881990
19921994
19961998
20002002
20042006
20082010
20122014
0.0
5.0
10.0
15.0
20.0
25.0
30.0
1988
1990
1992
1994
1996
1998
2000
2002
2004
2006
2008
2010
2012
2014
0.00
5.00
10.00
15.00
20.00
25.00
19881990
19921994
19961998
20002002
20042006
20082010
20122014
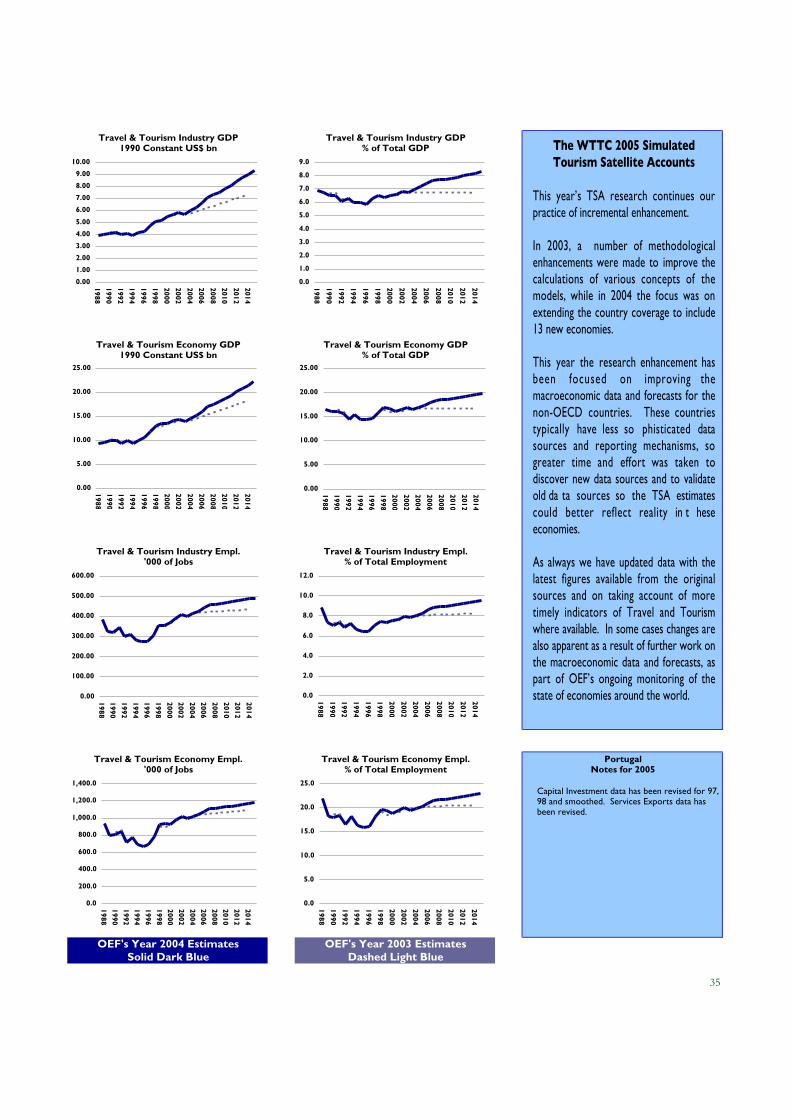
Travel & Tourism Industry GDP1990 Constant US$ bn
Travel & Tourism Industry GDP% of Total GDP
Travel & Tourism Economy GDP1990 Constant US$ bn
Travel & Tourism Economy GDP% of Total GDP
Travel & Tourism Industry Empl.'000 of Jobs
Travel & Tourism Industry Empl.% of Total Employment
Travel & Tourism Economy Empl.'000 of Jobs
Travel & Tourism Economy Empl.% of Total Employment
PortugalNotes for 2005
Capital Investment data has been revised for 97, 98 and smoothed. Services Exports data has been revised.
OEF's Year 2004 Estimates OEF's Year 2003 EstimatesSolid Dark Blue Dashed Light Blue
35
0.00
1.00
2.00
3.00
4.00
5.00
6.00
7.00
8.00
9.00
10.00
19881990
19921994
19961998
20002002
20042006
20082010
20122014
0.00
5.00
10.00
15.00
20.00
25.00
1988199019921994
1996199820002002
20042006200820102012
2014
0.0
1.0
2.0
3.0
4.0
5.0
6.0
7.0
8.0
9.0
1988
1990
1992
1994
1996
1998
2000
2002
2004
2006
2008
2010
2012
2014
0.0
2.0
4.0
6.0
8.0
10.0
12.0
1988
1990
1992
1994
1996
1998
2000
2002
2004
2006
2008
2010
2012
2014
0.0
200.0
400.0
600.0
800.0
1,000.0
1,200.0
1,400.0
19881990199219941996199820002002200420062008201020122014
0.0
5.0
10.0
15.0
20.0
25.0
1988
1990
1992
1994
1996
1998
2000
2002
2004
2006
2008
2010
2012
2014
0.00
100.00
200.00
300.00
400.00
500.00
600.00
19881990199219941996199820002002200420062008201020122014
0.00
5.00
10.00
15.00
20.00
25.00
19881990
1992
19941996
19982000
20022004
2006
20082010
20122014
The WTTC 2005 SimulatedTourism Satellite Accounts
This year’s TSA research continues ourpractice of incremental enhancement.
In 2003, a number of methodologicalenhancements were made to improve thecalculations of various concepts of themodels, while in 2004 the focus was onextending the country coverage to include13 new economies.
This year the research enhancement hasbeen focused on improving themacroeconomic data and forecasts for thenon-OECD countries. These countriestypically have less so phisticated datasources and reporting mechanisms, sogreater time and effort was taken todiscover new data sources and to validateold da ta sources so the TSA estimatescould better reflect reality in t heseeconomies.
As always we have updated data with thelatest figures available from the originalsources and on taking account of moretimely indicators of Travel and Tourismwhere available. In some cases changes arealso apparent as a result of further work onthe macroeconomic data and forecasts, aspart of OEF’s ongoing monitoring of thestate of economies around the world.
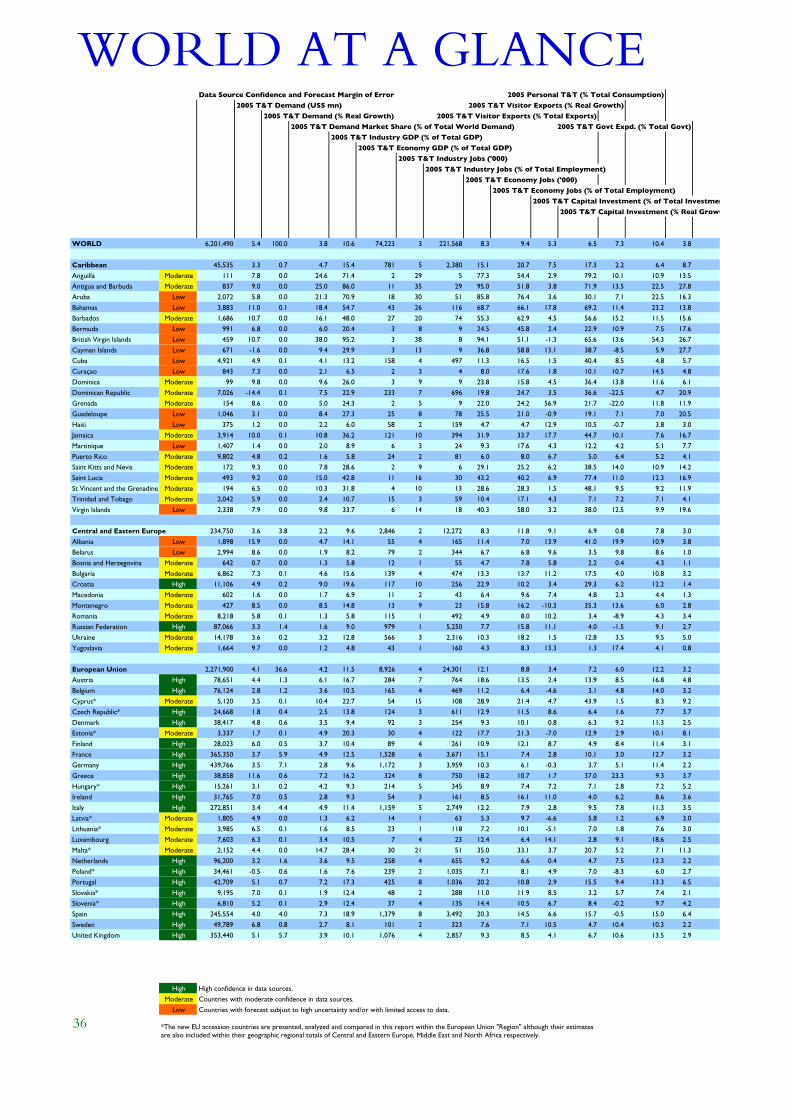
WORLD AT A GLANCEData Source Confidence and Forecast Margin of Error 2005 Personal T&T (% Total Consumption)
2005 T&T Demand (US$ mn) 2005 T&T Visitor Exports (% Real Growth)
2005 T&T Demand (% Real Growth) 2005 T&T Visitor Exports (% Total Exports)
2005 T&T Demand Market Share (% of Total World Demand) 2005 T&T Govt Expd. (% Total Govt)
2005 T&T Industry GDP (% of Total GDP)
2005 T&T Economy GDP (% of Total GDP)
2005 T&T Industry Jobs ('000)
2005 T&T Industry Jobs (% of Total Employment)
2005 T&T Economy Jobs ('000)
2005 T&T Economy Jobs (% of Total Employment)
2005 T&T Capital Investment (% of Total Investment)
2005 T&T Capital Investment (% Real Growth)
WORLD 6,201,490 5.4 100.0 3.8 10.6 74,223 3 221,568 8.3 9.4 5.3 6.5 7.3 10.4 3.8
Caribbean 45,535 3.3 0.7 4.7 15.4 781 5 2,380 15.1 20.7 7.5 17.3 2.2 6.4 8.7Anguilla Moderate 111 7.8 0.0 24.6 71.4 2 29 5 77.3 54.4 2.9 79.2 10.1 10.9 13.5Antigua and Barbuda Moderate 837 9.0 0.0 25.0 86.0 11 35 29 95.0 51.8 3.8 71.9 13.5 22.5 27.8Aruba Low 2,072 5.8 0.0 21.3 70.9 18 30 51 85.8 76.4 3.6 30.1 7.1 22.5 16.3Bahamas Low 3,883 11.0 0.1 18.4 54.7 43 26 116 68.7 66.1 17.8 69.2 11.4 23.2 13.8Barbados Moderate 1,686 10.7 0.0 16.1 48.0 27 20 74 55.3 62.9 4.5 56.6 15.2 11.5 15.6Bermuda Low 991 6.8 0.0 6.0 20.4 3 8 9 24.5 45.8 2.4 22.9 10.9 7.5 17.6British Virgin Islands Low 459 10.7 0.0 38.0 95.2 3 38 8 94.1 51.1 -1.3 65.6 13.6 54.3 26.7Cayman Islands Low 671 -1.6 0.0 9.4 29.9 3 13 9 36.8 58.8 13.1 38.7 -8.5 5.9 27.7Cuba Low 4,921 4.9 0.1 4.1 13.2 158 4 497 11.3 16.5 1.5 40.4 8.5 4.8 5.7Curaçao Low 843 7.3 0.0 2.1 6.5 2 3 4 8.0 17.6 1.8 10.1 10.7 14.5 4.8Dominica Moderate 99 9.8 0.0 9.6 26.0 3 9 9 23.8 15.8 4.5 36.4 13.8 11.6 6.1Dominican Republic Moderate 7,026 -14.4 0.1 7.5 22.9 233 7 696 19.8 24.7 3.5 36.6 -22.5 4.7 20.9Grenada Moderate 154 8.6 0.0 5.0 24.3 2 5 9 22.0 24.2 56.9 21.7 -22.0 11.8 11.9Guadeloupe Low 1,046 3.1 0.0 8.4 27.3 25 8 78 25.5 21.0 -0.9 19.1 7.1 7.0 20.5Haiti Low 375 1.2 0.0 2.2 6.0 58 2 159 4.7 4.7 12.9 10.5 -0.7 3.8 3.0Jamaica Moderate 3,914 10.0 0.1 10.8 36.2 121 10 394 31.9 33.7 17.7 44.7 10.1 7.6 16.7Martinique Low 1,407 1.4 0.0 2.0 8.9 6 3 24 9.3 17.6 4.3 12.2 4.2 5.1 7.7Puerto Rico Moderate 9,802 4.8 0.2 1.6 5.8 24 2 81 6.0 8.0 6.7 5.0 6.4 5.2 4.1Saint Kitts and Nevis Moderate 172 9.3 0.0 7.8 28.6 2 9 6 29.1 25.2 6.2 38.5 14.0 10.9 14.2Saint Lucia Moderate 493 9.2 0.0 15.0 42.8 11 16 30 43.2 40.2 6.9 77.4 11.0 12.3 16.9St Vincent and the Grenadines Moderate 194 6.5 0.0 10.3 31.8 4 10 13 28.6 28.3 1.5 48.1 9.5 9.2 11.9Trinidad and Tobago Moderate 2,042 5.9 0.0 2.4 10.7 15 3 59 10.4 17.1 4.3 7.1 7.2 7.1 4.1Virgin Islands Low 2,338 7.9 0.0 9.8 33.7 6 14 18 40.3 58.0 3.2 38.0 12.5 9.9 19.6
Central and Eastern Europe 234,750 3.6 3.8 2.2 9.6 2,846 2 12,272 8.3 11.8 9.1 6.9 0.8 7.8 3.0Albania Low 1,898 15.9 0.0 4.7 14.1 55 4 165 11.4 7.0 13.9 41.0 19.9 10.9 3.8Belarus Low 2,994 8.6 0.0 1.9 8.2 79 2 344 6.7 6.8 9.6 3.5 9.8 8.6 1.0Bosnia and Herzegovina Moderate 642 0.7 0.0 1.3 5.8 12 1 55 4.7 7.8 5.8 2.2 0.4 4.3 1.1Bulgaria Moderate 6,862 7.3 0.1 4.6 15.6 139 4 474 13.3 13.7 11.2 17.5 4.0 10.8 3.2Croatia High 11,106 4.9 0.2 9.0 19.6 117 10 256 22.9 10.2 3.4 29.3 6.2 12.2 1.4Macedonia Moderate 602 1.6 0.0 1.7 6.9 11 2 43 6.4 9.6 7.4 4.8 2.3 4.4 1.3Montenegro Moderate 427 8.5 0.0 8.5 14.8 13 9 23 15.8 16.2 -10.3 35.3 13.6 6.0 2.8Romania Moderate 8,218 5.8 0.1 1.3 5.8 115 1 492 4.9 8.0 10.2 3.4 -8.9 4.3 3.4Russian Federation High 87,066 3.3 1.4 1.6 9.0 979 1 5,250 7.7 15.8 11.1 4.0 -1.5 9.1 2.7Ukraine Moderate 14,178 3.6 0.2 3.2 12.8 566 3 2,316 10.3 18.2 1.5 12.8 3.5 9.5 5.0Yugoslavia Moderate 1,664 9.7 0.0 1.2 4.8 43 1 160 4.3 8.3 13.3 1.3 17.4 4.1 0.8
European Union 2,271,900 4.1 36.6 4.2 11.5 8,926 4 24,301 12.1 8.8 3.4 7.2 6.0 12.2 3.2Austria High 78,651 4.4 1.3 6.1 16.7 284 7 764 18.6 13.5 2.4 13.9 8.5 16.8 4.8Belgium High 76,124 2.8 1.2 3.6 10.5 165 4 469 11.2 6.4 -4.6 3.1 4.8 14.0 3.2Cyprus* Moderate 5,120 3.5 0.1 10.4 22.7 54 15 108 28.9 21.4 4.7 43.9 1.5 8.3 9.2Czech Republic* High 24,668 1.8 0.4 2.5 13.8 124 3 611 12.9 11.5 8.6 6.4 1.6 7.7 3.7Denmark High 38,417 4.8 0.6 3.5 9.4 92 3 254 9.3 10.1 0.8 6.3 9.2 11.3 2.5Estonia* Moderate 3,337 1.7 0.1 4.9 20.3 30 4 122 17.7 21.3 -7.0 12.9 2.9 10.1 8.1Finland High 28,023 6.0 0.5 3.7 10.4 89 4 261 10.9 12.1 8.7 4.9 8.4 11.4 3.1France High 365,350 3.7 5.9 4.9 12.5 1,528 6 3,671 15.1 7.4 2.8 10.1 3.0 12.7 3.2Germany High 439,766 3.5 7.1 2.8 9.6 1,172 3 3,959 10.3 6.1 -0.3 3.7 5.1 11.4 2.2Greece High 38,858 11.6 0.6 7.2 16.2 324 8 750 18.2 10.7 1.7 37.0 23.3 9.3 3.7Hungary* High 15,261 3.1 0.2 4.2 9.3 214 5 345 8.9 7.4 7.2 7.1 2.8 7.2 5.2Ireland High 31,765 7.0 0.5 2.8 9.3 54 3 161 8.5 16.1 11.0 4.0 6.2 8.6 3.6Italy High 272,851 3.4 4.4 4.9 11.4 1,159 5 2,749 12.2 7.9 2.8 9.5 7.8 11.3 3.5Latvia* Moderate 1,805 4.9 0.0 1.3 6.2 14 1 63 5.3 9.7 -6.6 5.8 1.2 6.9 3.0Lithuania* Moderate 3,985 6.5 0.1 1.6 8.5 23 1 118 7.2 10.1 -5.1 7.0 1.8 7.6 3.0Luxembourg Moderate 7,603 6.3 0.1 3.4 10.5 7 4 23 12.4 6.4 14.1 2.8 9.1 18.6 2.5Malta* Moderate 2,152 4.4 0.0 14.7 28.4 30 21 51 35.0 33.1 3.7 20.7 5.2 7.1 11.3Netherlands High 96,200 3.2 1.6 3.6 9.5 258 4 655 9.2 6.6 0.4 4.7 7.5 12.3 2.2Poland* High 34,461 -0.5 0.6 1.6 7.6 239 2 1,035 7.1 8.1 4.9 7.0 -8.3 6.0 2.7Portugal High 42,709 5.1 0.7 7.2 17.3 425 8 1,036 20.2 10.8 2.9 15.5 9.4 13.3 6.5Slovakia* High 9,195 7.0 0.1 1.9 12.4 48 2 288 11.0 11.9 8.5 3.2 5.7 7.4 2.1Slovenia* High 6,810 5.2 0.1 2.9 12.4 37 4 135 14.4 10.5 6.7 8.4 -0.2 9.7 4.2Spain High 245,554 4.0 4.0 7.3 18.9 1,379 8 3,492 20.3 14.5 6.6 15.7 -0.5 15.0 6.4Sweden High 49,789 6.8 0.8 2.7 8.1 101 2 323 7.6 7.1 10.5 4.7 10.4 10.3 2.2United Kingdom High 353,440 5.1 5.7 3.9 10.1 1,076 4 2,857 9.3 8.5 4.1 6.7 10.6 13.5 2.9
High High confidence in data sources.Moderate Countries with moderate confidence in data sources.
Low Countries with forecast subjust to high uncertainty and/or with limited access to data.
36 *The new EU accession countries are presented, analyzed and compared in this report within the European Union "Region" although their estimates are also included within their geographic regional totals of Central and Eastern Europe, Middle East and North Africa respectively.
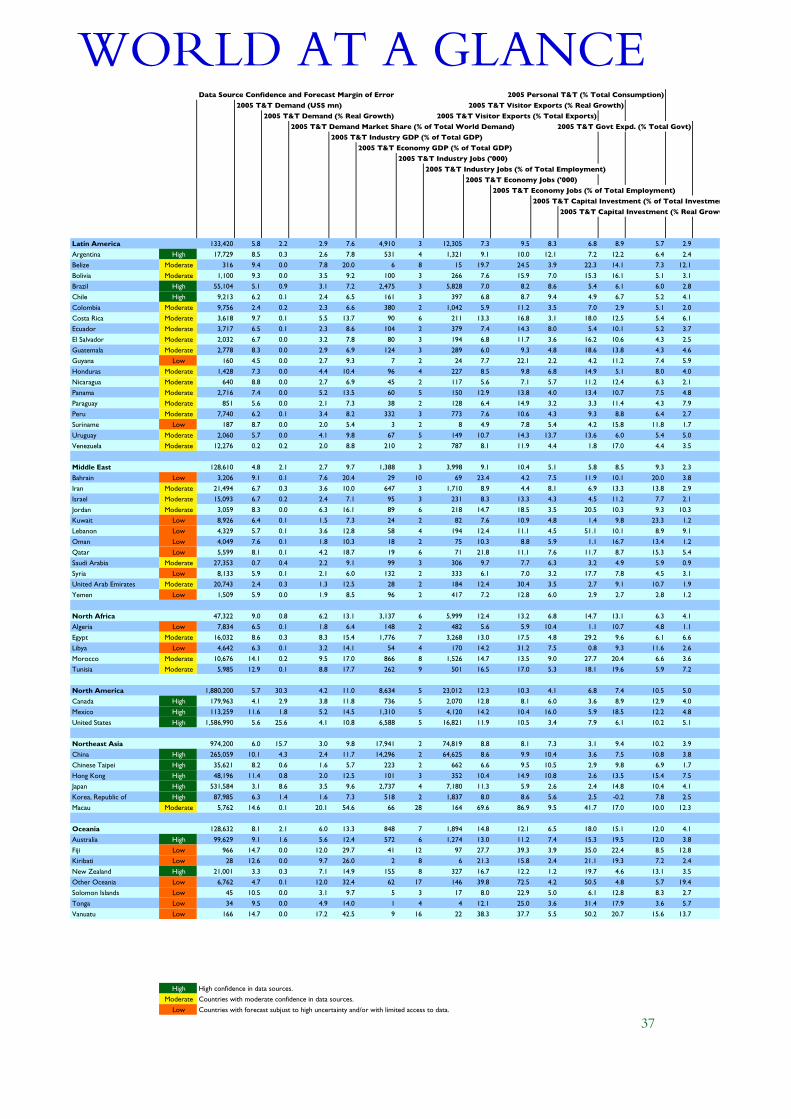
WORLD AT A GLANCEData Source Confidence and Forecast Margin of Error 2005 Personal T&T (% Total Consumption)
2005 T&T Demand (US$ mn) 2005 T&T Visitor Exports (% Real Growth)
2005 T&T Demand (% Real Growth) 2005 T&T Visitor Exports (% Total Exports)
2005 T&T Demand Market Share (% of Total World Demand) 2005 T&T Govt Expd. (% Total Govt)
2005 T&T Industry GDP (% of Total GDP)
2005 T&T Economy GDP (% of Total GDP)
2005 T&T Industry Jobs ('000)
2005 T&T Industry Jobs (% of Total Employment)
2005 T&T Economy Jobs ('000)
2005 T&T Economy Jobs (% of Total Employment)
2005 T&T Capital Investment (% of Total Investment)
2005 T&T Capital Investment (% Real Growth)
Latin America 133,420 5.8 2.2 2.9 7.6 4,910 3 12,305 7.3 9.5 8.3 6.8 8.9 5.7 2.9Argentina High 17,729 8.5 0.3 2.6 7.8 531 4 1,321 9.1 10.0 12.1 7.2 12.2 6.4 2.4Belize Moderate 316 9.4 0.0 7.8 20.0 6 8 15 19.7 24.5 3.9 22.3 14.1 7.3 12.1Bolivia Moderate 1,100 9.3 0.0 3.5 9.2 100 3 266 7.6 15.9 7.0 15.3 16.1 5.1 3.1Brazil High 55,104 5.1 0.9 3.1 7.2 2,475 3 5,828 7.0 8.2 8.6 5.4 6.1 6.0 2.8Chile High 9,213 6.2 0.1 2.4 6.5 161 3 397 6.8 8.7 9.4 4.9 6.7 5.2 4.1Colombia Moderate 9,756 2.4 0.2 2.3 6.6 380 2 1,042 5.9 11.2 3.5 7.0 2.9 5.1 2.0Costa Rica Moderate 3,618 9.7 0.1 5.5 13.7 90 6 211 13.3 16.8 3.1 18.0 12.5 5.4 6.1Ecuador Moderate 3,717 6.5 0.1 2.3 8.6 104 2 379 7.4 14.3 8.0 5.4 10.1 5.2 3.7El Salvador Moderate 2,032 6.7 0.0 3.2 7.8 80 3 194 6.8 11.7 3.6 16.2 10.6 4.3 2.5Guatemala Moderate 2,778 8.3 0.0 2.9 6.9 124 3 289 6.0 9.3 4.8 18.6 13.8 4.3 4.6Guyana Low 160 4.5 0.0 2.7 9.3 7 2 24 7.7 22.1 2.2 4.2 11.2 7.4 5.9Honduras Moderate 1,428 7.3 0.0 4.4 10.4 96 4 227 8.5 9.8 6.8 14.9 5.1 8.0 4.0Nicaragua Moderate 640 8.8 0.0 2.7 6.9 45 2 117 5.6 7.1 5.7 11.2 12.4 6.3 2.1Panama Moderate 2,716 7.4 0.0 5.2 13.5 60 5 150 12.9 13.8 4.0 13.4 10.7 7.5 4.8Paraguay Moderate 851 5.6 0.0 2.1 7.3 38 2 128 6.4 14.9 3.2 3.3 11.4 4.3 7.9Peru Moderate 7,740 6.2 0.1 3.4 8.2 332 3 773 7.6 10.6 4.3 9.3 8.8 6.4 2.7Suriname Low 187 8.7 0.0 2.0 5.4 3 2 8 4.9 7.8 5.4 4.2 15.8 11.8 1.7Uruguay Moderate 2,060 5.7 0.0 4.1 9.8 67 5 149 10.7 14.3 13.7 13.6 6.0 5.4 5.0Venezuela Moderate 12,276 0.2 0.2 2.0 8.8 210 2 787 8.1 11.9 4.4 1.8 17.0 4.4 3.5
Middle East 128,610 4.8 2.1 2.7 9.7 1,388 3 3,998 9.1 10.4 5.1 5.8 8.5 9.3 2.3Bahrain Low 3,206 9.1 0.1 7.6 20.4 29 10 69 23.4 4.2 7.5 11.9 10.1 20.0 3.8Iran Moderate 21,494 6.7 0.3 3.6 10.0 647 3 1,710 8.9 4.4 8.1 6.9 13.3 13.8 2.9Israel Moderate 15,093 6.7 0.2 2.4 7.1 95 3 231 8.3 13.3 4.3 4.5 11.2 7.7 2.1Jordan Moderate 3,059 8.3 0.0 6.3 16.1 89 6 218 14.7 18.5 3.5 20.5 10.3 9.3 10.3Kuwait Low 8,926 6.4 0.1 1.5 7.3 24 2 82 7.6 10.9 4.8 1.4 9.8 23.3 1.2Lebanon Low 4,329 5.7 0.1 3.6 12.8 58 4 194 12.4 11.1 4.5 51.1 10.1 8.9 9.1Oman Low 4,049 7.6 0.1 1.8 10.3 18 2 75 10.3 8.8 5.9 1.1 16.7 13.4 1.2Qatar Low 5,599 8.1 0.1 4.2 18.7 19 6 71 21.8 11.1 7.6 11.7 8.7 15.3 5.4Saudi Arabia Moderate 27,353 0.7 0.4 2.2 9.1 99 3 306 9.7 7.7 6.3 3.2 4.9 5.9 0.9Syria Low 8,133 5.9 0.1 2.1 6.0 132 2 333 6.1 7.0 3.2 17.7 7.8 4.5 3.1United Arab Emirates Moderate 20,743 2.4 0.3 1.3 12.5 28 2 184 12.4 30.4 3.5 2.7 9.1 10.7 1.9Yemen Low 1,509 5.9 0.0 1.9 8.5 96 2 417 7.2 12.8 6.0 2.9 2.7 2.8 1.2
North Africa 47,322 9.0 0.8 6.2 13.1 3,137 6 5,999 12.4 13.2 6.8 14.7 13.1 6.3 4.1Algeria Low 7,834 6.5 0.1 1.8 6.4 148 2 482 5.6 5.9 10.4 1.1 10.7 4.8 1.1Egypt Moderate 16,032 8.6 0.3 8.3 15.4 1,776 7 3,268 13.0 17.5 4.8 29.2 9.6 6.1 6.6Libya Low 4,642 6.3 0.1 3.2 14.1 54 4 170 14.2 31.2 7.5 0.8 9.3 11.6 2.6Morocco Moderate 10,676 14.1 0.2 9.5 17.0 866 8 1,526 14.7 13.5 9.0 27.7 20.4 6.6 3.6Tunisia Moderate 5,985 12.9 0.1 8.8 17.7 262 9 501 16.5 17.0 5.3 18.1 19.6 5.9 7.2
North America 1,880,200 5.7 30.3 4.2 11.0 8,634 5 23,012 12.3 10.3 4.1 6.8 7.4 10.5 5.0Canada High 179,963 4.1 2.9 3.8 11.8 736 5 2,070 12.8 8.1 6.0 3.6 8.9 12.9 4.0Mexico High 113,259 11.6 1.8 5.2 14.5 1,310 5 4,120 14.2 10.4 16.0 5.9 18.5 12.2 4.8United States High 1,586,990 5.6 25.6 4.1 10.8 6,588 5 16,821 11.9 10.5 3.4 7.9 6.1 10.2 5.1
Northeast Asia 974,200 6.0 15.7 3.0 9.8 17,941 2 74,819 8.8 8.1 7.3 3.1 9.4 10.2 3.9China High 265,059 10.1 4.3 2.4 11.7 14,296 2 64,625 8.6 9.9 10.4 3.6 7.5 10.8 3.8Chinese Taipei High 35,621 8.2 0.6 1.6 5.7 223 2 662 6.6 9.5 10.5 2.9 9.8 6.9 1.7Hong Kong High 48,196 11.4 0.8 2.0 12.5 101 3 352 10.4 14.9 10.8 2.6 13.5 15.4 7.5Japan High 531,584 3.1 8.6 3.5 9.6 2,737 4 7,180 11.3 5.9 2.6 2.4 14.8 10.4 4.1Korea, Republic of High 87,985 6.3 1.4 1.6 7.3 518 2 1,837 8.0 8.6 5.6 2.5 -0.2 7.8 2.5Macau Moderate 5,762 14.6 0.1 20.1 54.6 66 28 164 69.6 86.9 9.5 41.7 17.0 10.0 12.3
Oceania 128,632 8.1 2.1 6.0 13.3 848 7 1,894 14.8 12.1 6.5 18.0 15.1 12.0 4.1Australia High 99,629 9.1 1.6 5.6 12.4 572 6 1,274 13.0 11.2 7.4 15.3 19.5 12.0 3.8Fiji Low 966 14.7 0.0 12.0 29.7 41 12 97 27.7 39.3 3.9 35.0 22.4 8.5 12.8Kiribati Low 28 12.6 0.0 9.7 26.0 2 8 6 21.3 15.8 2.4 21.1 19.3 7.2 2.4New Zealand High 21,001 3.3 0.3 7.1 14.9 155 8 327 16.7 12.2 1.2 19.7 4.6 13.1 3.5Other Oceania Low 6,762 4.7 0.1 12.0 32.4 62 17 146 39.8 72.5 4.2 50.5 4.8 5.7 19.4Solomon Islands Low 45 10.5 0.0 3.1 9.7 5 3 17 8.0 22.9 5.0 6.1 12.8 8.3 2.7Tonga Low 34 9.5 0.0 4.9 14.0 1 4 4 12.1 25.0 3.6 31.4 17.9 3.6 5.7Vanuatu Low 166 14.7 0.0 17.2 42.5 9 16 22 38.3 37.7 5.5 50.2 20.7 15.6 13.7
High High confidence in data sources.Moderate Countries with moderate confidence in data sources.
Low Countries with forecast subjust to high uncertainty and/or with limited access to data.
37
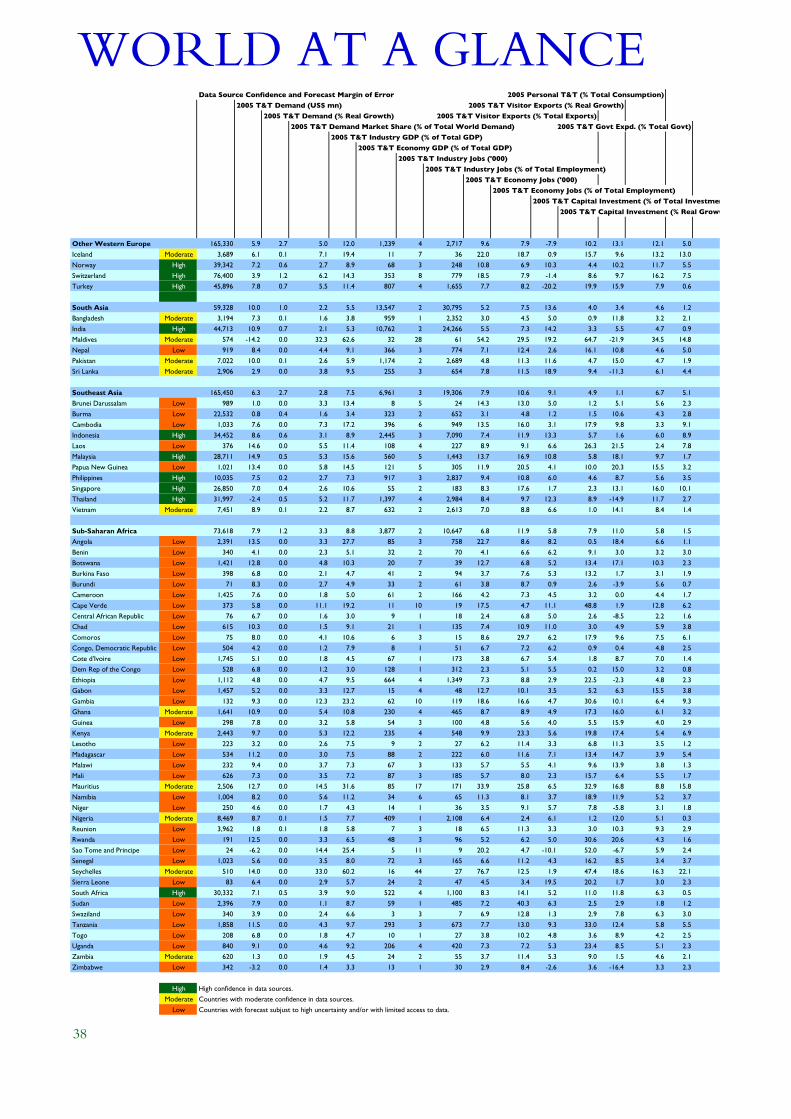
WORLD AT A GLANCEData Source Confidence and Forecast Margin of Error 2005 Personal T&T (% Total Consumption)
2005 T&T Demand (US$ mn) 2005 T&T Visitor Exports (% Real Growth)
2005 T&T Demand (% Real Growth) 2005 T&T Visitor Exports (% Total Exports)
2005 T&T Demand Market Share (% of Total World Demand) 2005 T&T Govt Expd. (% Total Govt)
2005 T&T Industry GDP (% of Total GDP)
2005 T&T Economy GDP (% of Total GDP)
2005 T&T Industry Jobs ('000)
2005 T&T Industry Jobs (% of Total Employment)
2005 T&T Economy Jobs ('000)
2005 T&T Economy Jobs (% of Total Employment)
2005 T&T Capital Investment (% of Total Investment)
2005 T&T Capital Investment (% Real Growth)
Other Western Europe 165,330 5.9 2.7 5.0 12.0 1,239 4 2,717 9.6 7.9 -7.9 10.2 13.1 12.1 5.0Iceland Moderate 3,689 6.1 0.1 7.1 19.4 11 7 36 22.0 18.7 0.9 15.7 9.6 13.2 13.0Norway High 39,342 7.2 0.6 2.7 8.9 68 3 248 10.8 6.9 10.3 4.4 10.2 11.7 5.5Switzerland High 76,400 3.9 1.2 6.2 14.3 353 8 779 18.5 7.9 -1.4 8.6 9.7 16.2 7.5Turkey High 45,896 7.8 0.7 5.5 11.4 807 4 1,655 7.7 8.2 -20.2 19.9 15.9 7.9 0.6
South Asia 59,328 10.0 1.0 2.2 5.5 13,547 2 30,795 5.2 7.5 13.6 4.0 3.4 4.6 1.2Bangladesh Moderate 3,194 7.3 0.1 1.6 3.8 959 1 2,352 3.0 4.5 5.0 0.9 11.8 3.2 2.1India High 44,713 10.9 0.7 2.1 5.3 10,762 2 24,266 5.5 7.3 14.2 3.3 5.5 4.7 0.9Maldives Moderate 574 -14.2 0.0 32.3 62.6 32 28 61 54.2 29.5 19.2 64.7 -21.9 34.5 14.8Nepal Low 919 8.4 0.0 4.4 9.1 366 3 774 7.1 12.4 2.6 16.1 10.8 4.6 5.0Pakistan Moderate 7,022 10.0 0.1 2.6 5.9 1,174 2 2,689 4.8 11.3 11.6 4.7 15.0 4.7 1.9Sri Lanka Moderate 2,906 2.9 0.0 3.8 9.5 255 3 654 7.8 11.5 18.9 9.4 -11.3 6.1 4.4
Southeast Asia 165,450 6.3 2.7 2.8 7.5 6,961 3 19,306 7.9 10.6 9.1 4.9 1.1 6.7 5.1Brunei Darussalam Low 989 1.0 0.0 3.3 13.4 8 5 24 14.3 13.0 5.0 1.2 5.1 5.6 2.3Burma Low 22,532 0.8 0.4 1.6 3.4 323 2 652 3.1 4.8 1.2 1.5 10.6 4.3 2.8Cambodia Low 1,033 7.6 0.0 7.3 17.2 396 6 949 13.5 16.0 3.1 17.9 9.8 3.3 9.1Indonesia High 34,452 8.6 0.6 3.1 8.9 2,445 3 7,090 7.4 11.9 13.3 5.7 1.6 6.0 8.9Laos Low 376 14.6 0.0 5.5 11.4 108 4 227 8.9 9.1 6.6 26.3 21.5 2.4 7.8Malaysia High 28,711 14.9 0.5 5.3 15.6 560 5 1,443 13.7 16.9 10.8 5.8 18.1 9.7 1.7Papua New Guinea Low 1,021 13.4 0.0 5.8 14.5 121 5 305 11.9 20.5 4.1 10.0 20.3 15.5 3.2Philippines High 10,035 7.5 0.2 2.7 7.3 917 3 2,837 9.4 10.8 6.0 4.6 8.7 5.6 3.5Singapore High 26,850 7.0 0.4 2.6 10.6 55 2 183 8.3 17.6 1.7 2.3 13.1 16.0 10.1Thailand High 31,997 -2.4 0.5 5.2 11.7 1,397 4 2,984 8.4 9.7 12.3 8.9 -14.9 11.7 2.7Vietnam Moderate 7,451 8.9 0.1 2.2 8.7 632 2 2,613 7.0 8.8 6.6 1.0 14.1 8.4 1.4
Sub-Saharan Africa 73,618 7.9 1.2 3.3 8.8 3,877 2 10,647 6.8 11.9 5.8 7.9 11.0 5.8 1.5Angola Low 2,391 13.5 0.0 3.3 27.7 85 3 758 22.7 8.6 8.2 0.5 18.4 6.6 1.1Benin Low 340 4.1 0.0 2.3 5.1 32 2 70 4.1 6.6 6.2 9.1 3.0 3.2 3.0Botswana Low 1,421 12.8 0.0 4.8 10.3 20 7 39 12.7 6.8 5.2 13.4 17.1 10.3 2.3Burkina Faso Low 398 6.8 0.0 2.1 4.7 41 2 94 3.7 7.6 5.3 13.2 1.7 3.1 1.9Burundi Low 71 8.3 0.0 2.7 4.9 33 2 61 3.8 8.7 0.9 2.6 -3.9 5.6 0.7Cameroon Low 1,425 7.6 0.0 1.8 5.0 61 2 166 4.2 7.3 4.5 3.2 0.0 4.4 1.7Cape Verde Low 373 5.8 0.0 11.1 19.2 11 10 19 17.5 4.7 11.1 48.8 1.9 12.8 6.2Central African Republic Low 76 6.7 0.0 1.6 3.0 9 1 18 2.4 6.8 5.0 2.6 -8.5 2.2 1.6Chad Low 615 10.3 0.0 1.5 9.1 21 1 135 7.4 10.9 11.0 3.0 4.9 5.9 3.8Comoros Low 75 8.0 0.0 4.1 10.6 6 3 15 8.6 29.7 6.2 17.9 9.6 7.5 6.1Congo, Democratic Republic Low 504 4.2 0.0 1.2 7.9 8 1 51 6.7 7.2 6.2 0.9 0.4 4.8 2.5Cote d'Ivoire Low 1,745 5.1 0.0 1.8 4.5 67 1 173 3.8 6.7 5.4 1.8 8.7 7.0 1.4Dem Rep of the Congo Low 528 6.8 0.0 1.2 3.0 128 1 312 2.3 5.1 5.5 0.2 15.0 3.2 0.8Ethiopia Low 1,112 4.8 0.0 4.7 9.5 664 4 1,349 7.3 8.8 2.9 22.5 -2.3 4.8 2.3Gabon Low 1,457 5.2 0.0 3.3 12.7 15 4 48 12.7 10.1 3.5 5.2 6.3 15.5 3.8Gambia Low 132 9.3 0.0 12.3 23.2 62 10 119 18.6 16.6 4.7 30.6 10.1 6.4 9.3Ghana Moderate 1,641 10.9 0.0 5.4 10.8 230 4 465 8.7 8.9 4.9 17.3 16.0 6.1 3.2Guinea Low 298 7.8 0.0 3.2 5.8 54 3 100 4.8 5.6 4.0 5.5 15.9 4.0 2.9Kenya Moderate 2,443 9.7 0.0 5.3 12.2 235 4 548 9.9 23.3 5.6 19.8 17.4 5.4 6.9Lesotho Low 223 3.2 0.0 2.6 7.5 9 2 27 6.2 11.4 3.3 6.8 11.3 3.5 1.2Madagascar Low 534 11.2 0.0 3.0 7.5 88 2 222 6.0 11.6 7.1 13.4 14.7 3.9 5.4Malawi Low 232 9.4 0.0 3.7 7.3 67 3 133 5.7 5.5 4.1 9.6 13.9 3.8 1.3Mali Low 626 7.3 0.0 3.5 7.2 87 3 185 5.7 8.0 2.3 15.7 6.4 5.5 1.7Mauritius Moderate 2,506 12.7 0.0 14.5 31.6 85 17 171 33.9 25.8 6.5 32.9 16.8 8.8 15.8Namibia Low 1,004 8.2 0.0 5.6 11.2 34 6 65 11.3 8.1 3.7 18.9 11.9 5.2 3.7Niger Low 250 4.6 0.0 1.7 4.3 14 1 36 3.5 9.1 5.7 7.8 -5.8 3.1 1.8Nigeria Moderate 8,469 8.7 0.1 1.5 7.7 409 1 2,108 6.4 2.4 6.1 1.2 12.0 5.1 0.3Reunion Low 3,962 1.8 0.1 1.8 5.8 7 3 18 6.5 11.3 3.3 3.0 10.3 9.3 2.9Rwanda Low 191 12.5 0.0 3.3 6.5 48 3 96 5.2 6.2 5.0 30.6 20.6 4.3 1.6Sao Tome and Principe Low 24 -6.2 0.0 14.4 25.4 5 11 9 20.2 4.7 -10.1 52.0 -6.7 5.9 2.4Senegal Low 1,023 5.6 0.0 3.5 8.0 72 3 165 6.6 11.2 4.3 16.2 8.5 3.4 3.7Seychelles Moderate 510 14.0 0.0 33.0 60.2 16 44 27 76.7 12.5 1.9 47.4 18.6 16.3 22.1Sierra Leone Low 83 6.4 0.0 2.9 5.7 24 2 47 4.5 3.4 19.5 20.2 1.7 3.0 2.3South Africa High 30,332 7.1 0.5 3.9 9.0 522 4 1,100 8.3 14.1 5.2 11.0 11.8 6.3 0.5Sudan Low 2,396 7.9 0.0 1.1 8.7 59 1 485 7.2 40.3 6.3 2.5 2.9 1.8 1.2Swaziland Low 340 3.9 0.0 2.4 6.6 3 3 7 6.9 12.8 1.3 2.9 7.8 6.3 3.0Tanzania Low 1,858 11.5 0.0 4.3 9.7 293 3 673 7.7 13.0 9.3 33.0 12.4 5.8 5.5Togo Low 208 6.8 0.0 1.8 4.7 10 1 27 3.8 10.2 4.8 3.6 8.9 4.2 2.5Uganda Low 840 9.1 0.0 4.6 9.2 206 4 420 7.3 7.2 5.3 23.4 8.5 5.1 2.3Zambia Moderate 620 1.3 0.0 1.9 4.5 24 2 55 3.7 11.4 5.3 9.0 1.5 4.6 2.1Zimbabwe Low 342 -3.2 0.0 1.4 3.3 13 1 30 2.9 8.4 -2.6 3.6 -16.4 3.3 2.3
High High confidence in data sources.Moderate Countries with moderate confidence in data sources.
Low Countries with forecast subjust to high uncertainty and/or with limited access to data.
38

OXFORD ECONOMICFORECASTING
ASSISTING WTTC PROVIDE TOOLS FOR ANALYSIS,BENCHMARKING, FORECASTING AND PLANNING
An elite provider of economic analysis, forecasting and modelling, OEF possesses the skills and experience to assist you get togrips with the drivers of your business. Projects undertaken in recent years in tourism related fields include:
• Detailed country and regional appraisals of the impact of tourism on the economy• Preparation of scenarios to assess the potential impact of outside events, such as War in Iraq, on tourism flows and spending• Development of a forecasting framework for a hotel chain to analyse and predict occupancy rates and revenue across their
properties
As well as bespoke consultancy, OEF offers a wide range of subscription services.These include publications on the internationalmacroeconomy and a full range of sectors globally, as well as extensive web-based forecast databanks that can be downloaded inspreadsheet format.The emphasis in all our work is making our analysis both accessible and relevant to decision makers.
Over the last 25 years OEF has built a diverse and loyal client base of over 300 organisations worldwide, including internationalorganizations, governments, central banks, and both large and small businesses. Headquartered in Oxford, England, with offices inPhiladelphia and Basel, OEF employs over 35 full-time, highly qualified, economists and data specialists, while maintaining linkswith a network of economists in universities worldwide.
For more information please take advantage of a free trial on our website, www.oef.com, or contact Tom Glanville, OEF,AbbeyHouse, 121 St Aldates, Oxford, OX1 1HB, United Kingdom.Tel 44 1865 268907; E-mail: [email protected]

WTTC would like to express its sincere appreciation to the entire research and economics teamassociated with this 2005 Tourism Satellite Accounting Research
Oxford Economic Forecasting•
Adrian Cooper, Managing DirectorAlan Wilson, Director of Consulting Services
Keith Edmonds, Senior EconomistPablo Astorga, Senior Economist
The OEF Macroeconomic Forecasting and Technical Teams
World Travel & Tourism Council•
Richard Miller, Executive Vice President