Embed Size (px)
Citation preview
Country report
June 2019
Portuguese bathing water quality in 2018
Photo: © Peter Kristensen/EEA
Portugal
Bathing Water Quality in the Season 2018
Portugal
Under the provisions of the Bathing Water Directive, more than 21 000 bathing waters are monitored in
Europe each season. The monitoring data and other information regarding bathing water management are
reported to the European Environment Agency by 30 reporting countries in Europe, to be assessed for the
annual European report and more detailed national reports.
1. BWD reporting in the season 2018
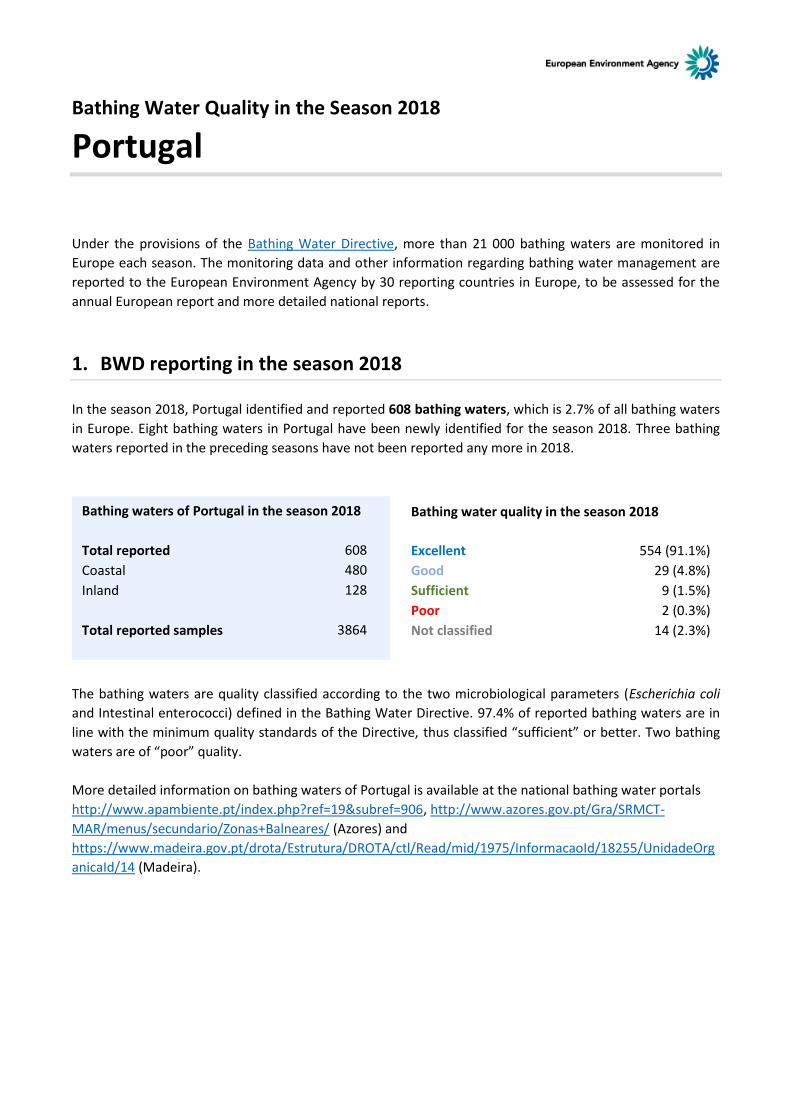
In the season 2018, Portugal identified and reported 608 bathing waters, which is 2.7% of all bathing waters
in Europe. Eight bathing waters in Portugal have been newly identified for the season 2018. Three bathing
waters reported in the preceding seasons have not been reported any more in 2018.
The bathing waters are quality classified according to the two microbiological parameters (Escherichia coli
and Intestinal enterococci) defined in the Bathing Water Directive. 97.4% of reported bathing waters are in
line with the minimum quality standards of the Directive, thus classified “sufficient” or better. Two bathing
waters are of “poor” quality.
More detailed information on bathing waters of Portugal is available at the national bathing water portals
http://www.apambiente.pt/index.php?ref=19&subref=906, http://www.azores.gov.pt/Gra/SRMCT-
MAR/menus/secundario/Zonas+Balneares/ (Azores) and
https://www.madeira.gov.pt/drota/Estrutura/DROTA/ctl/Read/mid/1975/InformacaoId/18255/UnidadeOrg
anicaId/14 (Madeira).
Bathing waters of Portugal in the season 2018
Total reported 608
Coastal 480
Inland 128
Total reported samples 3864
Bathing water quality in the season 2018
Excellent 554 (91.1%)
Good 29 (4.8%)
Sufficient 9 (1.5%)
Poor 2 (0.3%)
Not classified 14 (2.3%)
2. BWD monitoring
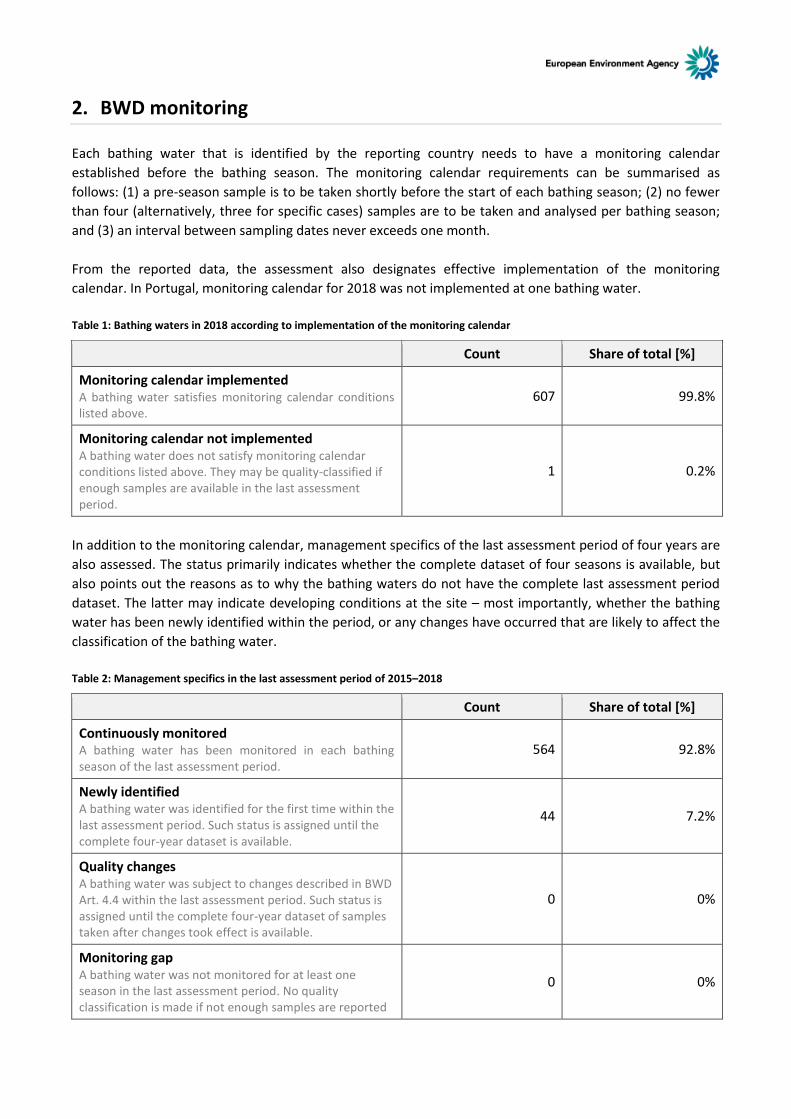
Each bathing water that is identified by the reporting country needs to have a monitoring calendar
established before the bathing season. The monitoring calendar requirements can be summarised as
follows: (1) a pre-season sample is to be taken shortly before the start of each bathing season; (2) no fewer
than four (alternatively, three for specific cases) samples are to be taken and analysed per bathing season;
and (3) an interval between sampling dates never exceeds one month.
From the reported data, the assessment also designates effective implementation of the monitoring
calendar. In Portugal, monitoring calendar for 2018 was not implemented at one bathing water.
Table 1: Bathing waters in 2018 according to implementation of the monitoring calendar
Count Share of total [%]
Monitoring calendar implemented A bathing water satisfies monitoring calendar conditions listed above.
607 99.8%
Monitoring calendar not implemented A bathing water does not satisfy monitoring calendar conditions listed above. They may be quality-classified if enough samples are available in the last assessment period.
1 0.2%
In addition to the monitoring calendar, management specifics of the last assessment period of four years are
also assessed. The status primarily indicates whether the complete dataset of four seasons is available, but
also points out the reasons as to why the bathing waters do not have the complete last assessment period
dataset. The latter may indicate developing conditions at the site – most importantly, whether the bathing
water has been newly identified within the period, or any changes have occurred that are likely to affect the
classification of the bathing water.
Table 2: Management specifics in the last assessment period of 2015–2018
Count Share of total [%]
Continuously monitored A bathing water has been monitored in each bathing season of the last assessment period.
564 92.8%
Newly identified A bathing water was identified for the first time within the last assessment period. Such status is assigned until the complete four-year dataset is available.
44 7.2%
Quality changes A bathing water was subject to changes described in BWD Art. 4.4 within the last assessment period. Such status is assigned until the complete four-year dataset of samples taken after changes took effect is available.
0 0%
Monitoring gap A bathing water was not monitored for at least one season in the last assessment period. No quality classification is made if not enough samples are reported
0 0%
for the most recent season.
3. Bathing water quality
3.1 Coastal bathing waters
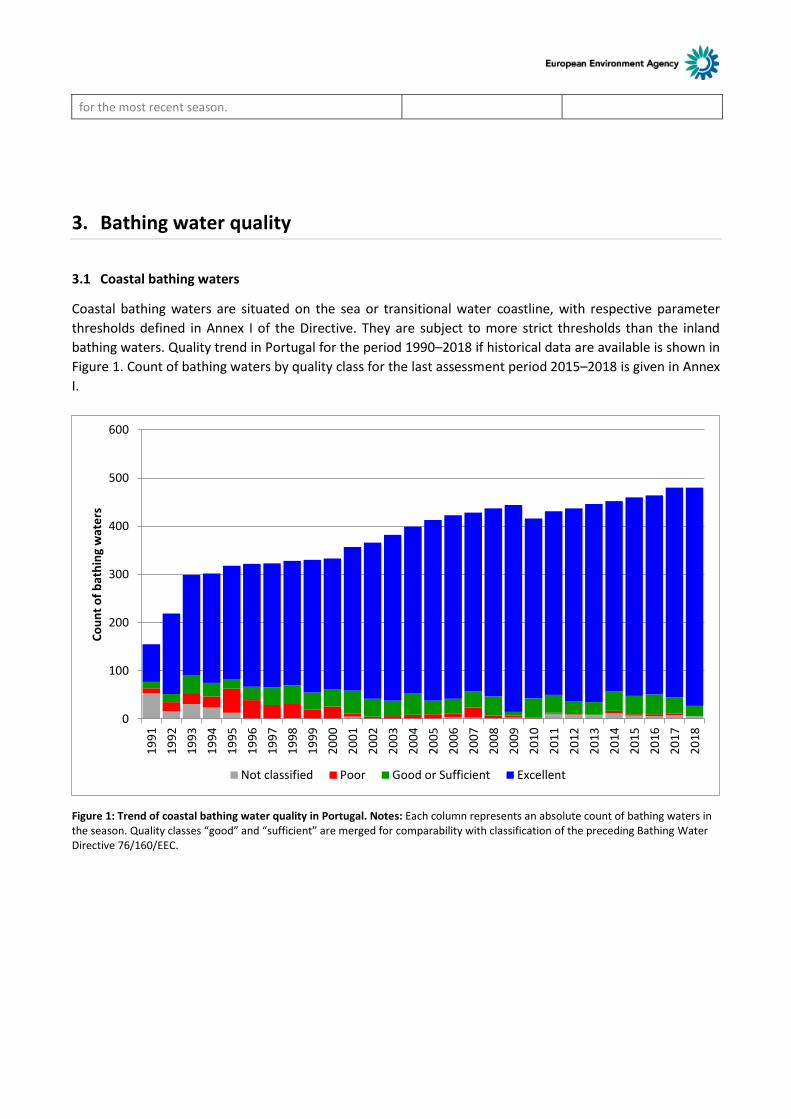
Coastal bathing waters are situated on the sea or transitional water coastline, with respective parameter
thresholds defined in Annex I of the Directive. They are subject to more strict thresholds than the inland
bathing waters. Quality trend in Portugal for the period 1990–2018 if historical data are available is shown in
Figure 1. Count of bathing waters by quality class for the last assessment period 2015–2018 is given in Annex
I.
Figure 1: Trend of coastal bathing water quality in Portugal. Notes: Each column represents an absolute count of bathing waters in the season. Quality classes “good” and “sufficient” are merged for comparability with classification of the preceding Bathing Water Directive 76/160/EEC.
0
100
200
300
400
500
600
19
91
19
92
19
93
19
94
19
95
19
96
19
97
19
98
19
99
20
00
20
01
20
02
20
03
20
04
20
05
20
06
20
07
20
08
20
09
20
10
20
11
20
12
20
13
20
14
20
15
20
16
20
17
20
18
Co
un
t o
f b
ath
ing
wat
ers
Not classified Poor Good or Sufficient Excellent
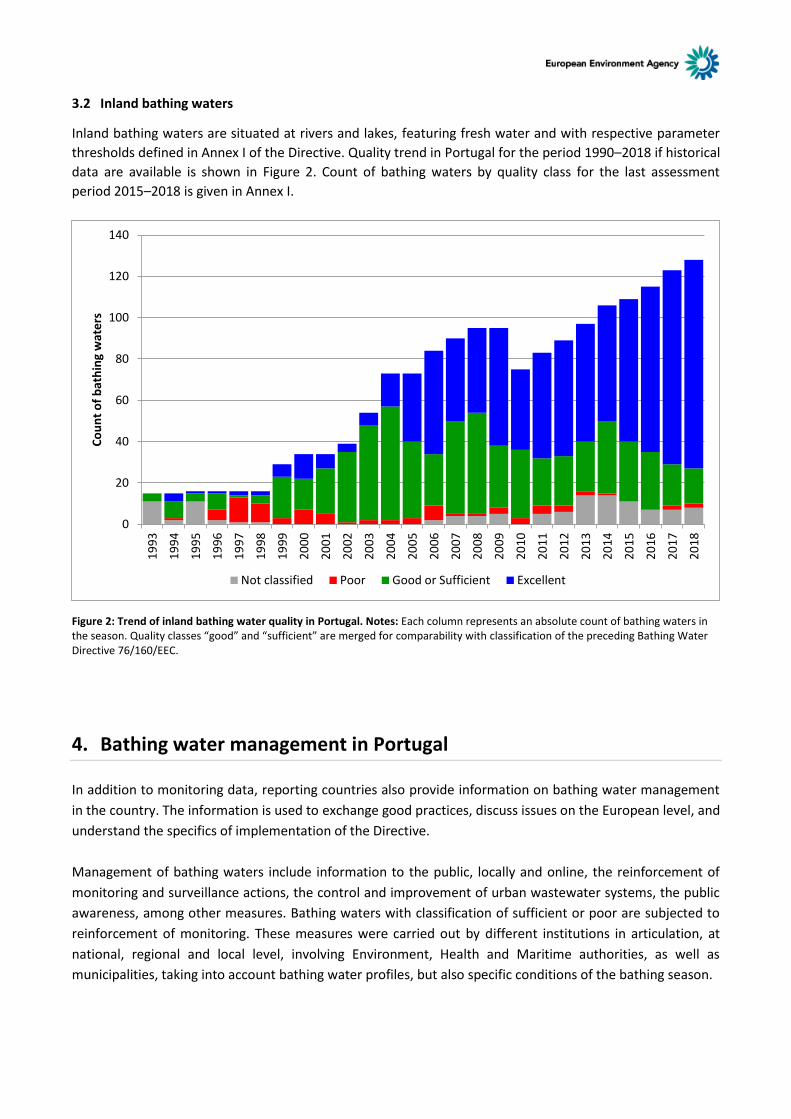
3.2 Inland bathing waters
Inland bathing waters are situated at rivers and lakes, featuring fresh water and with respective parameter
thresholds defined in Annex I of the Directive. Quality trend in Portugal for the period 1990–2018 if historical
data are available is shown in Figure 2. Count of bathing waters by quality class for the last assessment
period 2015–2018 is given in Annex I.
Figure 2: Trend of inland bathing water quality in Portugal. Notes: Each column represents an absolute count of bathing waters in the season. Quality classes “good” and “sufficient” are merged for comparability with classification of the preceding Bathing Water Directive 76/160/EEC.
4. Bathing water management in Portugal
In addition to monitoring data, reporting countries also provide information on bathing water management
in the country. The information is used to exchange good practices, discuss issues on the European level, and
understand the specifics of implementation of the Directive.
Management of bathing waters include information to the public, locally and online, the reinforcement of
monitoring and surveillance actions, the control and improvement of urban wastewater systems, the public
awareness, among other measures. Bathing waters with classification of sufficient or poor are subjected to
reinforcement of monitoring. These measures were carried out by different institutions in articulation, at
national, regional and local level, involving Environment, Health and Maritime authorities, as well as
municipalities, taking into account bathing water profiles, but also specific conditions of the bathing season.
0
20
40
60
80
100
120
140
19
93
19
94
19
95
19
96
19
97
19
98
19
99
20
00
20
01
20
02
20
03
20
04
20
05
20
06
20
07
20
08
20
09
20
10
20
11
20
12
20
13
20
14
20
15
20
16
20
17
20
18
Co
un
t o
f b
ath
ing
wat
ers
Not classified Poor Good or Sufficient Excellent
Following the quality classification "poor" obtained in 2017 (and because of the health risk for bathers),
bathing waters "Zebreiros " and "Merelim S. Paio" were not identified as bathing waters in the 2018 bathing
season . In this context, the of Northern Regional Health Delegate issued a permanent bathing prohibition.
This permanent prohibition will last for at least one bathing season or until there is a sustained guarantee of
improved quality of the water for bathing purposes.
There were 10 temporary bathing prohibitions in the 2018 bathing season issued by health authority (at
bathing waters “Poços S. Vicente Ferreira”, “Rainha (Cascais)”, “Pintadinho”, “Burgães-Rio Caima”, “Praia
d'el Rei”, “Tábua”, “Ponta Delgada”, “Ponte da Barca”, “Gorgulho” and “Alagoa”) and several cases where
advice against bathing was issued.
Due to strong rainfall which occurred on the 15th of July, in an area affected by wildfires and therefore the
terrain lacked green cover, the runoff triggered from the slopes of the mountainous area conveyed stones,
trees and other debris into the river bed, affecting a total of 13 bathing waters in two different rivers, river
“Alva” and River “Ceira”. The 13 bathing waters were affected with different severities. To ensure the safety
of bathers, advices against bathing were issued by the respective River Basin Administration and information
was placed in the proper locations near the bathing waters (firstly advices were issued and later some of
them were extended). Debris removal works were undertaken; when these ended, samples were taken to
evaluate the adequacy of water quality for bathing activities and for the withdrawal of the advice against
bathing. In river “Ceira” for that purpose the affected bathing waters were sampled on the 23rd of July and
in the affected bathing waters in river “Alva” on the 24th of July. Since results pointed to water quality being
compatible with bathing activities, advices against bathing were withdrawn on the 24th of July and on the
26th of July, respectively. Additional samples were taken to replace the samples that were missing due to
this situation. In river “Ceira” an additional sample was taken on the 25th of July and in river “Alva” an on
the 27th of July. Under these circumstances, it was considered that abnormal situation could be applicable
to these bathing waters, justifying the suspension of the monitoring calendar between the 15th and 24th of
July in bathing water located in the river “Ceira” and between the 15th and 26th of July for bathing waters
located in the river “Alva”.
Information provision on the internet – Portugal Mainland and Autonomous Regions
The online provision of information on bathing water is performed by the Portuguese Environment Agency
(APA), integrated in two websites: the APA official website and the site linked with the database. Besides,
and concerning Autonomous Regions of Azores and Madeira, there are regional websites.
The APA official website located at http://www.apambiente.pt/index.php?ref=19&subref=906 presents
information about the bathing water classification in previous years, as well as the European Environment
Agency reports and a link to the information concerning 2018 bathing season.
Also available are sites of the Autonomous Region of Azores (http://www.azores.gov.pt/Gra/SRMCT-
MAR/menus/secundario/Zonas+Balneares/ ; http://www.azores.gov.pt/Gra/SRMCT-
MAR/conteudos/livres/Perfis+das%20%C3%81guas%20Balneares%20dos%20A%C3%A7ores.htm) and
Autonomous Region of Madeira
(https://www.madeira.gov.pt//Portals/12/Documentos/Noticias/SITE_DROTA_aguas%20Balneares_Perfis_2
018.pdf).
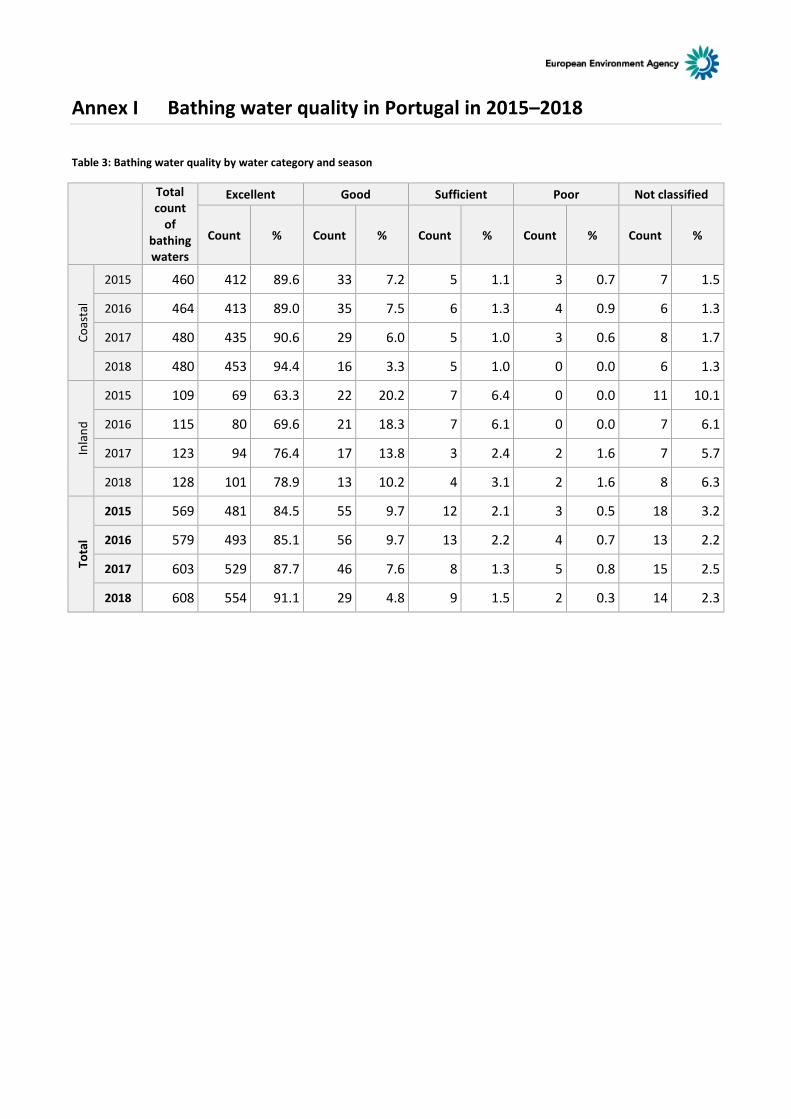
Annex I Bathing water quality in Portugal in 2015–2018
Table 3: Bathing water quality by water category and season
Total count
of bathing waters
Excellent Good Sufficient Poor Not classified
Count % Count % Count % Count % Count %
Co
asta
l
2015 460 412 89.6 33 7.2 5 1.1 3 0.7 7 1.5
2016 464 413 89.0 35 7.5 6 1.3 4 0.9 6 1.3
2017 480 435 90.6 29 6.0 5 1.0 3 0.6 8 1.7
2018 480 453 94.4 16 3.3 5 1.0 0 0.0 6 1.3
Inla
nd
2015 109 69 63.3 22 20.2 7 6.4 0 0.0 11 10.1
2016 115 80 69.6 21 18.3 7 6.1 0 0.0 7 6.1
2017 123 94 76.4 17 13.8 3 2.4 2 1.6 7 5.7
2018 128 101 78.9 13 10.2 4 3.1 2 1.6 8 6.3
Tota
l
2015 569 481 84.5 55 9.7 12 2.1 3 0.5 18 3.2
2016 579 493 85.1 56 9.7 13 2.2 4 0.7 13 2.2
2017 603 529 87.7 46 7.6 8 1.3 5 0.8 15 2.5
2018 608 554 91.1 29 4.8 9 1.5 2 0.3 14 2.3
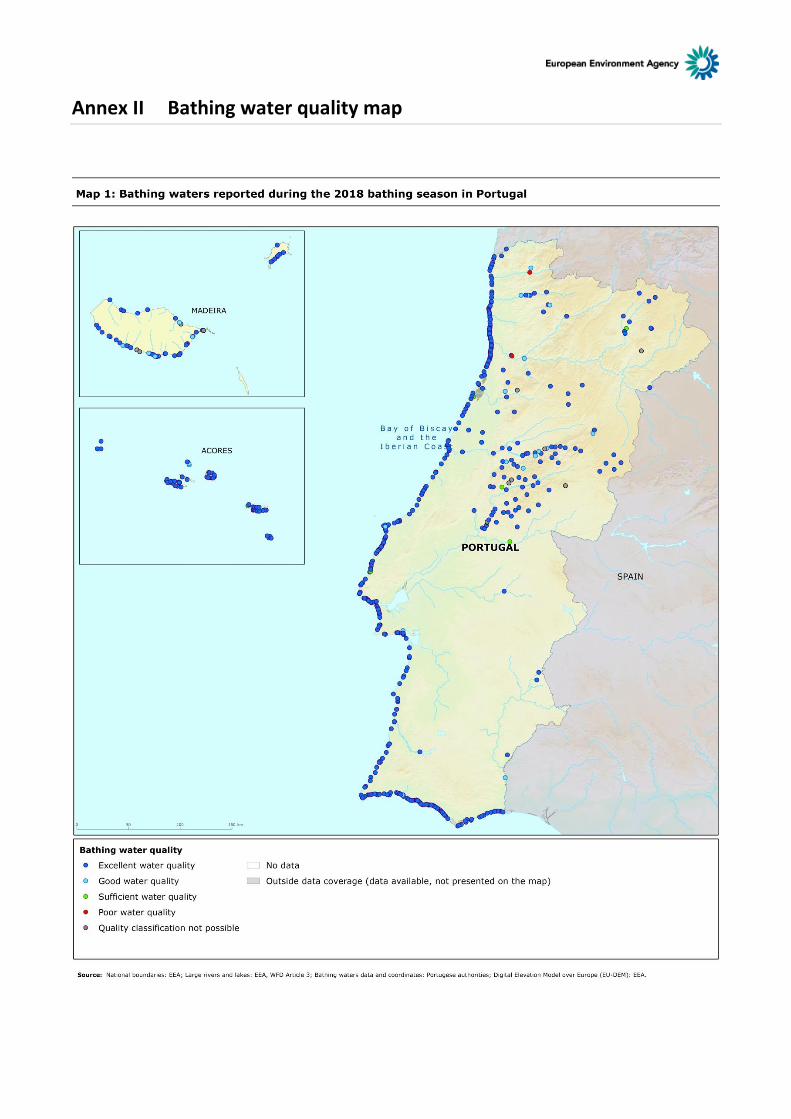
Annex II Bathing water quality map