Embed Size (px)
Citation preview
PORTFOLIO THEORY IS ALIVE AND WELL PAUL D. KAPLAN is vice president and chief economist at Ibbotson Associates in Chicago, which he joined in 1988. He was previously on the economics faculty o f North- western University, teaching international Jinance and statistics. Mr. Kaplan holds a B.A. in mathematics, economics, and computer scierztefrom New York University and an M.A. and a Ph.D. in economicsfrom Northwestern University.
LAURENCE B. SIEGEL is director ofquantitative analysis at the Ford Foundation in New York. A t the time this article was written, he was a managing director o f Ibbotson Associates in Chicago. Mr. Siege1 is also a trustee ofthe Obeweis Emerging Growth Fund and Household Personal Pottfolios. He holds a B.A. and an M. B.A. from the University of Chicago.
n a recent article in this Journal, Rom and Ferguson [1993] state that the importance of downside risk to some investors renders modern portfolio theory (MPT) obsolete. In
fact, portfolio theory (we drop the “modern,” given that the concept dates from 1952) says nothing about what kind of risk investors are averse to.
Portfolio theory says: If we understand the investment opportunities in the market (in terms of their statistical properties), and if we understand investor attitudes toward these characteristics (in terms of which asset characteristics investors want and which they hate), we can tell the investor what portfolio to hold.
Mean-variance optimization (MVO) is an application of portfolio theory. I t assumes that investors like expected return (the mean) and hate dispersion (as represented by the variance of returns around the mean). I t concludes that investors should hold efficient portfolios; these are typically diversified across asset classes.’ The assumption MVO makes about investor prefer- ences is reasonable for a wide variety of utility functions. For this reason, MVO is widely used and is sometimes mistaken for the far broader
theory of portfolios (MPT) or of decision-making under uncertainty (an even more inclusive cate-
Downside risk optimization is another appli- cation of portfolio theory. It is not an alternative (“post-modern”) theory.
Fishburn [1977] shows that for the kind of downside risk optimization described in Rom and Ferguson [1993] to be useful, the investor must be risk-averse at all points below the minimum accept- able return (MAR), but risk-neutral at all other points (see especially theorem 2, Fishburn [1977, p. 1201). This utility function, which we call a Fish- burn utility function, may approximate reality for some persons, but it is highly unrealistic for most classes of investor^.^ (See sidebar.)
Moreover, if investors actually have a Fish- burn utility function, they do not need to run an optimizer! The optimal portfolio for such an investor consists of 100% in the highest-returning asset (because the investor is risk-neutral on the upside), plus insurance (because the investor is averse to returns below the MAR). Traditional portfolio insurance programs provide this configuration, where the highest-returning asset is considered to be a stock market index.4
18 PORTFOLIO THEORY Is ALIVE AND WELL FALL 1994
The
Jour
nal o
f Inv
estin
g 19
94.3
.3:1
8-23
. Dow
nloa
ded
from
ww
w.ii
jour
nals
.com
by
Laur
ence
Sie
gel o
n 01
/06/
17.
It is
ille
gal t
o m
ake
unau
thor
ized
cop
ies o
f thi
s arti
cle,
forw
ard
to a
n un
auth
oriz
ed u
ser o
r to
post
ele
ctro
nica
lly w
ithou
t Pub
lishe
r per
mis
sion
.
THE ILLOGICAL FOUNDATION OF ROM m D FERGUSON’S DOWNSIDE RISK MODEL
Downside risk optimization, as portrayed by R o m and Ferguson, is relevant only to investors who have a Fishburn utility function. (To be precise, optimizing on downside risk below a single, investor-specific target that is the same for all assets can be motivated only by a Fishburn utility function,) To show why most investors do not have a Fishburn utility function, we present the basics of utility theory
WHAT IS UTILITY?
The “utility” of a given amount of wealth is the amount of satisfaction that it provides to a person. Because each person’s feelings differ, it is necessary to make some generalizations about utility. (An example of a useful generalization is “an additional dollar is more valuable to someone when he is poor than when he is rich.”) These generalizations can be expressed graphically as we have done in Exhibits 1 and 2, which show wealth on the horizontal axis and a particular investor’s utility of wealth on the vertical axis.
RISK “T€ULITY
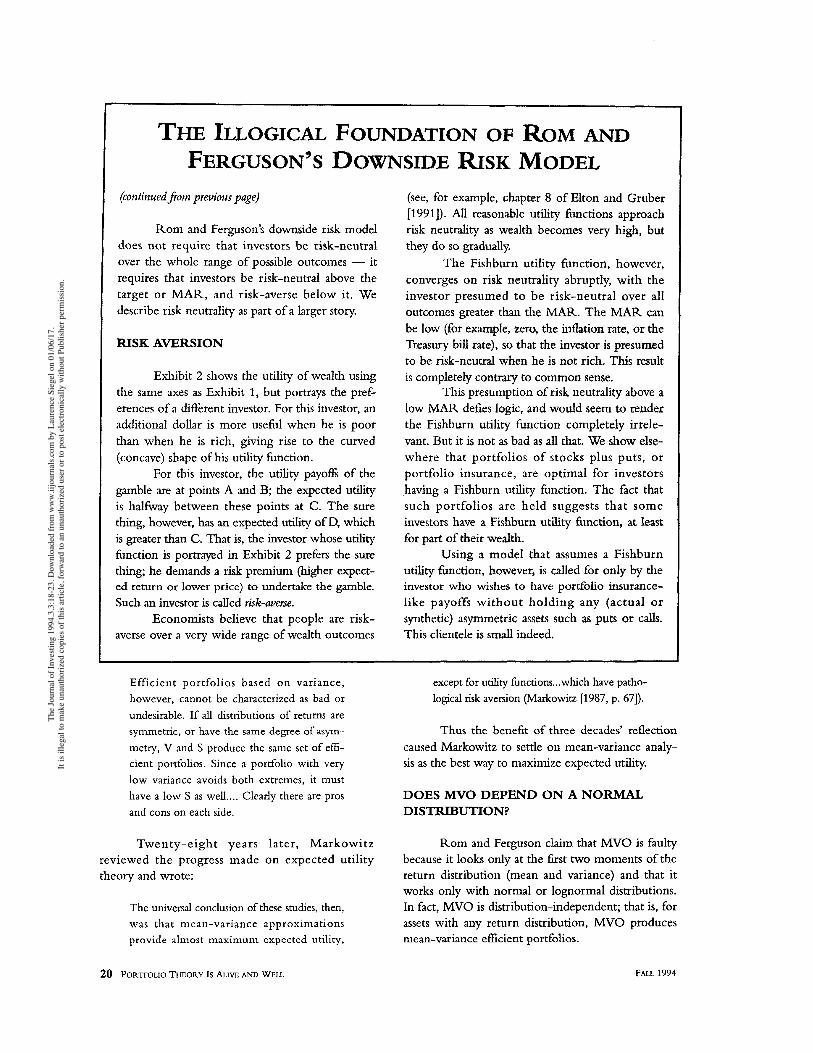
The straight diagonal line in Exhibit 1 shows the utility function of a person who is risk- neutral. This person places the same value on an additional dollar of wealth no matter how little or how much wealth he has (hence the straight line). The attitude of this person toward risk, as well as
toward wealth, can be discerned from the diagram.
Consider two investments, a “gamble” and a “sure thing.” The gamble, represented by the two solid vertical l i e s perpendicular to the hori- zontal axis, has a 50% probability of paying $1 and a 50% probability of paying $2. The sure thing, represented by the dotted line, has a 100% proba- bility of paying $1.50,
We can look up this person’s utility of each of the two investments on the vertical axis. The utility of the gamble is represented by the two points A and B, where A is the utility of $1 and B is the utility of $2. Since the probability of each ofthe outcomes is 5@?, the weighted-aver- age utility (expected utility} of the gamble is halfway between A and B, at point C.
The utility of the payoff from the sure thing, $1.50, is represented by point D. Because the fine expressing the relation between wealth and utility is straight, D is in the same place on the vertical as C. That is, the person i s indifferent between a riskless investment and a risky invest- ment having the same payoff.
This person would be a terrible investov, because he would not demand a premium (in the form of a higher expected return) for taking risk. Other investors could sell him gambles at the price of riskless “sure things,’’ and he would be ruined in short order.
(continued on next page)
IS VARIANCE A BAD MEASURE OF RISK?
R o m and Ferguson claim that MVO is flawed because variance is a bad measure of risk. Risk, in their view, means expected loss, not ~ncertainty.~ For most investors, however, uncer- tainty (measured by variance) is a good definition of risk.
Harry Markowitz came to this conclusion after an extensive investigation of expected utility theory (Markowitz [1959, 1991, p. 1941; see also Markowitz [1987]). Conscious that the simplification implied by the use of variance might cause the
resulting portfolios to be suboptimal for some investors, Markowitz investigated other approaches. In 1959 he concluded:
Analyses based on S [semivariance below the mean] tend to produce better portfolios than those produced on V [variance]. Vari-. ance considers extremely high and extremely low returns equally undesirable. An analysis based on V seeks to eliminate both extremes. An analysis based on S, on the other hand, concentrates on reducing losses.
FALL 1994 THE JOURNAL OF INVESTING 19
The
Jour
nal o
f Inv
estin
g 19
94.3
.3:1
8-23
. Dow
nloa
ded
from
ww
w.ii
jour
nals
.com
by
Laur
ence
Sie
gel o
n 01
/06/
17.
It is
ille
gal t
o m
ake
unau
thor
ized
cop
ies o
f thi
s arti
cle,
forw
ard
to a
n un
auth
oriz
ed u
ser o
r to
post
ele
ctro
nica
lly w
ithou
t Pub
lishe
r per
mis
sion
.
THE ILLOGICAL FOUNDATION OF ROM AND FERGUSON’S DOWNSIDE RISK MODEL
(continuedfrom previous page)
Rom and Ferguson’s downside risk model does not require that investors be risk-neutral over the whole range of possible outcomes - it requires that investors be risk-neutral above the target or MAR, and risk-averse below it. We describe risk neutrality as part of a larger story.
RISK AVERSION
Exhibit 2 shows the utility of wealth using the same axes as Exhibit 1, but portrays the pref- erences of a different investor. For this investor, an additional dollar is more useful when he is poor than when he is rich, giving rise to the curved (concave) shape of hrs utility function.
For this investor, the utility payofts of the gamble are at points A and 3; the expected utility is halfway between these points at C. The sure thing, however, has an expected utility of D, which is greater than C. That is, the investor whose utility function is portrayed in Exhibit 2 prefers the sure thing; he demands a risk premium (hlgher expect- ed return or lower price) to undertake the gamble. Such an investor is called risk-aveme.
Economists beIieve that people are risk- averse over a very wide range of wealth outcomes
(see, for example, chapter 8 of Elton and Gruber 119911)- All reasonable utility functions approach risk neutrality as wealth becomes very high, but they do so gradually.
The Fishburn utility function, however, converges on risk neutrality abruptly, with the investor presumed to be risk-neutral over all outcomes greater than the MAR. The MAR can be low (for example, zero, the inflation rate, or the Treasury bill rate), so that the investor is presumed to be risk-neutral when he is not rich. This result is completely contrary to common sense.
This presumption of risk neutrality above a low MAR defies logic, and would seem to render the Fishburn utility function completely irrele- vant. But it is not as bad as all that. We show else- where that portfolios of stocks plus puts, or portfolio insurance, are optimal for investors .having a Fishburn utility function. The fact that such portfolios are held suggests that some investors have a Fishburn utility function, at least for part of their wealth,
Using a model that assumes a Fishburn utility function, however, is called for only by the investor who wishes to have portfolio insurance- like payoffs without holding any (actual or synthetic) asymmetric assets such as puts or calls. This clientele is s m a l l indeed.
Efficient port folios bas e d on var iance, however, cannot be characterized as bad or undesirable. If all distributions of returns are symmetric, or have the same degree of asym- metry, V and S produce the same set of effi- cient portfolios. Since a portfolio with very low variance avoids both extremes, it must have a low S as we ll.... Clearly there are pros and cons on each side.
Twe n t y - e i g h t ye ar s 1 a t e r , Mark ow i t z reviewed the progress made on expected utility theory and wrote:
The universal conclusion of these studies, then, was that mean-variance approximations provide almost maximum expected utility,
except for utility functions ... which have patho- logical risk aversion (Markowitz [1987, p. 671).
Thus the benefit of three decades’ reflection caused Markowitz to settle on mean-variance analy- sis as the best way to maximize expected utility.
DOES MVO DEPEND ON A NORMAL DISTRIBUTION?
Rom and Ferguson cl.aim that MVO is faulty because it looks only at the first two moments of the return distribution (mean and variance) and that it works only with normal or lognormal distributions. In fact, MVO is distribution-independent; that is, for assets with any return distribution, MVO produces mean-variance efficient portfolios.
20 PORTFOLIO THEORY IS ALIVE AND WELL FALL 1994
The
Jour
nal o
f Inv
estin
g 19
94.3
.3:1
8-23
. Dow
nloa
ded
from
ww
w.ii
jour
nals
.com
by
Laur
ence
Sie
gel o
n 01
/06/
17.
It is
ille
gal t
o m
ake
unau
thor
ized
cop
ies o
f thi
s arti
cle,
forw
ard
to a
n un
auth
oriz
ed u
ser o
r to
post
ele
ctro
nica
lly w
ithou
t Pub
lishe
r per
mis
sion
.
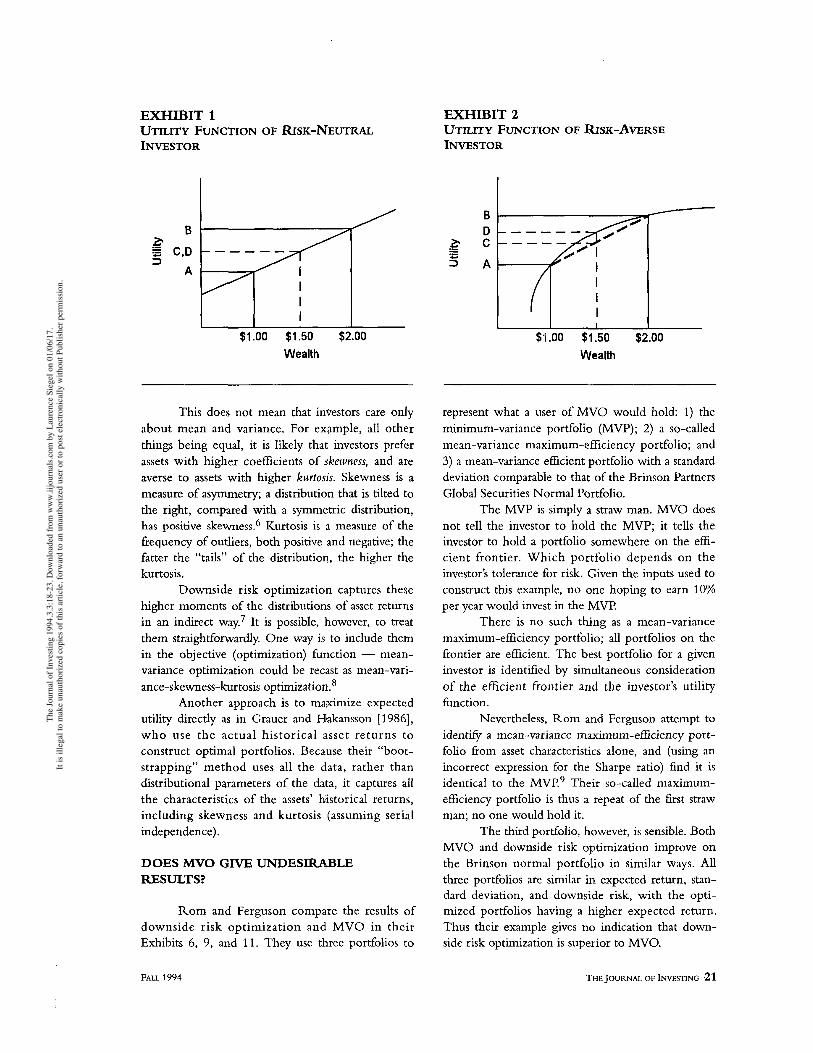
EXHIBIT 1
INVESTOR UTILITY FUNCTION OF RISK-NEUTRAL
EXHIBIT 2 UTILITY FUNCTION OF RISK-AVERSE INVESTOR
I I $1.00 $1.50 $2.00
Wealth
This does not mean that investors care only about mean and variance. For example, all other things being equal, it is likely that investors prefer assets with higher coefficients of skewness, and are averse to assets with higher kurtosis. Skewness is a measure of asymmetry; a distribution that is tilted to the right, compared with a symmetric distribution, has positive skewness6 Kurtosis is a measure of the frequency of outliers, both positive and negative; the fatter the “tails” of the distribution, the higher the kurtosis.
Downside risk optimization captures these higher moments of the distributions of asset returns in an indirect way7 It is possible, however, to treat them straightforwardly. One way is to include them in the objective (optimization) function - mean- variance optimization could be recast as mean-vari- ance-skewness-kurtosis optimization.8
Another approach is to maximize expected utility directly as in Grauer and Hakansson [1986], who use the actual historical asset returns to construct optimal portfolios. Because their “boot- strapping” method uses all the data, rather than distributional parameters of the data, it captures all the characteristics of the assets’ historical returns, including skewness and kurtosis (assuming serial independence).
DOES MVO GIVE UNDESIRABLE RESULTS?
Rom and Ferguson compare the results of downside risk optimization and MVO in their Exhibits 6, 9, and 11. They use three portfolios to
$1.00 $1.50 $2.00 Wealth
represent what a user of MVO would hold: 1) the minimum-variance portfolio (MVP); 2) a so-called mean-variance maximum-efficiency portfolio; and 3) a mean-variance efficient portfolio with a standard deviation comparable to that of the Brinson Partners Global Securities Normal Portfolio.
The MVP is simply a straw man. MVO does not tell the investor to hold the MVP; it tells the investor to hold a portfolio somewhere on the effi- cient frontier. Which portfolio depends on the investor’s tolerance for risk. Given the inputs used to construct this example, no one hoping to earn 10% per year would invest in the MVP.
There is no such thing as a mean-variance maximum-efficiency portfolio; all portfolios on the frontier are efficient. The best portfolio for a given investor is identified by simultaneous consideration of the efficient frontier and the investor’s utility function.
Nevertheless, Rom and Ferguson attempt to identie a mean-variance maximum-efficiency port- folio from asset characteristics alone, and (using an incorrect expression for the Sharpe ratio) find it is identical to the MVP9 Their so-called maximum- efficiency portfolio is thus a repeat of the first straw man; no one would hold it.
The third portfolio, however, is sensible. Both MVO and downside risk optimization improve on the Brinson normal portfolio in similar ways. All three portfolios are similar in expected return, stan- dard deviation, and downside risk, with the opti- mized portfolios having a higher expected return. Thus their example gives no indication that down- side risk optimization is superior to MVO.
FALL 1994 THE JOURNAL OF INVESTING 21
The
Jour
nal o
f Inv
estin
g 19
94.3
.3:1
8-23
. Dow
nloa
ded
from
ww
w.ii
jour
nals
.com
by
Laur
ence
Sie
gel o
n 01
/06/
17.
It is
ille
gal t
o m
ake
unau
thor
ized
cop
ies o
f thi
s arti
cle,
forw
ard
to a
n un
auth
oriz
ed u
ser o
r to
post
ele
ctro
nica
lly w
ithou
t Pub
lishe
r per
mis
sion
.
We conclude that MVO does not give unde- sirable results, except to an investor who completely misunderstands the model and invests in an ultracon- servative strategy that has no hope of achieving its objectives. For investors who understand that one must take some risk to make money, MVO is fine.
OTHER ISSUES
Small Sample Problems
When asset returns are sampled over a period that contains few negative returns, the variance tells more about the likelihood of loss than semivariance or other downside risk measures. This is because the upside variance that has occurred is indicative of the downside variance that can be expected to occur.
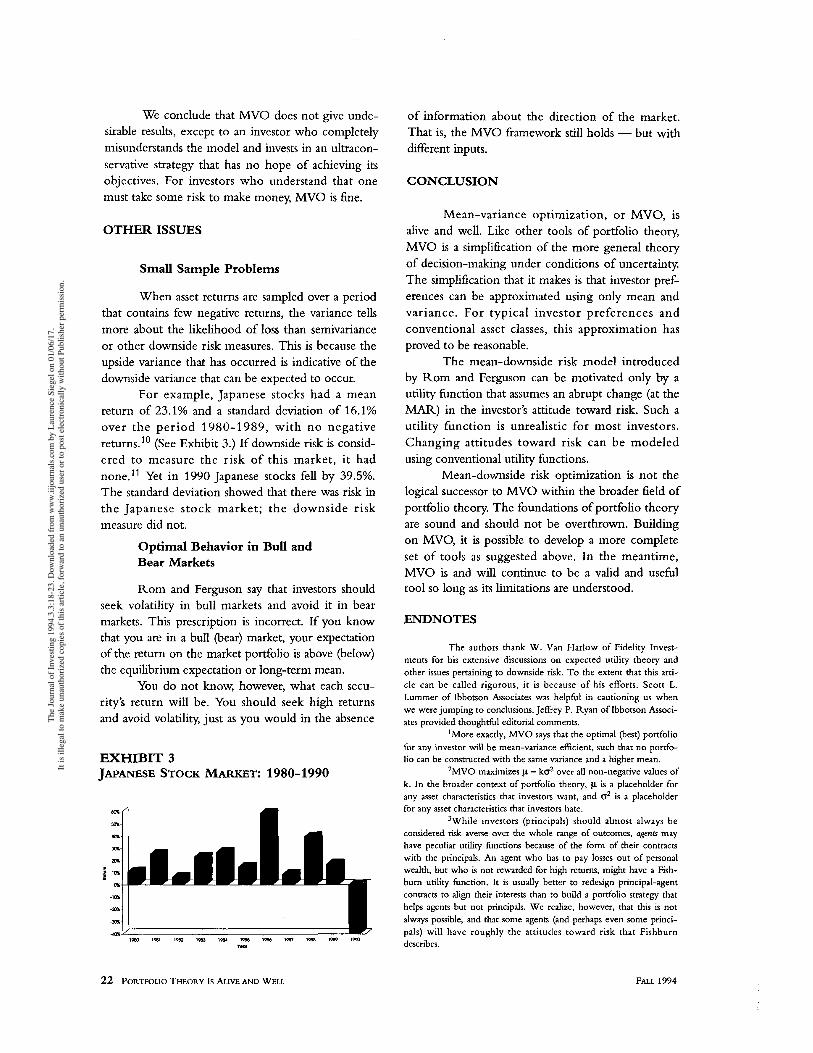
For example, Japanese stocks had a mean return of 23.1% and a standard deviation of 16.1% over the period 1980-1989, with no negative returns." (See Exhibit 3.) If downside risk is consid- ered to measure the risk of this market, it had none." Yet in 1990 Japanese stocks fell by 39.5%. The standard deviation showed that there was risk in the Japanese stock market; the downside risk measure &d not.
Optimal Behavior in Bull and Bear Markets
Rom and Ferguson say that investors should seek volatility in bull markets and avoid it in bear markets. This prescription is incorrect. If you know that you are in a bull (bear) market, your expectation of the return on the market portfolio is above (below) the equilibrium expectation or long-term mean.
You do not know, however, what each secu- rity's return will be. You should seek high returns and avoid volatility, just as you would in the absence
EXHIBIT 3 JAPANESE STOCK MARKET: 1980-1990
of information about the direction of the market. That is, the MVO fiamewclrk still holds - but with different inputs.
CONCLUSION
Mean-variance optimization, or MVO, is alive and well. Like other tools of portfolio theory, MVO is a simplification of the more general theory of decision-making under conditions of uncertainty. The simplification that it makes is that investor pref- erences can be approximated using only mean and variance. For typical investor preferences and conventional asset classes, this approximation has proved to be reasonable.
The mean-downside risk model introduced by Rom and Ferguson can be motivated only by a utility function that assumes an abrupt change (at the MAR) in the investor's attitude toward risk. Such a utility function is unrealistic for most investors. Changing attitudes toward risk can be modeled using conventional utility functions.
Mean-downside risk optimization is not the logical successor to MVO within the broader field of portfolio theory. The foundations of portfolio theory are sound and should not be overthrown. Building on MVO, it is possible to develop a more complete set of tools as suggested above. In the meantime, MVO is and will continue to be a valid and useful tool so long as its limitations are understood.
ENDNOTES
The authors thank W. Van Harlow of Fidelity Invest- ments for his extensive discussions on expected utility theory and other issues pertaining to downside risk. To the extent that this arti- cle can be called rigorous, it is because of his efforts. Scott L. Lummer of Ibbotson Associates was helpful in cautioning us when we were jumping to conclusions. Jeffrey P. Ryan of Ibbotson Associ- ates provided thoughtful editorial comments.
'More exactly, MVO says that the optimal (best) portfolio for any investor will be mean-variance efficient, such that no portfo- lio can be constructed with the same variance and a higher mean.
2 M V 0 maximizes p - ko' over all non-negative values of k. In the broader context of portfolio theory, p is a placeholder for any asset characteristics that investoe want, and o2 is a placeholder for any asset characteristics that investoe hate.
3While investors (principals) should almost always be considered risk-averse over the whole range of outcomes, agents may have peculiar utility functions because of the form of their contracts with the principals. An agent who has to pay losses out of personal wealth, but who is not rewarded for high returns, might have a Fish- bum utility function. It is usually better to redesign principal-agent contracts to align their interests than to build a portfolio strategy that helps agents but not principals. We realize, however, that this is not always possible, and that some agents (and perhaps even some princi- pals) will have roughly the attitudes toward risk that Fishburn describes.
22 PORTFOLIO THEORY IS ALIVE AND WELL FALL 1994
The
Jour
nal o
f Inv
estin
g 19
94.3
.3:1
8-23
. Dow
nloa
ded
from
ww
w.ii
jour
nals
.com
by
Laur
ence
Sie
gel o
n 01
/06/
17.
It is
ille
gal t
o m
ake
unau
thor
ized
cop
ies o
f thi
s arti
cle,
forw
ard
to a
n un
auth
oriz
ed u
ser o
r to
post
ele
ctro
nica
lly w
ithou
t Pub
lishe
r per
mis
sion
.
Note, moreover, that Fishburn describes a wide range of utility functions in his many works. For reasons of simplicity, in this article we refer to the kinked function described in Fishburn [1977] as a “Fishbum utility function.”
4A portfolio of stocks (or stock index futures) plus insur- ance (actual or synthetic puts) has a high expected return and is loss-free if the insurance-providing asset is liquid. In the crash of October 1987, nearly all portfolio insurance was provided by trad- ing stock index futures dynamically to replicate a time-varying position in stock index put options. The poor performance of this strategy in the crash suggests that a different insurance strategy, such as buying listed index puts, would achieve better liquidity and hence better insurance coverage. Of course, there are disadvantages to using listed puts to provide portfolio insurance - including time-dependence, path-dependence, and imperfections in the hedge ratio over time.
5The difference between uncertainty and expected loss is this: A person jumping off the Sears Tower faces loss but no uncer- tainty. A person who finds a lottery ticket (without paying for it) faces uncertainty but no loss.
6The conventional measure of skewness takes on a value greater than zero for distributions skewed to the right; Rom and Ferguson’s measure of skewness takes on a value greater than one.
’Although the skewness and kurtosis of the distribution being evaluated play a role in determining downside risk, downside risk is not itself a measure of skewness or kurtosis. Skewness and kurtosis are independent of the observer. In contract, downside risk as defined by Rom and Ferguson requires specification of the MAR, a parameter of the investor’s utility function (not of the asset).
Bawa [1975] shows that all risk-averse investors with decreasing absolute risk aversion prefer one return distribution (say, A) to another (say, B) if and only if 1) the expected return of A is at least that of B, and 2) for all targets, the downside variance of A does not exceed the downside variance of B, with the downside variance of A less than that of B for some targets.
He further demonstrates that the all-targets condition can be relaxed so that A can be shown to dominate B by comparing their downside variances for a finite number of targets. Because this theo- rem makes no assumptions about the shapes of the return distribu- tions, it indirectly takes into account variance, skewness, kurtosis, and all other higher moments. The targets for evaluating downside vari- ance depend on the return distributions, not the investor.
Bawa also shows that if the return distributions in ques- tion all come from the same two-parameter location-scale family (for example, if all the distributions are lognormal), return distributions can be ranked in a mean-dispersion framework. For many such distribution families, dispersion can be computed from variance alone. For some distribution families, including the family containing the lognormal, dispersion is related to mean and variance in such a way that MVO can be used to identify all efficient portfolios (see Bawa and Chakrin [1979]). If the return distributions being ranked are skewed, as is the case with the lognormal, a mean-dispersion framework handles skewness.
Bawa and Mishra [1985] show that for certain two-para- meter location-scale return distributions, the mean-dispersion frame- work and mean-downside risk framework with a single arbitrary target overlap.
8The literature on parameter preference (including Rubenstein [1971] and Scott and Horvath [1980]) suggests a path for investors who find MVO inadequate but who do not want to use downside risk. In general, investors prefer assets with higher odd- numbered moments (e.g., mean and skewness) and lower even- numbered moments (e.g., standard deviation and kurtosis). See Jean [ 19711.
’The correct form of the Sharpe ratio is the expected return minus the expected ritkless rate, divided by the standard deviation.
“Statistics are calculated from total annual returns on the Morgan Stanley Capital International (MSCI) Japan index, which is denominated in yen.
“Since the lowest annual return on Japanese stocks is 6.3%, the measure of downside risk i s zero for any MAR equal to or lower than 6.3%.
REFERENCES
Bawa, Vijay S. “Optimal Rules for Ordering Uncertain Prospects.” Journal $Financial Economics, March 1975.
Bawa, Vijay S., and L. Chakrin. “Optimal Portfolio Choice and Equilibrium in a Lognormal Securities Market.” In E. Elton and M. Gruber, eds., T I M S Studies in the Management Sciences, Vol. 11 (1979).
Bawa, Vijay S . , and Bani Mishra. “Mean-LPM and Mean-Variance Selection Rules: A Comparison.” Unpublished manuscript, 1985.
Elton, Edwin J., and Martin J. Gruber. Modern Porfolio Theory and Investment Analysis. New York: John Wiley & Sons, 1991.
Fishburn, Peter C. “Mean-Risk Analysis with Risk Associated with Below-Target Variance.” American Eronomic Review, March 1977.
Grauer, Robert L., and Nils H. Hakansson. “A Half Century of Returns on Levered and Unlevered Poafolios of Stocks, Bonds, and Bills, With and Without Small Stocks.”Joud ofBusiness, April 1986 (part 1).
Jean, W.H. “The Extension of Portfolio Analysis to Three or More Parameters.”journal of Financial and Quantitative Analysis. 1971.
Markowitz, Harry M. Mean- Variance Analysis in PorfJolio Choice and Capital Markets. Oxford: Basil Blackwell, 1987.
- . PorfJolio Selection [1959]. Oxford Basil Blackwell, 1991, 2nd ed.
Rom, Brian M., and Kathleen W. Ferguson. “Post-Modern Portfolio Theory Comes of Age.”Journal of Investing, Winter 1993.
Rubenstein, Mark E. “The Fundamental Theorem of Parameter Preference Security Valuation.” Journal of Financial and Quantitative Analysis, January 1971.
Scott, Robert C., and Philip A. Horvath. “On the Direction of Pref- erence for Moments of Higher Order than the Variance.” Journal of Finance, September 1980.
FALL 1994 THE JOURNAL OF INVESTING 23
The
Jour
nal o
f Inv
estin
g 19
94.3
.3:1
8-23
. Dow
nloa
ded
from
ww
w.ii
jour
nals
.com
by
Laur
ence
Sie
gel o
n 01
/06/
17.
It is
ille
gal t
o m
ake
unau
thor
ized
cop
ies o
f thi
s arti
cle,
forw
ard
to a
n un
auth
oriz
ed u
ser o
r to
post
ele
ctro
nica
lly w
ithou
t Pub
lishe
r per
mis
sion
.


![Liquidity as an Investment Style - pdfs.semanticscholar.org...Source: Ibbotson & Kim, 2014 Update, Liquidity as an Investment Style [Ibbotson, Chen, Kim & Hu, FAJ 2013.] trade Selection](https://img.pdfslide.us/doc/110x75/60bb410b68e95a043f6340df/liquidity-as-an-investment-style-pdfs-source-ibbotson-kim-2014-update.jpg)