Embed Size (px)
Citation preview
WHERE ACTIVE
MANAGEMENT
AIMS TO DRIVE
ALPHA GENERATION Templeton Emerging Markets Small
Cap Fund – Advisor Class (TEMZX)
As of June 30, 2017
PORTFOLIO SUMMARY

For Financial Professional Use Only / Not for Distribution to the Public
Franklin Retirement Payout Funds March 31, 2016
In contrast to the slow growth in developed markets,
investing in emerging markets may offer a passport to
abundant opportunities in a high-growth market. But, we
think finding the right opportunities and understanding the
associated risks takes more effort and know-how than
traditional developed markets.
Tap into a Vast, Under-Researched
Investment Universe
The emerging market small cap asset class includes over 20,000
companies, an aggregate marketing capitalization of $5.2 trillion1 and is
largely overlooked by research analysts.2
Navigate the Terrain with a Proven
Emerging Markets Pioneer
Templeton Emerging Markets Group opened its first research office in
Hong Kong in 1987, and our global network of research offices now
spans 20 countries. Today, we are located in countries representing
87% of the world's GDP.3
A Distinct Approach,
Our Active Share Score:4 96
The on-the-ground investment in understanding the local markets
at both a macro and micro level distinguishes Templeton’s approach
from others.
Today, the Templeton Emerging Markets Small Cap Fund—Advisor
Class (TEMZX) seeks to provide long-term capital appreciation by
uncovering opportunities with a value tilt through deep, on-the-ground
emerging market small cap research.
TEMPLETON EMERGING MARKETS SMALL CAP FUND
Where Active Management Aims to Drive Alpha Generation
Our Investment Approach
Outcome of Our
Research Expertise
Strategy In Action
Active Investment Selection
Risk And Reward
Portfolio Fit
Allocating to Emerging
Markets Small Cap
Templeton Emerging
Markets Group
Not FDIC Insured | May Lose Value | No Bank Guarantee
Where Active Management Aims to Drive Alpha Generation 1
Topics Covered
1. Source: Bloomberg, as of June 30, 2017. Listed companies under $2 billion market cap size.
2. Source: Bloomberg, as of June 30, 2017. EM small caps represented by the MSCI EM Small Cap Index. Emerging markets represented by the MSCI Emerging Markets Index. For illustrative and discussion purposes only. Negligible research coverage is defined as stocks having one or no research recommendations.
3. Based on information from the International Monetary Fund, World Economic Outlook Database, April 2017. Dates indicate date of establishing presence via an office opening or acquisition of a stake in a joint venture.
4. Source: © 2017 Morningstar as of June 30, 2017. The Active Share Score represents the portion of stock holdings in an actively managed fund that differs from its benchmark index. Active share scores range from 0 to 100. An active share score of 0 indicates a portfolio that is identical to its primary benchmark index, while an active share score of 100 represents a portfolio composition that holds no overlapping positions. Different position allocation amounts contribute to active share score and are subject to change. A high active share score does not guarantee positive fund performance, or that a fund will outperform its benchmark index.

For Financial Professional Use Only / Not for Distribution to the Public
Franklin Retirement Payout Funds March 31, 2016
OUR INVESTMENT APPROACH
Gain a thorough understanding of macro and
micro drivers in emerging markets
Templeton Emerging Markets Group is known for its disciplined,
yet flexible, long-term approach to finding undervalued stocks
derived from 30 years of experience. We seek to determine the
underlying value of a business, estimate what that company’s
assets can generate in earnings and cash flow and have the
patience to follow our convictions based on fundamentals, not
market noise. Stock selection drives our portfolio investment
process, reflecting the most compelling opportunities we see.
Starting with an investment universe of more than 23,000 small
cap stocks, we filter out companies that don't meet our basic
criteria for valuation, profitability and organic growth. Given the
varying drivers of stock performance in each country, our analysts
scrutinize the integrity and quality of a country by conducting a
“Country Entry Study” focused on the following:
• Regulatory, accounting standards and taxes
• Banking, monetary, fiscal transparency and foreign
exchange controls
• Compliance to legal framework
• Custodial establishments: registration, trade,
and settlement procedures
• Foreign investment limitations
• Conformity with environmental, social and governmental
(ESG) norms
Our team conducts rigorous analysis to determine whether a stock
is trading at a substantial discount to what our research indicates
the company is worth over a normalized five-year investment
horizon, specifically with regards to price-to-earnings (P/E),
price-to-cash-flow (P/CF), price-to-book-value (P/BV), debt/equity,
and dividend yield. The result is a diversified portfolio of 100–150
securities that is continuously monitored to ensure the fund
reflects our strongest convictions. General characteristics of the
fund include:
• 5-Year Investment Horizon
• 1–6% average stock weighting, with a flexible maximum of 10%
• Average 5%–10% sector allocation, with a typical minimum and
maximum range of 0% to 35%
• Single country allocation typically ranging from 0% to 25%
• Sector and geographic diversification
• Unhedged currency exposure
Where Active Management Aims to Drive Alpha Generation 2
Templeton Emerging Markets Global Presence
Our local presence
enables analysts to
conduct 2,000–2,500
in-person company
visits per year.
WARSAW
SAN MATEO
MEXICO CITY
RIO DE JANEIROHONG KONG
FRANKFURT
MUMBAI
KUALA LUMPUR
SEOUL
DUBAI
LONDON
HO CHI MINH CITY5
BUENOS AIRES
SINGAPORE
VIENNA
BUCHAREST
MOSCOW
BANGKOK
CAPE TOWN
ISTANBUL
SHANGHAI5
5. Joint venture partners with Franklin Templeton Investments.
This is a general depiction of Templeton’s methodology and may not reflect the exact methodology for selecting eligible investments for this particular portfolio.

For Financial Professional Use Only / Not for Distribution to the Public
Franklin Retirement Payout Funds March 31, 2016
0
5
10
15
20
25
2007 2008 2009 2010 2011 2012 2013 2014 2015 2016 YTD
TEMZX
MSCI Emerging Markets Small Cap Index
Return on Equity Consistently Outperformed
the Fund’s Benchmark
As of June 30, 2017
Where Active Management Aims to Drive Alpha Generation 3
TEMZX Index
Data Data
# of Securities 134 1,842
Market Capitalization (Millions USD) 1,966 1,277
Active Share Score 96.2 –
Price/Earnings (12-mo. Trailing) 13.4x 20.7x
P/E using FY1 Estimate 13.5x 13.3x
P/E using FY2 Estimate 12.1x 11.6x
Estimated 3-5 Yr. EPS Growth 16.8x 16.2x
Price/Cash Flow 10.4x 8.0x
Price/Book 1.8x 1.5x
Price/Sales 1.3x 0.8x
ROE 16.6 11.9
Emphasis on attractive valuation, strong
cash flow, and low financial leverage
Evaluating the fund and benchmark characteristics, TEMZX has
a lower 12-month trailing P/E ratio, and stronger estimated 3–5 year
earnings per share (EPS) growth and return on equity (ROE).
We prefer companies with low leverage and strong cash flow, which
may provide a relative margin of safety during periods of credit
shortage. Compared to the benchmark, the fund’s lower long-term
debt to total capital ratio indicates our portfolio companies are less
reliant on long-term debt for permanent financing.
OUTCOME OF OUR RESEARCH EXPERTISE
Portfolio Characterisitcs
TEMZX vs MSCI EM Small Cap Index
Period Ended June 30, 2017
TEMZX posted lower long-term debt to
capital ratios over the majority of the past
10 years than the emerging markets and
emerging markets small cap indexes.
0x
5x
10x
15x
20x
25x
30x
2007 2008 2009 2010 2011 2012 2013 2014 2015 2016 YTD
TEMZX
MSCI Emerging Markets Small Cap Index
MSCI Emerging Markets Index
Focus on Quality Companies: Lower Debt
Long-Term Debt/Capital Ratio
As of June 30, 2017
Source: FactSet and MSCI.
Source: FactSet and MSCI.
Source: FactSet and MSCI.
Information is historical and may not reflect current or future portfolio characteristics. All portfolio holdings are subject to change. The portfolio characteristics listed are based on the Fund’s
underlying holdings and do not necessarily reflect the Fund’s characteristics. Due to data limitations all equity holdings are assumed to be the primary equity issue (usually the ordinary or common shares) of each security’s issuing company. This methodology may cause small differences between the portfolio’s reported characteristics and the portfolio’s actual characteristics. In practice, Franklin Templeton’s portfolio managers invest in the class or type of security that they believe is most appropriate at the time of purchase. The market capitalization figures for both the portfolio and the benchmark are at the security level, not aggregated up to the main issuer. Price to Earnings (12-mo. Trailing) measures the current price to earnings ratio (P/E) relative to the trailing 12 tmonths of reported earnings. Price to Earnings, Price to Cash Flow, Price to Book Value and Price to Sales calculations for the weighted average use harmonic means. Values less than 0.01 (i.e., negative values) are excluded and values in excess of 200x are capped at 200x. Yields above 100% are also excluded. For the benchmark (if applicable), no limits are applied to these ratios in keeping with the benchmark’s calculation methodology. Market capitalization statistics are indicated in the base currency for the portfolio presented. MSCI makes no warranties and shall have no liability with respect to any MSCI data reproduced herein. No further redistribution or use is permitted. This report is not prepared or endorsed by MSCI.
Past performance is not an indicator or a guarantee of future performance.

For Financial Professional Use Only / Not for Distribution to the Public
Franklin Retirement Payout Funds March 31, 2016
STRATEGY IN ACTION
The business landscape of emerging markets has undergone a
transformation from the plain-vanilla business models of the past in
infrastructure and commodities to a new generation of innovative
companies moving into technology and higher value-added goods
and services. The investments below illustrate our investment
process, our local market knowledge and deep due diligence.
MEDY-TOX
Korean Botox Producer
Sector: Health Care
BAJAJ HOLDINGS & INVESTMENTS
Indian Autos and Finance
Sector: Financials
Opportunity: Re-rating and rising turnover
Despite the holding company being a dominant local brand,
Medy-Tox was off-benchmark and under researched in 2009.
Templeton’s team of analysts uncovered its intrinsic value and
invested in the company.
Medy-Tox is one of few companies globally to produce Botox
products, for both medical and cosmetic purposes. Its sales have
grown to over 30% of Korean market share, but only 3% globally.
In order to enter the international market, Medy-Tox has a
licensing agreement with the largest Botox product maker, U.S
company Allergan, which holds 75% of the global market share.
Allergan plans to distribute the next generation of Medy-Tox
products in developed countries once commercialized, with a
projected timeframe of 2017/2018. The company is expanding
capacity with their third factory to be completed in 2019.
Opportunity: Diversified exposure
Bajaj Holdings offers exposure to India's growing consumerism,
covering the auto, insurance, and financial services sectors. The
holding company has primary interests in Bajaj Auto and Bajaj
Finserv, which finances purchase of its own autos and other
consumer goods.
Templeton Emerging Markets Group purchased the security in 2012
when it was trading at nearly a 50% discount to net asset value
(NAV). Our research indicated the weakness in domestic auto sales
is offset by strong export growth in two and three wheelers, primarily
to Africa.
Along with its growth into consumer goods, Bajaj Finserv is
increasing margins through its microlending in rural India. It has
a conservative loan book with nonperforming assets of 0.55%.
However, a slowdown in Nigeria and Egypt has impacted the
exports of Bajaj Auto.
Where Active Management Aims to Drive Alpha Generation 4
The portfolio held 3.42% of total net assets in Bajaj Holdings and Investments and 1.65% of Medy-Tox, respectively, as of June 30, 2017.
This is not a complete analysis of every material fact regarding an industry or security. The actions taken with respect to this stock, and its
performance, may not represent other advice or investments of the Templeton Emerging Markets Group. It should not be assumed that any
securities transactions were or will be profitable. The analysis and opinions of the security discussed herein may change at any time. There is
no assurance that any security purchased will remain in the fund’s portfolio, or that any security sold will not be repurchased. Factual
statements are from sources deemed reliable, but have not been independently verified for completeness or accuracy. These opinions may
not be relied upon as investment advice or recommendations or an offer for a particular security or as an indication of trading intent for any
Franklin Templeton fund.

For Financial Professional Use Only / Not for Distribution to the Public
Franklin Retirement Payout Funds March 31, 2016
Distinctly Different than the Benchmark
The top 10 contributors to performance underscore our commitment
to active management. For the five-year period, several top
contributors were not included in the benchmark index and
all contributors were overweight. Our deep, on-the-ground research
allows us to identify potential opportunities a rules-based algorithm
may not be able to recognize. The majority of our top 10 detractors
represented less than 1% of the portfolio.
Where Active Management Aims to Drive Alpha Generation 5
0.00%
1.00%
2.00%
3.00%
Federal Bank Bajaj Holdings & Investment
Limited
J.K. Cement Ltd. AmorePacific Group, Inc.
Hartalega Holdings Bhd.
Balkrishna Industries Limited
ING Vysya Bank Limited
Vieworks Co., Ltd. Travelsky Technology
Beauty Community PCL
Fu
nd
/Ind
ex W
eig
ht
Average Fund Weight Average Index Weight
ACTIVE INVESTMENT SELECTION
Top 10 Performance Contributors By Average Fund Weight
TEMZX vs MSCI EM Small Cap Index
5-Year Period Ended June 30, 2017
0.00%
1.00%
2.00%
3.00%
4.00%
Pinar Sut Mamulleri Sanayii
Reysas Gayrimenkul
Yatirim Ortakligi
DSG International Thailand
Work Service Bizim Toptan Satis Magazalari
Nostrum Oil & Gas Cia Hering Dixy Group Express Transindo Utama
O'Key Group
Fu
nd
/Ind
ex W
eig
ht
Average Fund Weight Average Index Weight
Top 10 Performance Detractors By Average Fund Weight
TEMZX vs MSCI EM Small Cap Index
5-Year Period Ended June 30, 2017
Total Return 135.36% 127.30% 439.05% 390.00% 206.82% 487.54% 140.28% 562.93% 242.00% 464.91%
Total Return -28.67% -17.06% -60.52% -42.71% -78.65% -71.21% -63.54% -73.32% -93.60% -79.89%
Performance data represents past performance, which does not guarantee future results. Current performance may differ from figures
shown. The Fund’s investment return and principal value will change with market conditions, and investors may have a gain or a loss when
they sell their shares. Please call Franklin Templeton Investments at (800) DIAL BEN/(800) 342-5236 or visit franklintempleton.com for the
most recent month-end performance.
Holdings of the same issuer have been combined. Information is historical and may not reflect current or future portfolio characteristics. All portfolio holdings are subject to change.
Source: FactSet. Data is calculated as a percentage of total including cash and cash equivalents but excluding fixed income. The information provided is not a recommendation to purchase, sell, or hold any particular security. The securities identified do not represent the fund’s entire holdings and in the aggregate may represent only a small percentage of such holdings. There is no assurance that securities purchased will remain in the fund or that securities sold will not be purchased. In addition, it should not be assumed that any securities transactions discussed were or will prove to be profitable. The portfolio manager for the fund reserves the right to withhold release of information with respect to holdings that would otherwise be included.
For Financial Professional Use Only / Not for Distribution to the Public
Franklin Retirement Payout Funds March 31, 2016
RISK AND REWARD
Risk management aims to provide consistency
and compliance
Investors may be concerned about the risks associated with investing
in a lesser-known asset class. We define risk in three ways and aim to
address each of those risks through our investment selection process:
• Stock-specific risk, reflecting those risks that are connected to
individual stocks such as market risk and non-market risk. We
seek to manage stock-specific risk through detailed, in-depth
analysis and in-person meetings with company management.
• Portfolio risk, or the risks associated with inadequate
diversification and lack of adherence to a disciplined portfolio
construction process. Our portfolio management process
includes several forms of risk controls. To seek consistency and
broad diversification, we monitor geographic and sector
exposures as well as individual position sizes.
• Operational risk, or the possibility of loss resulting from failed
internal processes. Franklin Templeton has a large portfolio
compliance team, dedicated performance analysis and
investment risk group, and sophisticated risk management
systems to monitor the risk level of all trades and prevent
prohibited transactions.
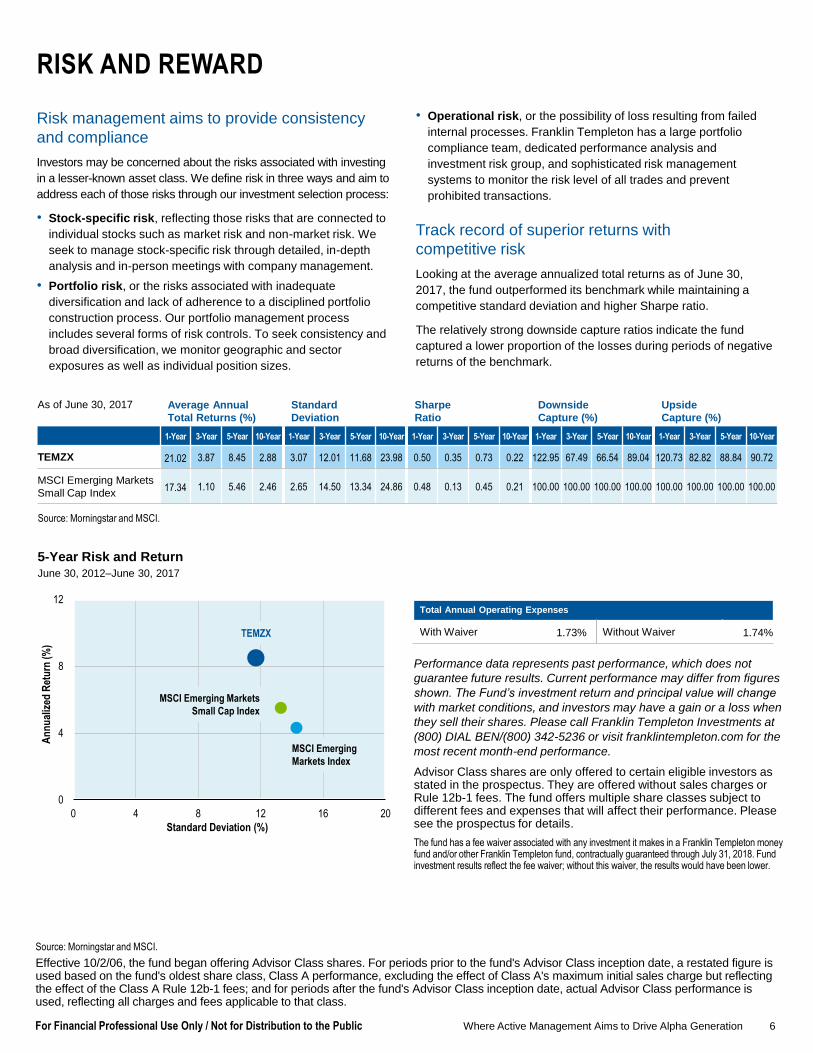
Track record of superior returns with
competitive risk
Looking at the average annualized total returns as of June 30,
2017, the fund outperformed its benchmark while maintaining a
competitive standard deviation and higher Sharpe ratio.
The relatively strong downside capture ratios indicate the fund
captured a lower proportion of the losses during periods of negative
returns of the benchmark.
5-Year Risk and Return
June 30, 2012–June 30, 2017
Where Active Management Aims to Drive Alpha Generation 6
Source: Morningstar and MSCI.
Source: Morningstar and MSCI.
Effective 10/2/06, the fund began offering Advisor Class shares. For periods prior to the fund's Advisor Class inception date, a restated figure is used based on the fund's oldest share class, Class A performance, excluding the effect of Class A's maximum initial sales charge but reflecting the effect of the Class A Rule 12b-1 fees; and for periods after the fund's Advisor Class inception date, actual Advisor Class performance is used, reflecting all charges and fees applicable to that class.
As of June 30, 2017 Average Annual
Total Returns (%)
Standard
Deviation
Sharpe
Ratio
Downside
Capture (%)
Upside
Capture (%)
1-Year 3-Year 5-Year 10-Year 1-Year 3-Year 5-Year 10-Year 1-Year 3-Year 5-Year 10-Year 1-Year 3-Year 5-Year 10-Year 1-Year 3-Year 5-Year 10-Year
TEMZX 21.02 3.87 8.45 2.88 3.07 12.01 11.68 23.98 0.50 0.35 0.73 0.22 122.95 67.49 66.54 89.04 120.73 82.82 88.84 90.72
MSCI Emerging Markets
Small Cap Index17.34 1.10 5.46 2.46 2.65 14.50 13.34 24.86 0.48 0.13 0.45 0.21 100.00 100.00 100.00 100.00 100.00 100.00 100.00 100.00
Performance data represents past performance, which does not
guarantee future results. Current performance may differ from figures
shown. The Fund’s investment return and principal value will change
with market conditions, and investors may have a gain or a loss when
they sell their shares. Please call Franklin Templeton Investments at
(800) DIAL BEN/(800) 342-5236 or visit franklintempleton.com for the
most recent month-end performance.
Advisor Class shares are only offered to certain eligible investors as stated in the prospectus. They are offered without sales charges or Rule 12b-1 fees. The fund offers multiple share classes subject to different fees and expenses that will affect their performance. Please see the prospectus for details.
The fund has a fee waiver associated with any investment it makes in a Franklin Templeton money fund and/or other Franklin Templeton fund, contractually guaranteed through July 31, 2018. Fund investment results reflect the fee waiver; without this waiver, the results would have been lower.
Total Annual Operating Expenses
With Waiver 1.73% Without Waiver 1.74%TEMZX
0
4
8
12
0 4 8 12 16 20
An
nu
aliz
ed R
etu
rn (
%)
Standard Deviation (%)
MSCI Emerging Markets
Small Cap Index
MSCI Emerging
Markets Index

For Financial Professional Use Only / Not for Distribution to the Public
Franklin Retirement Payout Funds March 31, 2016
PORTFOLIO FIT
EM small cap may complement existing
emerging markets exposure
Reflecting on the general long-term success of emerging markets,
as global economies and as an equity asset class, most of these
countries have become ever more integrated into the world
economy. Consequently, their largest and most successful
companies have often expanded beyond domestic markets to
export and invest globally.
By contrast, EM small caps offer the very exposures that enticed
many investors to emerging markets in the first place, with domestic
demand, favorable demographics, local reform initiatives and
innovative niche products often being the primary determinants of
growth. The sectors to which EM small caps investors are exposed
differ notably from those of larger-capitalization stocks, as shown below.
EM small cap exposures are concentrated in higher-growth sectors,
such as consumer discretionary and health care. Such companies
are typically more locally focused and many are relatively dominant
players in smaller industries. The most successful EM small caps will
leverage such local strength to expand internationally, supporting
their transition into mid-or even large-cap companies over time.
Where Active Management Aims to Drive Alpha Generation 7
Broad Geographic Exposure
As of June 30, 2017
Country TEMZX
MSCI Emerging Markets
Small Cap (%)
India 18.27 13.96
China 10.25 20.42
South Korea 10.01 16.38
Taiwan 8.98 17.91
Turkey 4.88 1.16
Vietnam 3.50 0.00
Hong Kong 3.40 0.00
Russia 3.24 0.64
Poland 2.86 1.25
Brazil 2.85 4.46
Egypt 2.63 0.38
Thailand 2.51 3.67
Malaysia 2.00 3.32
Mexico 1.85 3.06
Sri Lanka 1.82 0.00
Czech Republic 1.61 0.12
Indonesia 1.42 2.45
United States 1.42 0.00
United Arab Emirates 1.34 0.59
Philippines 1.22 1.07
Saudi Arabia 1.17 0.00
Switzerland 1.14 0.00
Pakistan 1.06 1.01
Georgia 1.03 0.00
Hungary 0.99 0.11
Fund Benchmark 10 morecountries are covered
by our fund than the
benchmark
Additional Templeton Emerging Market Small Cap holdings as of June 30, 2017: United Kingdom 0.81%, Peru 0.78%, Austria 0.75%, Chile 0.55%, Japan 0.43%, Botswana 0.23%, Nigeria 0.17%, Kuwait 0.04% and Cash & Cash Equivalents 4.79%. Weightings as percent of total. Percentage may not total 100% due to rounding. Information is historical and may not reflect current or future portfolio characteristics. All portfolio holdings are subject to change.
0 5 10 15 20 25
Utilities
Telecom Services
Energy
Real Estate
Materials
Industrials
Consumer Staples
InformationTechnology
Health Care
Financials
ConsumerDiscretionary
TEMZX MSCI Emerging Markets Index
Fund holds
11.5% more than
benchmark
Fund holds
11.3% more than
benchmark
Small Cap Exposure Targets High-Growth Sectors…
As of June 30, 2017
…And Offers Access to More Markets.
Source: FactSet and MSCI.Source: FactSet and MSCI.
For Financial Professional Use Only / Not for Distribution to the Public
Franklin Retirement Payout Funds March 31, 2016
ALLOCATING TO EMERGING MARKETS SMALL CAP
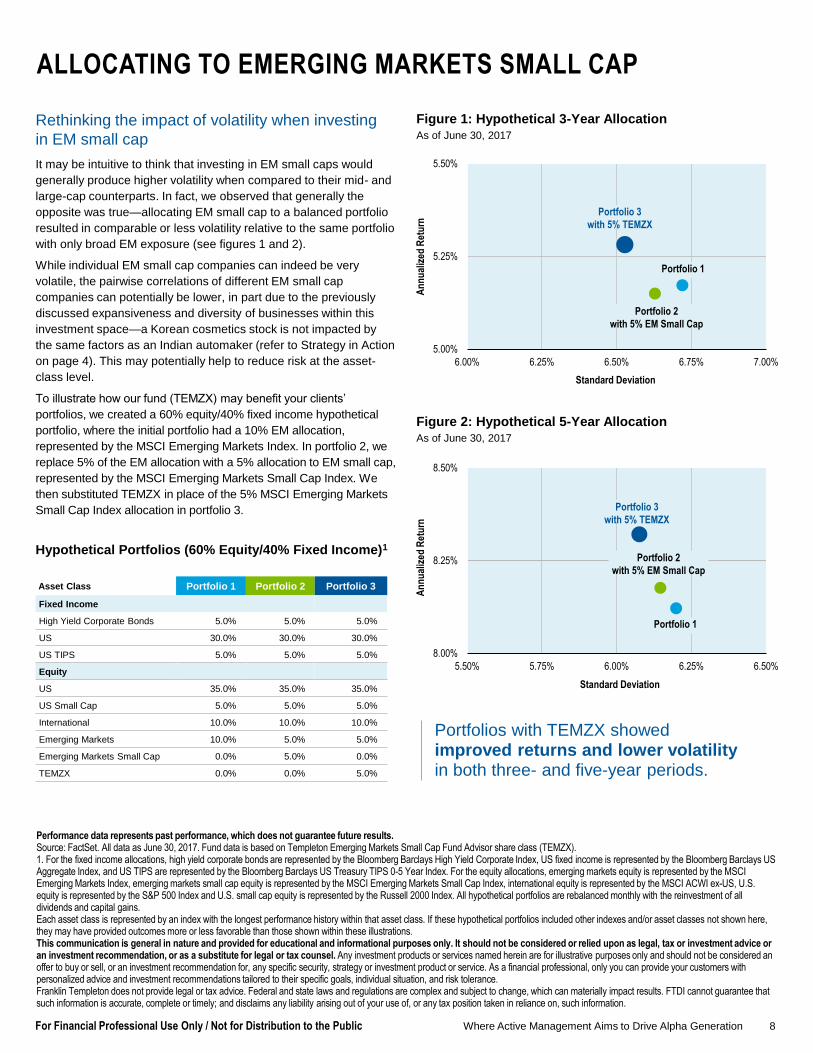
Rethinking the impact of volatility when investing
in EM small cap
It may be intuitive to think that investing in EM small caps would
generally produce higher volatility when compared to their mid- and
large-cap counterparts. In fact, we observed that generally the
opposite was true—allocating EM small cap to a balanced portfolio
resulted in comparable or less volatility relative to the same portfolio
with only broad EM exposure (see figures 1 and 2).
While individual EM small cap companies can indeed be very
volatile, the pairwise correlations of different EM small cap
companies can potentially be lower, in part due to the previously
discussed expansiveness and diversity of businesses within this
investment space—a Korean cosmetics stock is not impacted by
the same factors as an Indian automaker (refer to Strategy in Action
on page 4). This may potentially help to reduce risk at the asset-
class level.
To illustrate how our fund (TEMZX) may benefit your clients’
portfolios, we created a 60% equity/40% fixed income hypothetical
portfolio, where the initial portfolio had a 10% EM allocation,
represented by the MSCI Emerging Markets Index. In portfolio 2, we
replace 5% of the EM allocation with a 5% allocation to EM small cap,
represented by the MSCI Emerging Markets Small Cap Index. We
then substituted TEMZX in place of the 5% MSCI Emerging Markets
Small Cap Index allocation in portfolio 3.
Figure 1: Hypothetical 3-Year Allocation
As of June 30, 2017
Portfolios with TEMZX showed improved returns and lower volatilityin both three- and five-year periods.
Asset Class Portfolio 1 Portfolio 2 Portfolio 3
Fixed Income
High Yield Corporate Bonds 5.0% 5.0% 5.0%
US 30.0% 30.0% 30.0%
US TIPS 5.0% 5.0% 5.0%
Equity
US 35.0% 35.0% 35.0%
US Small Cap 5.0% 5.0% 5.0%
International 10.0% 10.0% 10.0%
Emerging Markets 10.0% 5.0% 5.0%
Emerging Markets Small Cap 0.0% 5.0% 0.0%
TEMZX 0.0% 0.0% 5.0%
Figure 2: Hypothetical 5-Year Allocation
As of June 30, 2017
Performance data represents past performance, which does not guarantee future results. Source: FactSet. All data as June 30, 2017. Fund data is based on Templeton Emerging Markets Small Cap Fund Advisor share class (TEMZX). 1. For the fixed income allocations, high yield corporate bonds are represented by the Bloomberg Barclays High Yield Corporate Index, US fixed income is represented by the Bloomberg Barclays US Aggregate Index, and US TIPS are represented by the Bloomberg Barclays US Treasury TIPS 0-5 Year Index. For the equity allocations, emerging markets equity is represented by the MSCI Emerging Markets Index, emerging markets small cap equity is represented by the MSCI Emerging Markets Small Cap Index, international equity is represented by the MSCI ACWI ex-US, U.S. equity is represented by the S&P 500 Index and U.S. small cap equity is represented by the Russell 2000 Index. All hypothetical portfolios are rebalanced monthly with the reinvestment of all dividends and capital gains.Each asset class is represented by an index with the longest performance history within that asset class. If these hypothetical portfolios included other indexes and/or asset classes not shown here, they may have provided outcomes more or less favorable than those shown within these illustrations.This communication is general in nature and provided for educational and informational purposes only. It should not be considered or relied upon as legal, tax or investment advice or an investment recommendation, or as a substitute for legal or tax counsel. Any investment products or services named herein are for illustrative purposes only and should not be considered an offer to buy or sell, or an investment recommendation for, any specific security, strategy or investment product or service. As a financial professional, only you can provide your customers with personalized advice and investment recommendations tailored to their specific goals, individual situation, and risk tolerance.Franklin Templeton does not provide legal or tax advice. Federal and state laws and regulations are complex and subject to change, which can materially impact results. FTDI cannot guarantee that such information is accurate, complete or timely; and disclaims any liability arising out of your use of, or any tax position taken in reliance on, such information.
Hypothetical Portfolios (60% Equity/40% Fixed Income)1
5.00%
5.25%
5.50%
6.00% 6.25% 6.50% 6.75% 7.00%
Portfolio 3
with 5% TEMZX
Portfolio 1
Portfolio 2
with 5% EM Small Cap
Standard Deviation
An
nu
aliz
ed R
etu
rnA
nn
ual
ized
Ret
urn
Standard Deviation
Where Active Management Aims to Drive Alpha Generation 8
8.00%
8.25%
8.50%
5.50% 5.75% 6.00% 6.25% 6.50%
Portfolio 3
with 5% TEMZX
Portfolio 1
Portfolio 2
with 5% EM Small Cap

For Financial Professional Use Only / Not for Distribution to the Public
Franklin Retirement Payout Funds March 31, 2016
TEMPLETON EMERGING MARKETS GROUP
Local Knowledge, Global Reach
In a sea of overlooked and under-researched companies, there’s no
substitute for local market knowledge. Our on-the-ground investment
team of over 50 portfolio managers and analysts across 20 countries
distinguishes Templeton Emerging Markets Group from the crowd.
Investors benefit from our networks of local business contacts,
access to in-person company visits and real time response to local
market events.
Our global reach through Franklin Templeton Investments provides
access to sophisticated risk management and trading resources.
Portfolio management collaborates closely with the Performance
Analysis and Investment Risk Group, which regularly examines risk
analytics to help identify and address areas of excessive risk
exposure within our portfolios. Franklin Templeton’s worldwide
trading desks allow uninterrupted trading of stocks that trade in
multiple time zones.
Chetan Sehgal, CFA
Portfolio Manager
S IN G A P O R E
Erman Kalkandelen
Senior Research Lead
T U R K E Y
Vikas Chiranewal, CFA
Senior Research Lead
IN D IA
Where Active Management Aims to Drive Alpha Generation 9
50+Portfolio
Managers
& Research
Analysts
15Years on
average of
industry
experience
12Years on
average
with
Templeton
6. As of 31 December, 2016. Based on findings from PwC’s 2017 Benchmark Your Global Fund Distribution Report, which ranks asset managers on the number of countries in which their cross-border funds are distributed. A cross-border fund is one that’s distributed in more than three countries, including its domicile.
7. Joint venture partners with Franklin Templeton Investments.
8.Majority ownership interest.
A truly global organization, Franklin Templeton Investments is the world’s
top cross-border fund management group.6
45RESEARCH
OFFICES
13GLOBAL
TRADING
OFFICES
Americas
Bogota7
Boston
Buenos Aires
Calgary
Coral Gables
Ft. Lauderdale
Los Angeles
Mexico City
Nassau
New York City
Rio de Janeiro
Rancho Cordova
Ridgefield Park
Short Hills
San Mateo
São Paulo
Stamford8
Toronto
Washington, D.C.
Istanbul
Leeds
London
Moscow
Vienna
Warsaw
Europe, Middle East, Africa
Bucharest
Budapest
Cape Town
Dubai
Edinburgh
Frankfurt
Geneva
Asia Pacific
Bangkok
Chennai
Ho Chi Minh City7
Hong Kong
Hyderabad
Kuala Lumpur
Melbourne
Mumbai
Seoul
Shanghai7
Singapore
Sydney
Tokyo
Franklin Templeton’s global
footprint offers local market
knowledge and around-the-
clock trading

TEMSC FL 06/17
Franklin Templeton Distributors, Inc.
One Franklin Parkway
San Mateo, CA 94403-1906
(800) DIAL BEN® / 342-5236
franklintempleton.com
For Financial Professional Use Only / Not For Distribution to the Public.© 2017 Franklin Templeton Investments. All rights reserved.
WHAT ARE THE RISKS
All investments involve risks, including possible loss of principal. Special risks are associated with foreign investing, including currency
fluctuations, economic instability and political developments. Investments in emerging markets, of which frontier markets are a subset,
involve heightened risks related to the same factors, in addition to those associated with these markets’ smaller size, lesser liquidity and
lack of established legal, political, business and social frameworks to support securities markets. Because these frameworks are typically
even less developed in frontier markets, as well as various factors including the increased potential for extreme price volatility, illiquidity,
trade barriers and exchange controls, the risks associated with emerging markets are magnified in frontier markets. Smaller company
stocks have historically had more price volatility than large-company stocks, particularly over the short term. All investments in the fund
should be thought of as long-term investments that could experience significant price volatility in any given year. The fund is designed for
the aggressive portion of a well-diversified portfolio. These and other risk considerations are discussed in the fund’s prospectus.
CFA® and Chartered Financial Analyst® are trademarks owned by CFA Institute
Your clients should carefully consider a fund's investment goals, risks, charges and expenses before investing. They should read the
summary prospectus and/or prospectus carefully before they invest or send money. To obtain a prospectus, which contains this and other
information, please call Franklin Templeton Investments at (800) DIAL BEN/(800) 342-5236.