Embed Size (px)
Citation preview

Wendy J. Dominguez, MBA
PORTFOLIO REVIEW4th Quarter 2015
Rick Rodgers, AIFA®
Prepared by: Josh Bond

THIS PAGE LEFT INTENTIONALLY BLANK
2INTEGRITY. BALANCE. OBJECTIVITY.

INNOVEST AT A GLANCE
—
———
——
——
———
—
——
—
—
——
—
—
—
—
—
—
—
—
—
—
—
—
—
—
—
————
*As of December 2015
Privileged and Confidential
3INTEGRITY. BALANCE. OBJECTIVITY.

Innovest’s History With Boulder Fire & Police
2001 ‐ 2003
2001: First quarterly performance report
2003: Replace the Putnam International Fund with the American Funds Europacific Growth Fund
2007: Replace the Calamos Growth Fund with Allianz CCM Mid Cap Growth & replace the Legg Mason Small Cap Value Fund with the ICM Small Cap Value
2007: Replace 50% of the allocation to the Europacific Growth Fund (REREX) and allocate it to the Dodge & Cox International Fund
2007: Conducted asset allocation study and updated asset allocation
2007: Coordinated the PIMCO share class change to reduce fees
2008: Conducted asset allocation study and updated asset allocation
2009: Add BlackRock High Yield Fund and Eaton Vance Floating Rate Fund
Provided quarterly performance reports and research reports each quarter and met with the Trustees
Updated and reviewed the Investment Policy Statement
Met with representatives from each investment strategy used in the plans
2003 ‐ 2006 2006 – 2009 2009 ‐ 2014
2004: Replace the One Group Mid Cap Growth Fund (OSGIX) with the Calamos Growth Fund
2005: Presented on Alternative Investment Vehicles,Asset Classes & Strategies
2005: Added the PIMCO Commodity Real Return Strategy Fund
2005: Conducted asset allocation study and updated asset allocation
2006: Conducted asset allocation study and updated asset allocation
2010: Replace Managers Cadence MC Inst. (MCMYX) with Munder Mid Cap Growth
2011: Coordinated the Eaton Vance share class change to reduce fees
Provided quarterly performance reports and research reports each quarter and met with the Administrative Committee
2013: Performed RFI for Administration and Record Keeping Services and Audit Services.
2014: Conducted asset allocation study and updated asset allocation
Conducted consultant fee review
Presented core fixed income search
4INTEGRITY. BALANCE. OBJECTIVITY.

Innovest’s History With Boulder Fire & Police
2015: Replaced PIMCO Total Return with Metropolitan West Total Return Bond Fund.
Replaced PIMCO Commodity Real Return with Credit Suisse Commodity Return.
Created an automated, online, and permanent Fiduciary File
2015
5INTEGRITY. BALANCE. OBJECTIVITY.

Performance Over Time
Risk and Return (Since Inception) Asset Allocation
Cumulative Performance over Time
Change in Account ValueLast
QuarterYear To
Date1
Year3
Years5
Years7
YearsSince
InceptionInception
DateBoulder F & P Total Fund 1.93 -3.25 -3.25 6.81 6.34 9.98 9.05 01/01/1985Boulder F & P Custom Benchmark 3.02 -1.26 -1.26 7.52 6.98 10.02 9.55Difference -1.09 -1.99 -1.99 -0.71 -0.64 -0.04 -0.50
Market ValueAs of
10/01/2015
Market ValueAs of
12/31/2015Change
$
Boulder F & P Total Fund 116,035,139 118,384,516 2,349,377
$0 $11,150,317 $22,300,634 $33,450,951 $44,601,268 $55,751,585
VT Retirement Income Advantage
JPMorgan High Yield Select
Met West Total Return
Crdt Suis Comm Rtn Strat
Vantage Trust Plus
Victory Munder Mid Cap Core Growth
ICM Small Company
Eaton Vance Floating Rate; I
Dodge & Cox Int'l
American Funds EuroPacific Gr
Boston Trust Fixed Income - Boulder F&P
Boston Trust Equity - Boulder F&P
$210,331
$2,116,118
$4,292,877
$4,846,113
$7,187,915
$7,224,152
$7,296,884
$7,380,536
$10,544,522
$10,735,829
$12,424,090
$44,125,148
8.5
9.0
9.5
10.0
10.5
11.0
11.5
Ret
urn
(%)
9.0 10.0 11.0 12.0 13.0 14.0 15.0 16.0 17.0Risk (Standard Deviation %)
S&P 500 Index
Boulder F & P Total Fund
Boulder F & P Total Fund Boulder F & P Custom Benchmark
-600 %
0%
600%
1,200%
1,800%
2,400%
3/85 9/86 3/88 9/89 3/91 9/92 3/94 9/95 3/97 9/98 3/00 9/01 3/03 9/04 3/06 9/07 3/09 9/10 3/12 9/13 12/15
Executive SummaryDecember 31, 2015
6INTEGRITY. BALANCE. OBJECTIVITY.
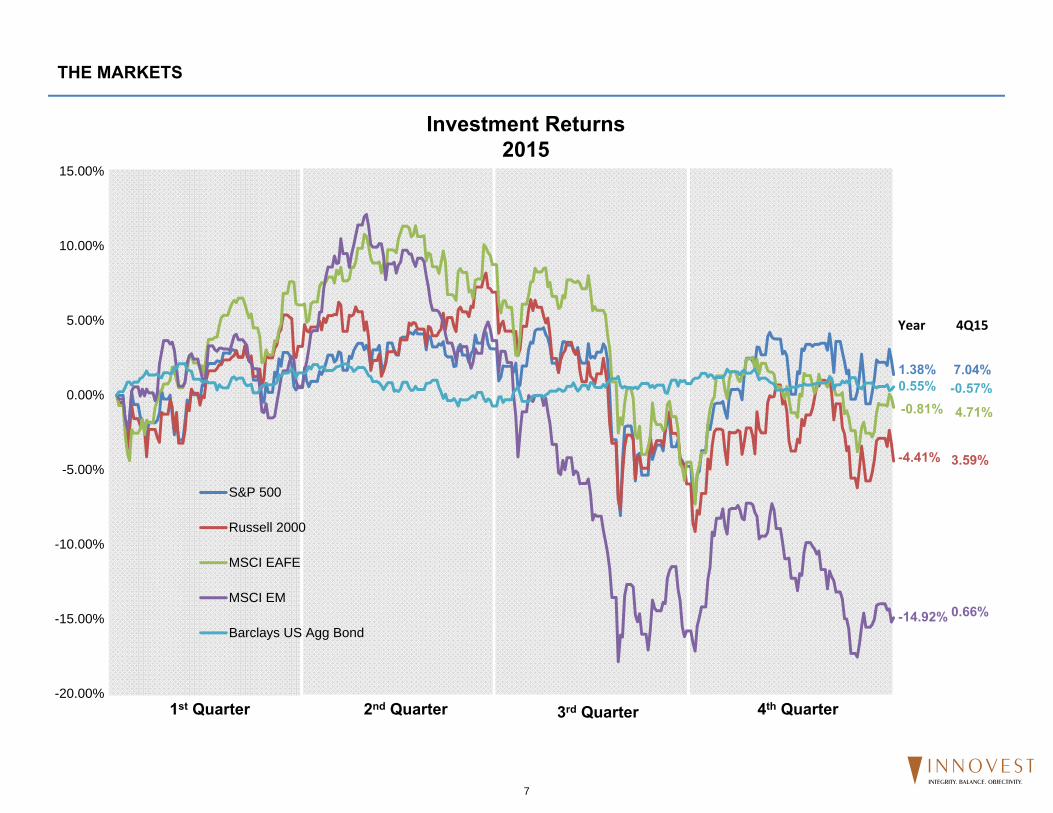
1.38%
-4.41%
-0.81%
-14.92%
0.55%
-20.00%
-15.00%
-10.00%
-5.00%
0.00%
5.00%
10.00%
15.00%
S&P 500
Russell 2000
MSCI EAFE
MSCI EM
Barclays US Agg Bond
Year 4Q15
7.04%-0.57%
4.71%
3.59%
0.66%
THE MARKETS
Investment Returns2015
1st Quarter 2nd Quarter 3rd Quarter 4th Quarter
7INTEGRITY. BALANCE. OBJECTIVITY.
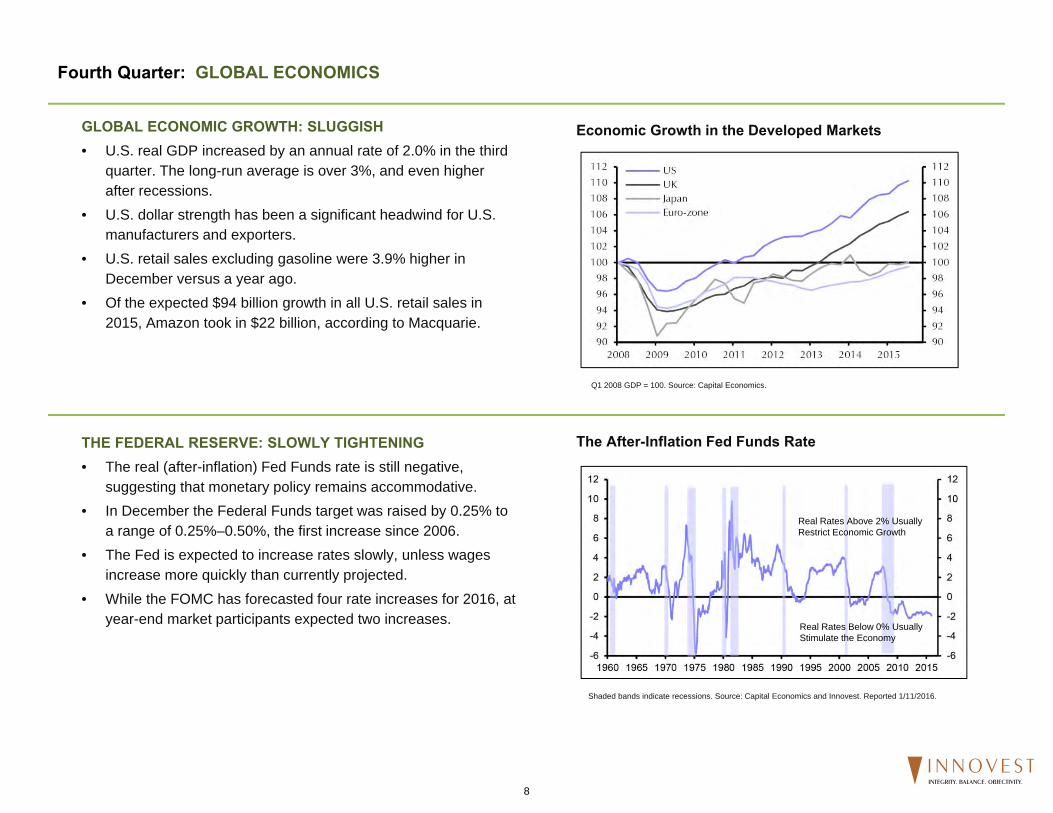
GLOBAL ECONOMIC GROWTH: SLUGGISH• U.S. real GDP increased by an annual rate of 2.0% in the third
quarter. The long-run average is over 3%, and even higher after recessions.
• U.S. dollar strength has been a significant headwind for U.S. manufacturers and exporters.
• U.S. retail sales excluding gasoline were 3.9% higher in December versus a year ago.
• Of the expected $94 billion growth in all U.S. retail sales in 2015, Amazon took in $22 billion, according to Macquarie.
THE FEDERAL RESERVE: SLOWLY TIGHTENING• The real (after-inflation) Fed Funds rate is still negative,
suggesting that monetary policy remains accommodative.• In December the Federal Funds target was raised by 0.25% to
a range of 0.25%–0.50%, the first increase since 2006.• The Fed is expected to increase rates slowly, unless wages
increase more quickly than currently projected. • While the FOMC has forecasted four rate increases for 2016, at
year-end market participants expected two increases.
Fourth Quarter: GLOBAL ECONOMICS
The After-Inflation Fed Funds Rate
Shaded bands indicate recessions. Source: Capital Economics and Innovest. Reported 1/11/2016.
Economic Growth in the Developed Markets
Q1 2008 GDP = 100. Source: Capital Economics.
Real Rates Below 0% Usually Stimulate the Economy
Real Rates Above 2% Usually Restrict Economic Growth
8INTEGRITY. BALANCE. OBJECTIVITY.

GLOBAL ECONOMICS, continued
CHINA: GROWING MORE SLOWLY• Chinese exports fell 1.8% in 2015, while imports declined
13.2%. The People’s Bank of China once again intervened to devalue the yuan to spur exports.
• Volatility in China’s currency and stock markets continued to impact investors’ sentiment throughout the world.
• Increasing labor costs have put downward pressure on Chinese corporate profits; however, higher wages boost consumption.
• China’s nominal level of GDP is now five times the size of what it was 10 years ago.
ENERGY: PRICES KEEP FALLING• Domestic oil production remained high, despite active drilling
rigs having declined by about 70% in the last 18 months.• West Texas Intermediate (WTI) started 2015 at $53 a barrel,
was near $60 at mid-year, and then collapsed to the mid-$30s at year-end.
• Global oil production is unlikely to decline soon, as OPEC has promised high production and Iran plans to pump aggressively.
• Lower gasoline prices in 2015 saved the average American driver about $540, as compared to 2014.
China’s Share of the Global Economy
Less Oil Drilling, Stubbornly High Production
Source: Capital Economics.
Reported 1/4/2016. For commodities, average of consumption of steel, copper, aluminum, zinc, tin, lead, nickel, oil, gas, coal, nuclear, cement, pork and rice. Sources: EIU, BP, World Steel Association, OECD, USGS and J.P. Morgan.
9INTEGRITY. BALANCE. OBJECTIVITY.

STOCKS• In the six previous times that the Fed began to raise short-
term rates, subsequent one-year equity returns varied significantly.
• Developed international equity markets have tended to fare relatively well after the Fed’s previous initial rate hikes.
• The rising U.S. dollar in 2015 dragged down developed markets’ equity returns by 6.6%, and emerging markets equity returns by 9.3%.
• In the third quarter of 2015, S&P 500 earnings fell by 14.1% overall, but rose 3.5% excluding the energy sector.
BONDS• Bonds have provided mixed results subsequent to the six
previous times that the Fed began to raise short-term rates.• The year-end 2.59% yield on the Barclays Aggregate Index
provides little cushion if rates rise across the yield curve.• Taxable bonds in 2015 were challenged by the Fed liftoff,
falling energy prices, and a stronger dollar.• Energy issues pulled down returns on economically sensitive
high yield bonds and floating rate corporate loans.
Fourth Quarter: ASSET CLASS FUNDAMENTALS
Data are from the six rising Fed Funds rate cycles from 1983 to 2005. *The one-year municipal bond returns are based on the four most recent rising-rate periods; the one-year high-yield bond returns are based on the five most recent rising-rate periods; and the one-year floating rate corporate bond returns are based on the three most recent rising-rate periods. Past performance is no indication of future performance. Sources: Morningstar and Innovest.
Data are from the six rising Fed Funds rate cycles from 1983 to 2005. *The one-year emerging markets equity returns are based on the two most recent rising-rate periods. Past performance is no indication of future performance. Sources: Morningstar and Innovest.
Bonds: Average One-Year Returns After Initial Fed Rate Hikes
Stocks: Average One-Year Returns After Initial Fed Rate Hikes
5.4% 2.7%
20.8%22.2%
‐20.0%
‐10.0%
0.0%
10.0%
20.0%
30.0%
40.0%
Large Cap U.S.Stocks
Small Cap U.S.Stocks
InternationalDevelopedStocks
EmergingMarkets Stocks*
3.0% 2.7% 3.5%
6.1%
‐4.0%‐2.0%
0.0%2.0%4.0%6.0%
8.0%10.0%12.0%
Core Fixed Income Municipal FixedIncome*
High Yield FixedIncome*
Floating RateCorporate Loans*
10INTEGRITY. BALANCE. OBJECTIVITY.

ASSET CLASS FUNDAMENTALS, continued
COMMODITIES• Most commodity prices finished 2015 near their 10-year
lows.• The prices of energy and industrial metals tumbled amid
concerns that China would not be able to absorb high and rising supply.
• China accounts for more than 30% of global consumption of many metals, cotton, rice, and soybean oil.
• McDonald’s reintroduced “The McRib” for a limited time, following a decline in pork prices.
MIDSTREAM ENERGY MLPs• According to Advisory Research, MLPs are currently priced
at a significant discount to their fair valuation.• Factors in the pullback in MLP prices included tax-loss
selling, oil and natural gas price weakness, concerns about MLPs’ growth prospects, and their access to capital markets.
• In the third quarter, 82 midstream companies announced third-quarter distributions that were, on average, 2.0% higher than the second quarter of 2015.
• At year-end, midstream MLPs yielded an average of 8.5%.
Commodity Prices: Near 10-Year Lows
A Z-score is a statistical measurement of a score’s relationship to the mean in a group of scores. Z-scores are calculated using daily prices over the past 10 years. Data are as of 12/31/15. Sources: FactSet and J.P. Morgan Asset Management.
Universe: all energy MLPs, excluding variable pay MLPs. Valuation inputs include yield, EV/Ebitda multiples, and the yield spread to the U.S. Corporate BB bond as of 12/31/2015. Sources: FactSet and Advisory Research.
MLPs: Significantly Undervalued
11INTEGRITY. BALANCE. OBJECTIVITY.

US Market Indices Performance US Market Sector Performance
Source: Investment Metrics, LLC
Source: Investment Metrics, LLCSource: Investment Metrics, LLC
S&P 500 Index Russell 2000 Index MSCI EAFE Index MSCI Emerging Markets Index
Barclays Capital Aggregate BC Municipal Bond Barclays U.S. Corp: High Yield S&P/LSTA Leveraged Loan Index
Alerian MLP Infrastructure DJ-UBS Commodity Index HFRI FoF Composite Index
0.0
15.0
-15.0
-30.0
-45.0
Re
turn
(%)
1
Quarter
1
Year
0.6
-0.4
-10.5
-24.7
-1.6
-31.7
-2.1-0.7
-2.1-4.5
1.53.3
-0.6
0.50.7
-14.6
4.7
-0.4
3.6
-4.4
7.0
1.4
S&P 500 S&P 500 Growth S&P 500 Value
Russell Midcap Index Russell Midcap Growth Index Russell Midcap Value Index
Russell 2000 Index Russell 2000 Growth Index Russell 2000 Value Index
0.0
6.0
12.0
-6.0
-12.0
Re
turn
(%)
1
Quarter
1
Year
2.9
-7.5
4.3
-1.4
3.6
-4.4
3.1
-4.8
4.1
-0.2
3.6
-2.4
6.1
-3.1
7.9
5.5
7.0
1.4
S&P 500 Consumer Discretionary S&P 500 Consumer Staples S&P 500 Energy
S&P 500 Financials S&P 500 Health Care S&P 500 Industrials
S&P 500 Information Technology S&P 500 Materials S&P 500 Telecom Services
S&P 500 Utilities
0.0
15.0
30.0
-15.0
-30.0
Re
turn
(%)
1
Quarter
1
Year
1.1
-4.8
7.63.4
9.7
-8.4
9.25.9
8.0
-2.5
9.26.96.0
-1.5
0.2
-21.1
7.6 6.65.8
10.1
Quarterly Market Summary December 31, 2015
Copyright © 2015 Investment Metrics, LLC. All rights reserved.
12INTEGRITY. BALANCE. OBJECTIVITY.

Intl Equity Region Performance Alternative Asset Class Performance
Fixed Income Market Sector Performance
Source: Investment Metrics, LLC
Source: Investment Metrics, LLCSource: Investment Metrics, LLC
Barclays U.S. Aggregate Barclays U.S. Treasury Barclays U.S. Credit Index Barclays U.S. Corp: High Yield
S&P/LSTA Leveraged Loan Barclays Global Aggregate JPM EMBI Global (USD)
0.0
3.0
-3.0
-6.0
Re
turn
(%)
1
Quarter
1
Year
1.51.2
-0.9
-3.2
-2.1
-0.7
-2.1
-4.5
-0.5-0.8-0.9
0.8
-0.6
0.5
HFRI Fund of Funds Composite Index S&P Developed Property
Bloomberg Commodity Index Total Return Alerian MLP Index
0.0
15.0
-15.0
-30.0
-45.0
Re
turn
(%)
1
Quarter
1
Year
-2.8
-32.6
-10.5
-24.7
4.70.90.6
-0.4
MSCI Japan MSCI Pacific ex Japan MSCI United Kingdom
MSCI Europe ex U.K. MSCI Emerging Markets
0.0
10.0
20.0
-10.0
-20.0
-30.0
Re
turn
(%)
1
Quarter
1
Year
0.7
-14.6
3.3
0.10.7
-7.5
8.3
-8.4
9.4 9.9
Quarterly Market Summary December 31, 2015
Copyright © 2015 Investment Metrics, LLC. All rights reserved.
13INTEGRITY. BALANCE. OBJECTIVITY.
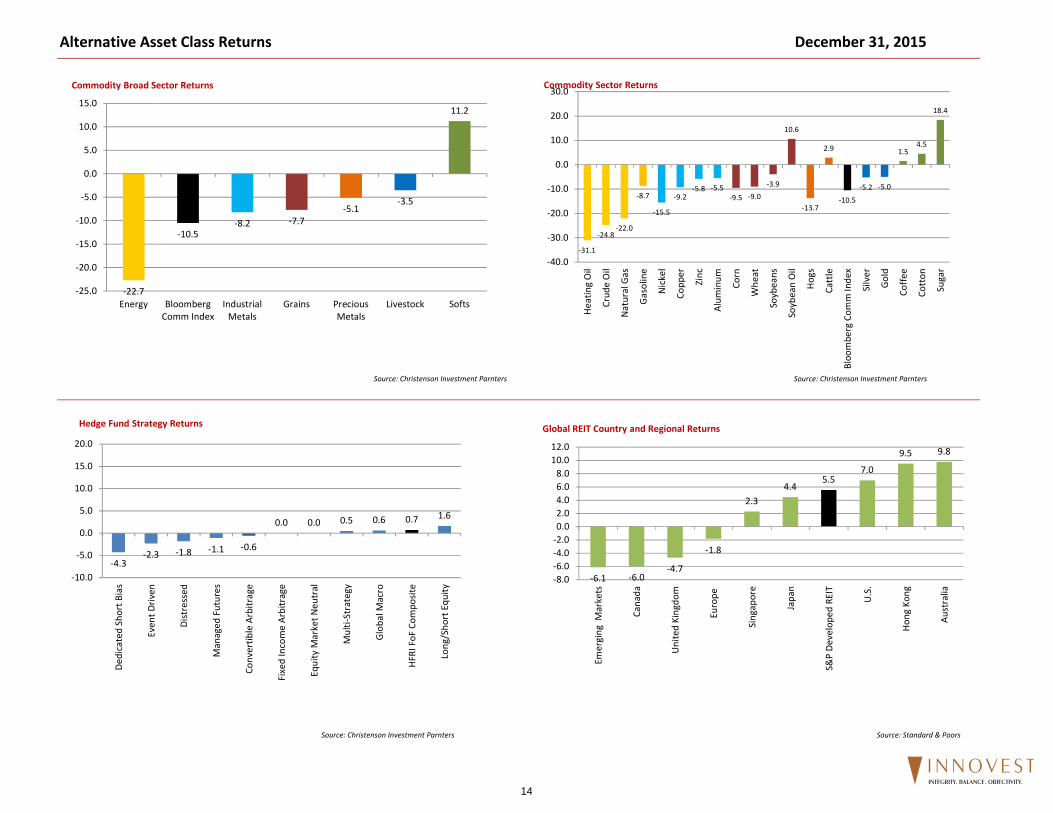
Alternative Asset Class Returns December 31, 2015
Source: Christenson Investment Parnters Source: Christenson Investment Parnters
Source: Christenson Investment Parnters Source: Standard & Poors
‐31.1
‐24.8‐22.0
‐8.7
‐15.5
‐9.2‐5.8 ‐5.5
‐9.5 ‐9.0‐3.9
10.6
‐13.7
2.9
‐10.5
‐5.2 ‐5.0
1.54.5
18.4
‐40.0
‐30.0
‐20.0
‐10.0
0.0
10.0
20.0
30.0
Heatin
g Oil
Crud
e Oil
Natural Gas
Gasoline
Nickel
Copp
er
Zinc
Alum
inum Corn
Whe
at
Soybeans
Soybean Oil
Hogs
Cattle
Bloo
mbe
rg Com
m Inde
x
Silver
Gold
Coffe
e
Cotton
Sugar
Commodity Sector Returns
‐22.7
‐10.5‐8.2 ‐7.7
‐5.1‐3.5
11.2
‐25.0
‐20.0
‐15.0
‐10.0
‐5.0
0.0
5.0
10.0
15.0
Energy BloombergComm Index
IndustrialMetals
Grains PreciousMetals
Livestock Softs
Commodity Broad Sector Returns
‐4.3‐2.3 ‐1.8 ‐1.1 ‐0.6
0.0 0.0 0.5 0.6 0.7 1.6
‐10.0
‐5.0
0.0
5.0
10.0
15.0
20.0
Dedicated Short B
ias
Even
t Driv
en
Distressed
Managed
Futures
Convertib
le Arbitrage
Fixed Income Arbitrage
Equity M
arket N
eutral
Multi‐Strategy
Globa
l Macro
HFRI FoF
Com
posite
Long/Sho
rt Equ
ity
Hedge Fund Strategy Returns
‐6.1 ‐6.0‐4.7
‐1.8
2.34.4
5.57.0
9.5 9.8
‐8.0‐6.0‐4.0‐2.00.02.04.06.08.0
10.012.0
Emerging
Markets
Canada
United Kingdo
m
Europe
Singap
ore
Japa
n
S&P De
velope
d RE
IT
U.S.
Hon
g Ko
ng
Australia
Global REIT Country and Regional Returns
14INTEGRITY. BALANCE. OBJECTIVITY.

ASSET CLASS FUNDAMENTALS, continued
2006 2007 2008 2009 2010 2011 2012 2013 2014 2015
HighREITs 35.97 %
Commodities16.23 %
Fixed Income5.24 %
Int'l Stocks31.78 %
REITs 28.60 %
REITs 9.24 %
REITs 17.59 %
Smal l Cap Stocks38.82 %
REITs 31.78 %
REITs 4.23 %
REITs 7.31%
REITs 26.28%
High
Int'l Stocks26.34 %
Int'l Stocks11.17 %
Hedge Funds‐21.37 %
REITs 28.60 %
Smal l Cap Stocks26.85 %
Fixed Income7.84 %
Int'l Stocks17.32 %
Large Cap Stocks32.38 %
Large Cap Stocks13.69 %
Large Cap Stocks1.38 %
Large Cap Stocks7.31%
Smal l Cap Stocks19.70%
Smal l Cap Stocks18.37 %
Hedge Funds10.25 %
Divers i fed Portfol io‐24.23%
Smal l Cap Stocks27.17 %
Commodi es16.83 %
Large Cap Stocks2.11 %
Smal l Cap Stocks16.35 %
Int'l Stocks22.78%
Fixed Income5.97 %
Fixed Income0.55 %
Smal l Cap Stocks6.80%
Int'l Stocks18.41%
Large Cap Stocks15.79 %
Fixed Income6.97 %
Smal l Cap Stocks‐33.79 %
Large Cap Stocks26.46 %
Large Cap Stocks15.06 %
Divers i fied Portfol io‐0.50%
Large Cap Stocks16.00 %
Divers i fied Portfol io14.79%
Divers i fied Portfol io5.47%
Hedge Funds‐0.36%
Divers i fied Portfol io4.86%
Commodities18.09%
Divers i fied Portfol io13.25 %
Divers i fied Portfol io6.64 %
Commodities‐35.65 %
Divers i fied Portfol io19.48%
Divers i fied Portfol io12.25%
Smal l Cap Stocks‐4.18 %
Divers i fied Portfol io10.27%
Hedge Funds8.81 %
Smal l Cap Stocks4.89 %
Int'l Stocks‐0.81%
Fixed Income4.52%
Large Cap Stocks15.00%
Hedge Funds10.39 %
Large Cap Stocks5.49 %
Large Cap Stocks‐37.00 %
Commodi es18.91 %
Int'l Stocks7.75 %
Hedge Funds‐5.72 %
Hedge Funds5.28 %
REITs 1.86 %
Hedge Funds3.19%
Divers i fied Portfol io‐1.15%
Int'l Stocks3.03%
Divers i fied Portfol io9.59%
Fixed Income4.34 %
Smal l Cap Stocks‐1.57 %
REITs ‐39.20 %
Hedge Funds11.47 %
Fixed Income6.54 %
Int'l Stocks‐12.14 %
Fixed Income4.21 %
Fixed Income‐2.02 %
Int'l Stocks‐4.90%
Smal l Cap Stocks‐4.41%
Hedge Funds 2.26%
Hedge Funds5.45%
LowCommodi es
2.07 %REITs
‐17.55 %Int'l Stocks‐43.38 %
Fixed Income5.93 %
Hedge Funds5.70 %
Commodities‐13.32 %
Commodities‐1.06 %
Commodi es‐9.53 %
Commodi es‐17.01 %
Commodi es‐24.66%
Commodities ‐6.43%
Fixed Income3.21%
Low
Divers i fied Portfol io: 25% Large Cap Stocks , 10% Smal l Cap Stocks , 12% International Stocks , 25% Fixed Income, 3% REITs , 20% Hedge Funds , and 5% Commodities .
Periodic Table of Returns 2006 ‐ 2015
Avg Annual Returns '06‐'15
Avg Annual Risk
'06‐'15
Indices : Large Cap Stocks (S&P 500), Smal l Cap Stock (Russel l 2000), Int'l Stocks (MSCI EAFE), Fixed Income (Barclays Aggregate), REITs (DJ‐Wilshire REIT), Hedge Funds (HFRI Fund of Funds Compos ite), and Commodities (Bloomberg Commodity).
15INTEGRITY. BALANCE. OBJECTIVITY.

Client Type: Money Purchase Pension PlanTime Horizon: Greater than Five YearsExpected Return: 3.75% to 4.75% over CPIRisk Tolerances: Expected downside of -17.8% to -20.8% per year based on a statistical confidence level of 95% (1)
Asset Allocation Performance Benchmarks
Strategic Asset Investment Primary Peer GroupLower Limit Allocation Upper Limit Category Manager Index Universe
Domestic Equity Domestic Equity Large Cap Equity* 32.00% 35.00% 38.00% Large Cap Boston Tr Eqty S&P 500 Core Equity
Mid Cap Growth 3.50% 6.50% 9.50% Mid Cap Growth Victory Munder MC Core Gr Russell Mid Cap Index Mid Cap Growth Small Cap Value 3.50% 6.50% 9.50% Small Cap Value ICM Sm Cap Value Russell 2000 Index Small Cap Value
International Equity 16.00% 19.00% 22.00% International Equity Europacific R-4 MSCI EAFE International GrowthDodge & Cox Intl MSCI EAFE International Value
Domestic Fixed Income* 12.00% 15.00% 18.00% Domestic Fixed Income Boston Tr Fixed Inc BC Aggregate Core Bond1.00% 4.00% 7.00% MetWest Total Return BC Aggregate Core Bond
High Yield 0.00% 2.00% 5.00% High Yield JP Morgan HY BC:HY Credit High Yield
Floating Rate Corporate Loans 4.00% 7.00% 10.00% Floating Rate Corporate Loans Eaton Vance Floating CSFB Leveraged Loan Loan Participation
Commodities 2.00% 5.00% 8.00% Commodities Credit Suisse Commodity Bloomberg Commodity N/A100.00%
Total Portfolio Strategic Benchmark: 50.00% 70% S&P 500/30% BC Aggregate6.50% Russell Mid Cap Index 6.50% Russell 2000 Index
19.00% MSCI EAFE4.00% BC Aggregate2.00% BC:HY Credit 7.00% CSFB Leveraged Loan5.00% Bloomberg Commodity
100.00%
Total Portfolio Secondary Benchmark: CPI + 4.75%
*Balanced allocation to Boston Trust is 50% of the portfolio which is split 70% to large cap equity and 30% to domestic fixed income
INVESTMENT POLICY SUMMARY
Client Variables
(1) There is a 5% probability that the 1 year modeled loss of -17.8% to -20.8% will be exceeded. Risk tolerances are based on 2015 capital markets assumptions. NOTE: The 1 year modeled loss will vary from year to year depending on future capital market assumptions.
16INTEGRITY. BALANCE. OBJECTIVITY.

Boulder Fire & PoliceAverage plan assets $118,384,516Estimated Investment, Recordkeeping and Administrative Costs 0.57%Estimated Total Plan Expenses 0.67%
Weighted average (bps)
Employer Paid Employee Paid TotalAsset based fee retained by funds 48 -$ 572,146$ 572,146$ Revenue sharing paid to plan provider 14 -$ 168,970$ 168,970$ Per participant fee 0 -$ -$ -$ Administration/Recordkeeping fee 0 -$ -$ -$ Custodial/Trust fees 0 -$ -$ -$ Direct participant paid fees
Loan origination 0 -$ -$ -$ Loan maintenance 0 -$ -$ -$ QDRO 0 -$ -$ -$ Miscellaneous 0 -$ -$ -$
Rebate to plan -6 -$ (68,344)$ (68,344)$
Total Investment, Recordkeeping and Administrative Costs 57 -$ 672,773$ 672,773$
Third party plan paid feesInvestment Consultant 6 37,135$ 37,135$ 74,269$
Operating BudgetAudit 1 9,000$ -$ 9,000$ Trustee Education 1 10,500$ -$ 10,500$ Insurance 1 9,000$ -$ 9,000$ Miscellaneous Expenses 0 1,500$ -$ 1,500$ Legal 2 20,000$ -$ 20,000$
Total Plan Expenses 67 87,135$ 709,908$ 797,042$
Total Plan Expenses in Basis Points 7 60 67
Fee review reflects an estimate for the following time period ending: 12/31/2015
Benchmarking: The plan's estimated investment, recordkeeping and administrative costs of 0.57% as shown above, compare favorably to 401(k) Source data, a universe of 49 similarly sized 401(k) plans with an average investment, recordkeeping and administrative cost of 1.12%
Dollars ($)
Total Plan Expenses
Annual Fee Review
17INTEGRITY. BALANCE. OBJECTIVITY.

September 30, 2015
Allocation Differences
0.0% 4.0% 8.0%-4.0 %-8.0 %
Commodities
Floating Rate Corporate Loans
High Yield
Fixed Income
International Equity
Small Cap Equity
Mid Cap Equity
Large Cap Equity
-0.4 %
0.3%
0.0%
-3.1 %
-1.4 %
-0.2 %
-0.3 %
5.0%
December 31, 2015
Allocation Differences
0.0% 4.0% 8.0% 12.0%-4.0 %-8.0 %
Commodities
Floating Rate Corporate Loans
High Yield
Fixed Income
International Equity
Small Cap Equity
Mid Cap Equity
Large Cap Equity
-0.6 %
-0.4 %
-0.1 %
-3.9 %
0.2%
0.1%
0.0%
4.8%
September 30, 2015Market Value
($)Allocation
(%)Target
(%)Large Cap Equity 43,249,709 40.02 35.00Mid Cap Equity 6,718,803 6.22 6.50Small Cap Equity 6,785,733 6.28 6.50International Equity 19,020,970 17.60 19.00Fixed Income 17,148,253 15.87 19.00High Yield 2,190,391 2.03 2.00Floating Rate Corporate Loans 7,935,477 7.34 7.00Commodities 5,009,026 4.64 5.00Total Fund 108,058,361 100.00 100.00
December 31, 2015Market Value
($)Allocation
(%)Target
(%)Large Cap Equity 44,125,148 39.76 35.00Mid Cap Equity 7,224,152 6.51 6.50Small Cap Equity 7,296,884 6.57 6.50International Equity 21,280,351 19.17 19.00Fixed Income 16,716,967 15.06 19.00High Yield 2,116,118 1.91 2.00Floating Rate Corporate Loans 7,380,536 6.65 7.00Commodities 4,846,113 4.37 5.00Total Fund 110,986,269 100.00 100.00
Asset Allocation vs. Target Allocation
18INTEGRITY. BALANCE. OBJECTIVITY.

AllocationMarketValue
($)%
Performance(%)
LastQuarter
YearTo Date
1Year
3Years
5Years
10Years
SinceInnovestInception
SinceInception
InceptionDate
Large Cap EquityBoston Trust Equity - Boulder F&P 44,125,148 37.27 5.11 -0.95 -0.95 13.44 10.68 7.56 6.65 10.37 07/01/1990S&P 500 Index 7.04 1.38 1.38 15.13 12.57 7.31 5.00 9.35IM U.S. Large Cap Equity (MF) Median 6.29 0.00 0.00 13.84 11.14 6.49 4.51 8.98
Mid Cap EquityVictory Munder Mid Cap Core Growth 7,224,152 6.10 1.43 -4.36 -4.36 12.11 10.15 7.53 8.15 12.57 01/01/2010Russell Midcap Growth Index 4.12 -0.20 -0.20 14.88 11.54 8.16 5.85 13.89IM U.S. Mid Cap Growth Equity (MF) Median 2.87 -0.49 -0.49 13.14 9.78 7.35 5.44 12.24
Small Cap EquityICM Small Company 7,296,884 6.16 3.44 -3.20 -3.20 10.68 8.57 7.13 9.34 6.18 01/01/2008Russell 2000 Value Index 2.88 -7.47 -7.47 9.06 7.67 5.57 8.17 5.58IM U.S. Small Cap Value Equity (MF) Median 2.52 -7.07 -7.07 9.05 7.81 5.51 8.91 5.51
International EquityDodge & Cox Int'l 10,544,522 8.91 0.83 -11.35 -11.35 3.87 2.65 3.83 N/A 0.23 01/01/2008MSCI EAFE Value Index (Net) 2.68 -5.68 -5.68 3.14 2.55 1.96 3.64 -1.60IM International Large Cap Value Equity (MF) Median 2.61 -2.64 -2.64 2.97 2.07 2.48 2.82 -1.95
American Funds EuroPacific Gr 10,735,829 9.07 2.87 -0.82 -0.82 5.08 3.62 4.58 N/A 6.62 04/01/2004MSCI EAFE Growth Index (Net) 6.67 4.09 4.09 6.83 4.60 4.03 3.32 5.51IM International Large Cap Growth Equity (MF) Median 4.40 -0.57 -0.57 4.15 3.31 4.21 4.27 6.24
Fixed IncomeBoston Trust Fixed Income - Boulder F&P 12,424,090 10.49 -0.54 1.68 1.68 1.05 2.97 4.36 5.08 5.96 07/01/1990Barclays Aggregate Index -0.57 0.55 0.55 1.44 3.25 4.52 4.97 6.27IM U.S. Broad Market Core Fixed Income (MF) Median -0.64 0.01 0.01 1.10 3.14 4.26 4.69 6.17
Met West Total Return 4,292,877 3.63 -0.40 0.29 0.29 2.22 4.69 6.38 6.31 0.29 01/01/2015Barclays Aggregate Index -0.57 0.55 0.55 1.44 3.25 4.52 4.97 0.55IM U.S. Broad Market Core Fixed Income (MF) Median -0.64 0.01 0.01 1.10 3.14 4.26 4.69 0.01
High YieldJPMorgan High Yield Select 2,116,118 1.79 -2.03 -4.54 -4.54 1.58 4.31 6.50 7.18 5.97 01/01/2010Barclays US Corp: High Yield -2.07 -4.47 -4.47 1.69 5.04 6.96 7.59 6.65IM U.S. High Yield Bonds (MF) Median -1.80 -3.96 -3.96 1.36 4.19 5.62 6.38 5.78
Floating Rate Corporate LoansEaton Vance Floating Rate; I 7,380,536 6.23 -2.26 -1.63 -1.63 1.24 2.85 3.42 N/A 8.08 04/01/2009Credit Suisse Leveraged Loan Index -1.97 -0.39 -0.39 2.58 3.75 4.08 4.44 8.98Loan Participation Mutual Funds Median -2.19 -1.53 -1.53 0.99 2.57 2.99 3.48 7.20
Table of ReturnsDecember 31, 2015
Returns prior to 7/1990 provided by PMC
19INTEGRITY. BALANCE. OBJECTIVITY.

Table of ReturnsDecember 31, 2015
AllocationMarketValue
($)%
Performance(%)
LastQuarter
YearTo Date
1Year
3Years
5Years
10Years
SinceInnovestInception
SinceInception
InceptionDate
CommoditiesCrdt Suis Comm Rtn Strat 4,846,113 4.09 -10.34 -24.96 -24.96 -17.49 -13.52 -6.46 N/A -24.96 01/01/2015Bloomberg Commodity Index Total Return -10.52 -24.66 -24.66 -17.29 -13.47 -6.43 -1.03 -24.66IM Commodities General (MF) Median -9.97 -24.78 -24.78 -17.69 -12.99 -6.46 N/A -24.78
Balanced AccountBoston Trust Balanced - Boulder F&P 56,549,237 47.77 3.74 -0.59 -0.59 10.76 9.12 7.18 6.72 9.92 07/01/199070% S&P/30% BC Aggr 4.77 1.34 1.34 10.99 9.87 6.73 5.27 8.67IM U.S. Balanced (SA+CF) Median 3.13 -1.18 -1.18 8.03 7.95 6.29 6.11 8.76
VT Retirement Income Advantage 210,331 0.18 2.85 -1.10 -1.10 5.88 5.44 N/A N/A 4.56 04/01/2013VT Retirement Income Advantage Custom Index 3.50 0.88 0.88 7.57 6.96 N/A N/A 6.21IM U.S. Balanced (SA+CF) Median 3.13 -1.18 -1.18 8.03 7.95 6.29 6.11 6.06
Stable ValueVantage Trust Plus (gross) 7,187,915 6.07 0.57 2.34 2.34 2.44 2.77 3.72 4.16 3.48 07/01/2007Vantage Trust Plus (net) 0.43 1.77 1.77 1.87 2.20 3.18 N/A 2.93Ryan 3 Yr GIC Master Index 0.31 1.16 1.16 1.09 1.43 2.82 3.45 2.61IM U.S. GIC/Stable Value (SA+CF) Median 0.46 1.81 1.81 1.68 2.15 3.07 3.96 2.81
Total FundBoulder Fire and Police 118,384,516 100.00 1.93 -3.25 -3.25 6.81 6.34 5.99 6.21 9.05 01/01/1985Boulder Fire & Police Custom Benchmark 3.02 -1.26 -1.26 7.52 6.98 5.58 5.39 9.55CPI +4.75% 0.56 5.51 5.51 5.79 6.36 6.69 6.92 7.52
Returns prior to 7/1990 provided by PMC
20INTEGRITY. BALANCE. OBJECTIVITY.
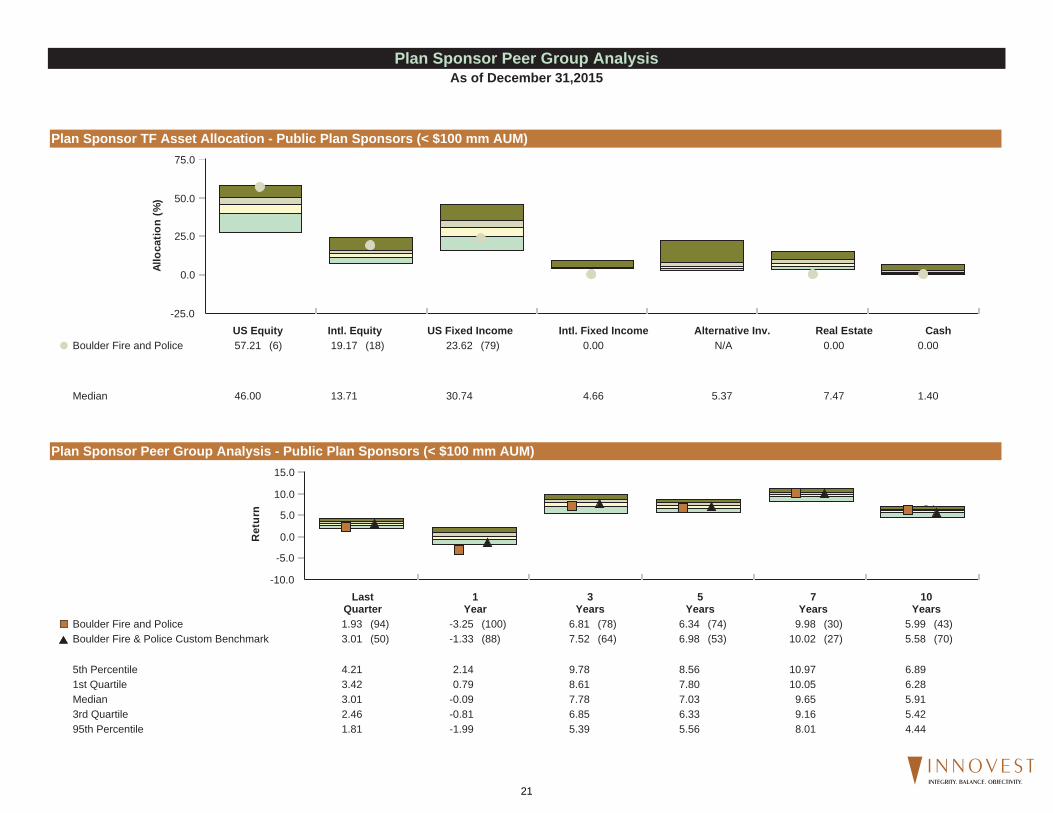
Plan Sponsor TF Asset Allocation - Public Plan Sponsors (< $100 mm AUM)
Plan Sponsor Peer Group Analysis - Public Plan Sponsors (< $100 mm AUM)
-25.0
0.0
25.0
50.0
75.0Al
loca
tion
(%)
US Equity Intl. Equity US Fixed Income Intl. Fixed Income Alternative Inv. Real Estate CashBoulder Fire and Police 57.21 (6) 19.17 (18) 23.62 (79) 0.00 N/A 0.00 0.00
5th Percentile 57.94 24.10 46.21 8.93 22.26 14.70 6.591st Quartile 50.66 15.81 35.83 4.94 7.85 10.08 2.57
Median 46.00 13.71 30.74 4.66 5.37 7.47 1.403rd Quartile 40.15 11.20 24.60 4.29 3.97 5.07 0.6995th Percentile 27.29 7.57 15.63 3.83 2.71 3.26 0.05
-10.0
-5.0
0.0
5.0
10.0
15.0
Ret
urn
1.82.5
-2.0-0.8
5.46.9
5.66.38.09.2
4.45.4
LastQuarter
1Year
3Years
5Years
7Years
10Years
Boulder Fire and Police 1.93 (94) -3.25 (100) 6.81 (78) 6.34 (74) 9.98 (30) 5.99 (43)
Boulder Fire & Police Custom Benchmark 3.01 (50) -1.33 (88) 7.52 (64) 6.98 (53) 10.02 (27) 5.58 (70)
5th Percentile 4.21 2.14 9.78 8.56 10.97 6.891st Quartile 3.42 0.79 8.61 7.80 10.05 6.28Median 3.01 -0.09 7.78 7.03 9.65 5.913rd Quartile 2.46 -0.81 6.85 6.33 9.16 5.4295th Percentile 1.81 -1.99 5.39 5.56 8.01 4.44
Plan Sponsor Peer Group AnalysisAs of December 31,2015
21INTEGRITY. BALANCE. OBJECTIVITY.

Plan Sponsor TF Asset Allocation - Public Plan Sponors ($100mm - $1 Bln AUM)
Plan Sponsor Peer Group Analysis - All Public Plans ($100mm - $500mm AUM)
-25.0
0.0
25.0
50.0
75.0Al
loca
tion
(%)
US Equity Intl. Equity US Fixed Income Intl. Fixed Income Alternative Inv. Real Estate CashBoulder Fire and Police 57.21 (4) 19.17 (43) 23.62 (49) 0.00 N/A 0.00 0.00
5th Percentile 54.24 29.52 39.55 15.68 29.24 14.32 5.811st Quartile 46.85 22.41 31.43 6.20 17.23 11.23 1.85
Median 38.06 17.97 23.24 5.27 11.93 8.72 0.993rd Quartile 30.55 13.92 17.17 4.41 4.12 5.52 0.5495th Percentile 21.73 8.01 11.44 1.93 1.47 2.53 0.02
-10.0
-4.0
2.0
8.0
14.0
20.0
Ret
urn
1.42.6
-2.4-1.0
3.46.3
4.46.4 7.9
9.5
4.25.6
LastQuarter
1Year
3Years
5Years
7Years
10Years
Boulder Fire and Police 1.93 (89) -3.25 (100) 6.81 (72) 6.34 (76) 9.98 (60) 5.99 (45)
Boulder Fire & Police Custom Benchmark 3.01 (45) -1.33 (77) 7.52 (61) 6.98 (71) 10.02 (60) 5.58 (79)
5th Percentile 4.00 2.54 10.20 9.21 11.83 7.031st Quartile 3.46 0.99 8.87 8.15 10.92 6.25Median 2.96 0.07 8.10 7.32 10.20 5.873rd Quartile 2.58 -0.96 6.31 6.38 9.50 5.6395th Percentile 1.39 -2.39 3.42 4.37 7.88 4.21
Plan Sponsor Peer Group AnalysisAs of December 31,2015
22INTEGRITY. BALANCE. OBJECTIVITY.

Cumulative Performance Over Time
Risk and Return
Boulder Fire and Police Boulder Fire & Police Custom Benchmark CPI + 4.75%
-500 %
0%
500%
1,000%
1,500%
2,000%
2,500%
3/85 9/86 3/88 9/89 3/91 9/92 3/94 9/95 3/97 9/98 3/00 9/01 3/03 9/04 3/06 9/07 3/09 9/10 3/12 9/13 12/15
8
9
10
11
12
Ret
urn
(%)
8 9 10 11 12 13 14 15 16 17 18 19Risk (Standard Deviation %)
Boulder Fire and Police
S&P 500 Index
Total Portfolio Performance AnalysisAs of December 31,2015
23INTEGRITY. BALANCE. OBJECTIVITY.

THIS PAGE LEFT INTENTIONALLY BLANK
24INTEGRITY. BALANCE. OBJECTIVITY.
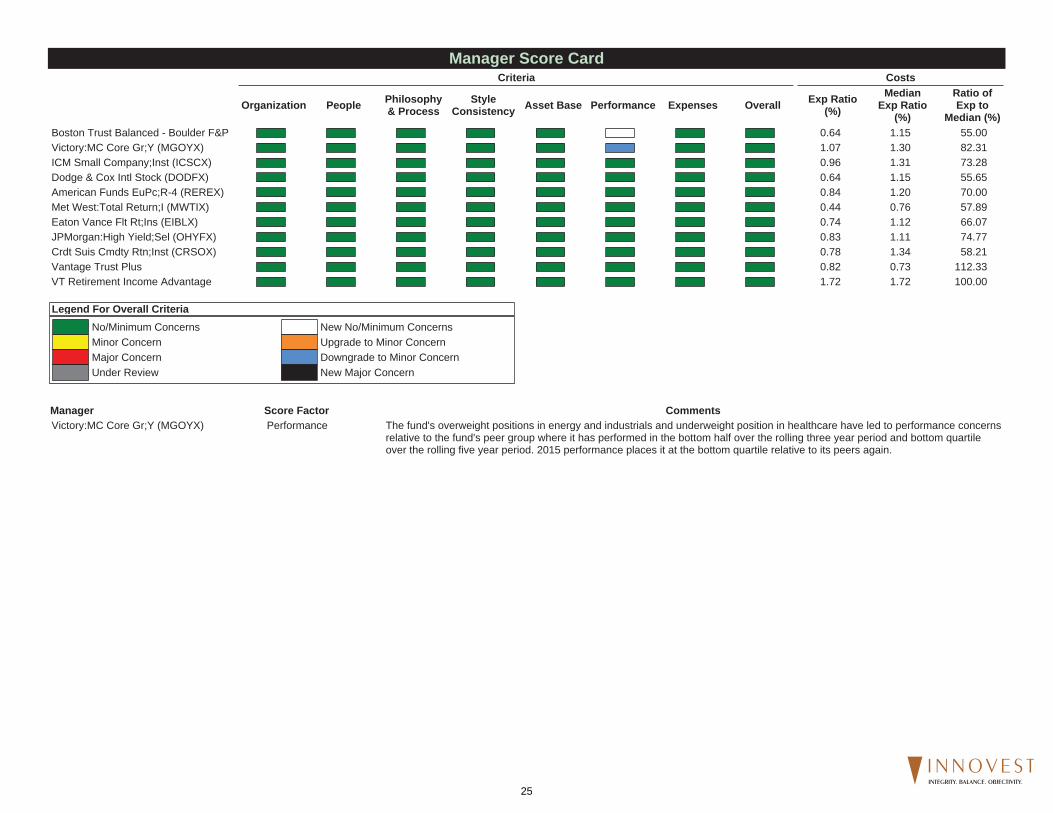
Criteria
Organization People Philosophy& Process
StyleConsistency Asset Base Performance Expenses Overall
Costs
Exp Ratio(%)
MedianExp Ratio
(%)
Ratio ofExp to
Median (%)Boston Trust Balanced - Boulder F&P 0.64 1.15 55.00Victory:MC Core Gr;Y (MGOYX) 1.07 1.30 82.31ICM Small Company;Inst (ICSCX) 0.96 1.31 73.28Dodge & Cox Intl Stock (DODFX) 0.64 1.15 55.65American Funds EuPc;R-4 (REREX) 0.84 1.20 70.00Met West:Total Return;I (MWTIX) 0.44 0.76 57.89Eaton Vance Flt Rt;Ins (EIBLX) 0.74 1.12 66.07JPMorgan:High Yield;Sel (OHYFX) 0.83 1.11 74.77Crdt Suis Cmdty Rtn;Inst (CRSOX) 0.78 1.34 58.21Vantage Trust Plus 0.82 0.73 112.33VT Retirement Income Advantage 1.72 1.72 100.00
Legend For Overall CriteriaNo/Minimum ConcernsMinor ConcernMajor ConcernUnder Review
New No/Minimum ConcernsUpgrade to Minor ConcernDowngrade to Minor ConcernNew Major Concern
Manager Score Factor CommentsVictory:MC Core Gr;Y (MGOYX) Performance The fund's overweight positions in energy and industrials and underweight position in healthcare have led to performance concerns
relative to the fund's peer group where it has performed in the bottom half over the rolling three year period and bottom quartileover the rolling five year period. 2015 performance places it at the bottom quartile relative to its peers again.
Manager Score Card
25INTEGRITY. BALANCE. OBJECTIVITY.

THIS PAGE LEFT INTENTIONALLY BLANK
26INTEGRITY. BALANCE. OBJECTIVITY.

STRATEGY INFORMATION
ROLLING 3 YEAR RETURN AND PERCENTILE RANKINGS
PEER GROUP ANALYSIS - IM U.S. Balanced (SA+CF)
CALENDAR YEAR RETURNS AND PERCENTILE RANKINGS
RISK VS. RETURN (5 YEARS*)
*If less than 5 years, data is since account inception.
Firm and Management:Domenic Colasacco is a portfoliomanager and president of the Adviser.Mr. Colasacco is also the president ofBoston Trust & InvestmentManagement Company and has servedas its Chief Investment Officer since1980. Mr. Colasacco managesportfolios for individual and institutionalclients and also manages the BostonTrust Equity Fund. Mr. Colasacco is aholder of the Chartered FinancialAnalyst (CFA) designation and amember of the Boston SecurityAnalysts Society.
Investment Strategy:The strategy strives to provide long-term growth of capital through adiversified portfolio of stocks, bondsand money market investments. Theallocation among these assets isactively managed based both on theirrelative values and the changingeconomic outlook. By forecastingfinancial market returns across a widerange of possible economic scenarios,they vary the allocation in a mannerthat is designed to provide protectionagainst falling markets in unfavorableeconomic environments, while alsoproviding opportunity to participate inrising markets. The strategy providesbroad diversification across stockmarket sectors; individual equityselections focus on companies withsuperior financial track records.
-20.0
-12.0
-4.0
4.0
12.0
20.0
Ret
urn
LastQuarter
YearTo Date
1Year
3Years
5Years
7Years
10Years
Boston Tr Bal - Boulder F&P 3.74 (29) -0.59 (44) -0.59 (44) 10.76 (15) 9.12 (18) 10.99 (40) 7.18 (26)
70% S&P/30% BC Aggr 4.77 (13) 1.34 (18) 1.34 (18) 10.99 (13) 9.87 (7) 11.75 (21) 6.73 (35)
Median 3.13 -1.18 -1.18 8.03 7.95 10.32 6.29
-8.0
-4.0
0.0
4.0
8.0
12.0
16.0
Ret
urn
(%)
0.0 4.0 8.0 12.0 16.0Risk (Standard Deviation %)
Return StandardDeviation
Boston Tr Bal - Boulder F&P 9.12 8.79
70% S&P/30% BC Aggr 9.87 8.41
Median 7.95 9.03
2014 2013 2012 2011 2010 2009 2008Boston Tr Bal - Boulder F&P 11.13 (12) 23.02 (24) 10.04 (72) 3.45 (24) 14.13 (27) 17.53 (77) -20.93 (38)IM U.S. Balanced (SA+CF) Median 7.08 18.94 11.13 1.51 12.41 20.67 -22.51
70% S&P/30% BC Aggr 11.39 (10) 21.12 (30) 12.49 (35) 4.08 (21) 12.92 (40) 20.44 (52) -26.03 (75)IM U.S. Balanced (SA+CF) Median 7.08 18.94 11.13 1.51 12.41 20.67 -22.51
3Years
EndingDec-2015
3Years
EndingDec-2014
3Years
EndingDec-2013
3Years
EndingDec-2012
3Years
EndingDec-2011
3Years
EndingDec-2010
3Years
EndingDec-2009
Boston Tr Bal - Boulder F&P 10.76 (15) 14.58 (25) 11.88 (19) 9.12 (22) 11.54 (47) 1.98 (39) 1.13 (28)IM U.S. Balanced (SA+CF) Median 8.03 12.98 10.63 8.51 11.39 1.44 0.11
70% S&P/30% BC Aggr 10.99 (13) 14.92 (23) 12.35 (14) 9.75 (13) 12.28 (39) 0.20 (69) -1.87 (81)IM U.S. Balanced (SA+CF) Median 8.03 12.98 10.63 8.51 11.39 1.44 0.11
Boston Tr Bal - Boulder F&P 12/31/15
27INTEGRITY. BALANCE. OBJECTIVITY.

STRATEGY INFORMATION
ROLLING 3 YEAR RETURN AND PERCENTILE RANKINGS
PEER GROUP ANALYSIS - IM U.S. Large Cap Core Equity (SA+CF)
CALENDAR YEAR RETURNS AND PERCENTILE RANKINGS
RISK VS. RETURN (5 YEARS*)
*If less than 5 years, data is since account inception.
Firm and Management:Domenic Colasacco is a portfoliomanager and president of the Adviser.Mr. Colasacco is also the president ofBoston Trust & InvestmentManagement Company and has servedas its Chief Investment Officer since1980. Mr. Colasacco managesportfolios for individual and institutionalclients and also manages the BostonTrust Equity Fund. Mr. Colasacco is aholder of the Chartered FinancialAnalyst (CFA) designation and amember of the Boston SecurityAnalysts Society.
Investment Strategy:The portfolio consists of stocks from allmarket capitalizations; small, mediumand large. The portfolio is constructedwith a bottom up approach to securityselection, however, macro themes areconsidered in deciding which sectorslook most attractive. Each potentialholding is put through a number ofscreens which consider earningsgrowth and relative valuation.
-12.0
-4.0
4.0
12.0
20.0
28.0
Ret
urn
LastQuarter
YearTo Date
1Year
3Years
5Years
7Years
10Years
Boston TrEq - Boulder F&P 5.11 (73) -0.95 (76) -0.95 (76) 13.44 (78) 10.68 (81) 13.40 (83) 7.56 (59)
S&P 500 Index 7.04 (25) 1.38 (51) 1.38 (51) 15.13 (53) 12.57 (53) 14.81 (57) 7.31 (70)
Median 5.94 1.39 1.39 15.26 12.63 14.94 7.75
3.0
6.0
9.0
12.0
15.0
18.0
Ret
urn
(%)
0.0 5.0 10.0 15.0 20.0Risk (Standard Deviation %)
Return StandardDeviation
Boston TrEq - Boulder F&P 10.68 11.98
S&P 500 Index 12.57 12.46
Median 12.63 13.04
2014 2013 2012 2011 2010 2009 2008Boston TrEq - Boulder F&P 13.00 (57) 30.44 (78) 12.03 (85) 1.56 (56) 16.91 (24) 24.19 (65) -30.73 (17)IM U.S. Large Cap Core Equity (SA+CF) Median 13.41 33.21 15.66 1.98 14.80 26.53 -35.97
S&P 500 Index 13.69 (45) 32.39 (60) 16.00 (46) 2.11 (50) 15.06 (44) 26.46 (51) -37.00 (62)IM U.S. Large Cap Core Equity (SA+CF) Median 13.41 33.21 15.66 1.98 14.80 26.53 -35.97
3Years
EndingDec-2015
3Years
EndingDec-2014
3Years
EndingDec-2013
3Years
EndingDec-2012
3Years
EndingDec-2011
3Years
EndingDec-2010
3Years
EndingDec-2009
Boston TrEq - Boulder F&P 13.44 (78) 18.20 (80) 14.06 (82) 9.97 (65) 13.82 (56) 0.19 (18) -1.29 (17)IM U.S. Large Cap Core Equity (SA+CF) Median 15.26 20.69 16.37 10.67 14.08 -1.83 -4.31
S&P 500 Index 15.13 (53) 20.41 (57) 16.18 (56) 10.87 (48) 14.11 (49) -2.85 (69) -5.63 (74)IM U.S. Large Cap Core Equity (SA+CF) Median 15.26 20.69 16.37 10.67 14.08 -1.83 -4.31
Boston TrEq - Boulder F&P 12/31/15
28INTEGRITY. BALANCE. OBJECTIVITY.

TOP TEN HOLDINGS PORTFOLIO CHARACTERISTICS
DISTRIBUTION OF MARKET CAP SECTOR DISTRIBUTION
PortfolioWeight
(%)
BenchmarkWeight
(%)
ActiveWeight
(%)
QuarterlyReturn
(%)Microsoft Corp 3.01 2.48 0.53 26.20Apple Inc 2.95 3.28 -0.33 -4.16Nike Inc 2.76 0.47 2.29 1.90Johnson & Johnson 2.48 1.59 0.89 10.843M Co 2.32 0.52 1.80 6.95Express Scripts Holding Co 2.21 0.33 1.88 7.97Exxon Mobil Corp 2.10 1.81 0.29 5.78Alphabet Inc 2.10 1.26 0.84 24.73Comcast Corp 2.08 0.77 1.31 -0.38Accenture PLC 2.06 0.36 1.70 7.49
% of Portfolio 24.07 12.87
Portfolio BenchmarkWtd. Avg. Mkt. Cap ($) 121,396,213,136 137,341,633,345Median Mkt. Cap ($) 59,113,285,160 17,668,607,200Price/Earnings ratio 19.71 19.30Price/Book ratio 3.22 3.105 Yr. EPS Growth Rate (%) 7.89 7.89Current Yield (%) 1.97 2.17Beta (5 Years, Monthly) 0.95 1.00Number of Stocks 69 504
Boston Trust Equity - Composite S&P 500 Index
0.0
15.0
30.0
45.0
60.0
>100 Bil 75 Bil - 100 Bil 25 Bil - 75 Bil 15 Bil - 25 Bil 2 Bil - 15 Bil 0 - 2 Bil
44.4
7.2
27.8
9.8 10.8
0.0
32.6
8.8
31.1
11.2
16.3
0.0
Boston Trust Equity - Composite
S&P 500 Index
0.0 5.0 10.0 15.0 20.0 25.0
Utilities
Telecommunication Services
Materials
Information Technology
Industrials
Health Care
Financials
Energy
Consumer Staples
Consumer Discretionary
2.0
0.0
3.4
19.5
12.3
17.1
16.9
5.3
11.6
12.1
3.0
2.4
2.8
20.7
10.0
15.2
16.5
6.5
10.1
12.9
Boston Trust Equity - Composite 12/31/15
29INTEGRITY. BALANCE. OBJECTIVITY.

PERFORMANCE - 1 Quarter TOTAL ATTRIBUTION - 1 Quarter
ACTIVE RETURN - 1 Quarter
Boston Trust Equity - Composite
S&P 500 Index
0.0 5.0 10.0 15.0 20.0-5.0-10.0
Utilities
Telecommunication Services
Materials
Information Technology
Industrials
Health Care
Financials
Energy
Consumer Staples
Consumer Discretionary
-4.1
7.1
11.6
7.8
2.8
9.4
5.6
5.6
4.5
-1.2
1.1
7.6
9.9
9.0
8.1
9.2
6.0
0.2
7.6
5.8
0.0 0.4 0.8-0.4-0.8-1.2-1.6
Utilities
Telecommunication Services
Materials
Information Technology
Industrials
Health Care
Financials
Energy
Consumer Staples
Consumer Discretionary
-0.1
0.0
0.0
-0.2
-0.7
0.0
0.0
0.4
-0.4
-1.0
Buy-and-Hold Portfolio 5.01Portfolio Trading 0.37Actual Return 5.39Benchmark Return 7.04Actual Active Return -1.66
Stock Selection -1.77Sector Selection 0.14Interaction -0.36Total Selection -1.99
Portfolio Trading 0.37Benchmark Trading 0.04Active Trading Impact 0.33
Buy & Hold Active Return -1.66
Boston Trust Equity - Composite 12/31/15
30INTEGRITY. BALANCE. OBJECTIVITY.

PERFORMANCE - 3 Years TOTAL ATTRIBUTION - 3 Years
ACTIVE RETURN - 3 Years
Boston Trust Equity - Composite
S&P 500 Index
0.0 8.0 16.0 24.0 32.0-8.0-16.0
Utilities
Telecommunication Services
Materials
Information Technology
Industrials
Health Care
Financials
Energy
Consumer Staples
Consumer Discretionary
2.7
7.1
18.2
15.1
7.5
18.0
15.0
-1.1
9.8
19.8
11.5
5.7
7.3
17.9
14.7
23.5
15.5
-3.1
16.0
20.0
0.0 0.4 0.8 1.2-0.4-0.8-1.2-1.6
Utilities
Telecommunication Services
Materials
Information Technology
Industrials
Health Care
Financials
Energy
Consumer Staples
Consumer Discretionary
0.1
0.2
0.5
-0.6
-1.1
-0.6
-0.1
0.2
-0.8
0.0
Buy-and-Hold Portfolio 12.95Portfolio Trading 0.42Actual Return 13.37Benchmark Return 15.13Actual Active Return -1.76
Stock Selection -2.09Sector Selection 0.23Interaction -0.31Total Selection -2.16
Portfolio Trading 0.42Benchmark Trading 0.01Active Trading Impact 0.41
Buy & Hold Active Return -1.76
Boston Trust Equity - Composite 12/31/15
31INTEGRITY. BALANCE. OBJECTIVITY.

STRATEGY INFORMATION
ROLLING 3 YEAR RETURN AND PERCENTILE RANKINGS
PEER GROUP ANALYSIS - IM U.S. Fixed Income (SA+CF)
CALENDAR YEAR RETURNS AND PERCENTILE RANKINGS
RISK VS. RETURN (5 YEARS*)
*If less than 5 years, data is since account inception.
Firm and Management:Domenic Colasacco is a portfoliomanager and president of the Adviser.Mr. Colasacco is also the president ofBoston Trust & InvestmentManagement Company and has servedas its Chief Investment Officer since1980. Mr. Colasacco managesportfolios for individual and institutionalclients and also manages the BostonTrust Equity Fund. Mr. Colasacco is aholder of the Chartered FinancialAnalyst (CFA) designation and amember of the Boston SecurityAnalysts Society.
Investment Strategy:Boston Trust's approach to fixedincome investing combines top downeconomic scenario forecasts withbottom up fundamental research. Usingmacroeconomic-based quantitativetools, the investment team forecastsinterest rate changes for a range ofpossible economic outcomes. Theseforecasts contribute to portfoliostrategies with respect to interest ratesand the yield curve. In selectingindividual securities, Boston Trustapplies long-held standards for superiorfinancial quality, appropriate risk, anddiversification.
-10.0
-5.0
0.0
5.0
10.0
15.0
20.0
Ret
urn
LastQuarter
YearTo Date
1Year
3Years
5Years
7Years
10Years
Boston Tr FI - Boulder F&P -0.54 (61) 1.68 (14) 1.68 (14) 1.05 (82) 2.97 (72) 3.75 (76) 4.36 (68)
Barclays Agg -0.57 (63) 0.55 (55) 0.55 (55) 1.44 (66) 3.25 (66) 4.09 (72) 4.52 (64)
Median -0.43 0.69 0.69 1.77 3.86 5.29 4.88
-3.0
0.0
3.0
6.0
9.0
Ret
urn
(%)
-4.0 0.0 4.0 8.0 12.0 16.0Risk (Standard Deviation %)
Return StandardDeviation
Boston Tr FI - Boulder F&P 2.97 2.58
Barclays Agg 3.25 2.79
Median 3.86 2.80
2014 2013 2012 2011 2010 2009 2008Boston Tr FI - Boulder F&P 3.71 (58) -2.15 (84) 4.08 (75) 7.76 (33) 6.55 (65) 4.93 (83) 5.33 (23)IM U.S. Fixed Income (SA+CF) Median 4.42 -0.25 6.83 6.41 7.59 10.53 1.31
Barclays Agg 5.97 (36) -2.02 (81) 4.21 (74) 7.84 (32) 6.54 (65) 5.93 (78) 5.24 (24)IM U.S. Fixed Income (SA+CF) Median 4.42 -0.25 6.83 6.41 7.59 10.53 1.31
3Years
EndingDec-2015
3Years
EndingDec-2014
3Years
EndingDec-2013
3Years
EndingDec-2012
3Years
EndingDec-2011
3Years
EndingDec-2010
3Years
EndingDec-2009
Boston Tr FI - Boulder F&P 1.05 (82) 1.84 (83) 3.15 (74) 6.12 (67) 6.41 (73) 5.60 (64) 6.22 (42)IM U.S. Fixed Income (SA+CF) Median 1.77 3.88 4.30 7.19 8.76 6.33 5.84
Barclays Agg 1.44 (66) 2.66 (70) 3.26 (72) 6.19 (66) 6.77 (69) 5.90 (59) 6.04 (46)IM U.S. Fixed Income (SA+CF) Median 1.77 3.88 4.30 7.19 8.76 6.33 5.84
Boston Tr FI - Boulder F&P 12/31/15
32INTEGRITY. BALANCE. OBJECTIVITY.

TOP TEN HOLDINGS
PORTFOLIO CHARACTERISTICS vs. Barclays Aggregate Index
CREDIT QUALITY DISTRIBUTION vs. Barclays Aggregate Index
SECTOR DISTRIBUTION vs. Barclays Aggregate Index
MATURITY DISTRIBUTION vs. Barclays Aggregate Index
Portfolio BenchmarkEffective Duration 5.40 5.68Avg. Maturity 6.55 7.94Avg. Quality AA Aa2Yield To Maturity (%) 2.18 2.51Holdings Count 25 9,720
Boston Trust Fixed Income - Boulder F&P Barclays Aggregate Index
0.0
15.0
30.0
45.0
60.0
75.0
US Tr e
asurie
s
A gencie
sM BS
A BS
CM BSC re
di t
Other
0.0 0.0 0.0 0.0 0.0 0.0 0.0
7.4
57.2
3.10.0 0.0
28.2
4.1
Boston Trust Fixed Income - Boulder F&PCompany %
FED HOME LN 2.875% 6/14/24 2.27FED HOME LN MTG 2.375% 1/13/22 2.26FED NAT MTG ASSN 2.625% 9/6/24 1.80TREASURY INFL IDX .625% 01/15/ 1.43FED FARM CR BKS 3.500% 12/20/2 0.95FED HOME LOAN BANK 2.250% 3/11 0.90FHLB 2.750% 12/13/24 0.89PRINCETON UNIVERSITY 4.950% 03 0.79HUBBELL INC 5.950% 6 0.77FED NATL MTG ASSN 1.875% 02/19 0.72
Boston Trust Fixed Income - Boulder F&P Barclays Aggregate Index
0.0
20.0
40.0
60.0
80.0
100.0
A AA AA AB BB BB NR
72.4
3.7
10.713.2
0.0 0.0
68.6
0.0
24.0
4.20.0
3.2
Boston Trust Fixed Income - Boulder F&P Barclays Aggregate Index
0.0
20.0
40.0
60.0
80.0
100.0
0 to
3 Y ea
rs
3 to
5 Y ea
rs
6 to
10 Y ea
rs
11 to
20 Y ea
rs
20+ Y ea
rs
22.226.6
36.7
3.3
11.215.5 16.5
64.9
0.13.0
Boston Trust Fixed Income - Boulder F&P 12/31/15
33INTEGRITY. BALANCE. OBJECTIVITY.

FUND INFORMATION
ROLLING 3 YEAR RETURN AND PERCENTILE RANKINGS
PEER GROUP ANALYSIS - IM U.S. Mid Cap Growth Equity (MF)
CALENDAR YEAR RETURNS AND PERCENTILE RANKINGS
RISK VS. RETURN (5 YEARS*)
*If less than 5 years, data is since inception of fund share class.
Firm and Management:Tony Dong has been the lead managerhere since February 2001. He's workedat Munder since 1988 and managedlarge-cap, growth-at-a-reasonable pricestrategies before taking over this fund.He's backed here by four comanagers:Andy Mui, Brian Matuszak, GeorgeSanders, and Geoffrey Wilson.
Investment Strategy:The Munder team seek companies thattrade cheaply relative to their growthprospects, using a broad range ofvaluation measures. They keep theFund's sector weightings within 3percentage points of those of the fund'sbenchmark, the S&P Midcap 400 Index.They'll typically hold 70-100 stocks andcap position sizes at 3%. And they'rerelatively patient investors; portfolioturnover has averaged around 50%.
Innovest's Assessment:Munder’s low beta bias is likely tooutperform during market drawdownsand when quality growth companies arein favor. Underperformance is expectedwhen low quality, high beta companiesoutpace high quality securities andduring speculative growth rallies.
-20.0
-12.0
-4.0
4.0
12.0
20.0
28.0
Ret
urn
LastQuarter
YearTo Date
1Year
3Years
5Years
7Years
10Years
Victory Munder MC Core Gr 1.43 (83) -4.36 (80) -4.36 (80) 12.11 (63) 10.15 (45) 15.26 (56) 7.53 (44)
Russell Midcap Growth Index 4.12 (33) -0.20 (49) -0.20 (49) 14.88 (25) 11.54 (21) 18.04 (9) 8.16 (29)
Median 2.87 -0.49 -0.49 13.14 9.78 15.40 7.35
-5.0
0.0
5.0
10.0
15.0
Ret
urn
(%)
9.0 12.0 15.0 18.0 21.0Risk (Standard Deviation %)
Return StandardDeviation
Victory Munder MC Core Gr 10.15 13.49
Russell Midcap Growth Index 11.54 13.61
Median 9.78 14.11
2014 2013 2012 2011 2010 2009 2008Victory Munder MC Core Gr 10.17 (23) 33.71 (64) 16.01 (28) -0.77 (23) 25.48 (49) 32.80 (70) -43.45 (41)Russell Midcap Growth Index 11.90 (13) 35.74 (48) 15.81 (30) -1.65 (28) 26.38 (44) 46.29 (24) -44.32 (46)IM U.S. Mid Cap Growth Equity (MF) Median 7.40 35.50 14.18 -4.65 25.34 40.04 -45.01
3Years
EndingDec-2015
3Years
EndingDec-2014
3Years
EndingDec-2013
3Years
EndingDec-2012
3Years
EndingDec-2011
3Years
EndingDec-2010
3Years
EndingDec-2009
Victory Munder MC Core Gr 12.11 (63) 19.56 (36) 15.46 (23) 13.04 (18) 18.25 (56) -1.96 (61) -3.15 (53)Russell Midcap Growth Index 14.88 (25) 20.71 (19) 15.63 (22) 12.91 (20) 22.06 (16) 0.97 (37) -3.18 (53)IM U.S. Mid Cap Growth Equity (MF) Median 13.14 18.37 13.90 11.11 18.72 -0.79 -2.99
Victory Munder MC Core Gr 12/31/15
34INTEGRITY. BALANCE. OBJECTIVITY.

TOP 10 HOLDINGS
STYLE MAP (07/01/98 - 12/31/15)
SECTOR ALLOCATIONASSET ALLOCATION
PORTFOLIO CHARACTERISTICS
UP/DOWN CAPTURE (01/01/11 - 12/31/15)
L Brands Inc ORD 1.99 %SBA Communications Corp ORD 1.94 %Biomarin Pharmaceutical Inc ORD 1.88 %Cognizant Technology Solutions Corp ORD 1.88 %Avago Technologies Ltd ORD 1.84 %Advance Auto Parts Inc ORD 1.74 %Affiliated Managers Group Inc ORD 1.73 %Radian Group Inc ORD 1.71 %Lincoln National Corp ORD 1.71 %Macerich Co 1.70 %
Total Securities 85Avg. Market Cap $12,538 MillionP/E 27.80P/B 4.73Div. Yield 1.78%Annual EPS 20.235Yr EPS 21.553Yr EPS Growth 21.69
3 Years 5 Yearsvs. Russell Midcap Growth IndexBeta 0.96 0.97
Victory Munder MC Core Gr Russell Midcap Growth Index
0.0 5.0 10.0 15.0 20.0 25.0 30.0
UtilitiesTelecommunication Services
MaterialsInformation Technology
IndustrialsHealth Care
FinancialsEnergy
Consumer StaplesConsumer Discretionary
Other
0.0% 25.0% 50.0% 75.0% 100.0% 125.0%
Other
Fixed Income
Convertibles
Cash
Equities
0.0%
0.0%
0.0%
0.2%
99.8%
Style History Dec-2015
Average Style Exposure
Cap
italiz
atio
n
Manager Style
Large Cap Growth
Small Cap GrowthSmall Cap Value
Large Cap Value
Victory Munder MC Core Gr
50.0
75.0
100.0
125.0
150.0U
p C
aptu
re
50.0 70.0 90.0 110.0 130.0 150.0Down Capture
Victory Munder MC Core Gr 12/31/15
35INTEGRITY. BALANCE. OBJECTIVITY.

FUND INFORMATION
ROLLING 3 YEAR RETURN AND PERCENTILE RANKINGS
PEER GROUP ANALYSIS - IM U.S. Small Cap Value Equity (MF)
CALENDAR YEAR RETURNS AND PERCENTILE RANKINGS
RISK VS. RETURN (5 YEARS*)
*If less than 5 years, data is since inception of fund share class.
Firm and Management:ICM's Small Cap Value effort began in1989, and today Bill Heaphy, ChiefInvestment Officer, and Sim Wootenserve as co-portfolio managers of theICM Small Company Portfolio. Bothhave research responsibilities and Billserves as Director of Research for thesmall cap team. Gary Merwitz, RobJacapraro, Josh Overholt and MattFleming are analysts on the small capteam.
Investment Strategy:Management starts with a universe ofstocks with market caps of around $1billion and narrows the list throughscreens and company analysis. Theteam favors well-managed companieswith good growth prospects that aretrading at attractive valuations. It tendsto sell when valuations get too high orwhen the company doesn't meetexpectations.
Innovest's Assessment:The strategy should outperform in downand stable markets and when lessercapitalized companies are leading. Thefund should underperform during bullmarkets when companies with little orno earnings are in vogue due to itssensitivity to high valuations; althoughthis may be subdued due to its higherweighting of lesser capitalizedcompanies. The fund should alsounderperform when financials andutilities lead due to management'sperpetual aversion to the sectors.
-30.0
-20.0
-10.0
0.0
10.0
20.0
30.0
Ret
urn
LastQuarter
YearTo Date
1Year
3Years
5Years
7Years
10Years
ICM Small Company 3.44 (35) -3.20 (14) -3.20 (14) 10.68 (25) 8.57 (29) 13.92 (36) 7.13 (15)
Russell 2000 Value Index 2.88 (44) -7.47 (56) -7.47 (56) 9.06 (50) 7.67 (52) 11.72 (79) 5.57 (50)
Median 2.52 -7.07 -7.07 9.05 7.81 13.27 5.51
-2.5
0.0
2.5
5.0
7.5
10.0
12.5
Ret
urn
(%)
0.0 6.0 12.0 18.0 24.0Risk (Standard Deviation %)
Return StandardDeviation
ICM Small Company 8.57 15.88
Russell 2000 Value Index 7.67 15.20
Median 7.81 15.27
2014 2013 2012 2011 2010 2009 2008ICM Small Company 2.87 (55) 36.16 (40) 16.93 (41) -4.85 (59) 22.73 (79) 34.46 (30) -35.11 (65)Russell 2000 Value Index 4.22 (34) 34.52 (56) 18.05 (33) -5.50 (64) 24.50 (60) 20.58 (80) -28.92 (25)IM U.S. Small Cap Value Equity (MF) Median 3.30 35.08 16.25 -3.78 24.99 28.27 -32.16
3Years
EndingDec-2015
3Years
EndingDec-2014
3Years
EndingDec-2013
3Years
EndingDec-2012
3Years
EndingDec-2011
3Years
EndingDec-2010
3Years
EndingDec-2009
ICM Small Company 10.68 (25) 17.88 (52) 14.85 (48) 10.94 (62) 16.23 (48) 2.31 (64) -3.39 (21)Russell 2000 Value Index 9.06 (50) 18.29 (43) 14.49 (55) 11.57 (49) 12.36 (95) 2.19 (65) -8.22 (55)IM U.S. Small Cap Value Equity (MF) Median 9.05 17.94 14.78 11.50 16.20 3.19 -7.52
ICM Small Company 12/31/15
36INTEGRITY. BALANCE. OBJECTIVITY.

TOP 10 HOLDINGS
STYLE MAP (05/01/89 - 12/31/15)
SECTOR ALLOCATIONASSET ALLOCATION
PORTFOLIO CHARACTERISTICS
UP/DOWN CAPTURE (01/01/11 - 12/31/15)
Dreyfus Treasury Prime Cash Management;Inst 2.60 %Ameris Bancorp ORD 1.59 %Kite Realty Group Trust 1.45 %Hanmi Financial Corp ORD 1.43 %Belden Inc ORD 1.42 %Integrated Device Technology Inc ORD 1.34 %NorthWestern Corp ORD 1.28 %South State Corp ORD 1.25 %Idacorp Inc ORD 1.25 %Ascena Retail Group Inc ORD 1.25 %
Total Securities 120Avg. Market Cap $1,496 MillionP/E 27.14P/B 1.87Div. Yield 2.33%Annual EPS 15.035Yr EPS 11.173Yr EPS Growth 6.48
3 Years 5 Yearsvs. Russell 2000 Value IndexBeta 1.01 1.03
ICM Small Company Russell 2000 Value Index
0.0 10.0 20.0 30.0 40.0 50.0 60.0
UtilitiesTelecommunication Services
MaterialsInformation Technology
IndustrialsHealth Care
FinancialsEnergy
Consumer StaplesConsumer Discretionary
Other
0.0% 25.0% 50.0% 75.0% 100.0% 125.0%
Other
Fixed Income
Convertibles
Cash
Equities
0.0%
0.0%
0.0%
2.6%
97.4%
Style History Dec-2015
Average Style Exposure
Cap
italiz
atio
n
Manager Style
Large Cap Growth
Small Cap GrowthSmall Cap Value
Large Cap Value
ICM Small Company
50.0
75.0
100.0
125.0
150.0U
p C
aptu
re
50.0 70.0 90.0 110.0 130.0 150.0Down Capture
ICM Small Company 12/31/15
37INTEGRITY. BALANCE. OBJECTIVITY.

FUND INFORMATION
ROLLING 3 YEAR RETURN AND PERCENTILE RANKINGS
PEER GROUP ANALYSIS - IM International Large Cap Value Equity (MF)
CALENDAR YEAR RETURNS AND PERCENTILE RANKINGS
RISK VS. RETURN (5 YEARS*)
*If less than 5 years, data is since inception of fund share class.
Firm and ManagementThe International Stock Fund ismanaged by the InternationalInvestment Policy Committee. The ninemembers of this committee have anaverage tenure at Dodge & Cox of 24years. In addition, all the firm's analystsare involved in security selection due totheir global coverage responsibilities.
Investment StrategyThe Fund invests primarily in adiversified portfolio of equity securitiesissued by non-U.S. companies from atleast three different countries, includingemerging markets. The Fund focuseson countries whose economic andpolitical systems appear more stableand are believed to provide someprotection to foreign shareholders. TheFund invests primarily in medium-to-large well established companiesbased on standards of the applicablemarket. In selecting investments, theFund invests primarily in companiesthat, in Dodge & Cox’s opinion, appearto be temporarily undervalued by thestock market but have a favorableoutlook for long-term growth.
Innovest's AssessmentWe believe this collaborative researchapproach will continue generatingshareholder value over full marketcycles; however, performance maysuffer during periods driven by moremacroeconomic events or a disregardfor company specific fundamentals.The strategy’s notable allocation todeveloping countries also suggests thatrelative performance may be partiallydictated by the market’s preference foremerging market securities.
-20.0
-15.0
-10.0
-5.0
0.0
5.0
10.0
15.0
Ret
urn
LastQuarter
YearTo Date
1Year
3Years
5Years
7Years
10Years
Dodge & Cox Intl 0.83 (99) -11.35 (100) -11.35 (100) 3.87 (32) 2.65 (34) 9.69 (3) 3.83 (17)
MSCI EAFE Value Idx 2.68 (46) -5.68 (92) -5.68 (92) 3.14 (44) 2.55 (39) 6.67 (25) 1.96 (64)
Median 2.61 -2.64 -2.64 2.97 2.07 6.22 2.48
-1.5
0.0
1.5
3.0
4.5
Ret
urn
(%)
12.0 14.0 16.0 18.0Risk (Standard Deviation %)
Return StandardDeviation
Dodge & Cox Intl 2.65 15.93
MSCI EAFE Value Idx 2.55 15.68
Median 2.07 14.97
2014 2013 2012 2011 2010 2009 2008Dodge & Cox Intl 0.08 (1) 26.31 (1) 21.03 (5) -15.97 (80) 13.69 (7) 47.46 (7) -46.69 (63)MSCI EAFE Value Idx -5.39 (25) 22.95 (9) 17.69 (44) -12.17 (34) 3.25 (77) 34.23 (25) -44.09 (48)IM International Large Cap Value Equity (MF) Median -8.37 21.25 17.18 -13.48 5.39 27.94 -44.32
3Years
EndingDec-2015
3Years
EndingDec-2014
3Years
EndingDec-2013
3Years
EndingDec-2012
3Years
EndingDec-2011
3Years
EndingDec-2010
3Years
EndingDec-2009
Dodge & Cox Intl 3.87 (32) 15.23 (1) 8.71 (12) 4.96 (5) 12.10 (9) -3.67 (7) -4.24 (10)MSCI EAFE Value Idx 3.14 (44) 11.04 (1) 8.32 (18) 2.19 (55) 6.77 (25) -8.15 (33) -7.35 (42)IM International Large Cap Value Equity (MF) Median 2.97 9.35 7.14 2.49 6.07 -9.13 -7.40
Dodge & Cox Intl 12/31/15
38INTEGRITY. BALANCE. OBJECTIVITY.

TOP 10 HOLDINGSPORTFOLIO CHARACTERISTICS
STYLE MAP (06/01/01 - 12/31/15)
SECTOR ALLOCATION
ASSET ALLOCATION
REGION ALLOCATION
TOP 5 COUNTRIES
UP/DOWN CAPTURE (01/01/11 - 12/31/15)
Sanofi SA ORD 4.03 %Naspers Ltd ORD 3.90 %Schlumberger NV ORD 3.24 %Roche Holding AG Par 3.20 %Barclays PLC ORD 2.79 %HP Inc ORD 2.49 %Samsung Electronics Co Ltd ORD 2.48 %Credit Suisse Group AG ORD 2.32 %Novartis AG DR 2.31 %Standard Chartered PLC ORD 2.07 %
Total Securities 90Avg. Market Cap $64,313 MillionP/E 23.06P/B 2.85Div. Yield 3.04%
0.0% 50.0% 100.0% 150.0%
Fixed Income
Convertibles
Other
Cash
Equities
0.0%
0.0%
0.2%
0.7%
99.1%
Switzerland 14.26 %United Kingdom 13.34 %Japan 12.80 %France 9.30 %Germany 6.27 %
3 Years 5 Yearsvs. MSCI EAFE Value IdxBeta 0.95 0.97
Dodge & Cox Intl MSCI EAFE Value Idx
0.0 8.0 16.0 24.0 32.0 40.0 48.0
UtilitiesTelecommunication Services
MaterialsInformation Technology
IndustrialsHealth Care
FinancialsEnergy
Consumer StaplesConsumer Discretionary
Dodge & Cox Intl MSCI EAFE Value Idx
0.0 8.0 16.0 24.0 32.0 40.0 48.0 56.0
OtherFrontier Markets
Middle EastUnited Kingdom
Europe ex UKJapan
Pacific ex JapanEM Mid East+Africa
North AmericaEM Latin America
EM EuropeEM Asia
Style History Dec-2015
Average Style Exposure
Cap
italiz
atio
n
Manager Style
MSCI EAFE Growth Index
MSCI Emerging Markets IndexMSCI EAFE Small Cap
MSCI EAFE Value Index
Dodge & Cox Intl
50.0
75.0
100.0
125.0
150.0
Up
Cap
ture
50.0 70.0 90.0 110.0 130.0 150.0Down Capture
Dodge & Cox Intl 12/31/15
39INTEGRITY. BALANCE. OBJECTIVITY.

FUND INFORMATION
ROLLING 3 YEAR RETURN AND PERCENTILE RANKINGS
PEER GROUP ANALYSIS - IM International Large Cap Growth Equity (MF)
CALENDAR YEAR RETURNS AND PERCENTILE RANKINGS
RISK VS. RETURN (5 YEARS*)
*If less than 5 years, data is since inception of fund share class.
Firm and Management:Like all American Funds, this fundboasts many experienced managers,most of whom have been with thecompany for more than a decade. Thismultimanager system eases personneltransitions, like the June 2014departure of long-time manager RobertLovelace, who moved to an affiliate.Each of the fund's nine managers runsa portion of the fund's assetsindependently. In addition, a portion ofthe portfolio (less than 25% of assets)is run by the firm's analyst staff.
Investment Strategy:This fund's managers are focused onlong term capital growth. They primarilyinvest in common stocks of Europeanand Pacific Basin issuers that haveprospects of above average capitalappreciation. The managers may usecash to moderate volatility, typicallyholding 5-10% of fund assets in cash.The Fund usually has a stake inemerging-markets companies and willsometimes hold preferred stock andconvertibles debt.
Innovest's Assessment:The fund’s propensity to focus intenselyon bottom-up, fundamental factors canlead to periods of underperformancewhen the market is less concernedabout company fundamentals and moredriven by thematic and macroeconomicfactors. Additionally, the fund is likely tolag when highly cyclical stocks andgenerally lower quality companiessignificantly outperform the overallmarket. Finally, the fund’s immenseasset base is likely to present somechallenges in the fund’s ability to buildmeaningful positions in smallercompanies and opportunistically tradein less liquid markets.
-12.0
-8.0
-4.0
0.0
4.0
8.0
12.0
16.0
Ret
urn
LastQuarter
YearTo Date
1Year
3Years
5Years
7Years
10Years
American Funds EuPc 2.87 (78) -0.82 (59) -0.82 (59) 5.08 (22) 3.63 (41) 8.92 (36) 4.60 (36)
MSCI EAFE Growth Index (Net) 6.67 (4) 4.09 (8) 4.09 (8) 6.83 (4) 4.60 (18) 8.92 (37) 4.03 (58)
Median 4.40 -0.57 -0.57 4.15 3.31 8.58 4.21
-1.5
0.0
1.5
3.0
4.5
6.0
7.5
Ret
urn
(%)
10.0 12.0 14.0 16.0 18.0Risk (Standard Deviation %)
Return StandardDeviation
American Funds EuPc 3.63 13.70
MSCI EAFE Growth Index (Net) 4.60 14.40
Median 3.31 14.48
2014 2013 2012 2011 2010 2009 2008American Funds EuPc -2.64 (28) 20.15 (33) 19.21 (44) -13.58 (48) 9.40 (64) 39.10 (19) -40.53 (16)MSCI EAFE Growth Index (Net) -4.43 (43) 22.55 (13) 16.86 (70) -12.11 (31) 12.25 (37) 29.36 (71) -42.70 (45)IM International Large Cap Growth Equity (MF) Median -4.98 18.39 18.85 -13.61 11.10 33.27 -43.61
3Years
EndingDec-2015
3Years
EndingDec-2014
3Years
EndingDec-2013
3Years
EndingDec-2012
3Years
EndingDec-2011
3Years
EndingDec-2010
3Years
EndingDec-2009
American Funds EuPc 5.08 (22) 11.72 (20) 7.37 (45) 4.07 (58) 9.56 (41) -3.27 (12) -0.53 (5)MSCI EAFE Growth Index (Net) 6.83 (4) 11.03 (37) 7.97 (33) 4.85 (34) 8.47 (69) -5.94 (48) -4.78 (52)IM International Large Cap Growth Equity (MF) Median 4.15 10.65 7.32 4.32 9.31 -6.08 -4.75
American Funds EuPc 12/31/15
40INTEGRITY. BALANCE. OBJECTIVITY.

TOP 10 HOLDINGSPORTFOLIO CHARACTERISTICS
STYLE MAP (05/01/84 - 12/31/15)
SECTOR ALLOCATION
ASSET ALLOCATION
REGION ALLOCATION
TOP 5 COUNTRIES
UP/DOWN CAPTURE (01/01/11 - 12/31/15)
Novo Nordisk A/S ORD 4.65 %Novartis AG ORD 2.46 %Barclays PLC ORD 2.29 %SoftBank Group Corp ORD 2.10 %Associated British Foods PLC ORD 1.80 %Prudential PLC ORD 1.78 %Bayer AG ORD 1.71 %HDFC Bank Ltd ORD 1.69 %Nintendo Co Ltd ORD 1.69 %Baidu Inc DR 1.40 %
Total Securities 466Avg. Market Cap $54,014 MillionP/E 24.23P/B 4.67Div. Yield 2.15%
0.0% 50.0% 100.0% 150.0%
Convertibles
Other
Cash
Fixed Income
Equities
0.0%
0.2%
0.4%
11.1%
88.3%
Japan 13.67 %United Kingdom 12.80 %United States 9.73 %France 7.45 %India 7.04 %
3 Years 5 Yearsvs. MSCI EAFE Growth Index (Net)Beta 0.87 0.93
American Funds EuPc MSCI EAFE Growth Index (Net)
0.0 4.0 8.0 12.0 16.0 20.0 24.0
UtilitiesTelecommunication Services
MaterialsInformation Technology
IndustrialsHealth Care
FinancialsEnergy
Consumer StaplesConsumer Discretionary
Other
American Funds EuPc MSCI EAFE Growth Index (Net)
0.0 10.0 20.0 30.0 40.0 50.0 60.0 70.0
OtherFrontier Markets
Middle EastUnited Kingdom
Europe ex UKJapan
Pacific ex JapanEM Mid East+Africa
North AmericaEM Latin America
EM EuropeEM Asia
Style History Dec-2015
Average Style Exposure
Cap
italiz
atio
n
Manager Style
MSCI EAFE Growth Index
MSCI Emerging Markets IndexMSCI EAFE Small Cap
MSCI EAFE Value Index
American Funds EuPc
50.0
75.0
100.0
125.0
150.0
Up
Cap
ture
50.0 70.0 90.0 110.0 130.0 150.0Down Capture
American Funds EuPc 12/31/15
41INTEGRITY. BALANCE. OBJECTIVITY.
FUND INFORMATION
ROLLING 3 YEAR RETURN AND PERCENTILE RANKINGS
PEER GROUP ANALYSIS - IM U.S. Broad Market Core Fixed Income (MF)
CALENDAR YEAR RETURNS AND PERCENTILE RANKINGS
RISK VS. RETURN (5 YEARS*)
*If less than 5 years, data is since inception of fund share class.
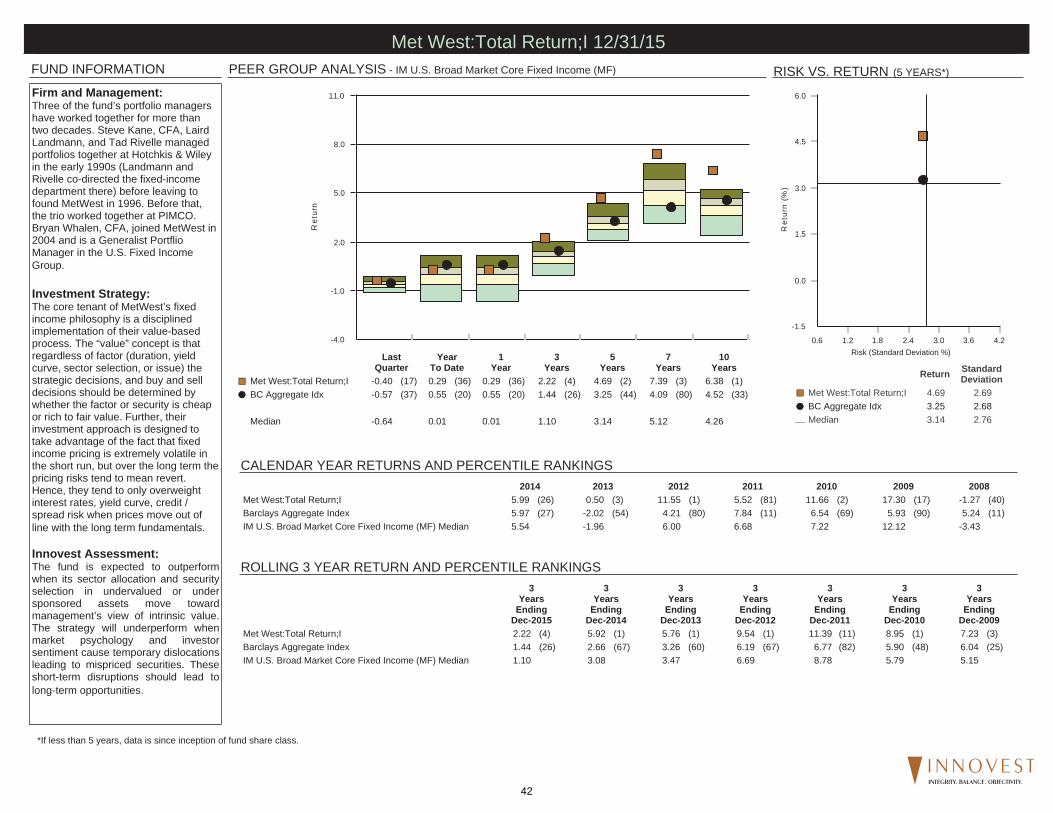
Firm and Management:Three of the fund’s portfolio managershave worked together for more thantwo decades. Steve Kane, CFA, LairdLandmann, and Tad Rivelle managedportfolios together at Hotchkis & Wileyin the early 1990s (Landmann andRivelle co-directed the fixed-incomedepartment there) before leaving tofound MetWest in 1996. Before that,the trio worked together at PIMCO.Bryan Whalen, CFA, joined MetWest in2004 and is a Generalist PortflioManager in the U.S. Fixed IncomeGroup.
Investment Strategy:The core tenant of MetWest’s fixedincome philosophy is a disciplinedimplementation of their value-basedprocess. The “value” concept is thatregardless of factor (duration, yieldcurve, sector selection, or issue) thestrategic decisions, and buy and selldecisions should be determined bywhether the factor or security is cheapor rich to fair value. Further, theirinvestment approach is designed totake advantage of the fact that fixedincome pricing is extremely volatile inthe short run, but over the long term thepricing risks tend to mean revert.Hence, they tend to only overweightinterest rates, yield curve, credit /spread risk when prices move out ofline with the long term fundamentals.
Innovest Assessment:The fund is expected to outperformwhen its sector allocation and securityselection in undervalued or undersponsored assets move towardmanagement’s view of intrinsic value.The strategy will underperform whenmarket psychology and investorsentiment cause temporary dislocationsleading to mispriced securities. Theseshort-term disruptions should lead tolong-term opportunities.
-4.0
-1.0
2.0
5.0
8.0
11.0
Ret
urn
LastQuarter
YearTo Date
1Year
3Years
5Years
7Years
10Years
Met West:Total Return;I -0.40 (17) 0.29 (36) 0.29 (36) 2.22 (4) 4.69 (2) 7.39 (3) 6.38 (1)
BC Aggregate Idx -0.57 (37) 0.55 (20) 0.55 (20) 1.44 (26) 3.25 (44) 4.09 (80) 4.52 (33)
Median -0.64 0.01 0.01 1.10 3.14 5.12 4.26
-1.5
0.0
1.5
3.0
4.5
6.0
Ret
urn
(%)
0.6 1.2 1.8 2.4 3.0 3.6 4.2Risk (Standard Deviation %)
Return StandardDeviation
Met West:Total Return;I 4.69 2.69
BC Aggregate Idx 3.25 2.68
Median 3.14 2.76
2014 2013 2012 2011 2010 2009 2008Met West:Total Return;I 5.99 (26) 0.50 (3) 11.55 (1) 5.52 (81) 11.66 (2) 17.30 (17) -1.27 (40)Barclays Aggregate Index 5.97 (27) -2.02 (54) 4.21 (80) 7.84 (11) 6.54 (69) 5.93 (90) 5.24 (11)IM U.S. Broad Market Core Fixed Income (MF) Median 5.54 -1.96 6.00 6.68 7.22 12.12 -3.43
3Years
EndingDec-2015
3Years
EndingDec-2014
3Years
EndingDec-2013
3Years
EndingDec-2012
3Years
EndingDec-2011
3Years
EndingDec-2010
3Years
EndingDec-2009
Met West:Total Return;I 2.22 (4) 5.92 (1) 5.76 (1) 9.54 (1) 11.39 (11) 8.95 (1) 7.23 (3)Barclays Aggregate Index 1.44 (26) 2.66 (67) 3.26 (60) 6.19 (67) 6.77 (82) 5.90 (48) 6.04 (25)IM U.S. Broad Market Core Fixed Income (MF) Median 1.10 3.08 3.47 6.69 8.78 5.79 5.15
Met West:Total Return;I 12/31/15
42INTEGRITY. BALANCE. OBJECTIVITY.

TOP SECTOR ALLOCATIONSPORTFOLIO CHARACTERISTICS
STYLE MAP (04/01/00 - 12/31/15)
QUALITY ALLOCATION
ASSET ALLOCATION
MATURITY DISTRIBUTION
UP/DOWN CAPTURE (01/01/11 - 12/31/15)
GNMA and Other Mtg Backed 40.81 %Government Agency Securities 28.76 %Corporate Notes/Bonds 19.08 %Asset Backed Securities 8.21 %
Avg. Coupon 2.49 %Nominal Maturity 7.84 YearsEffective Maturity N/ADuration 4.81 YearsSEC 30 Day Yield 3.85Avg. Credit Quality AA
0.0% 50.0% 100.0% 150.0%
Convertibles
Equities
Other
Cash
Fixed Income
0.0%
0.0%
0.9%
2.2%
96.9%
0.0% 20.0% 40.0% 60.0% 80.0% 100.0%
Not RatedD Rated
Equities/OtherBB AND B Rated
CCC, CC AND C rated
AA RatedBBB Rated
A RatedGovernment/AAA
0.2%
0.2%
0.9%
2.5%
3.4%
3.9%
8.8%
10.6%
69.6%
0.0% 10.0% 20.0% 30.0% 40.0% 50.0%
>30Yrs
Other
<1Yr
10-20Yrs
20-30Yrs
3-5Yrs
1-3Yrs
5-10Yrs
0.0%
0.9%
6.9%
7.9%
9.3%
16.1%
19.4%
39.5%
Style History Dec-2015
Average Style Exposure
Cap
italiz
atio
n
Manager Style
Barclays Capital Long Term Govt Bond
Barclays Capital Long U.S. CreditBarclays Capital U.S. Credit 1-5 Year Index
Barclays Capital 1-5 Yr Gov
Met West:Total Return;I
50.0
75.0
100.0
125.0
150.0U
p C
aptu
re
50.0 70.0 90.0 110.0 130.0 150.0Down Capture
Met West:Total Return;I 12/31/15
43INTEGRITY. BALANCE. OBJECTIVITY.

FUND INFORMATION
ROLLING 3 YEAR RETURN AND PERCENTILE RANKINGS
PEER GROUP ANALYSIS - IM U.S. High Yield Bonds (MF)
CALENDAR YEAR RETURNS AND PERCENTILE RANKINGS
RISK VS. RETURN (5 YEARS*)
*If less than 5 years, data is since inception of fund share class.
Firm and Management:William J. Morgan joined J.P. Morgan in2005. He is the high yield team leaderand the portfolio manager for allaccounts in the high yield, aggressiveincome high yield, and insurance asset"BB' default rating styles. He is amember of the High Yield ManagementReview Committee and is alsoresponsible for managing the HighYield Team's credit analysts. Prior tojoining the firm, he held the same roleat Banc One High Yield Partners, LLCand Pacholder Associates, Inc.
Investment Style:The team utilizes a flexible approachthat seeks to generate excess return byutilizing the full range of opportunitiespresented by the high yield market,from investment grade credits trading athigh yield spreads to distressed anddefaulted securities and post-reorganization debt securities.
Innovest's Assessment:The JPMorgan High Yield Fund hashistorically had an overweight allocationto BB and B-rated credits; therefore it islikely to underperform in markets wherelower-rated high yield credits (CCC andlower) perform well. The strategy islikely to outperform when higher qualityhigh yield credits are in favor or wheninvestors generally favor less riskyassets. Additionally, the strategy shouldperform well in market environmentswhere bottom-up fundamental creditresearch is rewarded.
-16.0
-10.0
-4.0
2.0
8.0
14.0
20.0
Ret
urn
LastQuarter
YearTo Date
1Year
3Years
5Years
7Years
10Years
JPMorgan High Yield -2.03 (61) -4.54 (59) -4.54 (59) 1.58 (43) 4.31 (47) 11.20 (41) 6.50 (15)
BC US Corp: High Yield -2.07 (62) -4.47 (59) -4.47 (59) 1.69 (39) 5.04 (19) 12.84 (7) 6.96 (6)
Median -1.80 -3.96 -3.96 1.36 4.19 10.94 5.62
0.0
1.5
3.0
4.5
6.0
7.5
Ret
urn
(%)
-3.0 0.0 3.0 6.0 9.0 12.0Risk (Standard Deviation %)
Return StandardDeviation
JPMorgan High Yield 4.31 6.01
BC US Corp: High Yield 5.04 6.20
Median 4.19 6.16
2014 2013 2012 2011 2010 2009 2008JPMorgan High Yield 2.67 (19) 6.94 (42) 14.81 (49) 2.65 (63) 14.67 (36) 48.45 (46) -22.54 (30)Barclays US Corp: High Yield 2.45 (23) 7.44 (30) 15.81 (29) 4.98 (16) 15.12 (28) 58.21 (11) -26.16 (59)IM U.S. High Yield Bonds (MF) Median 1.47 6.61 14.72 3.31 14.05 47.61 -24.98
3Years
EndingDec-2015
3Years
EndingDec-2014
3Years
EndingDec-2013
3Years
EndingDec-2012
3Years
EndingDec-2011
3Years
EndingDec-2010
3Years
EndingDec-2009
JPMorgan High Yield 1.58 (43) 8.02 (34) 8.02 (53) 10.56 (51) 20.45 (47) 9.66 (10) 5.52 (13)Barclays US Corp: High Yield 1.69 (39) 8.43 (22) 9.32 (10) 11.86 (9) 24.12 (5) 10.38 (6) 5.98 (8)IM U.S. High Yield Bonds (MF) Median 1.36 7.50 8.07 10.56 20.23 7.60 3.71
JPMorgan High Yield 12/31/15
44INTEGRITY. BALANCE. OBJECTIVITY.

TOP SECTOR ALLOCATIONSPORTFOLIO CHARACTERISTICS
STYLE MAP (12/01/98 - 12/31/15)
QUALITY ALLOCATION
ASSET ALLOCATION
MATURITY DISTRIBUTION
UP/DOWN CAPTURE (01/01/11 - 12/31/15)
Corporate Notes/Bonds 78.34 %US$ Denominated Fgn. Gvt. 16.91 %Preferred Stock-Non Convertible 0.88 %Common Stock 0.19 %Convertible Securities 0.18 %Asset Backed Securities 0.04 %
Avg. Coupon N/ANominal Maturity N/AEffective Maturity 6.85 YearsDuration N/ASEC 30 Day Yield 7.26Avg. Credit Quality BB
0.0% 50.0% 100.0% 150.0%
Other
Convertibles
Equities
Cash
Fixed Income
0.0%
0.2%
0.2%
3.5%
96.2%
0.0% 25.0% 50.0% 75.0% 100.0%
A Rated
Equities/Other
Not Rated
BBB Rated
Government/AAA
CCC, CC AND C rated
BB AND B Rated
0.2%
1.1%
2.0%
3.1%
3.5%
11.7%
78.5%
0.0% 15.0% 30.0% 45.0% 60.0% 75.0% 90.0%
20-30Yrs
10-20Yrs
1-3Yrs
Other
<1Yr
>30Yrs
3-5Yrs
5-10Yrs
0.0%
0.0%
0.0%
1.1%
3.5%
4.9%
28.5%
62.0%
Style History Dec-2015
Average Style Exposure
Cap
italiz
atio
n
Manager Style
Barclays Capital Long Term Govt Bond
Barclays Capital Long U.S. CreditBarclays Capital U.S. Credit 1-5 Year Index
Barclays Capital 1-5 Yr Gov
JPMorgan High Yield
50.0
75.0
100.0
125.0
150.0U
p C
aptu
re
50.0 70.0 90.0 110.0 130.0 150.0Down Capture
JPMorgan High Yield 12/31/15
45INTEGRITY. BALANCE. OBJECTIVITY.

FUND INFORMATION
ROLLING 3 YEAR RETURN AND PERCENTILE RANKINGS
PEER GROUP ANALYSIS - Loan Participation Mutual Funds
CALENDAR YEAR RETURNS AND PERCENTILE RANKINGS
RISK VS. RETURN (5 YEARS*)
*If less than 5 years, data is since inception of fund share class.
Firm and Management:Scott Page and Craig Russ co-managethe fund. Page has been its comanagersince its inception in early 2001. Russjoined him when Payson Swaffield wasappointed as Eaton Vance's chiefincome investment officer in November2007. Russ isn't a novice, though: Hesigned on with the firm in 1997 and hasserved as a bank-loan analyst and as acomanager on Eaton Vance funds suchas closed-end Senior Floating RateEFR since 2003.
Investment Strategy:The Eaton Vance Floating Rate Fundinvests in senior, secured floating-ratebank loans, the majority of which earnjunk-like credit ratings. It is a bottom-upstrategy that is focused on capitalpreservation and giving shareholderslow volatility exposure to the floatingrate corporate loan asset class. Due tothe sheer size of the strategy,incremental gains from inaccuratelyrated credits are not significant enoughto generate meaningful Alpha so theteam focuses on only the largest issuesof the highest rated credits availableand leaves the "diamond in the rough"finds to smaller, more nimblestrategies.
Innovest's Assessment:The strategy should be expected tooutperform during more difficult creditenvironments where higher quality,broad portfolio diversification tactics willprotect the portfolio from widespreadcredit deterioration. The strategyshould underperform when lowerquality credits lead (B- and lower) andin situations when strongerperformance is being derived fromsmaller issues.
-8.0
-4.0
0.0
4.0
8.0
12.0
16.0
Ret
urn
LastQuarter
YearTo Date
1Year
3Years
5Years
7Years
10Years
Eaton Vance Flt Rt -2.26 (56) -1.63 (53) -1.63 (53) 1.24 (41) 2.85 (39) 9.16 (22) 3.42 (19)
CSFB Leveraged Loan Idx -1.97 (37) -0.39 (22) -0.39 (22) 2.58 (2) 3.75 (4) 9.73 (12) 4.08 (1)
Median -2.19 -1.53 -1.53 0.99 2.57 8.46 2.99
0.0
0.9
1.8
2.7
3.6
4.5
Ret
urn
(%)
0.0 1.0 2.0 3.0 4.0 5.0Risk (Standard Deviation %)
Return StandardDeviation
Eaton Vance Flt Rt 2.85 2.96
CSFB Leveraged Loan Idx 3.75 3.11
Median 2.57 3.43
2014 2013 2012 2011 2010 2009 2008Eaton Vance Flt Rt 0.63 (29) 4.82 (51) 8.27 (67) 2.44 (9) 9.55 (43) 46.49 (21) -30.25 (60)Credit Suisse Leveraged Loan Index 2.06 (1) 6.15 (4) 9.42 (33) 1.80 (29) 9.97 (39) 44.88 (27) -28.75 (46)Loan Participation Mutual Funds Median 0.25 4.86 8.89 1.43 9.17 41.50 -29.64
3Years
EndingDec-2015
3Years
EndingDec-2014
3Years
EndingDec-2013
3Years
EndingDec-2012
3Years
EndingDec-2011
3Years
EndingDec-2010
3Years
EndingDec-2009
Eaton Vance Flt Rt 1.24 (41) 4.53 (52) 5.15 (43) 6.71 (36) 18.02 (17) 3.83 (38) 1.39 (19)Credit Suisse Leveraged Loan Index 2.58 (2) 5.84 (3) 5.74 (13) 6.99 (27) 17.49 (30) 4.31 (21) 1.69 (16)Loan Participation Mutual Funds Median 0.99 4.54 5.00 6.45 16.28 3.38 0.42
Eaton Vance Flt Rt 12/31/15
46INTEGRITY. BALANCE. OBJECTIVITY.
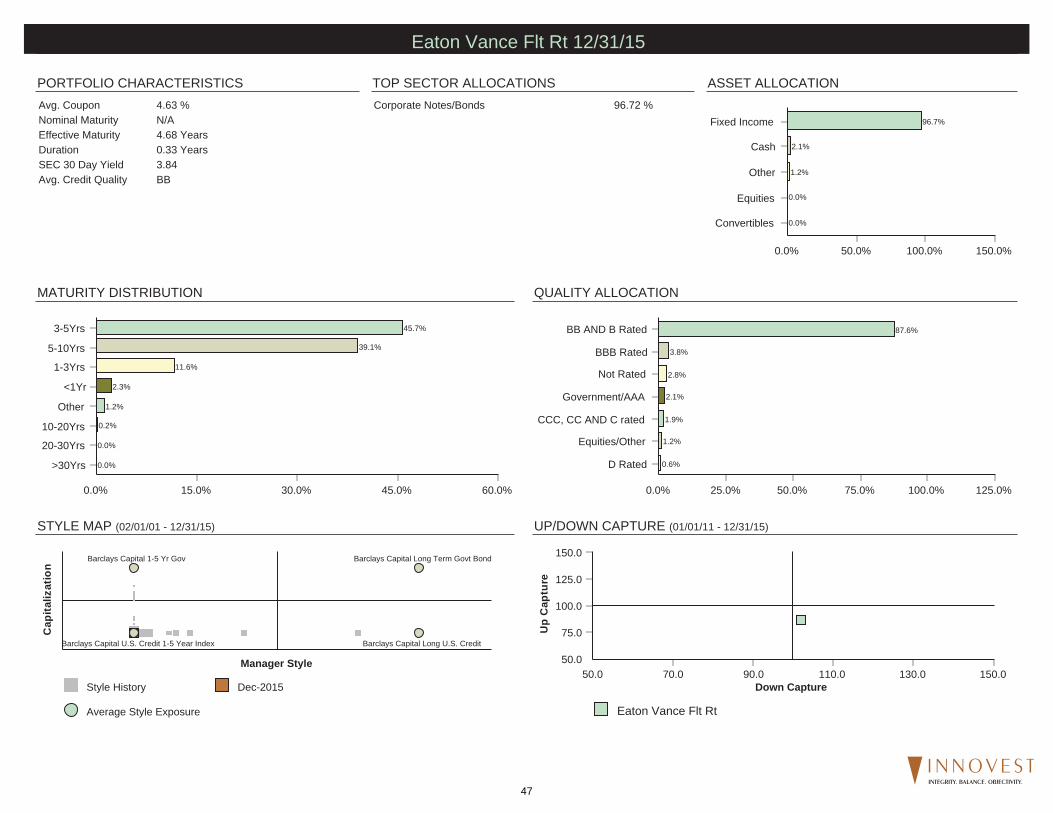
TOP SECTOR ALLOCATIONSPORTFOLIO CHARACTERISTICS
STYLE MAP (02/01/01 - 12/31/15)
QUALITY ALLOCATION
ASSET ALLOCATION
MATURITY DISTRIBUTION
UP/DOWN CAPTURE (01/01/11 - 12/31/15)
Corporate Notes/Bonds 96.72 %Avg. Coupon 4.63 %Nominal Maturity N/AEffective Maturity 4.68 YearsDuration 0.33 YearsSEC 30 Day Yield 3.84Avg. Credit Quality BB
0.0% 50.0% 100.0% 150.0%
Convertibles
Equities
Other
Cash
Fixed Income
0.0%
0.0%
1.2%
2.1%
96.7%
0.0% 25.0% 50.0% 75.0% 100.0% 125.0%
D Rated
Equities/Other
CCC, CC AND C rated
Government/AAA
Not Rated
BBB Rated
BB AND B Rated
0.6%
1.2%
1.9%
2.1%
2.8%
3.8%
87.6%
0.0% 15.0% 30.0% 45.0% 60.0%
>30Yrs
20-30Yrs
10-20Yrs
Other
<1Yr
1-3Yrs
5-10Yrs
3-5Yrs
0.0%
0.0%
0.2%
1.2%
2.3%
11.6%
39.1%
45.7%
Style History Dec-2015
Average Style Exposure
Cap
italiz
atio
n
Manager Style
Barclays Capital Long Term Govt Bond
Barclays Capital Long U.S. CreditBarclays Capital U.S. Credit 1-5 Year Index
Barclays Capital 1-5 Yr Gov
Eaton Vance Flt Rt
50.0
75.0
100.0
125.0
150.0U
p C
aptu
re
50.0 70.0 90.0 110.0 130.0 150.0Down Capture
Eaton Vance Flt Rt 12/31/15
47INTEGRITY. BALANCE. OBJECTIVITY.

THIS PAGE LEFT INTENTIONALLY BLANK
48INTEGRITY. BALANCE. OBJECTIVITY.

FUND INFORMATION
INDEX ALLOCATION
PERFORMANCE OVER TIME
INVESTMENT STATISTICS (5 YEARS*)
RISK VS. RETURN (5 YEARS*)
*If less than 5 years, since inception time period was used.
Firm and Management:Credit Suisse Asset Management offersa wide range of investment productsand functions across asset classes andinvestment styles. This divisionoversees global and regional portfolios,mutual funds, and other investmentvehicles for governments, institutions,corporations and individuals worldwide.The Commodities PortfolioManagement Team is led by NelsonLouie, Global Head of Commodities,and Christopher Burton, SeniorPortfolio Manager. Nelson Louie andChristopher Burton are ultimatelyresponsible for managing allcomponents of the Enhanced TotalCommodity Return Strategy.
Investment Strategy:The fund uses a wholly-ownedsubsidiary to invest in derivatives thatprovide exposure to the BloombergCommodity Index. It primarily usesswaps but can also hold futures andstructured notes. The goal is to trackthe benchmark without much trackingerror. Management tries to modestlyoutpace the benchmark by pickingfavorably priced spots on commodityfutures curves and employing low-riskcash management.
Innovest Assessment:The Credit Suisse Commodity ReturnStrategy seeks to track the BloombergCommodity index through enhancedreplication and trade optimization,creating marginal long-termoutperformance. The diversified natureof the Bloomberg Commodity indexshould also dictate performance,causing relative outperformance(underperformance) when energy lags(leads) other commodity sectors.Investors may also experience marginalunderperformance when short-termcommodity contracts, exhibitingnegative carry, outpace longer maturitycontracts.
Crdt Suis Comm Rtn Strat Bloomberg Commodity Index Total Return
-36.0
-30.0
-24.0
-18.0
-12.0
-6.0
0.0
Ret
urn
(%)
LastQuarter
2015 1Year
3Years
5Years
7Years
10Years
-10.5
-24.7 -24.7
-17.3
-13.5
-5.5 -6.4
-10.3
-25.0 -25.0
-17.5
-13.5
-5.4-6.5
Crdt Suis Comm Rtn Strat
Bloomberg Commodity Index Total Return
-13.6
-13.5
-13.4
Ret
urn
(%)
14.0 14.2 14.4 14.6Risk (Standard Deviation %)
LastQuarter 2015 1
Year3
Years5
Years7
Years10
YearsCrdt Suis Comm Rtn Strat -10.34 -24.96 -24.96 -17.49 -13.52 -5.38 -6.46Bloomberg Commodity Index Total Return -10.52 -24.66 -24.66 -17.29 -13.47 -5.48 -6.43
2014 2013 2012 2011 2010 2009 2008 2007 2006 2005Crdt Suis Comm Rtn Strat -16.87 -9.96 -1.83 -12.29 16.93 20.12 -35.47 14.78 1.92 20.31Bloomberg Commodity Index Total Return -17.01 -9.52 -1.06 -13.32 16.83 18.91 -35.65 16.23 2.07 21.36
Alpha Beta ActualCorrelation
UpMarketCapture
DownMarketCapture
InceptionDate
Crdt Suis Comm Rtn Strat -0.41 0.98 1.00 96.89 98.83 01/01/2006Bloomberg Commodity Index Total Return 0.00 1.00 1.00 100.00 100.00 01/01/2006
0.0
10.0
20.0
30.0
40.0
Industr
ia l M et
a ls
Energy
Gr ains
L iv esto
ck
Precious
M eta ls
So fts
15.5
32.630.5
4.8
16.6
0.0
Crdt Suis Comm Rtn Strat 12/31/15
49INTEGRITY. BALANCE. OBJECTIVITY.

FUND INFORMATION
ROLLING 3 YEAR RETURN AND PERCENTILE RANKINGS
PEER GROUP ANALYSIS - IM U.S. GIC/Stable Value (SA+CF)
CALENDAR YEAR RETURNS AND PERCENTILE RANKINGS
RISK VS. RETURN (5 YEARS*)
*If less than 5 years, data is since inception of fund share class.
Investment StrategyThe PLUS Fund's investment strategiesare based on a structured anddiversified multi-product, multi-managerapproach. The PLUS Fund investsprimarily in a diversified portfolio ofstable value investment contracts andfixed income securities that backcertain stable value investmentcontracts. Cash equivalents are held, inpart, to provide liquidity for payouts.The composition of the PLUS Fundportfolio and its allocations to variousstable value investments and fixedincome investment sectors isdetermined based on prevailingeconomic and capital marketconditions, relative value analysis, andother factors.
-1.0
-0.1
0.8
1.7
2.6
3.5
4.4
5.3
Ret
urn
LastQuarter
YearTo Date
1Year
3Years
5Years
7Years
10Years
Vantage Trust Plus 0.57 (1) 2.34 (1) 2.34 (1) 2.44 (1) 2.77 (1) 3.12 (7) 3.72 (4)
Ryan 3 Yr GIC Mstr 0.31 (76) 1.16 (94) 1.16 (94) 1.09 (96) 1.43 (95) 2.16 (69) 2.82 (88)
Median 0.46 1.81 1.81 1.68 2.15 2.43 3.07
0.5
1.0
1.5
2.0
2.5
3.0
3.5
Ret
urn
(%)
0.0 0.2 0.4 0.6Risk (Standard Deviation %)
Return StandardDeviation
Vantage Trust Plus 2.77 0.22
Ryan 3 Yr GIC Mstr 1.43 0.27
Median 2.15 0.24
2014 2013 2012 2011 2010 2009 2008Vantage Trust Plus 2.39 (3) 2.59 (1) 3.03 (8) 3.50 (21) 3.85 (32) 4.16 (22) 5.14 (4)Ryan 3 Yr GIC Mstr 1.03 (95) 1.06 (92) 1.48 (99) 2.44 (62) 3.53 (43) 4.49 (11) 4.79 (29)IM U.S. GIC/Stable Value (SA+CF) Median 1.70 1.73 2.39 2.91 3.39 3.63 4.65
3Years
EndingDec-2015
3Years
EndingDec-2014
3Years
EndingDec-2013
3Years
EndingDec-2012
3Years
EndingDec-2011
3Years
EndingDec-2010
3Years
EndingDec-2009
Vantage Trust Plus 2.44 (1) 2.67 (1) 3.04 (1) 3.46 (24) 3.84 (21) 4.38 (18) 4.83 (11)Ryan 3 Yr GIC Mstr 1.09 (96) 1.19 (100) 1.66 (97) 2.48 (79) 3.48 (35) 4.27 (21) 4.60 (24)IM U.S. GIC/Stable Value (SA+CF) Median 1.68 1.97 2.35 2.85 3.20 3.95 4.40
Vantage Trust Plus 12/31/15
50INTEGRITY. BALANCE. OBJECTIVITY.

Financial Strength:
Information as of 6/30/2015
AA‐
8.7%19.0%5.9%
14.0% A1
AaaA1A1
AA+A+A+
14.4% A1 AA‐
Vantage Trust PLUS
Investment Contract Issuers % of Wrapped Assets5.3%
S&P A+
Moody'sA1
New York Life Ins. Co. Pacific Life Ins. Co. Principal Life Ins. Co.
Transamerica Premier Life Ins. Co
Bank of Tokyo‐Mitsubishi
Prudential Ins. Co. of America
10.4%
8.0%
23.8%57.8%
Portfolio Allocation
Cash Buffer
Shorter Duration Focus
Ladder Maturity Focus
Total Return Focus
2007 2008 2009 2010 2011 2012 2013 2014 2015
Market‐to‐Book 99.88% 95.18% 99.74% 101.37% 102.42% 103.22% 100.60% 101.45% 100.20%
80.00%
85.00%
90.00%
95.00%
100.00%
105.00%
Historical Market‐to‐Book Values
Market‐to‐Book
Organization:Founded in 1972, ICMA‐RC's mission is to help building retirement security for public employees. ICMA Description:The PLUS Fund's investment strategies are based on a structured and diversified multi‐product, multi‐manager approach. The PLUS Fund invests primarily in a diversified portfolio of stable value investment contracts and fixed income securities that back certain stable value investment contracts. Cash equivalents are held, in part, to provide liquidity for payouts. The compostion of the PLUS fund and its allocations to vaious stable value investments and fixed income invesment sectors is determined based on prevailing economic and capital market condtions, relative value
51INTEGRITY. BALANCE. OBJECTIVITY.

A+AA‐A2
ICMA‐RC VantageTrust Retirement Income Advantage Fund
‐ Participants can choose between a single benefit option and a spousal benefit option.
‐ Single Benefit Option: participant will receive the annual lifetime withdrawal amount for the rest of his/her life, upon death remaining assets in the Fund will be distributed to beneficiaries.
Prudential Retirement Insurance & Annuity Company
‐ The promise that the participant will continue to receive income for life following retirement is only as good as the insurance company making the promise. Therefore, it is important to evaluate and monitor the financial viability of the insurance company.
‐ Spousal Benefit Option: Participant will receive annual lifetime withdrawal amount for rest of his/her life and, upon participant's death, the surviving spouse will be entitled to the annual lifetime withdrawal amount for the rest of his/her life.
A t L k I Si l B fit S l B fit
Insurer RatingsA.M. Best
Standard and Poor'sM d '
Annual Lifetime Withdrawal Amounts:
2nd of 15 ratings ‐ superior2nd of 10 ratings ‐ very strong6th f 21 ti i
Organization:In 1972 the ICMA Retirement Corporation (ICMA‐RC) was established by the International City/County Management Association (ICMA). ICMA‐RC is an independent and non‐profit corporation that provides defined contribution plan administration, investment management and educational services to public sector employers and their employees.
Description: The primary objective of the VantageTrust Retirement IncomeAdvantage Fund is to provide a guaranteed lifetime income feature to participants. This fund is also known as a guaranteed minimum withdrawal benefit (GMWB). The GMWB feature is similar to an insurance policy where participants pay a fee to an insurance company in exchange for the insurance company's promise to pay the participant a guaranteed benefit throughout retirement equal to a percentage of the participant's account balance, typically calculated as the total of their contributions plus any market appreciation as of a specified date such as the participant’s date of birth or investment anniversary. The primary purpose of GMWB features is to provide participants with a minimum guaranteed income for their lives, regardless of how their investments perform and regardless of fluctuations in the market value of their account. Every year, on the participant’s date of birth or investment anniversary, the current market value in the Fund is compared with the highest birthday or anniversary value on record for the participant's account, and the higher value will be used as the participant’s market value in which the lifetime annual withdrawal amount is calculated from. Once a participant begins to receive withdrawals, they will be entitled to withdraw their lifetime annual withdrawal amount for the rest of their life, regardless of their market value in the fund. The primary value of the GMWB is the insurance company's promise that the participant will continue to receive income for life following retirement, even if the participant's account balance is depleted.
A2
A+
0.72%
1.00%
1.72%
Information as of 3/31/2014
70 or older 5.75% 5.25%
Age at Lock‐In Single Benefit Spousal Benefit Moody's
4.50%
3.75%
5.00%
4.25%
65 ‐ 69
55 ‐ 64 Fitch
6th of 21 ratings ‐ superior
3rd of 9 ratings ‐ strong
Total annual cost assuming $100,000 balance:
$1,720
Underlying Investments
• A balanced fund serves as the VantageTrust Retirement IncomeAdvantage Fund's underlying investment. The underlying balanced fund is comprised of both actively and passively managed, proprietary mutual funds as well as an additional fixed income fund managed by Prudential.
Fees & Expenses: Underlying investment management fees:
Guarantee fee:
Total annual cost (%):
25%
20%
15%
10%
30%
Vantagepoint Broad Market Index*
Vantagepoint Growth & Income*
Vantagepoint International*
Vantagepoint Inflation Protected Securities* Prudential Core Conservative Intermediate Bond
* passively managed strategy
52INTEGRITY. BALANCE. OBJECTIVITY.
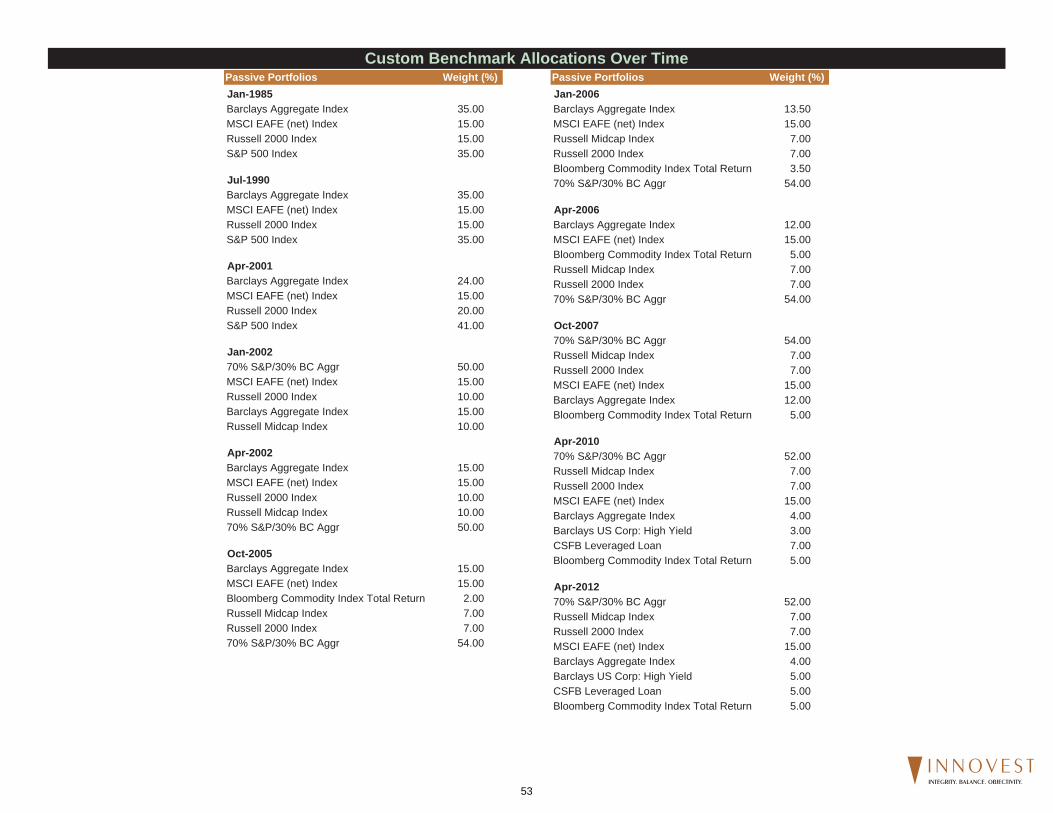
Passive Portfolios Weight (%)Jan-1985Barclays Aggregate Index 35.00MSCI EAFE (net) Index 15.00Russell 2000 Index 15.00S&P 500 Index 35.00
Jul-1990Barclays Aggregate Index 35.00MSCI EAFE (net) Index 15.00Russell 2000 Index 15.00S&P 500 Index 35.00
Apr-2001Barclays Aggregate Index 24.00MSCI EAFE (net) Index 15.00Russell 2000 Index 20.00S&P 500 Index 41.00
Jan-200270% S&P/30% BC Aggr 50.00MSCI EAFE (net) Index 15.00Russell 2000 Index 10.00Barclays Aggregate Index 15.00Russell Midcap Index 10.00
Apr-2002Barclays Aggregate Index 15.00MSCI EAFE (net) Index 15.00Russell 2000 Index 10.00Russell Midcap Index 10.0070% S&P/30% BC Aggr 50.00
Oct-2005Barclays Aggregate Index 15.00MSCI EAFE (net) Index 15.00Bloomberg Commodity Index Total Return 2.00Russell Midcap Index 7.00Russell 2000 Index 7.0070% S&P/30% BC Aggr 54.00
Passive Portfolios Weight (%)Jan-2006Barclays Aggregate Index 13.50MSCI EAFE (net) Index 15.00Russell Midcap Index 7.00Russell 2000 Index 7.00Bloomberg Commodity Index Total Return 3.5070% S&P/30% BC Aggr 54.00
Apr-2006Barclays Aggregate Index 12.00MSCI EAFE (net) Index 15.00Bloomberg Commodity Index Total Return 5.00Russell Midcap Index 7.00Russell 2000 Index 7.0070% S&P/30% BC Aggr 54.00
Oct-200770% S&P/30% BC Aggr 54.00Russell Midcap Index 7.00Russell 2000 Index 7.00MSCI EAFE (net) Index 15.00Barclays Aggregate Index 12.00Bloomberg Commodity Index Total Return 5.00
Apr-201070% S&P/30% BC Aggr 52.00Russell Midcap Index 7.00Russell 2000 Index 7.00MSCI EAFE (net) Index 15.00Barclays Aggregate Index 4.00Barclays US Corp: High Yield 3.00CSFB Leveraged Loan 7.00Bloomberg Commodity Index Total Return 5.00
Apr-201270% S&P/30% BC Aggr 52.00Russell Midcap Index 7.00Russell 2000 Index 7.00MSCI EAFE (net) Index 15.00Barclays Aggregate Index 4.00Barclays US Corp: High Yield 5.00CSFB Leveraged Loan 5.00Bloomberg Commodity Index Total Return 5.00
Custom Benchmark Allocations Over Time
53INTEGRITY. BALANCE. OBJECTIVITY.

Custom Benchmark Allocations Over TimePassive Portfolios Weight (%)Sep-201470% S&P/30% BC Aggr 50.00Russell Midcap Index 6.50Russell 2000 Index 6.50MSCI EAFE (net) Index 19.00Barclays Aggregate Index 4.00Barclays US Corp: High Yield 2.00CSFB Leveraged Loan 7.00Bloomberg Commodity Index Total Return 5.00
54INTEGRITY. BALANCE. OBJECTIVITY.
GlossaryAlpha measures a portfolio’s return in excess of the market return adjusted for risk. It is a measure of the manager’s contribution to performance with reference to security selection. A positive alpha indicates that a portfolio was positively rewarded for the residual risk that was taken for that level of market exposure.
Beta measures the sensitivity of rates of portfolio return to movements in the market. A portfolio’s beta measures the expected change in return per 1% change in the return on the market. If the beta of a portfolio is 1.5, a 1 percent increase in the return of the market will result, on average, in a 1.5 percent increase in the return on the portfolio. The converse would also be true.
Dividend Yield - The total amount of dividends paid out for a stock over the preceding twelve months divided by the closing price of a share of the common stock.
Down Capture Ratio - The Down Capture Ratio is a measure of the Investment’s compound return when the Benchmark was down divided by the Benchmark’s compound return when the Benchmark was down. The smaller the value, the better.
Duration - A time measure of a bond’s interest-rate sensitivity, based on the weighted average of the time periods over which a bond’s cash flows accrue to the bondholder.
Forecasted Long-Term Earnings Growth - This growth rate is a measure of a company’s expected long-term success in generating future year-over-year earnings growth. This growth rate is a market value weighted average of the consensus (mean) analysts’ long-term earnings growth rate forecast for each company in the portfolio. The definition of long-term varies by analyst but is limited to a 3-8 year range. This value is expressed as the expected average annual growth of earnings in percent.
Information Ratio measures the excess return per unit of residual “non market” risk in a portfolio. The ratio is equal to the Alpha divided by the Residual Risk.
Market Capitalization - The market value of a company’s outstanding shares of common stock at a specific point in time, computed as the product of the number of outstanding shares times the stock’s closing price per share.
P/E ratio relates the price of the stock to the per-share earnings of the company. A high P/E generally indicates that the market will pay more to obtain the company because it has confidence in the company’s ability to increase its earnings. Conversely, a low P/E indicates that the market has less confidence that the company’s earnings will increase, and therefore will not pay as much for its stock. In most cases a fund with a high average P/E ratio has paid a premium for stocks that have a high potential for increased earnings. If the fund’s average P/E ratio is low, the manager may believe that the stocks have an overlooked or undervalued potential for appreciation.
P/B ratio of a company relates the per-share market price of the company’s stock to its per-share book value, the historical accounting value of the company’s tangible assets. A high P/B ratio indicates that the price of the stock exceeds the actual worth of the company’s assets. A low P/B ratio would indicate that the stock is a bargain, priced below what the company’s assets could be worth if liquidated.
P/CF ratio compares the total market value of the portfolio to the portfolio’s share of the underlying stocks’ earnings (or book value, cash flow, sales or dividends).
Alpha measures a portfolio’s return in excess of the market return adjusted for risk. It is a measure of the manager’s contribution to performance with reference to security selection. A positive alpha indicates that a portfolio was positively rewarded for the residual risk that was taken for that level of market exposure.
Beta measures the sensitivity of rates of portfolio return to movements in the market. A portfolio’s beta measures the expected change in return per 1% change in the return on the market. If the beta of a portfolio is 1.5, a 1 percent increase in the return of the market will result, on average, in a 1.5 percent increase in the return on the portfolio. The converse would also be true.
Dividend Yield - The total amount of dividends paid out for a stock over the preceding twelve months divided by the closing price of a share of the common stock.
Down Capture Ratio - The Down Capture Ratio is a measure of the Investment’s compound return when the Benchmark was down divided by the Benchmark’s compound return when the Benchmark was down. The smaller the value, the better.
Duration - A time measure of a bond’s interest-rate sensitivity, based on the weighted average of the time periods over which a bond’s cash flows accrue to the bondholder.
Forecasted Long-Term Earnings Growth - This growth rate is a measure of a company’s expected long-term success in generating future year-over-year earnings growth. This growth rate is a market value weighted average of the consensus (mean) analysts’ long-term earnings growth rate forecast for each company in the portfolio. The definition of long-term varies by analyst but is limited to a 3-8 year range. This value is expressed as the expected average annual growth of earnings in percent.
Information Ratio measures the excess return per unit of residual “non market” risk in a portfolio. The ratio is equal to the Alpha divided by the Residual Risk.
Market Capitalization - The market value of a company’s outstanding shares of common stock at a specific point in time, computed as the product of the number of outstanding shares times the stock’s closing price per share.
P/E ratio relates the price of the stock to the per-share earnings of the company. A high P/E generally indicates that the market will pay more to obtain the company because it has confidence in the company’s ability to increase its earnings. Conversely, a low P/E indicates that the market has less confidence that the company’s earnings will increase, and therefore will not pay as much for its stock. In most cases a fund with a high average P/E ratio has paid a premium for stocks that have a high potential for increased earnings. If the fund’s average P/E ratio is low, the manager may believe that the stocks have an overlooked or undervalued potential for appreciation.
P/B ratio of a company relates the per-share market price of the company’s stock to its per-share book value, the historical accounting value of the company’s tangible assets. A high P/B ratio indicates that the price of the stock exceeds the actual worth of the company’s assets. A low P/B ratio would indicate that the stock is a bargain, priced below what the company’s assets could be worth if liquidated.
P/CF ratio compares the total market value of the portfolio to the portfolio’s share of the underlying stocks’ earnings (or book value, cash flow, sales or dividends).
R-Squared indicates the extent to which the variability of the portfolio returns is explained by market action. It can also be thought of as measuring the diversification relative to the appropriate benchmark. An R-Squared value of .75 indicates that 75% of the fluctuation in a portfolio return is explained by market action. An R-Squared of 1.0 indicates that a portfolio’s returns are entirely related to the market and it is not influenced by other factors. An R-Squared of zero indicates that no relationship exists between the portfolio’s return and the market.
Residual Risk is the unsystematic risk of a fund, or the portion of the total risk unique to the manager and not related to the overall market. This reflects the “bets” which the manager places in that particular asset class. These bets reflect emphasis in particular sectors, maturities (for bonds), or other issue specific factors which the manager considers a good investment opportunity. Diversification of the portfolio will reduce the residual risk of that portfolio.
Sharpe Ratio is a measure of risk-adjusted return. It is calculated by subtracting the risk-free return (90 day T-Bills) from the portfolio return and dividing the resulting “excess return” by the portfolio’s total risk level (standard deviation). The result is a measure of returned gained per unit of total risk taken.
Standard Deviation is a statistical measure of portfolio risk. It reflects the average deviation of observations from their sample mean. Standard Deviation is used as an estimate of risk since it measures how wide the range of returns typically is. The wider the typical range of returns, the higher the standard deviation of returns, and the higher the portfolio risk. If returns are normally distributed (i.e. as a bell shaped curve distribution) then approximately 66% of 2/3 of the returns would occur within plus or minus one standard deviation of the sample mean.
Style Exposure Chart indicates a portfolio’s exposure to a particular capitalization (large, medium or small) and style (value or growth). Based on Sharpe’s return based style analysis, a style map will attempt to correlate a manager to a particular style of investing (i.e. Large Cap Growth).
Turnover Ratio - This is a measure of the fund’s trading activity which is computed by taking the lesser of purchases or sales (excluding all securities with maturities of less than one year) and dividing by average monthly net assets.
Up Capture Ratio - The Up Capture Ratio is a measure of the Investment’s compound return when the Benchmark was up divided by the Benchmark’s compound return when the Benchmark was up. The greater the value, the better.
Down Capture Ratio - The Down Capture Ratio is a measure of the Investment’s compound return when the Benchmark was down divided by the Benchmark’s compound return when the Benchmark was down. The smaller the value, the better.
55INTEGRITY. BALANCE. OBJECTIVITY.

Organization Asset BasePct. Owned by Employees CurrentBoutique vs. Institutional Growth of AUMRecent Changes in Ownership Capacity ConstraintsManagement Investment in Firm’s Products Soft ClosedSpecialized vs. All in One Re-opening of Products
People PerformanceSize of Team Short Term vs. Benchmark and Style GroupStructure of Team Long Term vs. Benchmark and Style GroupExperience of Team Consistency – Relative/Absolute/Risk AdjustedTurnover of Key MembersGrowth of Team with Assets
Philosophy/Process ExpensesStyle Consistency (Growth/Value, Market Cap) Cost vs. CompetitorsDomestic/Int’l drift
Examples of things that would cause concern resulting in a YELLOW or RED box include but not limited to:
6) EXPENSES - A fund or product that is substantially above the median expense ratio or management fee would be a cause for concern.
Fund Analysis Overview Key
1) ORGANIZATION - A change in ownership whereby it is unclear what the structure of the new organization will be, how will key personnel be compensated, and what type of employment contracts are in place to keep key decision makers.
2) PEOPLE - A change in portfolio manager would be a cause for concern. We would assess the new talent taking over. Is the new portfolio manager a current member of the team or is it someone new from outside the group or organization.
3) PHILOSOPHY/PROCESS - A change in portfolio characteristics would be a cause for concern. For example, if a growth style manager suddenly starts investing in value names during a value rally or if a small cap portfolio was migrating into midcap names due to asset growth.
4) ASSET BASE - A small cap fund with more than $3 billion in assets would be a cause for concern or a fund that continues to add assets as it becomes clear the portfolio management team can not handle the inflows. A sign of this would be a large increase in the cash position of the portfolio.
5) PERFORMANCE - A product that fails to outperform either the index and/or the median manager on a consistent basis (at least 50% of the time) would be a cause for concern. Short term and long term performance is considered both on an absolute basis and relative basis in addition to risk-adjusted measures.
Each of the 6 criteria are evaluated on an individual basis and subjective based on Innovest’s assessment. Below are examples of the many factors under each category we consider when making an assessment.
56INTEGRITY. BALANCE. OBJECTIVITY.

Holdings Based Attribution Key
A. Buy and Hold Portfolio – Return for the portfolio assuming no securities were traded during the quarter B. Portfolio Trading = (C – A) or (Actual Return ‐ Buy and Hold Portfolio) C. Actual Return – return the client experienced D. Benchmark Return – return for benchmark E. Actual Active Return – (C – D) or ( Actual Return minus Benchmark Return ) F. Stock Selection – Is the contribution to return based upon the active stock selection by the manager with in a sector compared to the benchmark. G. Sector Selection – Is the contribution to return based upon the active overweight or underweight of a sector compared to the benchmark by the
manager. H. Interaction – Is the impact of contribution to return that are a combination of both Stock and Security selection also sometimes referred to as the
unexplained. I. Total Selection – Is the Sum of all the selection affects (F,G,H) J. Portfolio Trading – Same as B. K. Benchmark Trading – Benchmark B/H return – Actual Benchmark Return L. Total Trading – Portfolio Trading plus Benchmark Trading M. Buy & Hold Active Return – I + L
57INTEGRITY. BALANCE. OBJECTIVITY.

Disclaimer The preceding statistical analysis was prepared by Innovest Portfolio Solutions LLC with data provided by Investment Metrics (IM), Lipper and Morningstar, Inc. All Rights Reserved. The investment products discussed are not insured by the FDIC and involve investment risk including the possible loss of all principal. The information contained herein: (1) is proprieta ry to the v endors listed above and/or its content providers; (2) may not be c opied or distributed; and (3) is not w arranted to be accurate, complete or timely. None of the vendors nor its content providers are respons ible for any damages or losses arising from any use of this information. Past performance is no guarantee of future results. Innovest compiles the information utilizing secondary data from statements provided by the plan trustee and/or custodian/ This report may also contain returns and valuations from outside sources as directed b y the client. Innovest assumes no respons ibility for the accuracy of these valuations or return methodologies. Reasonable care has been take n to assure the accuracy of the computer software and databases. Innovest disclaims responsibility, financial or ot herwise for t he accuracy and completeness of this report. Copyright 2015 by Innovest Portfolio Solutions LLC Inc. Note: Actual client mutual fund returns are reflected on the table of returns page. Fund pages subsequent to the table of returns reflect the representative mutual fund with the longest track record and may not be the actual share class held by the client. “Copyright 2015, Standard & Poor’s Financial Services LLC. Reproduction of S&P Index Services in any form is prohibited except with the prior written permission of S&P. S&P does not guarantee the accuracy, adequacy, completeness or availability of any information and is not responsible for an y errors or omissions, regardless of the cause or for the r esults obtained from the use of such information. S&P DISCLAIMS ANY AND ALL EXPRESS OR IMPLIED WARRANTIES, INCLUDING, BUT NOT LIMITED TO, ANY WARRANTIES OF MERCHANTABILITY OR FITNESS FOR A PAR TICULAR PURPOSE OR USE. In no event shall S&P be liable f or any direct, indirect, special or consequential damages, costs, expenses, legal fees, or losses (including lost income or lost profit and opportunity costs) in connection with subscriber’s or others’ use of S&P Index Services (2015) Copyright MSCI 2015. Unpublished. All Rights R eserved. This information may only be used for your internal use, may not be reproduced or re-disseminated in any form and m ay not be used to create any financial instruments or products or an y indices. This information is provided on an “as is” basis and the user of this informa tion assumes the entire risk of any use it ma y make or permit t o be made of thi s information. Neither MSCI, an y or its affiliates o r any other person involved in or related to compiling, computing or creating this information makes any express or implied warranties or representations with respect to such information or the results to be ob tained by the use thereof, and MSCI, its affiliates and each such other person hereby expressly disclaim all warr anties (including, without limitation, all warranties of o riginality, accuracy, completeness, timeliness, non-infringement, merchantability and fitness for a particular purpose) with respect to this information. Without lim iting any of the foregoing, in no ev ent shall MSCI, any of its affiliat es or any other person involved in or related to compiling, computing or creating this information have any liability for any direct, indirect, special, incidental, punit ive, consequential or an y other damages (including, without limitation, lost profits) even if notified of, or if it might otherwise have anticipated, the possibility of such damages.
58INTEGRITY. BALANCE. OBJECTIVITY.

It’s a Brand New
Year - M
ake Your Retirement
Plan a ResolutionD
id you know that on average, 45%
of Am
ericans m
ake New
Year’s Resolutions each year but only 8%
actually keep them
? If you are a millennial, 24%
of you are likely to keep your resolutions as com
pared to 14%
of the over 50 generation. Interesting statistics from
the University of Scranton to ponder
as we close the book on 2015 and begin a fresh new
chapter titled 2016.
If you are one of the 45% w
ho make N
ew Year’s
resolutions, let’s take a different tack in 2016 and add a retirem
ent plan checkup to the list of old standbys like eating healthier, or joining a gym
. Let’s look at som
e financial resolutions that are easy to m
ake and even easier to keep.
Participate in your Retirem
ent Savings Plan – If your em
ployer’s plan is voluntary and you are not participating, w
hat are you w
aiting for? Tim
e is a valuable asset and the younger you are w
hen you start saving, the less you have to save to m
eet your retirement goals.
The pow
er of compounding really does m
atter.
You cannot afford to wait, so dip your toe in the
water, even if it is just 1%
of your pay, and start saving today.
Set Retirem
ent Goals – You need to consider
several factors in order to set your goals. D
oes longevity run in your family? W
ill your house be paid off at retirem
ent? Are
you eligible for Social Security? Do you
plan on working after retirem
ent? Some experts
think that you will need 70%
to 80% of your pre-
retirement incom
e to support you during your retirem
ent years. That num
ber may vary depending
on your spending goals. Do you plan on traveling
the world or sitting on your deck and w
atching the w
orld go by? Try using one of the online calculators to help project your incom
e needs in retirement. If
you have already set goals, good for you, but you w
ill need to hold yourself accountable by comparing
your actual balances with your projected needs on
an annual basis. No one has ever com
plained about saving too m
uch.
Save Your Raise – W
hen you receive an increase in pay consider increasing your salary deferral contribution percentage by a portion of your salary increase. You are used to living on your current paycheck, so you
won’t m
iss those extra dollars, making it an ideal
time to increase your retirem
ent savings rate. It is a fairly painless w
ay to increase the amount you save
in your retirement plan each year. If your provider
offers auto escalation, sign up and the increase will
happen automatically at the tim
e and amount you
set each year.
If the contribution rate in your employer
sponsored plan is fixed, consider making additional
contributions to any supplemental retirem
ent plans that m
ay be offered such as a 457 plan or an IRA
.
WIN
TE
R 2
01
6
1
C
ontinued on page 2
1
23
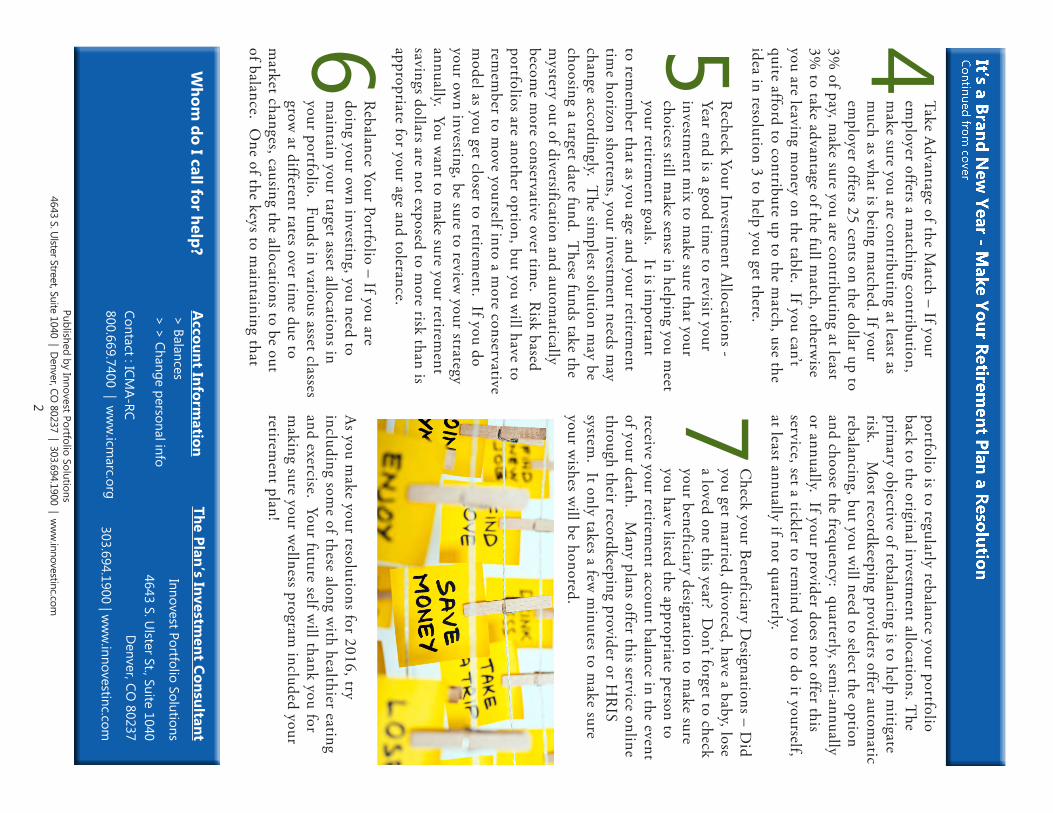
It’s a Brand New
Year - Make Your Retirem
ent Plan a ResolutionContinued from
cover
Take Advantage of the M
atch – If your em
ployer offers a matching contribution,
make sure you are contributing at least as
much as w
hat is being matched. If your
employer offers 25 cents on the dollar up to
3% of pay, m
ake sure you are contributing at least 3%
to take advantage of the full match, otherw
ise you are leaving m
oney on the table. If you can’t quite afford to contribute up to the m
atch, use the idea in resolution 3 to help you get there.
Recheck Your Investm
ent Allocations -
Year end is a good time to revisit your
investment m
ix to make sure that your
choices still make sense in helping you m
eet your retirem
ent goals. It is important
to remem
ber that as you age and your retirement
time horizon shortens, your investm
ent needs may
change accordingly. The sim
plest solution may be
choosing a target date fund. These funds take the
mystery out of diversification and autom
atically becom
e more conservative over tim
e. Risk based
portfolios are another option, but you will have to
remem
ber to move yourself into a m
ore conservative m
odel as you get closer to retirement. If you do
your own investing, be sure to review
your strategy annually. You w
ant to make sure your retirem
ent savings dollars are not exposed to m
ore risk than is appropriate for your age and tolerance.
Rebalance Your Portfolio – If you are
doing your own investing, you need to
maintain your target asset allocations in
your portfolio. Funds in various asset classes grow
at different rates over time due to
market changes, causing the allocations to be out
of balance. One of the keys to m
aintaining that
portfolio is to regularly rebalance your portfolio back to the original investm
ent allocations. The
primary objective of rebalancing is to help m
itigate risk. M
ost recordkeeping providers offer automatic
rebalancing, but you will need to select the option
and choose the frequency: quarterly, semi-annually
or annually. If your provider does not offer this service, set a tickler to rem
ind you to do it yourself, at least annually if not quarterly.
Check your Beneficiary D
esignations – Did
you get married, divorced, have a baby, lose
a loved one this year? Don’t forget to check
your beneficiary designation to make sure
you have listed the appropriate person to receive your retirem
ent account balance in the event of your death. M
any plans offer this service online through their recordkeeping provider or H
RIS
system. It only takes a few
minutes to m
ake sure your w
ishes will be honored.
As you m
ake your resolutions for 2016, try including som
e of these along with healthier eating
and exercise. Your future self will thank you for
making sure your w
ellness program included your
retirement plan!
2
Published by Innovest Portfolio Solutions4643 S. Ulster Street, Suite 1040 | Denver, CO
80237 | 303.694.1900 | ww
w.innovestinc.com
456
7
Whom
do I call for help?A
ccount Information
> Balances> > Change personal info
Contact : ICMA-RC
800.669.7400 | ww
w.icm
arc.org
The Plan’s Investment Consultant
Innovest Portfolio Solutions
4643 S. Ulster St., Suite 1040D
enver, CO 80237
303.694.1900 | ww
w.innovestinc.com
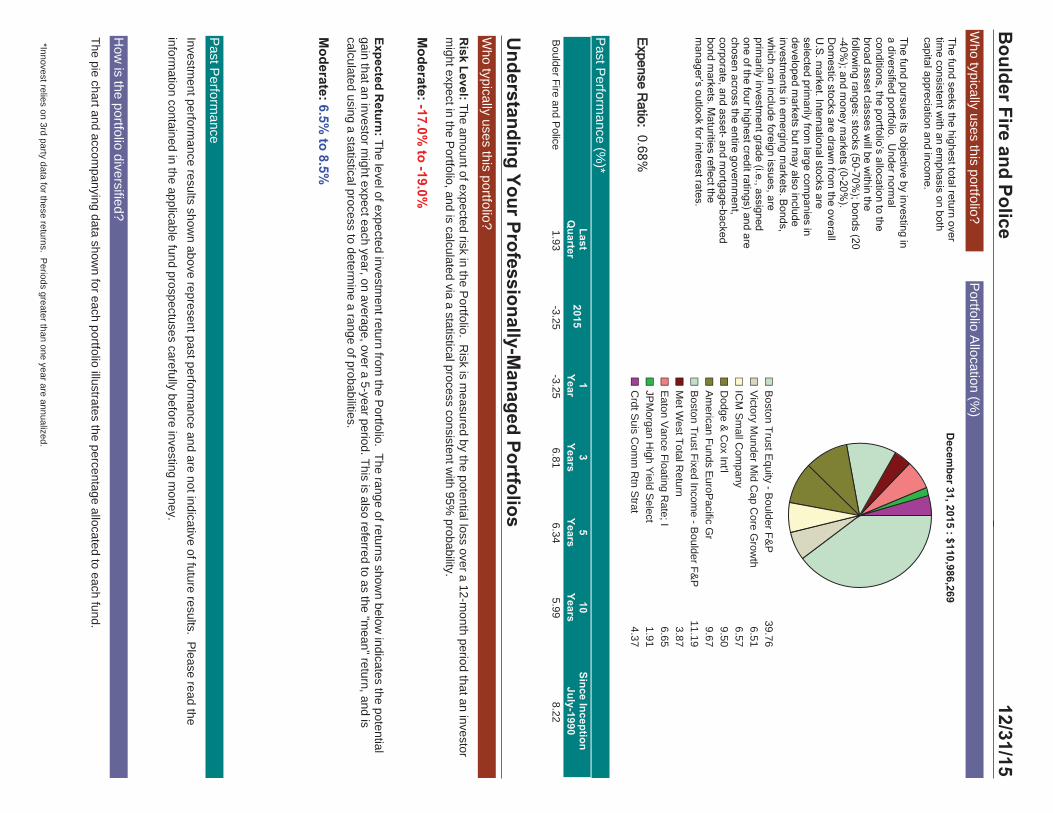
The pie chart and accompanying data show
n for each portfolio illustrates the percentage allocated to each fund.
How
is the portfolio diversified?
Investment perform
ance results shown above represent past perform
ance and are not indicative of future results. Please read the
information contained in the applicable fund prospectuses carefully before investing m
oney.
Past P
erformance
Risk Level:The am
ount of expected risk in the Portfolio. R
isk is measured by the potential loss over a 12-m
onth period that an investorm
ight expect in the Portfolio, and is calculated via a statistical process consistent w
ith 95% probability.
Moderate:-17.0%
to -19.0%
Expected Return: The level of expected investm
ent return from the P
ortfolio. The range of returns shown below
indicates the potentialgain that an investor m
ight expect each year, on average, over a 5-year period. This is also referred to as the "mean" return, and is
calculated using a statistical process to determine a range of probabilities.
Moderate:6.5%
to 8.5%
Who typically uses this portfolio?
Understanding Your Professionally-M
anaged Portfolios
Portfolio A
llocation (%)
Who typically uses this portfolio?
The fund seeks the highest total return over
time consistent w
ith an emphasis on both
capital appreciation and income.
The fund pursues its objective by investing in
a diversified portfolio. Under norm
alconditions, the portfolio’s allocation to thebroad asset classes w
ill be within the
following ranges: stocks (50-70%
); bonds (20-40%
); and money m
arkets (0-20%).
Dom
estic stocks are drawn from
the overallU
.S. m
arket. International stocks areselected prim
arily from large com
panies indeveloped m
arkets but may also include
investments in em
erging markets. B
onds,w
hich can include foreign issues, areprim
arily investment grade (i.e., assigned
one of the four highest credit ratings) and arechosen across the entire governm
ent,corporate, and asset- and m
ortgage-backedbond m
arkets. Maturities reflect the
manager’s outlook for interest rates.
Past P
erformance (%
)*
Expense R
atio:0.68%
Decem
ber 31, 2015 : $110,986,269
Boston Trust E
quity - Boulder F&
P39.76
Victory M
under Mid C
ap Core G
rowth
6.51
ICM
Sm
all Com
pany6.57
Dodge &
Cox Int'l
9.50
Am
erican Funds EuroP
acific Gr
9.67
Boston Trust Fixed Incom
e - Boulder F&
P11.19
Met W
est Total Return
3.87
Eaton V
ance Floating Rate; I
6.65
JPM
organ High Y
ield Select
1.91
Crdt S
uis Com
m R
tn Strat
4.37
LastQ
uarter2015
1Year
3Years
5Years
10Years
Since InceptionJuly-1990
Boulder Fire and P
olice1.93
-3.25-3.25
6.816.34
5.998.22
Boulder Fire and Police
12/31/15
*Innovest relies on 3rd party data for these returns. Periods greater than one year are annualized.