Embed Size (px)
Citation preview

PPoorrttffoolliioo MMaannaaggeemmeenntt UUsseerr GGuuiiddeeVVeerrssiioonn 1188
AAuugguusstt 22001188

3
Contents
About This Guide ............................................................................................................................... 7
Portfolios Overview ........................................................................................................................... 7
Create ............................................................................................................................................... 8
Creating Projects for Portfolio Management ........................................................................................ 8
Project Templates Overview ........................................................................................................ 8Add a Project Template ........................................................................................................ 9
Add a Project .............................................................................................................................. 10
Add a Project Proposal ............................................................................................................... 11
Assign a User or a Group Access to a Project ........................................................................... 12
Assign a User Role to a Project ................................................................................................. 12
Add a Dependency to a Project ................................................................................................. 13
Assign a Code to a Project ......................................................................................................... 14
Add a File to the File List ............................................................................................................ 14
Assign a Manager to a Project ................................................................................................... 15
Configure the Projects Inventory Panel ..................................................................................... 16
Configure a Cash Flow Curve Source ........................................................................................ 16
Link Forecast And Actuals Values ............................................................................................. 17
Add Cost Data to a Project on the Cash Flow Page Manually ................................................. 17
Working with Cost Curves .......................................................................................................... 18
Working with the Cash Flow Page when Integrated with P6 EPPM Task ................................ 20
Change the Status of a Project .................................................................................................. 21
Assign a Role from a Workspace ............................................................................................... 22
Delete a Project .......................................................................................................................... 22
Create a Portfolio .................................................................................................................................. 23
Add a Portfolio ............................................................................................................................ 24
Add Projects to a Portfolio ......................................................................................................... 24
Set a Project List in a Portfolio to Refresh Automatically ........................................................ 25
Add a Portfolio to a Portfolio ...................................................................................................... 25
Assign Users or Groups Access to a Portfolio ........................................................................... 26
Portfolio Planning User Roles Overview .................................................................................... 27
Assign User Roles to a Portfolio ......................................................................................... 27
Assign a Manager to a Portfolio ................................................................................................ 28
Add a File to the File List ............................................................................................................ 28
Configure the Portfolios Inventory Panel .................................................................................. 29
Add an Image to a Portfolio ....................................................................................................... 29
Configure Settings for a Portfolio Budget Plan ................................................................................... 29
Set the Budget Planning Options for a Portfolio....................................................................... 30
Set Workflows for Reviewing, Proposing, and Approving a Budget Planning Scenario ......... 30
Portfolio Management User Guide
4
Create Thresholds and Alerts for a Budget Plan ...................................................................... 31
Add a Threshold for a Budget Plan .................................................................................... 31
Configure a Threshold for a Budget Plan .......................................................................... 32
Set Threshold Alert Delivery Options for a Budget Plan ................................................... 32
Portfolio Budget Plan Status Reference ................................................................................... 33
Plan ................................................................................................................................................. 33
Project and Portfolio Evaluation Overview .......................................................................................... 33
Evaluation Categories Overview ................................................................................................ 34Add an Evaluation Matrix ................................................................................................... 34
Rank a Project or Idea Against Evaluation Categories ............................................................. 35
Review Evaluation Scores for a Project or Idea ........................................................................ 35
Review and Update Evaluation Scores for a Portfolio ............................................................. 36
Analyze Portfolio Performance Using the Investor Map ........................................................... 37
Add an Investor Map View ......................................................................................................... 38
Build a Portfolio Budget Plan ............................................................................................................... 38
Budget Planning Overview ......................................................................................................... 40
Add a Budget Planning Scenario ....................................................................................... 40
Set the Target Budget for a Budget Planning Scenario ................................................... 41
Configure the Budget Planning Page Project View ........................................................... 41
Configure the Budget Planning Page Chart ...................................................................... 42
View Project Dependencies on the Budget Planning Page .............................................. 42
Configure the Waterline View on the Budget Planning Page ........................................... 43
Select Projects for a Budget Planning Scenario ............................................................... 43
Budget Scenario Optimization Overview ........................................................................... 44
Working with the Budget Scenario Optimization Tool ...................................................... 45
Use Optimization to Select Projects for a Budget Planning Scenario ............................. 46
Use Optimization Recommendations in a Budget Planning Scenario ............................. 48
Understanding Budget Scenario Optimization Calculations ............................................ 48
Understanding Budget Scenario Optimization Results .................................................... 51
Link a Project's Proposed Budget with a Forecast or Planned Budget Value ................. 54
Directly Allocate a Proposed Budget and Dates for a Project Within Budget Plan Scenarios ............................................................................................................................................. 54
Assign a Portfolio Fund to a Project .................................................................................. 55
Selection Analysis Overview ...................................................................................................... 56
Add a Budget Plan Scenario on the Selection Analysis Page .......................................... 57
Configure a Selection Analysis View .................................................................................. 57
View Project Dependencies on the Selection Analysis Page ........................................... 58
Configure the Waterline View on the Selection Analysis Page......................................... 58
Select Projects for a Budget Plan Scenario on the Selection Analysis Page .................. 59
Link a Project's Proposed Budget with a Forecast or Planned Budget Value on the Selection Analysis Page ...................................................................................................................... 59
Directly Allocate a Proposed Budget and Dates for Projects Within Budget Plan Scenarios on the Selection Analysis Page .......................................................................................... 60
Create an Analysis View in a Portfolio ............................................................................... 61
Add an Analysis View .......................................................................................................... 61
Contents
5
Configure an Analysis View ................................................................................................ 62
Associate an Existing Analysis View .................................................................................. 62
Scenario Comparison Overview ................................................................................................. 63
Configure the Scenario Comparison Page ........................................................................ 63
Compare Scenarios ............................................................................................................ 64
Build a Portfolio Resource Plan ........................................................................................................... 65
Resource Planning Overview ..................................................................................................... 65
Add a Resource Planning Scenario ................................................................................... 66
Configure the Resource Planning Page ............................................................................. 66
Select Projects for a Resource Planning Scenario ........................................................... 67
Allocate Role Units on the Resource Planning Page ........................................................ 68
Modify Allocation Dates on the Resource Planning Page ................................................ 69
Monitor Role Costs on the Resource Planning Page ........................................................ 70
Prioritize Projects for Execution on the Resource Planning Page.................................... 71
Resource Scenario Optimization Overview ....................................................................... 72
Working with the Resource Scenario Optimization Tool .................................................. 73
Use Optimization to Select Projects for a Resource Planning Scenario .......................... 74
Understanding Resource Scenario Optimization Calculations ........................................ 75
Understanding Resource Scenario Optimization Results ................................................ 77
Resource Planning Field Definitions ................................................................................. 78
Scenario Comparison Overview ................................................................................................. 82
Configure the Scenario Comparison Page ........................................................................ 82
Compare Scenarios ............................................................................................................ 83
Budget Plan Approval Process Overview ............................................................................................ 84
Send a Portfolio Budget Plan Scenario for Review .................................................................. 84
Review a Portfolio Budget Plan Scenario Sent for Review ...................................................... 85
Monitor a Portfolio Budget Plan Scenario Review ................................................................... 86
Propose a Portfolio Budget Plan Scenario ................................................................................ 87
Review a Proposed Budget for a Project in a Shared Budget Plan Scenario ......................... 87
Monitor Budget Negotiations for a Proposed Budget Plan Scenario ...................................... 88
Send a Portfolio Budget Plan Scenario for Approval ................................................................ 89
Approve a Portfolio Budget Plan Scenario ................................................................................ 90
Update an Approved Portfolio Budget Plan .............................................................................. 90
Portfolio Budget Plan Scenario Status Reference ................................................................... 91
Resource Plan Approval Process Overview ......................................................................................... 91
Send a Resource Plan Scenario for Review ............................................................................. 92
Review a Resource Plan Scenario Sent for Review ................................................................. 92
Monitor a Resource Plan Scenario Review ............................................................................... 93
Propose a Resource Plan Scenario ........................................................................................... 94
Review a Proposed Resource Plan Scenario ............................................................................ 94
Monitor Resource Plan Negotiations for a Proposed Resource Plan Scenario ...................... 96
Send a Resource Plan Scenario for Approval ........................................................................... 96
Approve a Resource Plan Scenario ........................................................................................... 97
Update an Approved Resource Plan ......................................................................................... 98

Portfolio Management User Guide
6
Resource Plan Scenario Status Reference ............................................................................... 98
Monitor ........................................................................................................................................... 98
Monitor a Project .................................................................................................................................. 98
Update and Review Project Data .............................................................................................. 99
Create a Snapshot of Project Data.......................................................................................... 100
View a Dashboard .................................................................................................................... 100
Working with Cost Curves ........................................................................................................ 100
Monitor a Portfolio .............................................................................................................................. 102
Measures Overview .................................................................................................................. 102Create a Measure ............................................................................................................. 102
Add a Measure ................................................................................................................. 103
Set a Threshold for a Measure ........................................................................................ 104
Associate a Measure with a Portfolio .............................................................................. 105
Working with Creating Measures ..................................................................................... 106
Update a Portfolio Measure Target and Actual Value Manually ............................................ 109
Monitor a Summary Portfolio Scorecard ................................................................................. 110
Scorecard Page Overview ........................................................................................................ 110
Monitor a Portfolio Scorecard .......................................................................................... 111
Scorecard Views Overview ............................................................................................... 112
Add a Scorecard View....................................................................................................... 112
Apply a Scorecard View .................................................................................................... 112
View a Dashboard .................................................................................................................... 113
Monitor an Approved Portfolio Budget Plan ..................................................................................... 113
Scorecard Page Overview ........................................................................................................ 113Monitor an Approved Budget Plan from the Scorecard Page ........................................ 114
Collaborate on an Approved Budget Plan from the Scorecard Page ............................. 114
Create a Snapshot of a Budget Plan from the Scorecard Page ..................................... 115
Update an Approved Portfolio Budget Plan from the Scorecard Page .......................... 115
View a Dashboard ............................................................................................................ 116
Spending Page Overview ......................................................................................................... 116Monitor a Budget Plan from the Spending Page ............................................................ 116
Collaborate on an Approved Portfolio Budget Plan from the Spending Page ............... 117
Create a Snapshot of a Budget Plan from the Spending Page ...................................... 118
Update an Approved Budget Plan from the Spending Page .......................................... 118
Legal Notices ................................................................................................................................ 119

7
About This Guide
This guide explains how to use Oracle Prime Projects to develop and monitor portfolios, including portfolios to develop long-range budget and resource plans.
Portfolio managers, budget and resource planners, project managers, stakeholders, and anyone else who participates in the portfolio planning process should read this guide.
Portfolios Overview
The Portfolios context in Prime Projects provides an environment to develop and monitor portfolios, enabling organizations to strategically and efficiently respond to change. Create portfolios using projects, existing portfolios, or a combination of projects and portfolios.
Prime Projects enables seamless collaboration between project managers, budget and resource planners, and key stakeholders throughout the entire budget and resource planning processes, including during critical budget and resource negotiation cycles.
Key Features
Budget Planning: Supports the project prioritization and selection process using multiple tools including waterline features, Efficient Frontier optimization, and customized analysis views. Enables budget planners to allocate budgets and funds, review annual budgets against key targets, recommend priorities, and model strategies to manage long-range budget planning requirements by creating multiple what-if scenarios.
Resource Planning: Enables portfolio managers to allocate resources and select the right combination of projects to execute under resource constraints. Use resource planning optimization to generate the selection of projects that maximizes portfolio value.
Review, Propose, and Approve Processes: Supports reviews with stakeholders to determine the best mix of projects for inclusion in proposed budget and resource plans. Enables planners to share scenario proposals with project managers for negotiations and approvals.
Measures: Provide a means for portfolio managers to define quantitative targets and analyze actuals for monitoring portfolio performance.
Prioritization Matrix: Enables portfolio managers to create a project evaluation matrix to prioritize and select the right projects or proposals for the organization to pursue, based on quantitative data.
Monitoring: Enables portfolio managers to monitor performance across all portfolios within a workspace using a Summary Scorecard or individual portfolios using Scorecards, Spending, and Dashboards. Analyze portfolio performance by project or sub-portfolios using the Investor Map.

Portfolio Management User Guide
8
Create
Creating Projects for Portfolio Management
The following tasks are the typical steps you can take when initially creating projects.
1) Add a Project (on page 10) or Add a Project Proposal (on page 11)
2) Assign a User or a Group Access to a Project (on page 12)
3) Assign a User Role to a Project (on page 12)
4) Add a Dependency to a Project (on page 13)
5) Assign a Code to a Project (on page 14)
6) Add a File to the File List (on page 14)
7) Assign a Manager to a Project (on page 15)
8) Change the Status of a Project (on page 21)
If your organization is using these projects for portfolio budget planning, you may want to add cost data early in the process.
Configure a Cash Flow Curve Source (on page 16)
Link Forecast And Actuals Values (on page 17)
Add Cost Data to a Project on the Cash Flow Page Manually (on page 17)
If your organization is using these projects for resource planning, you will need to assign roles to your projects first.
Assign a Role from a Workspace (on page 22)
Project Templates Overview
Project templates are reusable models of projects you can store and use later to save time and standardize your operations.
A template includes all the details, best practices, and de facto standards your organization associates with projects of a particular type. Use project templates to create a library of predefined project structures that can later be used as starting points for new projects.
For example, say your organization is responsible for managing the construction of store Smith Wholesale in multiple states. The WBSs and resources are essentially the same. A template in this situation enables you to quickly create the project and add any unique requirements for the projects in the different states.
A project template can be created from scratch or can be created using an existing project or template. When a template is created from an existing project, all the actual values, including dates, units, and durations, and location fields are cleared. If the data in the project being copied is not included in the parent workspace where the project template exists, the data is promoted to the parent workspace. This data includes resources, roles, configured fields, dashboards, units of measure, calendars, and curves.
.The following data is not copied into project templates from existing projects:
Create
9
Scope data, including the PBS, scope items, and work packages.
Relationships between projects.
Risk matrixes and thresholds stored at the workspace level. Project-level matrixes and thresholds are copied.
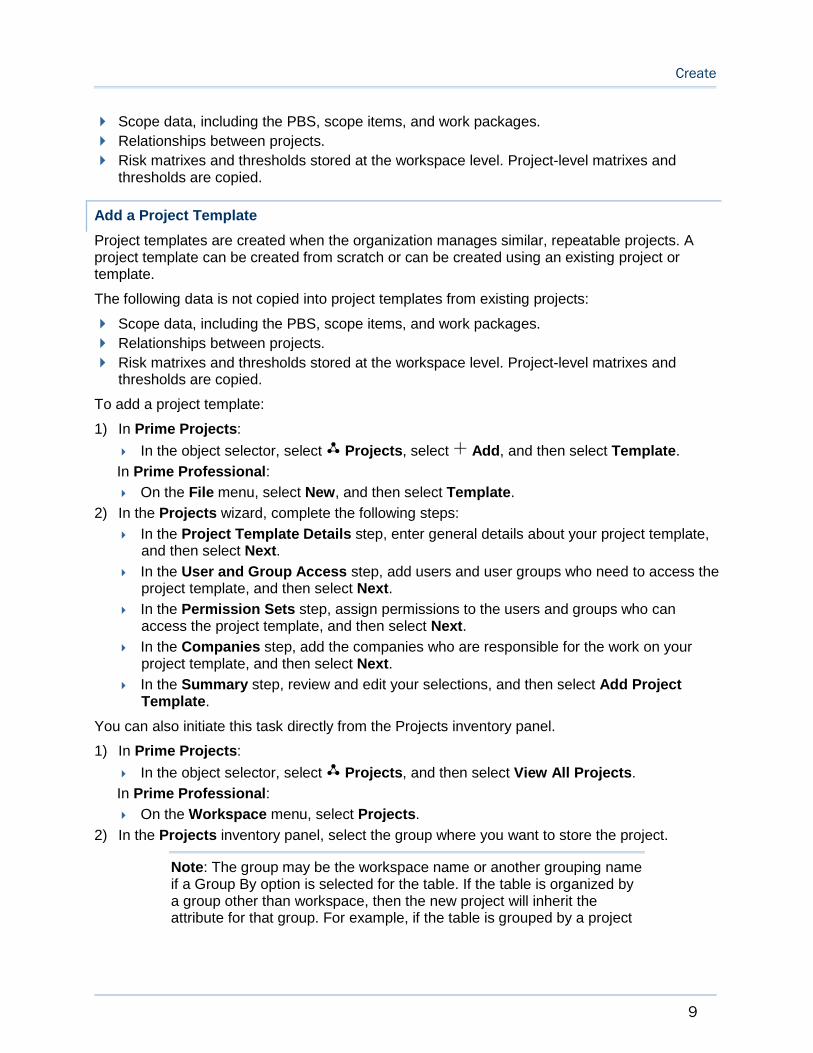
Add a Project Template
Project templates are created when the organization manages similar, repeatable projects. A project template can be created from scratch or can be created using an existing project or template.
The following data is not copied into project templates from existing projects:
Scope data, including the PBS, scope items, and work packages.
Relationships between projects.
Risk matrixes and thresholds stored at the workspace level. Project-level matrixes and thresholds are copied.
To add a project template:
1) In Prime Projects:
In the object selector, select Projects, select Add, and then select Template.
In Prime Professional:
On the File menu, select New, and then select Template.
2) In the Projects wizard, complete the following steps:
In the Project Template Details step, enter general details about your project template, and then select Next.
In the User and Group Access step, add users and user groups who need to access the project template, and then select Next.
In the Permission Sets step, assign permissions to the users and groups who can access the project template, and then select Next.
In the Companies step, add the companies who are responsible for the work on your project template, and then select Next.
In the Summary step, review and edit your selections, and then select Add Project Template.
You can also initiate this task directly from the Projects inventory panel.
1) In Prime Projects:
In the object selector, select Projects, and then select View All Projects.
In Prime Professional:
On the Workspace menu, select Projects.
2) In the Projects inventory panel, select the group where you want to store the project.
Note: The group may be the workspace name or another grouping name if a Group By option is selected for the table. If the table is organized by a group other than workspace, then the new project will inherit the attribute for that group. For example, if the table is grouped by a project
Portfolio Management User Guide
10
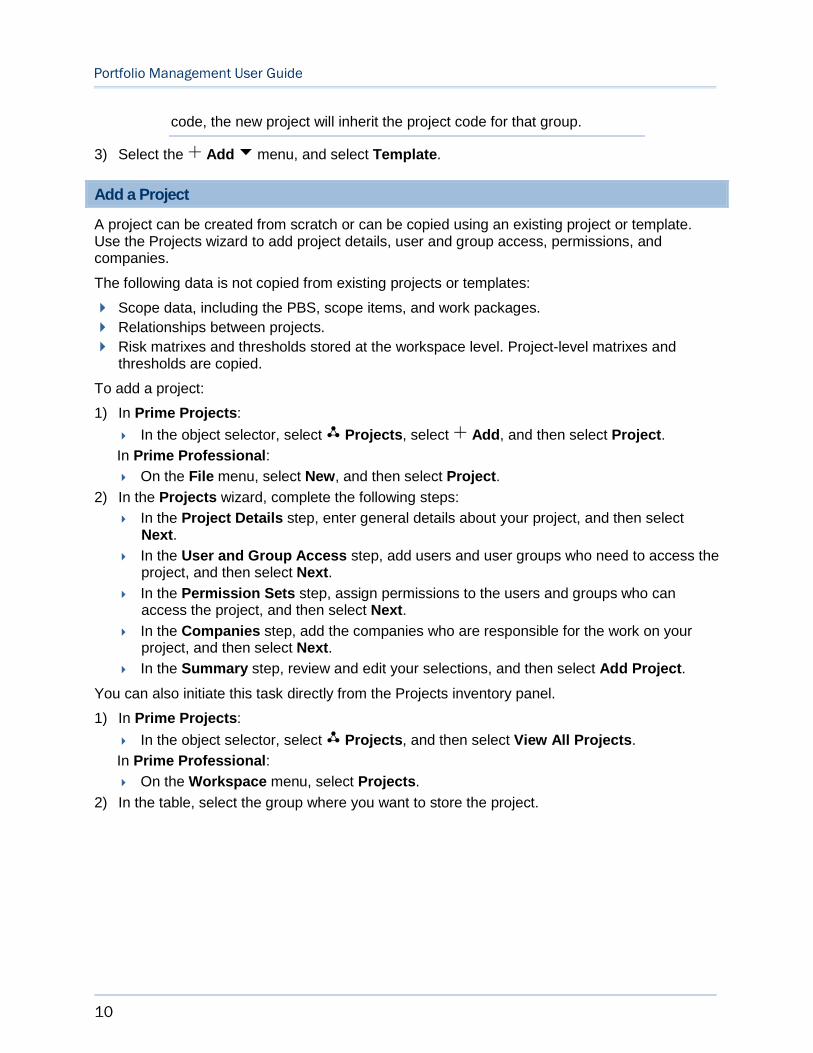
code, the new project will inherit the project code for that group.
3) Select the Add menu, and select Template.
Add a Project
A project can be created from scratch or can be copied using an existing project or template. Use the Projects wizard to add project details, user and group access, permissions, and companies.
The following data is not copied from existing projects or templates:
Scope data, including the PBS, scope items, and work packages.
Relationships between projects.
Risk matrixes and thresholds stored at the workspace level. Project-level matrixes and thresholds are copied.
To add a project:
1) In Prime Projects:
In the object selector, select Projects, select Add, and then select Project.
In Prime Professional:
On the File menu, select New, and then select Project.
2) In the Projects wizard, complete the following steps:
In the Project Details step, enter general details about your project, and then select Next.
In the User and Group Access step, add users and user groups who need to access the project, and then select Next.
In the Permission Sets step, assign permissions to the users and groups who can access the project, and then select Next.
In the Companies step, add the companies who are responsible for the work on your project, and then select Next.
In the Summary step, review and edit your selections, and then select Add Project.
You can also initiate this task directly from the Projects inventory panel.
1) In Prime Projects:
In the object selector, select Projects, and then select View All Projects.
In Prime Professional:
On the Workspace menu, select Projects.
2) In the table, select the group where you want to store the project.
Create
11
Note: The group may be the workspace name or another grouping name if a Group By option is selected for the table. If the table is organized by a group other than workspace, then the new project will inherit the attribute for that group. For example, if the table is grouped by a project code, the new project will inherit the project code for that group.
3) Select the Add menu, and then select Project.
Tips
The project is set to Active by default.
You can create a project collection directly from the Projects inventory panel to easily manage a subset of projects that are important to you or a group. Select multiple projects, select the Context menu, and select Create Project Collection.
Add a Project Proposal
Add project proposals when new projects are required to go through a formal workflow process to move from the proposal stage to become approved projects in the planning stage.
Note: A workflow must be available to add project proposals. The workflow process will determine if the projects will be approved and put in a planning state or rejected.
1) In Prime Projects:
In the object selector, select Projects, select Add, and then select Proposal.
In Prime Professional:
On the File menu, select New, and then select Proposal.
2) In the Project Proposal Details step of the wizard, enter general project proposal information, and then select Add Project Proposal.
You can also initiate this task directly from the Projects inventory panel.
1) In Prime Projects:
In the object selector, select Projects, and then select View All Projects.
In Prime Professional:
On the Workspace menu, select Projects.
2) In the table, select the group where you want to store the project.
Note: The group may be the workspace name, or another grouping name if a Group By option is selected for the table. If the table is organized by a group other than workspace, then the new project will inherit the attribute for that group. For example, if the table is grouped by Location, then the new project will inherit the location for that group.
3) Select the Add menu, and select Proposal.

Portfolio Management User Guide
12
Assign a User or a Group Access to a Project
Users can be assigned to projects individually or through user groups. Each user or user group must be assigned a project permission set. A user group may have been configured with a default permission set. This permission set can be changed for the project assignment at any time.
To assign user access to a project:
1) In the object selector, select a project.
2) In the sidebar, hover over Project Team, and select Security.
3) Select the Assign menu, and then select User or Group.
4) In the Assign User or Assign Group dialog box, enter the user or group name.
5) Select the name, and select Next.
6) In the Permission Set column, select a permission set for each permission type.
Note: If you assigned a user group that is configured with a default permission set, you can keep the default or select another if necessary.
7) Add any other optional permission sets applicable to that user or group.
8) Select Assign.
9) Select Save.
You can also do this in the Projects inventory panel.
1) In Prime Projects:
In the object selector, select Projects, and then select View All Projects.
In Prime Professional:
On the Workspace menu, select Projects.
2) In the table, select a project, and then select the Security detail window.
Tips
If you added the project in the application, you are automatically assigned access to the project with the Administrator permission set assigned.
The Search feature searches the entire list of users for matches. During that initial search, it will stop after finding 500 results, then filter out those who have already been assigned. For this reason, your maximum number of search results might vary. To limit the number of results, be as specific as possible when entering a name in the search field. For example, enter the first and last name of the user.
Assign a User Role to a Project
Assigning roles enables you to route built-in portfolio budget planning and resource planning workflow steps to specific users.
To assign user roles to a project:
1) In the object selector, select a project.

Create
13
2) In the sidebar, hover over Project Team, and select Security.
3) Select Edit Roles.
4) In the Edit Roles dialog box, if the users you want to assign roles are not listed, select Assign Users.
5) In the Select User dialog box, enter a username, select the name, and then select Assign.
6) Select the roles you want users to perform.
7) Review the primary roles in the Set Primary Role Defaults section, and make updates as necessary.
8) Select Assign.
9) Select Save.
You can also do this in the Projects inventory panel.
1) In Prime Projects:
In the object selector, select Projects, and then select View All Projects.
In Prime Professional:
On the Workspace menu, select Projects.
2) In the table, select a project, and then select the Security detail window.
Add a Dependency to a Project
Identify relationships between projects using project dependencies. Dependencies are used in portfolio budget planning to ensure all dependent projects are included in a budget planning scenario. The project dependencies supported in the application are Depends On and Supports.
Depends On: A project depends on work being performed in another project. For example, Project A depends on some aspect of Project B and cannot be completed without that work being performed.
Supports: A project is supporting another project. For example, Project B is supporting Project A.
To add a dependency:
1) In the object selector, select a project.
2) In the sidebar, select Summary & Settings.
3) On the Summary & Settings menu, select Dependencies.
4) Determine whether your project depends on another project or supports another project, and select Assign.
5) In the Select Project dialog box, select a project, and select OK.
6) Select Save.
7) In the Summary & Settings panel, select Close.
You can also do this in the Projects inventory panel.
1) In the object selector, select Projects, and then select View All Projects.
2) In the table, select the project row, and then select the Dependencies detail window.
Portfolio Management User Guide
14
Assign a Code to a Project
Assign codes to projects to help track projects based on attributes they share. When managing a large number of projects, project codes enable you to filter and group information across the organization.
To assign a code to a project:
1) Navigate to the project Codes page:
In Prime Projects:
a. In the object selector, select a project.
b. In the sidebar, select Summary & Settings.
c. On the Summary & Settings menu, select Codes.
In Prime Professional:
On the Project menu, select Project Codes.
2) Select Assign.
3) In the Select Code Value dialog box, expand the code, and select the code value.
4) Select OK.
5) Save your changes:
In Prime Projects:
a. Select Save.
b. In the Summary & Settings panel, select Close.
In Prime Professional:
Select Save.
You can also do this in the Projects inventory panel.
1) In Prime Projects:
In the object selector, select Projects, and then select View All Projects.
In Prime Professional:
On the Workspace menu, select Projects.
2) In the table, select a project, and then select the Codes detail window.
Add a File to the File List
Add relevant files, such as costing spreadsheets, contracts, specifications, and audio and video files, to your projects, portfolios, or ideas to support your organization's data.
To add a file to the File List:
1) Navigate to the files page:
In Prime Projects:
a. In the object selector, select a project, portfolio, or idea.
b. In the sidebar, hover over Files, and select File List.
In Prime Professional:
On the Project menu, select Files.
Create
15
2) In the table, select a folder, and then select Add File.
3) In the Upload File dialog box, select a file, and then select OK.
Tips
If an issue is detected with a file, you are notified and the contents of the file are deleted from the database. You can upload another version of the file that is not corrupted. Contact your administrator to enable this functionality.
Assign a Manager to a Project
Assign managers to projects to identify the project manager or person responsible for managing the project.
The person who created the project is automatically assigned as the manager.
To assign a manager to a project:
1) Navigate to the Details page:
In Prime Projects:
a. In the object selector, select a project.
b. In the sidebar, select Summary & Settings.
c. On the Summary & Settings menu, select Details.
In Prime Professional:
On the Project menu, select Details.
2) In the Details section, in the Manager field, select a manager.
3) Save your changes:
In Prime Projects:
a. Select Save.
b. In the Summary & Settings panel, select Close.
In Prime Professional:
Select Save.
You can also do this in the Projects inventory panel.
1) In Prime Projects:
In the object selector, select Projects, and then select View All Projects.
In Prime Professional:
On the Workspace menu, select Projects.
2) In the table, select a project, and then add a manger in the Manager field.
This setting is used in the following apps:
Contracts and Commitments
Cost and Funds
Field
Resources
Portfolio Management User Guide
16
Risk
Schedule
Scope
Strategic Alignment
Tasks
Configure the Projects Inventory Panel
Configure the Projects inventory panel to define how data is visually displayed while working in this view.
To configure the Projects inventory panel:
1) In Prime Projects:
In the object selector, select Projects, and then select View All Projects.
In Prime Professional:
On the Workspace menu, select Projects.
2) In the View list, select Manage Views.
3) In the Manage Views panel, select a view type (Workspace or Personal), select the Context menu, and then select Add.
4) Enter a name for the new view.
5) Select columns to display, create and apply filters, group projects by specific criteria, and configure currency settings.
6) Select Apply.
7) Save your changes:
In Prime Projects:
a. Select Save View.
b. In the inventory panel, select Close.
In Prime Professional:
Select Save View.
Configure a Cash Flow Curve Source
Determine where the Planned Budget, Forecast, and Actuals values for the project are derived from. By default, these values are entered manually.
To configure cash flow curve sources:
1) In the object selector, select a project.
2) In the sidebar, hover over Cost and Funds, and select Cash Flow.
Note: The first time you access a new project, you are required to enter details about the project start date and duration. Complete the fields and select Get Started.
3) On the Cash Flows page, select Settings.

Create
17
4) In the Settings dialog box, in the Configure Field Sources section, select data sources for the Planned Budget, Forecast, and Actuals curves.
Manual Entry: The Start and Finish dates, Total Cost, and time distributed values are all manual entry fields.
Project Current Budget: When selected for the Planned Budget source, the Total Cost value is pulled from the Project Current Budget column of the Project Cost Sheet. The Planned Budget Total Cost is read-only and is only updated when the Project Current Budget value changes on the Cost Sheet. You can manually enter the start and finish dates, and distribute the total cost over time.
Project Current Actuals: When selected for the Actuals source, the total of all approved Actuals records within the project roll up to the Actuals curve Total Cost column. The Start and Finish dates are set based on the earliest and latest approved actual record. The individual approved actuals total amounts roll up to the appropriate month and year in the time phase distribution for the curve.
Configured Cost Sheet Field: Planned Budget, Forecast, and Actuals values can be populated using a configured Project Cost Sheet field that uses a financial formula. The Total Cost field is populated with this value, which cannot be updated manually. The Total Cost can be distributed manually by time phase. Start and Finish dates are manually entered.
Actual Cost from P6: If costs are updated through a connection with P6 EPPM, discuss the frequency of the updates with your administrator. The values in the Actuals curve will stay in sync with the Actual Cost from P6 curve. The Actuals curve is read-only.
5) Select Save.
Link Forecast And Actuals Values
Link Actuals to the project Forecast to apply any new actuals data to the project's forecast curve. Time phasing for each curve is linked, so, for example, an actual added in February will be applied to the Forecast in February of the same year. Linking Actuals and Forecast enables you to combine costs already incurred on a project with the project's predicted future costs effectively creating an at completion curve.
To link forecast and actuals values:
1) In the object selector, select a project.
2) In the sidebar, hover over Cost and Funds, and select Cash Flow.
3) On the Cash Flows page, select Settings.
4) In the Settings dialog box, select Link Forecast to Actuals.
5) Select Save.
Add Cost Data to a Project on the Cash Flow Page Manually
Cost data is added to projects for the initial purpose of budget negotiation between project managers and budget planners. Keeping cost data up-to-date during the course of the project enables you to view accurate data when assessing the project and is used when planning for the next budget planning period.
Portfolio Management User Guide
18
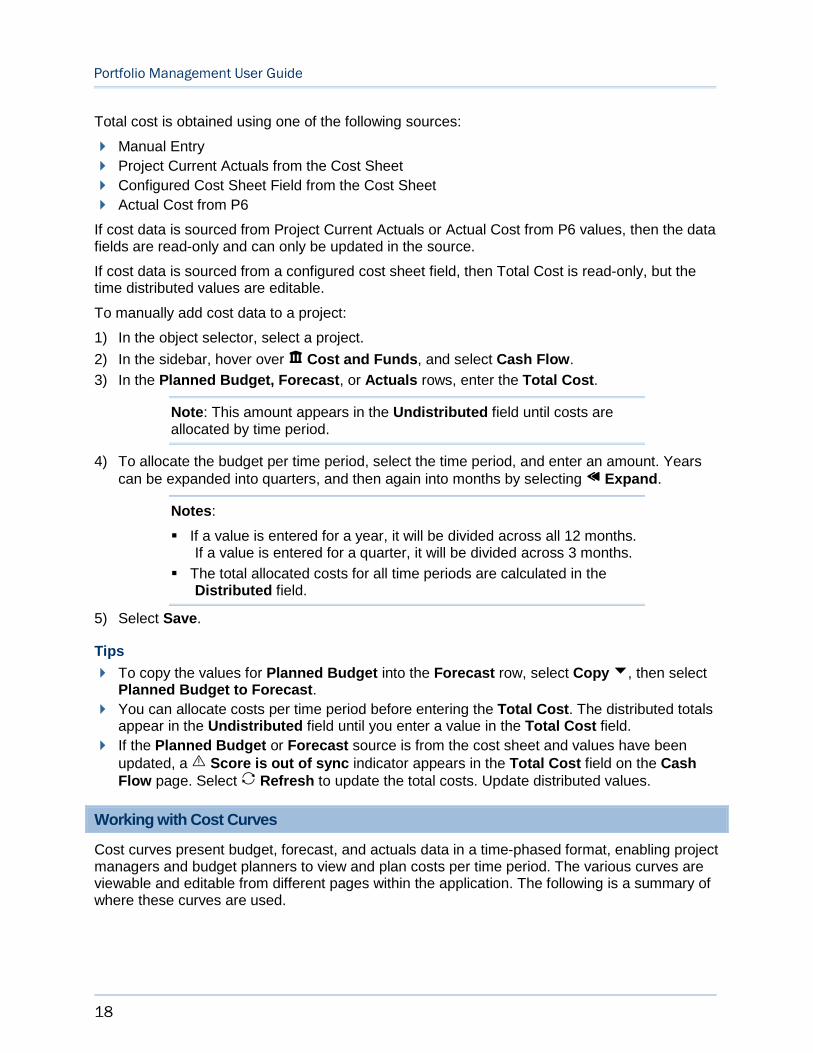
Total cost is obtained using one of the following sources:
Manual Entry
Project Current Actuals from the Cost Sheet
Configured Cost Sheet Field from the Cost Sheet
Actual Cost from P6
If cost data is sourced from Project Current Actuals or Actual Cost from P6 values, then the data fields are read-only and can only be updated in the source.
If cost data is sourced from a configured cost sheet field, then Total Cost is read-only, but the time distributed values are editable.
To manually add cost data to a project:
1) In the object selector, select a project.
2) In the sidebar, hover over Cost and Funds, and select Cash Flow.
3) In the Planned Budget, Forecast, or Actuals rows, enter the Total Cost.
Note: This amount appears in the Undistributed field until costs are allocated by time period.
4) To allocate the budget per time period, select the time period, and enter an amount. Years can be expanded into quarters, and then again into months by selecting Expand.
Notes:
If a value is entered for a year, it will be divided across all 12 months. If a value is entered for a quarter, it will be divided across 3 months.
The total allocated costs for all time periods are calculated in the Distributed field.
5) Select Save.
Tips
To copy the values for Planned Budget into the Forecast row, select Copy, then select Planned Budget to Forecast.
You can allocate costs per time period before entering the Total Cost. The distributed totals appear in the Undistributed field until you enter a value in the Total Cost field.
If the Planned Budget or Forecast source is from the cost sheet and values have been updated, a Score is out of sync indicator appears in the Total Cost field on the Cash Flow page. Select Refresh to update the total costs. Update distributed values.
Working with Cost Curves
Cost curves present budget, forecast, and actuals data in a time-phased format, enabling project managers and budget planners to view and plan costs per time period. The various curves are viewable and editable from different pages within the application. The following is a summary of where these curves are used.

Create
19
Budget Curves
Target Budget
The target budget for the entire planning horizon for the budget plan. This value can be adjusted per budget plan scenario.
Editable: Budget Planning, Published Views
Viewable: Budget Planning, Published Views
Planned Budget
The planned or estimated cost of a project for the life of the project.
Editable: Cash Flow. This value can be entered manually, replaced with the Project Current Budget or a project cost field from the Cost Sheet, or brought in through a connection with P6 EPPM.
Viewable: Cash Flow, Budget Planning, Published Views, Spending, Scorecard
Proposed Budget
The proposed budget allocation for a project or a budget plan scenario spanning the portfolio's planning horizon, entered by the budget planner. The proposed budget allocation for a project is the budget value that the project manager and budget planner negotiate on. The Proposed Budget is a standard curve on the Cash Flow page at the budget plan level, but not at the project level.
Editable: Budget Planning, Published Views
Viewable: Cash Flow
Approved Budget
The multi-year approved budget assigned to the project or budget plan scenario by the budget planner for the current planning year. The Proposed Budget becomes the Approved Budget after a budget plan scenario is approved.
Editable: This value can only be populated through the approval of a new proposed budget.
Viewable: Cash Flow, Budget Planning, Published Views, Spending, Scorecard
Forecast Curves
Forecast
The remaining or forecast cost of the project. Forecast typically equals the Planned Budget before a project begins.
After a project begins, the Forecast is updated periodically throughout the life of the project, as the remaining cost estimates change and money is spent on the project.
This is a time-phased Forecast for the life of the project, which could span multiple years.
Editable: Cash Flow. This value can be entered manually, replaced with project cost field from the Cost Sheet, or brought in through a connection with P6 EPPM.
Viewable: Cash Flow, Budget Planning, Published Views, Spending, Scorecard
At Completion
The At Completion Total Cost from a cost-loaded P6 EPPM schedule.

Portfolio Management User Guide
20
This cost curve will only appear if the application is connected with P6 EPPM. This value can be copied into the Forecast curve by the project manager on the Cash Flow page.
Editable: Cannot be edited.
Viewable: Cash Flow
Actuals Curves
Actuals
The actual costs incurred for the project (such as invoices, payments, and accruals).
Editable: Cash Flow, Cost Sheet. This value can be entered manually on the Cash Flow page, replaced with Project Current Actuals value or project cost field from the Cost Sheet, or brought in through a connection with P6 EPPM. When connected with P6 EPPM, the Actuals from P6 EPPM are always brought into the Actual Cost from P6 curve, and then can either be copied in, or set as the source of the Actuals curve.
Viewable: Cash Flow, Cost Sheet, Budget Planning, Published Views, Spending, Scorecard
Actual Cost from P6
The actual total cost from a cost-loaded P6 EPPM schedule.
This cost curve will only appear if the application is connected with P6 EPPM. This value can be copied into the Actuals curve by the project manager, or set as the source of the Actuals curve on the Cash Flow page.
Editable: Cannot be edited.
Viewable: Cash Flow
Working with the Cash Flow Page when Integrated with P6 EPPM Task
When Oracle Prime Projects is connected with P6 EPPM through the integration using Primavera Gateway, data is brought into Oracle Prime Projects and additional curves are available.
To ensure you are viewing the latest data, discuss the frequency of the updates with your administrator.
Cost Fields
Total Cost for the following fields are populated with data from P6 EPPM.
Planned Budget
Forecast
You can manually allocate total cost by time period on the Cash Flows page.
Additional P6 EPPM Curves
Two additional curves are available when connected with P6 EPPM.
At Completion
Actual Cost from P6
Create
21
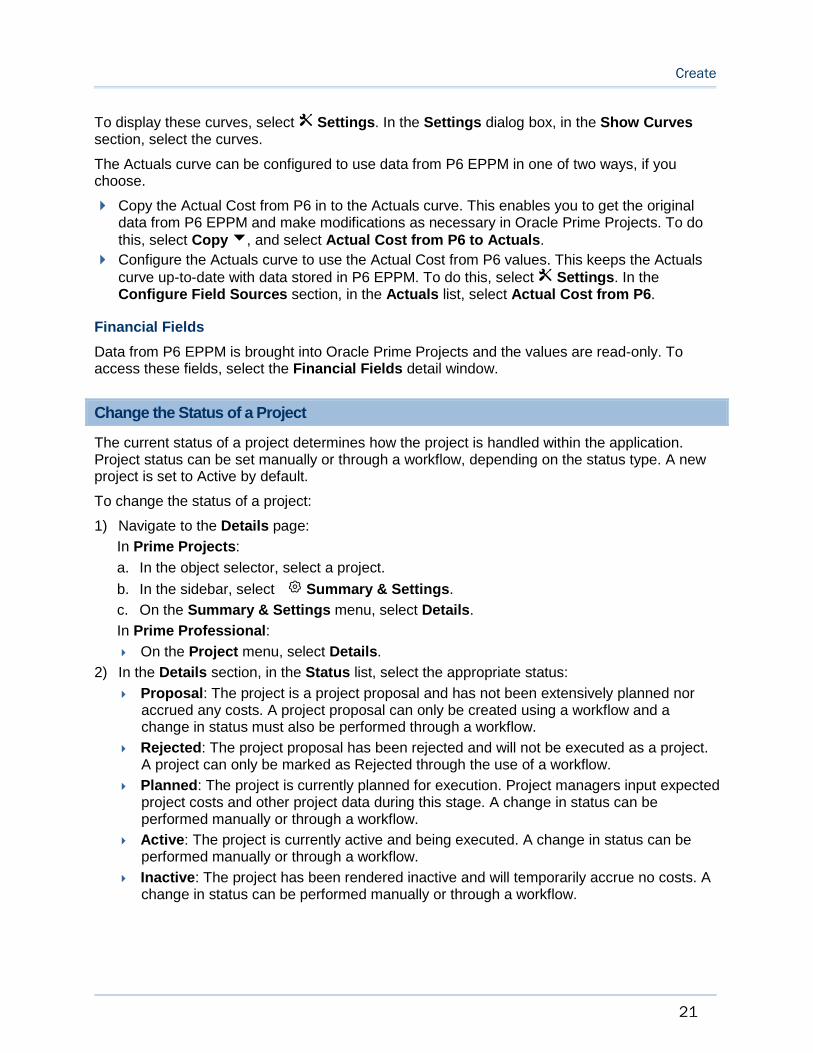
To display these curves, select Settings. In the Settings dialog box, in the Show Curvessection, select the curves.
The Actuals curve can be configured to use data from P6 EPPM in one of two ways, if you choose.
Copy the Actual Cost from P6 in to the Actuals curve. This enables you to get the original data from P6 EPPM and make modifications as necessary in Oracle Prime Projects. To do this, select Copy, and select Actual Cost from P6 to Actuals.
Configure the Actuals curve to use the Actual Cost from P6 values. This keeps the Actuals curve up-to-date with data stored in P6 EPPM. To do this, select Settings. In the Configure Field Sources section, in the Actuals list, select Actual Cost from P6.
Financial Fields
Data from P6 EPPM is brought into Oracle Prime Projects and the values are read-only. To access these fields, select the Financial Fields detail window.
Change the Status of a Project
The current status of a project determines how the project is handled within the application. Project status can be set manually or through a workflow, depending on the status type. A new project is set to Active by default.
To change the status of a project:
1) Navigate to the Details page:
In Prime Projects:
a. In the object selector, select a project.
b. In the sidebar, select Summary & Settings.
c. On the Summary & Settings menu, select Details.
In Prime Professional:
On the Project menu, select Details.
2) In the Details section, in the Status list, select the appropriate status:
Proposal: The project is a project proposal and has not been extensively planned nor accrued any costs. A project proposal can only be created using a workflow and a change in status must also be performed through a workflow.
Rejected: The project proposal has been rejected and will not be executed as a project. A project can only be marked as Rejected through the use of a workflow.
Planned: The project is currently planned for execution. Project managers input expected project costs and other project data during this stage. A change in status can be performed manually or through a workflow.
Active: The project is currently active and being executed. A change in status can be performed manually or through a workflow.
Inactive: The project has been rendered inactive and will temporarily accrue no costs. A change in status can be performed manually or through a workflow.

Portfolio Management User Guide
22
Complete: The project has been successfully completed and will no longer accrue costs. A change in status can be performed manually or through a workflow.
3) Save your changes:
In Prime Projects:
a. Select Save.
b. In the Summary & Settings panel, select Close.
In Prime Professional:
Select Save.
Assign a Role from a Workspace
Roles that are created in a workspace are available to projects within the workspace. The only role details that are editable at the project level are the Max Units/Time settings in the Availability detail window.
To assign a role from a workspace:
1) Navigate to the project roles page:
In Prime Projects:
a. In the object selector, select a project.
b. In the sidebar, hover over Resources, and select Role List.
In Prime Professional:
On the Project menu, select Roles.
2) Select Assign.
3) In the Assign Roles dialog box, select one or more roles from the parent workspace to assign to the current project.
Note: If roles are configured hierarchically, when a role with subordinate roles is selected, all roles below are selected. Expand the role name to view the additional roles.
4) Select Assign.
Tips
Any changes required for the role must be done at the workspace level. For example, you cannot change the status of a role in a project from Active to Inactive.
Delete a Project
Deleting a project will remove relationships with other items, such as project dependencies and portfolios, and will also delete files added to the project.
If you delete a project that is synchronized with P6 EPPM, the setting in P6 EPPM that indicates a project is synchronized with Oracle Prime Projects is cleared. The project is not deleted from P6 EPPM.
Create
23
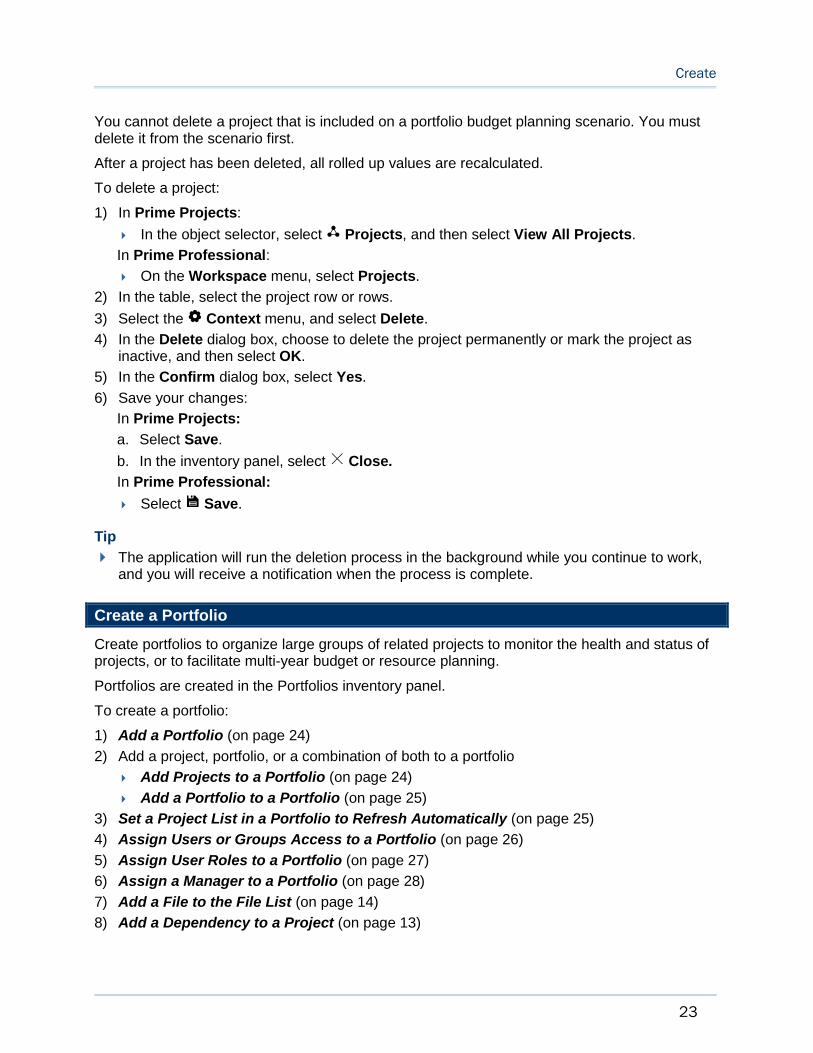
You cannot delete a project that is included on a portfolio budget planning scenario. You must delete it from the scenario first.
After a project has been deleted, all rolled up values are recalculated.
To delete a project:
1) In Prime Projects:
In the object selector, select Projects, and then select View All Projects.
In Prime Professional:
On the Workspace menu, select Projects.
2) In the table, select the project row or rows.
3) Select the Context menu, and select Delete.
4) In the Delete dialog box, choose to delete the project permanently or mark the project as inactive, and then select OK.
5) In the Confirm dialog box, select Yes.
6) Save your changes:
In Prime Projects:
a. Select Save.
b. In the inventory panel, select Close.
In Prime Professional:
Select Save.
Tip
The application will run the deletion process in the background while you continue to work, and you will receive a notification when the process is complete.
Create a Portfolio
Create portfolios to organize large groups of related projects to monitor the health and status of projects, or to facilitate multi-year budget or resource planning.
Portfolios are created in the Portfolios inventory panel.
To create a portfolio:
1) Add a Portfolio (on page 24)
2) Add a project, portfolio, or a combination of both to a portfolio
Add Projects to a Portfolio (on page 24)
Add a Portfolio to a Portfolio (on page 25)
3) Set a Project List in a Portfolio to Refresh Automatically (on page 25)
4) Assign Users or Groups Access to a Portfolio (on page 26)
5) Assign User Roles to a Portfolio (on page 27)
6) Assign a Manager to a Portfolio (on page 28)
7) Add a File to the File List (on page 14)
8) Add a Dependency to a Project (on page 13)
Portfolio Management User Guide
24
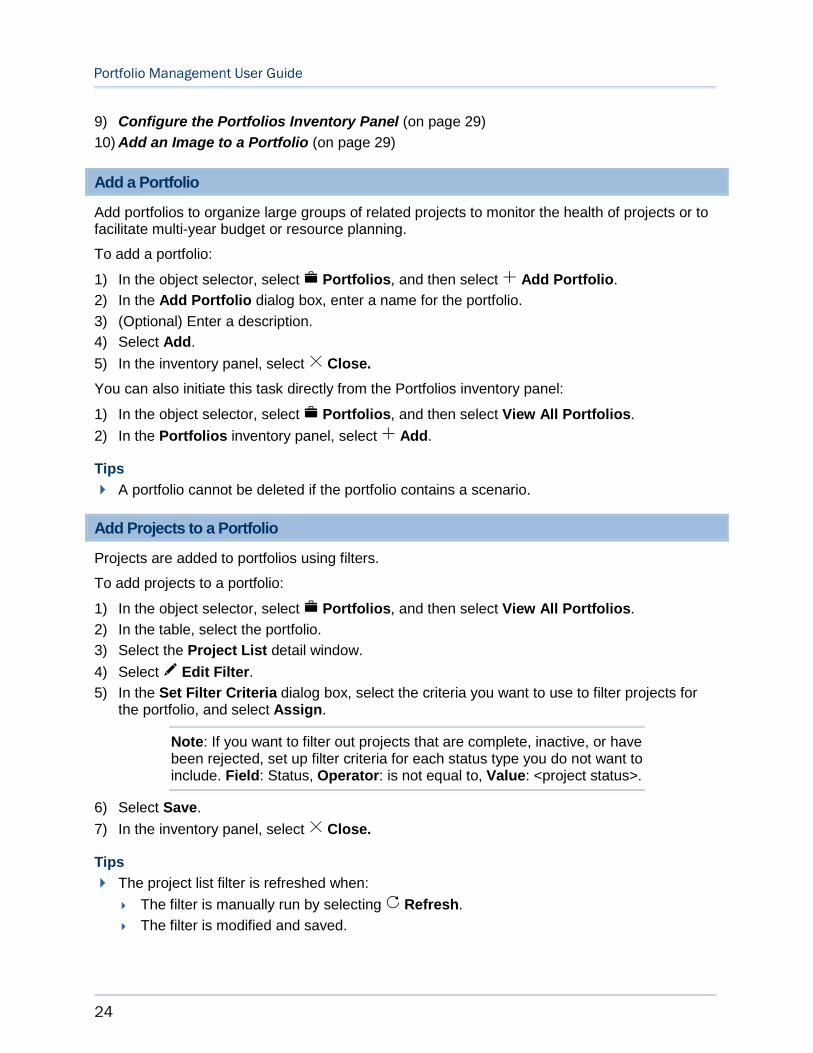
9) Configure the Portfolios Inventory Panel (on page 29)
10) Add an Image to a Portfolio (on page 29)
Add a Portfolio
Add portfolios to organize large groups of related projects to monitor the health of projects or to facilitate multi-year budget or resource planning.
To add a portfolio:
1) In the object selector, select Portfolios, and then select Add Portfolio.
2) In the Add Portfolio dialog box, enter a name for the portfolio.
3) (Optional) Enter a description.
4) Select Add.
5) In the inventory panel, select Close.
You can also initiate this task directly from the Portfolios inventory panel:
1) In the object selector, select Portfolios, and then select View All Portfolios.
2) In the Portfolios inventory panel, select Add.
Tips
A portfolio cannot be deleted if the portfolio contains a scenario.
Add Projects to a Portfolio
Projects are added to portfolios using filters.
To add projects to a portfolio:
1) In the object selector, select Portfolios, and then select View All Portfolios.
2) In the table, select the portfolio.
3) Select the Project List detail window.
4) Select Edit Filter.
5) In the Set Filter Criteria dialog box, select the criteria you want to use to filter projects for the portfolio, and select Assign.
Note: If you want to filter out projects that are complete, inactive, or have been rejected, set up filter criteria for each status type you do not want to include. Field: Status, Operator: is not equal to, Value: <project status>.
6) Select Save.
7) In the inventory panel, select Close.
Tips
The project list filter is refreshed when:
The filter is manually run by selecting Refresh.
The filter is modified and saved.

Create
25
The portfolio list is set to refresh automatically.
If a project no longer meets the filter criteria, but is included in an approved portfolio budget plan, it will continue to be included in the project list for the portfolio.
You can also perform this task from the Summary & Settings panel for the object in Prime Projects:
1) In the object selector, select a portfolio.
2) In the sidebar, select Summary & Settings.
3) On the Summary & Settings menu, select Details.
Set a Project List in a Portfolio to Refresh Automatically
The project list for a portfolio can be set to refresh automatically.
To refresh the project list in a portfolio automatically:
1) In the object selector, select Portfolios, and then select View All Portfolios.
2) In the table, select a portfolio, and select the Project List detail window.
3) In the Project List detail window, select Settings.
4) In the Settings panel, select the Automatic Refresh tab.
5) Select Automatically Refresh Portfolio to enable the setting.
6) In the Refresh Frequency list, select how often the portfolio list should refresh.
7) In the Settings panel, select Apply.
8) Select Save.
9) In the inventory panel, select Close.
Tips
To refresh the list on demand, on the Project List detail window, select Refresh.
You can also perform this task from the Summary & Settings panel for the object in Prime Projects:
1) In the object selector, select a portfolio.
2) In the sidebar, select Summary & Settings.
3) On the Summary & Settings menu, select Details.
Add a Portfolio to a Portfolio
Portfolios can be added to portfolios to create a portfolio of portfolios or a portfolio with a combination of projects and portfolios. Portfolios included in child workspaces can be added to the portfolio.
To add a portfolio to a portfolio:
1) In the object selector, select Portfolios, and then select View All Portfolios.
2) In the table, select the portfolio.
3) Select the Portfolio List detail window.

Portfolio Management User Guide
26
4) In the Portfolio List detail window, select Edit.
5) In the Edit Portfolio List dialog box, select an available portfolio, and select OK.
6) Select Save.
7) In the inventory panel, select Close.
You can also perform this task from the Summary & Settings panel for the object in Prime Projects:
1) In the object selector, select a portfolio.
2) In the sidebar, select Summary & Settings.
3) On the Summary & Settings menu, select Details.
Assign Users or Groups Access to a Portfolio
Users can be assigned to portfolios individually or through user groups. Each user or user group must be assigned a portfolio security permission set. A user group may have been configured with a default permission set. This permission set can be changed for the portfolio assignment at any time.
To assign user access to a portfolio:
1) In the object selector, select a portfolio.
2) In the sidebar, select Summary & Settings.
3) On the Summary & Settings menu, select Security.
4) Select the Assign menu, and then select User or Group.
5) In the Assign User or Assign Group dialog box, enter the user or group name.
6) Select the name and select Next.
7) In the Permission Set field, select the permission set.
Note: If you assigned a user group that is configured with a default permission set, you can keep the default or select another if necessary.
8) Add any other optional permission sets applicable to that user or group.
9) Select Assign.
10) Select Save.
11) In the Summary & Settings panel, select Close.
Tips
If you added the portfolio in the application, you are automatically assigned access to the portfolio with the Administrator permission set assigned.
The Search feature searches the entire list of users for matches. During that initial search, it will stop after finding 500 results, then filter out those who have already been assigned. For this reason, your maximum number of search results might vary. To limit the number of results, be as specific as possible when entering a name in the search field. For example, enter the first and last name of the user.

Create
27
Portfolio Planning User Roles Overview
User roles enable the application to distribute tasks and information between users based on their responsibilities. Users who have security privileges to workspaces, projects, or portfolios can be assigned to these objects with any of these roles: Reviewer, Approver, and Owner. A user who has security privileges to any of these objects can also be assigned to it as the primary reviewer, primary approver, and primary owner.
The creator of any of these objects is, by default, assigned to it as a reviewer, approver, and owner. The creator is also assigned as the primary reviewer, primary approver, and primary owner and can assign other role assignments to it.
New projects in any workspace automatically inherit the role assignments from that workspace. But changes to the workspace role assignments do not affect the role assignments of its projects.
Project and portfolio roles are important for built-in workflows, which enable portfolio planners to send budget or resource plan scenarios through the review, propose, and approve processes. Roles determine which users are assigned to view or update budget and resource plan information during these processes.
Roles Available When Using the Built-in Workflow Processes
Built-in workflow processes are available to enable planners to send portfolio budget and resource plan scenarios through the review, share, and approve processes. The following describes what role assignments can be made at each object level and what happens when a workflow is started.
Project
Owner: The users assigned the Owner role will receive notification when a planner shares the projects in a budget or resource plan scenario proposal for negotiations.
Portfolio
Reviewer: The users assigned the Reviewer role will receive notification when a planner sends a budget or resource plan scenario out for review.
Approver: The users assigned the Approver role will receive notification when a planner sends a budget or resource plan scenario out for approval.
Assign User Roles to a Portfolio
Assigning roles to portfolios lets you route built-in portfolio budget and resource planning workflow steps to specific users.
To assign user roles to a portfolio:
1) In the object selector, select a portfolio.
2) In the sidebar, select Summary & Settings.
3) On the Summary & Settings menu, select Security.
4) Select Edit Roles.
5) In the Edit Roles dialog box, if the users you want to assign roles are not listed, select Assign Users.
Portfolio Management User Guide
28
6) In the Select User dialog box, enter a username, select the name, and then select Assign.
7) Select the roles you want users to perform.
8) Review the primary roles in the Set Primary Role Defaults section, and make updates as necessary.
9) Select Assign.
10) Select Save.
11) In the Summary & Settings panel, select Close.
Assign a Manager to a Portfolio
Assign a manager to a portfolio to identify the portfolio manager or person responsible for managing the portfolio.
The person who created the portfolio is automatically assigned as the manager.
To assign a manager to a portfolio:
1) In the object selector, select Portfolios, and then select View All Portfolios.
2) In the table, locate the portfolio.
3) In the Manager field, select a manager.
4) Select Save.
5) In the inventory panel, select Close.
Add a File to the File List
Add relevant files, such as costing spreadsheets, contracts, specifications, and audio and video files, to your projects, portfolios, or ideas to support your organization's data.
To add a file to the File List:
1) Navigate to the files page:
In Prime Projects:
a. In the object selector, select a project, portfolio, or idea.
b. In the sidebar, hover over Files, and select File List.
In Prime Professional:
On the Project menu, select Files.
2) In the table, select a folder, and then select Add File.
3) In the Upload File dialog box, select a file, and then select OK.
Tips
If an issue is detected with a file, you are notified and the contents of the file are deleted from the database. You can upload another version of the file that is not corrupted. Contact your administrator to enable this functionality.

Create
29
Configure the Portfolios Inventory Panel
Configure the Portfolios inventory panel to display the fields you want to view while working on this page.
To configure the Portfolios inventory panel:
1) In the object selector, select Portfolios, and then select View All Portfolios.
2) On the Portfolios inventory panel, select Settings.
3) In the Settings panel, select the columns you want to display by selecting the available columns.
4) Select Apply.
5) In the inventory panel, select Close.
Add an Image to a Portfolio
A portfolio image is shown in some areas of the application, such as news feeds. You can upload your own image or choose from existing images.
To add an image to a portfolio:
1) In the object selector, select a portfolio.
2) In the sidebar, select Summary & Settings.
3) On the Summary & Settings menu, select Details.
4) Select Upload Image.
5) In the Select Image for Portfolio dialog box, select one of the following:
Under the Upload New Image section, in the Image field, select Browse, and then select an image.
Under the Choose from Existing section, select Gallery or Uploaded, and then select an existing image.
6) Select Select.
7) Select Save.
8) In the Summary & Settings panel, select Close.
Tips
To restore the default portfolio image, select Reset to Default in the Select Image for Portfolio dialog box.
Configure Settings for a Portfolio Budget Plan
Before you can begin building your budget plan, you should configure budget plan options and settings. Choose the number of years of your plan. Set workflows to use in the budget approval process. Create performance thresholds for your portfolio and its projects. When these settings are configured, you can begin building your portfolio budget plan.
To configure settings for a budget portfolio plan:
1) Set the Budget Planning Options for a Portfolio (on page 30)
Portfolio Management User Guide
30
2) Set Workflows for Reviewing, Proposing, and Approving a Budget Planning Scenario(on page 30)
3) Create Thresholds and Alerts for a Budget Plan (on page 31)
Set the Budget Planning Options for a Portfolio
Define the number of years to plan for during the budget planning process. Configure how timescale increments will be displayed on the Budget Planning page.
To set the planning period for a portfolio budget plan:
1) In the object selector, select Portfolios, and then select View All Portfolios.
2) In the table, select the portfolio row.
3) Select the Budget Planning detail window.
4) In the Planning Horizon field, enter the total number of years to plan out for the projects in a budget plan.
Note: The planning horizon cannot be changed after a budget plan has been added to the portfolio.
5) Select whether you want the Proposed Budget for projects in each budget plan scenario to be able to be linked to their Forecast or Planned Budget values, as specified by project managers, using the Proposed Budget Link Setting.
Note: This option can be updated after budget plans are created for the portfolio; however, the change will only impact budget plans created after the update and will not change the existing budget plans.
6) Determine how you want to view the timescale increments for the planning horizon when viewing the budget plan scenarios on the Budget Planning page.
Number of years planned in months: Determines how many years display in monthly increments on the timescale.
Number of years planned in quarters: Determines how many years display in quarterly increments on the timescale.
Number of years planned in years: Determines how many years display in yearly increments on the timescale. This value is calculated based on values entered in the Number of years planned in months and Number of years planned in quartersfields.
7) Select Save.
8) In the inventory panel, select Close.
Set Workflows for Reviewing, Proposing, and Approving a Budget Planning Scenario
Determine the workflows to use when sending a budget plan scenario through the review, propose, and approve processes. For budget planning, you can use the built-in workflows or custom workflows configured by your organization.
To set workflows for a budget planning scenario:
Create
31
1) In the object selector, select a portfolio.
2) In the sidebar, select Summary & Settings.
3) On the Summary & Settings menu, select Workflows.
4) In the context bar, select the planning period menu, and select the planning year, which is either the current year or the subsequent year.
5) Select a workflow for the Send for Review, Propose, and Send for Approval actions for the given planning period. These actions are performed from the Budget Planning page or from a Selection Analysis view, if configured. If you are using the built-in workflow processes, do not select a workflow.
6) Select Save.
7) In the Summary & Settings panel, select Close.
This setting is used in the following apps:
Cost and Funds
Create Thresholds and Alerts for a Budget Plan
Create thresholds at the portfolio level to use while monitoring approved budget plans on the Scorecard page. Create notification and email alerts to inform users and groups when a threshold is met.
To create thresholds and alerts:
1) Add a Threshold for a Budget Plan (on page 31)
2) Configure a Threshold for a Budget Plan (on page 32)
3) Set Threshold Alert Delivery Options for a Budget Plan (on page 32)
Add a Threshold for a Budget Plan
Add the project and portfolio key performance indicators (KPIs) that will be used while monitoring approved portfolio budget plans on the Scorecard page.
To set monitoring thresholds for a budget plan:
1) In the object selector, select a portfolio.
2) In the sidebar, select Summary & Settings.
3) On the Summary & Settings menu, select Thresholds.
4) In the context bar, select the planning period menu, and select the planning year, which is either the current year or the subsequent year.
5) Select the tab for the type of threshold to create.
Project Fields: Fields and indicators that display for projects.
Project Summary Fields: Fields and indicators that display for the project summary.
Portfolio Fields: Fields and indicators that display at the portfolio level.
6) Select Add.
7) In the Select KPI field dialog box, select a key performance indicator, and then select OK.
8) Select Save.

Portfolio Management User Guide
32
9) In the Summary & Settings panel, select Close.
This setting is used in the following apps:
Portfolio Analysis
Configure a Threshold for a Budget Plan
Configure the project and portfolio key performance indicators (KPIs) that will be used while monitoring approved budget plans on the Scorecard page.
To configure a threshold for a portfolio budget plan:
1) In the object selector, select a portfolio.
2) In the sidebar, select Summary & Settings.
3) On the Summary & Settings menu, select Thresholds.
4) In the context bar, select the planning period menu, and select the planning year, which is either the current year or the subsequent year.
5) Select the tab for the threshold to configure.
6) In the settings pane, under the Threshold section, configure the settings:
Operator: Select a parameter to use for the threshold.
Value: Enter the value to use for the threshold.
Indicator Icon: Select a visual indicator to display when the threshold is met.
Bubble Color: Select a color to display on a bubble chart when the threshold is met.
7) (Optional) In the box for the threshold field, select Add to add more threshold settings.
8) Select Save.
9) In the Summary & Settings panel, select Close.
This setting is used in the following apps:
Portfolio Analysis
Set Threshold Alert Delivery Options for a Budget Plan
You can assign users and groups to alerts and specify the method of delivery of the message. You can enter a custom message to the user or keep the default message. The message should be appropriate to all recipients. You cannot specify a different message for different recipients. You can, however, specify different methods of delivery for different users and groups.
When a threshold is met, only one alert will be sent. For example, if you set a threshold to alert users when the actuals of a project exceeds a certain amount, one alert will be sent. If the Actuals value continues to increase, additional alerts will not be sent.
To set threshold alert delivery options for a budget plan:
1) In the object selector, select a portfolio.
2) In the sidebar, select Summary & Settings.
3) On the Summary & Settings menu, select Thresholds.

Plan
33
4) In the context bar, select the planning period menu, and select the planning year, which is either the current year or the subsequent year.
5) In the settings pane, under the Alerts section, select Assign , and then select User or Group.
6) In the Select User or Select Group dialog box:
a. Enter part or all of the username, personal name, or group name into the Search field.
b. Select the name, and select Select.
7) In the user row, select what type of message should be sent from the following options:
Notification: Sends a system notification to the user's Notifications panel.
Email: Sends an email to the user's email address stored in the LDAP.
8) (Optional) In the Message field, enter a message that will be sent to the selected users and groups.
9) Select Save.
10) In the Summary & Settings panel, select Close.
This setting is used in the following apps:
Portfolio Analysis
Portfolio Budget Plan Status Reference
The status that displays for the budget plan is set automatically until it is time to close the plan.
In Planning: The budget plan is currently going through the planning process and contains one or more scenarios in planning. This status is set based on the status of scenarios within the plan and cannot be edited manually.
Revising: The budget plan currently has one scenario with a status of approved and another with a status of Under Review, Proposed, or Under Approval. This status is set based on the status of scenarios within the plan and cannot be edited manually.
Approved: The budget plan contains a scenario that has gone through the approval process and been approved. This status is set based on the status of scenarios within the plan and cannot be edited manually.
Plan
Project and Portfolio Evaluation Overview
Project evaluation scores are used to prioritize and select the right projects or proposals for the organization to pursue based on quantitative data. An Evaluation Matrix is used for defining project evaluation categories based off of organizational business drivers for which projects are ranked against.
Use the Prioritization Matrix to view evaluations scores for all projects within the portfolio. Use the project evaluation scores to prioritize and select the right projects or proposals for the organization to pursue based on quantitative data.

Portfolio Management User Guide
34
An Investor Map is also available, enabling you to analyze project performance using a customizable bubble chart.
Evaluation Categories Overview
Define project and idea evaluation categories based off of organizational business drivers. Evaluation categories are grouped into an evaluation matrix, which you can use to rank and assess your projects, ideas, and proposals against your company's requirements and standards. In portfolio management, overall project evaluation scores are then viewed in the Prioritization Matrix.
Add an Evaluation Matrix
There is one evaluation matrix per workspace. The evaluation matrix includes categories and one level of sub-categories under each category. Each category must include at least one sub-category. Add evaluation categories to rank and assess ideas, and projects and proposals in portfolios.
To add an evaluation matrix:
1) In the object selector, select a workspace.
2) In the sidebar, select Summary & Settings.
3) On the Summary & Settings menu, select Dictionaries, and then select Evaluation Categories.
4) Select Add.
5) In the new row, complete the following fields for a category:
Name: The name of the evaluation category.
(Optional) Description: Details describing the evaluation category.
Weight: The relative weight of the sibling evaluation node to indicate contribution of a given node to its parent evaluation node.
Weight Percent: The weight or relative rank of the evaluation node compared to its siblings. This value indicates the percentage that the evaluation node is contributing to the parent strategy. The Weight Percent for all sibling evaluation nodes equals 100. This field is read-only.
6) Select the Context menu, and select Add Sub-category.
7) In the new row, complete the same fields for the sub-category.
8) In the Ranks detail window, configure the ranking for the sub-category. A scale is preconfigured for you. Make any of the following modifications:
Scale: Determine how many options are available on the rating scale.
Reverse Ranks Order: Select the icon to reverse the order of the ranks. Weight percentage values remain the same.
Name: Modify the names as needed.
Weight Percent: The weight percentages for the evaluation ranking. The default values are evenly distributed based on the number of selected ranks. You can manually specify different percentage values.
Plan
35
Color: Select a color representing the evaluation ranking.
(Optional) Description: Details describing the rating.
9) Select Save.
10) In the Summary & Settings panel, select Close.
This setting is used in the following apps:
Portfolio Analysis
Strategic Alignment
Rank a Project or Idea Against Evaluation Categories
Rank a project or idea against evaluation sub-categories, depending on the applicability of the project or idea to a sub-category, that justifies alignment with the organization.
To rank a project or idea:
1) In the object selector, select a project or idea.
2) In the sidebar, hover over Strategic Alignment, and select Evaluation.
3) Select a Rank for each applicable evaluation sub-category. You can review the ranking descriptions in the Ranks detail window.
4) Select Save.
Note: You can only rank submitted ideas.
Tips
This task can also be completed for a project on the Prioritization Matrix page at the portfolio level.
Review Evaluation Scores for a Project or Idea
Review the individual evaluation category scores and overall score for projects, ideas, and proposals.
To review evaluation scores:
1) In the object selector, select a project or idea.
2) In the sidebar, hover over Strategic Alignment, and select Evaluation.
3) Review the evaluation scores.
Score: The sub-category score formula is calculated as the selected Rank Weight % multiplied by the given sub-category Weight % divided by 100.
The category score formula is calculated as the sum of the sub-category Scores. If a given sub-category does not have a score, its score is 0.
Total Score: The project score based off all ranked categories.
4) Select Save.

Portfolio Management User Guide
36
Tips
If the Score is out of sync indicator displays, the evaluation matrix has been updated. Select Re-Evaluate Score to recalculate scores using the updated matrix. If new evaluation categories or sub-categories were added, update as needed.
Review and Update Evaluation Scores for a Portfolio
Use the Prioritization Matrix to view the total evaluation scores for all projects and proposals within a portfolio and update the individual evaluation category scores as needed.
To view the prioritization matrix:
1) In the object selector, select a portfolio.
2) In the sidebar, hover over Portfolio Analysis, and select Prioritization Matrix.
3) In the Show list, select one of the following:
All: Displays results for all projects in the portfolio.
Budget Approved: Displays results for all projects in the approved budget scenario.
Resource Approved: Displays results for all projects in the approved resource scenario.
4) Review the evaluation scores and the category scores.
If the Score is out of sync indicator displays, select Re-Evaluate Project Scores to recalculate any out of sync project scores based off the updated matrix.
5) Make updates to the sub-categories as needed.
Note: Show Scores must be disabled to make updates.
6) To post a question or review discussions on a project, select Discuss.
Note: If no comments have been posted to the Discussion panel, the Discuss icon is empty.
To post a new comment:
In the Post a comment field, enter a comment, and select Post.
To reply to a comment:
Select Comment.
In the Post a reply field, enter a reply, and select Reply.
7) Select Save.
Tips
Toggle between showing scores or ranking labels in the table for each sub-category by selecting Show Scores.
Toggle between showing colors for a visual indication for how each project is fairing against a given sub-category by selecting Show Cell Color.
You cannot edit or delete a posted comment.

Plan
37
Analyze Portfolio Performance Using the Investor Map
Use the investor map to assist in prioritizing the projects or portfolios within a portfolio and analyze performance using various project and portfolio dimensions. The map displays a configurable bubble chart. Bubble location, size, and color can be used to measure different attributes of project performance. Additionally, you can enable reference lines to separate the chart into quadrants based on values and performance metrics. All of the information on the page can be saved as part of the view.
To review the investor map:
1) In the object selector, select a portfolio.
2) In the sidebar, hover over Portfolio Analysis, and select Investor Map.
3) Select Projects or Portfolios to view data for the projects or sub-portfolios in the current portfolio.
4) In the Data section:
X Axis and Y Axis: Select project-level or portfolio-level data to analyze across projects or sub-portfolios.
(Optional) Bubble Size: Select data that is used to determine the size of the bubbles.
(Optional) Bubble Color: Select data that displays a color based on criteria.
5) In the View section, enable settings including legend, label, and grid line information.
6) Select More Options. In the More View Options dialog box, configure the following reference line settings:
a. X Axis and Y Axis:
Select one or both options to enable axis reference lines.
Choose a Draw at value on which to draw each line.
Select Higher values are desirable if good performance is indicated by a higher axis value. This setting is applied if colors are enabled on the chart.
b. Select Use colors to depict different sections on the chart to display a different color for each section. Red indicates a poor performance value. Yellow indicates a neutral performance value. Green indicates a good performance value. The color of each section is determined by the number of enabled reference lines and the Higher values are desirable settings.
c. Select Apply.
7) In the Show list, select one of the following:
All: Displays results for all projects or sub-portfolios in the portfolio.
Budget Approved: Displays results for all projects or sub-portfolios in the approved budget scenario.
Resource Approved: Displays results for all projects or sub-portfolios in the approved resource scenario.
8) Select Save View or Save View As.
9) Hover over the bubbles to view details.

Portfolio Management User Guide
38
Add an Investor Map View
A view is a named configuration of the visual layout on the Investor Map. For each view, you can customize content and layout choices. Investor map views can be saved at the workspace or personal level. Personal views are private and only accessible to the user who created them.
To add an investor map view:
1) In the object selector, select a portfolio.
2) In the sidebar, hover over Portfolio Analysis, and select Investor Map.
3) In the View list, select Manage Views.
4) In the Manage Views dialog box, enter a name for the new view.
5) Use the Filtering tab to limit the display of projects or portfolios in the chart. Use the Chart Options tab to configure data, view, and reference line information.
Note: The Chart Options settings can also be configured directly on the Investor Map page.
6) Select Save.
Tips
The View menu displays recently opened views.
To edit a view, select the View menu, and select Manage Views, or to edit the currently selected view, select Settings.
Build a Portfolio Budget Plan
A portfolio budget plan is created by allocating proposed budgets to each project in a portfolio that you decide to include in the budget plan scenario. Budget planning can only be done on projects in the portfolio. If a portfolio includes another portfolio, that portfolio and its projects are not available on the Budget Planning page.
To perform top-down budgeting, you can directly allocate proposed budgets for each project. To perform bottom-up budgeting, you can link to the values provided by project managers. The total of the proposed budget allocations for each project comprises the scenario and then ultimately the approved plan budget.
Budget planners create scenarios using the Budget Planning page along with the Published Views page during the planning and selection process to determine the best mix of projects for a budget plan. Which views are used and in what order depends on how the organization typically approaches budget planning. The Scenario Comparison page is also available to enable planners to review the project selection and data at the summary-level for all scenarios created.
The Budget Planning page enables budget planners to view and modify time-phased budget data for the entire planning horizon set for the portfolio. Published Views are tools budget planners can use to analyze project attributes besides budget, such as Return on Investment, Net Present Value, and Profitability Index.
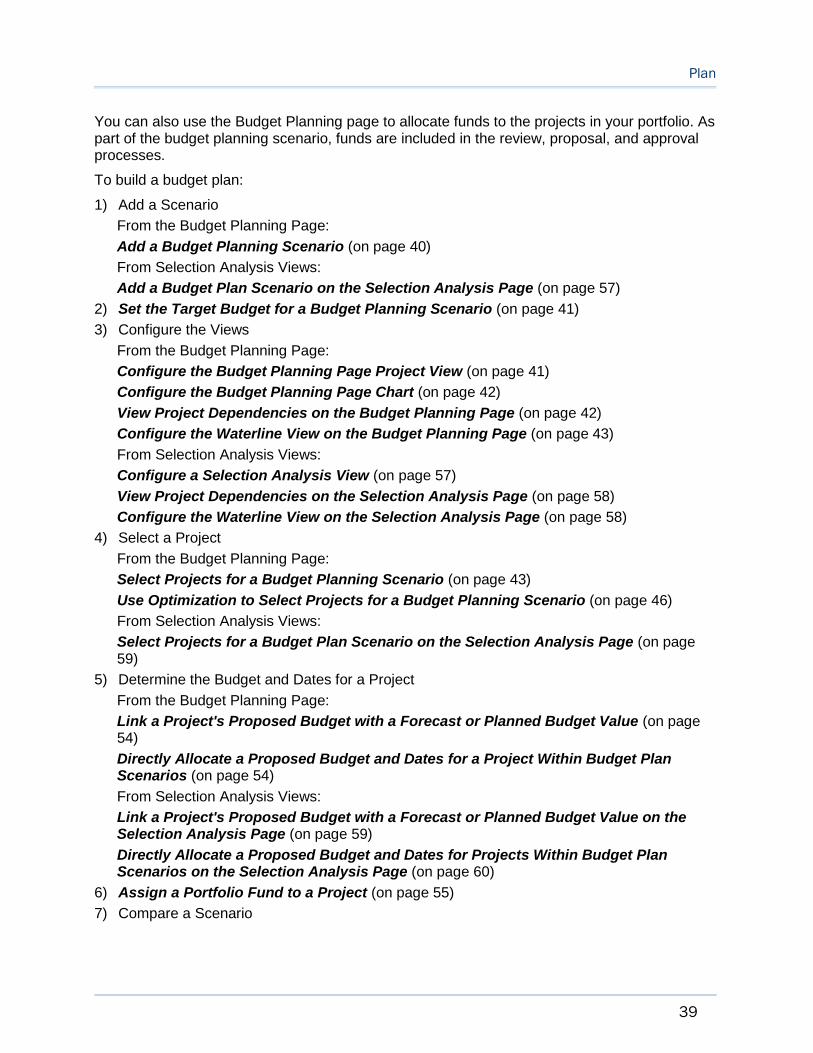
Plan
39
You can also use the Budget Planning page to allocate funds to the projects in your portfolio. As part of the budget planning scenario, funds are included in the review, proposal, and approval processes.
To build a budget plan:
1) Add a Scenario
From the Budget Planning Page:
Add a Budget Planning Scenario (on page 40)
From Selection Analysis Views:
Add a Budget Plan Scenario on the Selection Analysis Page (on page 57)
2) Set the Target Budget for a Budget Planning Scenario (on page 41)
3) Configure the Views
From the Budget Planning Page:
Configure the Budget Planning Page Project View (on page 41)
Configure the Budget Planning Page Chart (on page 42)
View Project Dependencies on the Budget Planning Page (on page 42)
Configure the Waterline View on the Budget Planning Page (on page 43)
From Selection Analysis Views:
Configure a Selection Analysis View (on page 57)
View Project Dependencies on the Selection Analysis Page (on page 58)
Configure the Waterline View on the Selection Analysis Page (on page 58)
4) Select a Project
From the Budget Planning Page:
Select Projects for a Budget Planning Scenario (on page 43)
Use Optimization to Select Projects for a Budget Planning Scenario (on page 46)
From Selection Analysis Views:
Select Projects for a Budget Plan Scenario on the Selection Analysis Page (on page 59)
5) Determine the Budget and Dates for a Project
From the Budget Planning Page:
Link a Project's Proposed Budget with a Forecast or Planned Budget Value (on page 54)
Directly Allocate a Proposed Budget and Dates for a Project Within Budget Plan Scenarios (on page 54)
From Selection Analysis Views:
Link a Project's Proposed Budget with a Forecast or Planned Budget Value on the Selection Analysis Page (on page 59)
Directly Allocate a Proposed Budget and Dates for Projects Within Budget Plan Scenarios on the Selection Analysis Page (on page 60)
6) Assign a Portfolio Fund to a Project (on page 55)
7) Compare a Scenario

Portfolio Management User Guide
40
From the Scenario Comparison Page:
Compare Scenarios (on page 64)
Budget Planning Overview
The Budget Planning page provides a time-phased view where budget planners can evaluate cost constraints over the entire planning horizon and make the right project selections. This is where the detailed budget planning occurs.
Create a budget plan and select the right projects to execute for a specific planning period or budget cycle. Creating scenarios is a core process of the budget planning process. Scenarios are used to decide the best group of projects for each planning period. Budget planners use scenarios to create multiple what-if options and select different combinations of projects for the plan year.
Budget planners create scenarios using the Budget Planning page along with the Published Views page during the planning and selection process to determine the best mix of projects for a budget plan. Which views are used and in what order depends on how the organization typically approaches budget planning. The Scenario Comparison page is also available to enable planners to review the project selection and data at the summary-level for all scenarios created.
Use this page to:
Review the time-phased planned budget or forecasted costs entered by the project manager, and choose to link to those costs or propose an alternative budget.
Assign and allocate funds to the projects in your portfolio.
Review the project start and end dates entered by the project manager, and propose revised dates based on budget allocations.
Select the subset of projects for inclusion in the budget plan.
Use the Efficient Frontier optimization tool to suggest an optimal selection of projects for inclusion in the budget plan.
Create multiple plan scenarios to model a variety of plans based on different sets of criteria.
Send scenarios out for review to stakeholders in the planning group to evaluate the mix of projects.
Send the candidate scenario to project managers to negotiate the budget and project start and end dates with the project manager for each project.
Send the final scenario out for final approval, and then approve the plan.
Communicate with the planning group and project managers that have access to the projects within the scenarios.
Add a Budget Planning Scenario
Create budget planning scenarios to determine the best group of projects to execute under budget constraints for a given planning period budget cycle. One or more scenarios can be created to model the plan using different sets of criteria, enabling you to make more informed decisions.
To add a scenario:
1) In the object selector, select a portfolio.
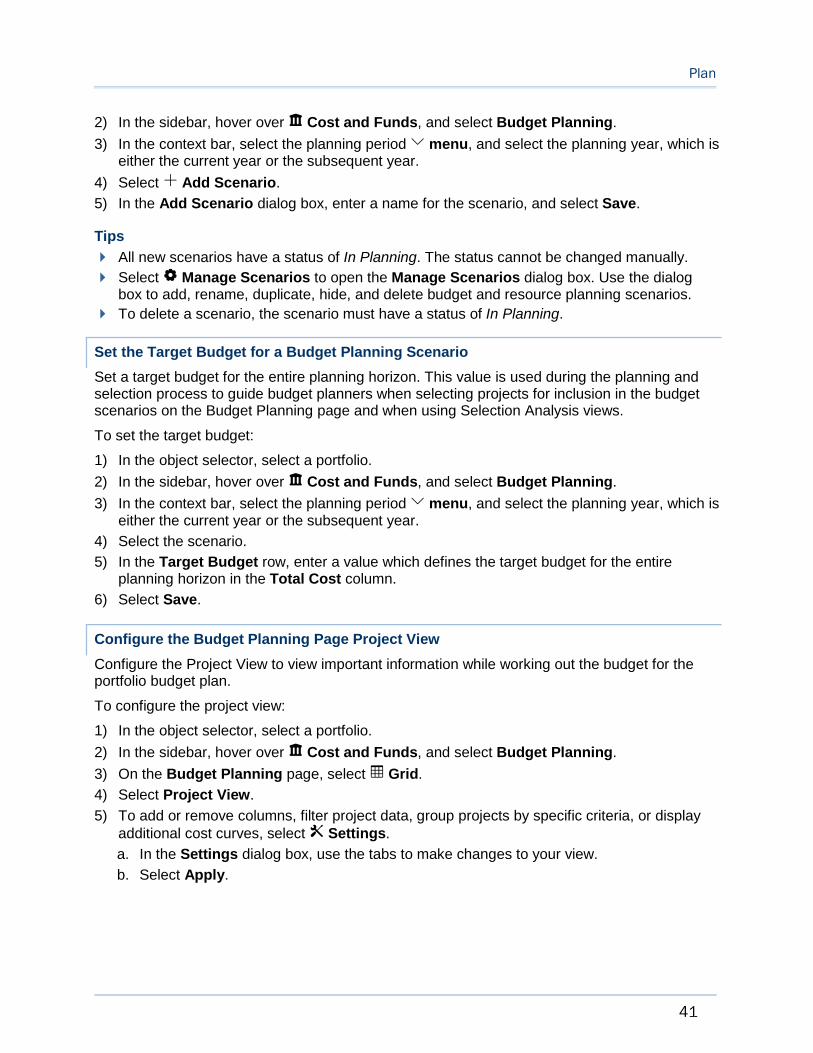
Plan
41
2) In the sidebar, hover over Cost and Funds, and select Budget Planning.
3) In the context bar, select the planning period menu, and select the planning year, which is either the current year or the subsequent year.
4) Select Add Scenario.
5) In the Add Scenario dialog box, enter a name for the scenario, and select Save.
Tips
All new scenarios have a status of In Planning. The status cannot be changed manually.
Select Manage Scenarios to open the Manage Scenarios dialog box. Use the dialog box to add, rename, duplicate, hide, and delete budget and resource planning scenarios.
To delete a scenario, the scenario must have a status of In Planning.
Set the Target Budget for a Budget Planning Scenario
Set a target budget for the entire planning horizon. This value is used during the planning and selection process to guide budget planners when selecting projects for inclusion in the budget scenarios on the Budget Planning page and when using Selection Analysis views.
To set the target budget:
1) In the object selector, select a portfolio.
2) In the sidebar, hover over Cost and Funds, and select Budget Planning.
3) In the context bar, select the planning period menu, and select the planning year, which is either the current year or the subsequent year.
4) Select the scenario.
5) In the Target Budget row, enter a value which defines the target budget for the entire planning horizon in the Total Cost column.
6) Select Save.
Configure the Budget Planning Page Project View
Configure the Project View to view important information while working out the budget for the portfolio budget plan.
To configure the project view:
1) In the object selector, select a portfolio.
2) In the sidebar, hover over Cost and Funds, and select Budget Planning.
3) On the Budget Planning page, select Grid.
4) Select Project View.
5) To add or remove columns, filter project data, group projects by specific criteria, or display additional cost curves, select Settings.
a. In the Settings dialog box, use the tabs to make changes to your view.
b. Select Apply.

Portfolio Management User Guide
42
Configure the Budget Planning Page Chart
Configure the budget planning chart to view cost spread visualizations while working out the budget for the budget plan.
To configure the chart:
1) In the object selector, select a portfolio.
2) In the sidebar, hover over Cost and Funds, and select Budget Planning.
3) On the Budget Planning page, select Chart.
4) Select All to view cost spreads at the budget plan level.
Customize the view:
Show: Select the projects to display.
All Projects: All projects included in the portfolio.
Included Projects: Projects selected for inclusion in the budget plan scenario.
Not Included Projects: Projects that have not been selected for the budget plan scenario.
Settings: Select to filter project data or display additional cost curves.
Incremental and Cumulative: Select to view incremental bars, cumulative cost curves, or both.
Timescale: Slide the handles on the timescale to zoom in or out on a time frame.
5) Select By Project to view which projects are contributing the most to the cost in a given time frame.
Customize the view:
Show: Select the projects to display.
All Projects: All projects included in the portfolio.
Included Projects: Projects selected for inclusion in the budget plan scenario.
Not Included Projects: Projects that have not been selected for the budget plan scenario.
Cost Curve: Select a cost curve to view on the chart.
Project Count: Select the number of top contributing projects to display in the chart for the selected cost curve within the selected time frame.
From and To: Select the time frame for which you want to view the top contributing projects.
Timescale: Slide the handles on the timescale to zoom in or out on a time period.
View Project Dependencies on the Budget Planning Page
It is important to review projects that depend on or support the projects being selected for budget plans during project selection.
To view project dependencies:
1) In the object selector, select a portfolio.
2) In the sidebar, hover over Cost and Funds, and select Budget Planning.

Plan
43
3) On the Budget Planning page, select Show Unmet Dependencies.
4) Select a project to view whether it supports or depends on another project.
Configure the Waterline View on the Budget Planning Page
Display a waterline to help analyze the project group within the portfolio to assist you in making decisions on selecting projects for the budget plan. A waterline sorts projects in the portfolio into two separate groups based on the defined constraint limit. Projects above the waterline are those that collectively meet the constraint limit value; all other projects appear below the waterline.
To configure the waterline view:
1) In the object selector, select a portfolio.
2) In the sidebar, hover over Cost and Funds, and select Budget Planning.
3) On the Budget Planning page, select Waterline View.
4) Select Waterline Options.
5) In the Waterline Options dialog box:
a. Configure the Waterline Level by selecting options for the following fields:
1. Limit: The project field used as a parameter when setting the waterline level limit.
2. Is: Determines the logical relationship between the Limit field and your entry in the associated Value field.
3. Value: The limit used to determine which set of projects meet the defined parameter value and which projects do not meet the parameters and therefore fall below the waterline.
b. Configure the Sort By options by specifying the first and optionally second fields used to rank and sort the projects.
c. Select Apply.
Tips
If a project does not meet the waterline criteria, but must be included in the budget plan, select Forced In. Conversely, if it has been determined that a project will not be included in the budget plan even though it does meet the waterline criteria, select Forced Out.
Select Projects for a Budget Planning Scenario
Select projects to include in budget plan scenarios using tools available on the Budget Planning page.
To select projects for a budget plan scenario:
1) In the object selector, select a portfolio.
2) In the sidebar, hover over Cost and Funds, and select Budget Planning.
3) Select Project View or Waterline View.

Portfolio Management User Guide
44
4) To include a project in a budget plan scenario, in the table, select the State field to display the Selected state or Forced In state. To add multiple projects at once, use Ctrl + click to highlight each project. On the Actions menu, select Include, and then select Highlighted Projects.
Note: The Forced In and Forced Out states are useful if you have predetermined whether projects are included in the budget plan. These states are also useful if you are using the Waterline View and you want to include or exclude the project in the scenario whether or not the project meets the selected criteria.
The Proposed Budget row now includes the total cost for the project, and the value of the included projects field has increased. As you make selections, the Difference row displays the difference between the Target Budget and the Proposed Budget, which is based on the totals for the selected projects.
5) Select Save.
Tips
Select Refresh to run the portfolio filter to ensure all projects are included in the scenario. Refresh the filter on each scenario if you have multiple scenarios.
Budget Scenario Optimization Overview
The Optimization tool enables portfolio managers to make optimal project selections for their portfolios by taking into account both total and time-phased budget constraints. Given a set of constraints and specified objectives, the tool simulates the selection of different combinations of projects, and suggests the optimal set of projects for inclusion in a budget scenario to realize the maximum portfolio value.
During the optimization process, the tool maximizes a primary objective value based on the input cost constraints. For example, you may want to maximize the Evaluation Score or Net Savings of your portfolio while applying budget constraints to your Planned Budget or Proposed Budget. Optionally, you can maximize or minimize a secondary objective value to further refine your optimization results. For example, you might select a primary objective which maximizes the Evaluation Score of your portfolio and a secondary objective that minimizes the Total Cost value.
Cost constraint fields and values are typically input manually, but you can also use portfolio funds as your constraints. Portfolio managers often have different sources available to fund the projects in their portfolios. Funds can have their own total and yearly cost constraints, as well as restrictions on the types of projects they can be used to fund. After adding funds to your portfolio, run Optimization with fund constraints to generate an optimal selection that meets your objective and adheres to all fund restrictions. With funds as your constraints, the Optimization process automatically assigns funds to your projects and allocates total and time-phased cost values to each fund. You can use the tool to view how your funds might be distributed in an optimized scenario.

Plan
45
Optimal project selections for both total and time-phased cost constraint values are visually represented on an efficient frontier analysis curve, an additional aid in the decision-making process for project selection. The Total Cost Constraint line shows the best possible project selection using only a total cost constraint. The Total & Time-phased Cost Constraint line shows the best possible selection of projects using all possible cost constraints. After running the optimization process, project selections are made automatically that represent the primary and secondary objective values within the given constraint limits. An Optimal Selection point is drawn on the chart that reflects the total cost value and total objective values of the projects selected.
If possible, the Optimization tool also generates alternative constraint solutions that may achieve greater value than your current selection. The tool suggests different possible distributions of your time-phased constraints that would allow for a greater portfolio value at the same or lower total cost. Review up to two recommended solutions and use the values to overwrite an existing scenario or create a scenario. Recommendations are not generated when using funds as constraints.
Working with the Budget Scenario Optimization Tool
Use the Optimization tool on the Budget Planning page to generate a selection of projects that maximizes the portfolio value under a given set of project and cost constraints. Specify cost constraints and objective values, and then run the optimization to view the optimal selection.
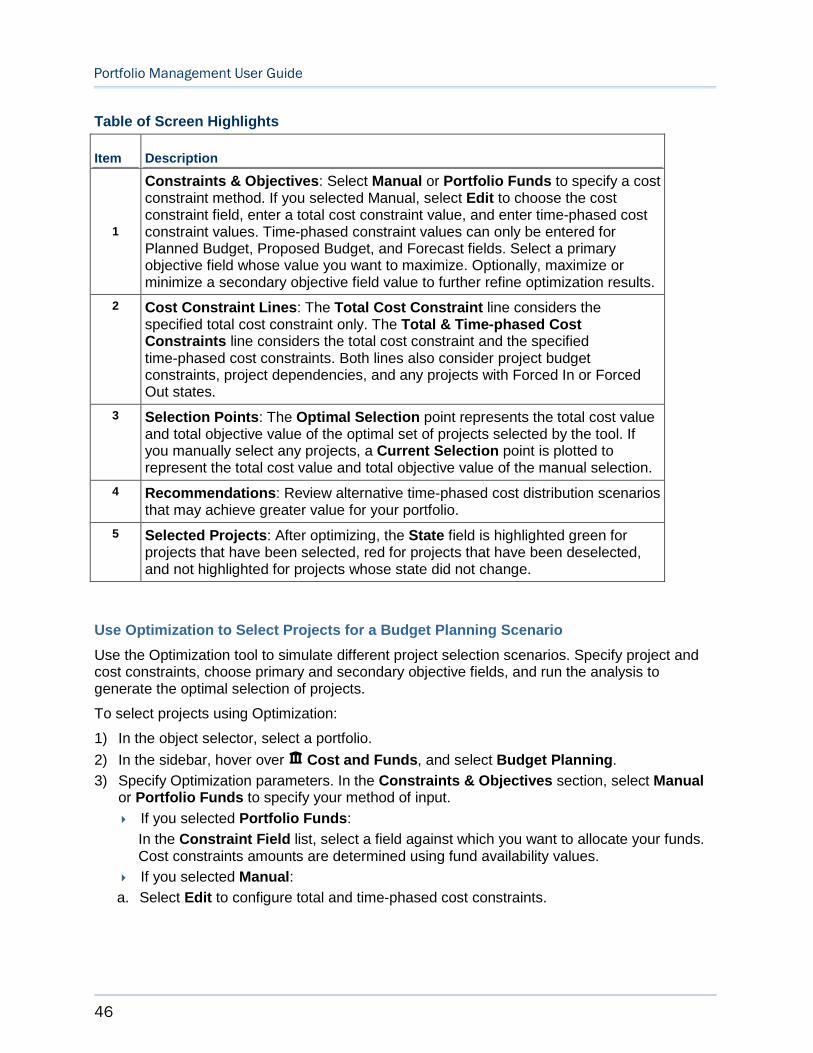
Portfolio Management User Guide
46
Table of Screen Highlights
Item Description
1
Constraints & Objectives: Select Manual or Portfolio Funds to specify a cost constraint method. If you selected Manual, select Edit to choose the cost constraint field, enter a total cost constraint value, and enter time-phased cost constraint values. Time-phased constraint values can only be entered for Planned Budget, Proposed Budget, and Forecast fields. Select a primary objective field whose value you want to maximize. Optionally, maximize or minimize a secondary objective field value to further refine optimization results.
2 Cost Constraint Lines: The Total Cost Constraint line considers the specified total cost constraint only. The Total & Time-phased Cost Constraints line considers the total cost constraint and the specified time-phased cost constraints. Both lines also consider project budget constraints, project dependencies, and any projects with Forced In or Forced Out states.
3 Selection Points: The Optimal Selection point represents the total cost value and total objective value of the optimal set of projects selected by the tool. If you manually select any projects, a Current Selection point is plotted to represent the total cost value and total objective value of the manual selection.
4 Recommendations: Review alternative time-phased cost distribution scenarios that may achieve greater value for your portfolio.
5 Selected Projects: After optimizing, the State field is highlighted green for projects that have been selected, red for projects that have been deselected, and not highlighted for projects whose state did not change.
Use Optimization to Select Projects for a Budget Planning Scenario
Use the Optimization tool to simulate different project selection scenarios. Specify project and cost constraints, choose primary and secondary objective fields, and run the analysis to generate the optimal selection of projects.
To select projects using Optimization:
1) In the object selector, select a portfolio.
2) In the sidebar, hover over Cost and Funds, and select Budget Planning.
3) Specify Optimization parameters. In the Constraints & Objectives section, select Manual or Portfolio Funds to specify your method of input.
If you selected Portfolio Funds:
In the Constraint Field list, select a field against which you want to allocate your funds. Cost constraints amounts are determined using fund availability values.
If you selected Manual:
a. Select Edit to configure total and time-phased cost constraints.
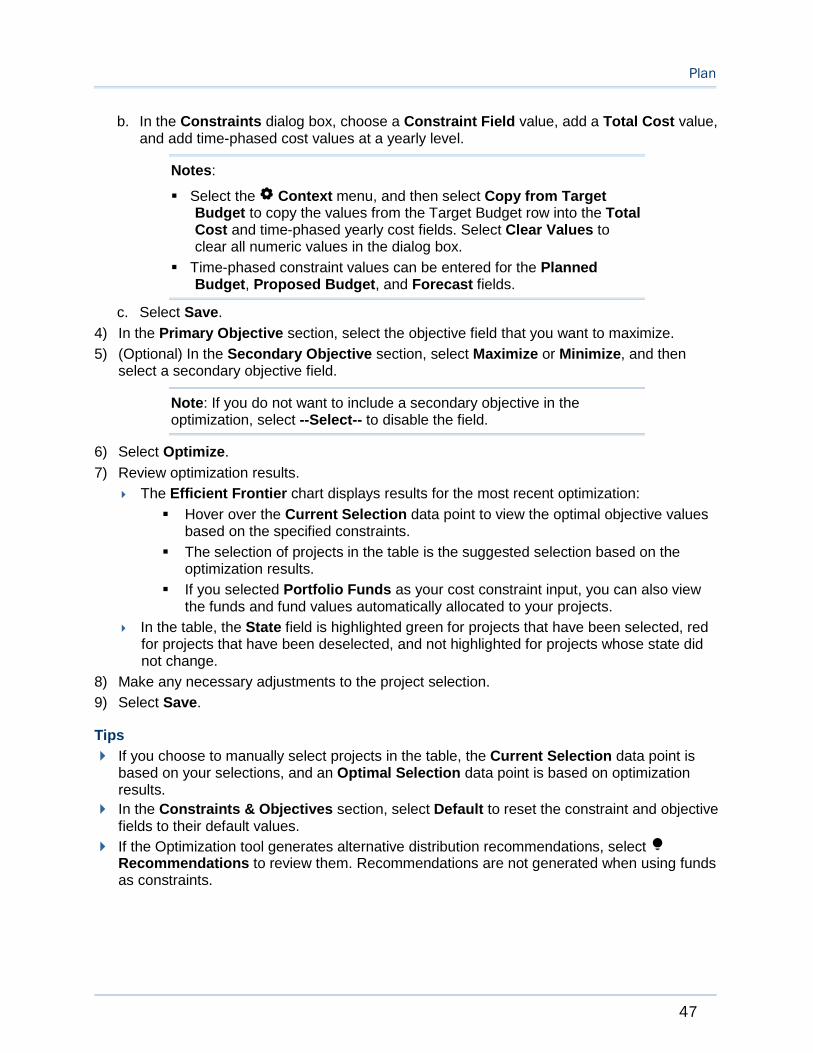
Plan
47
b. In the Constraints dialog box, choose a Constraint Field value, add a Total Cost value, and add time-phased cost values at a yearly level.
Notes:
Select the Context menu, and then select Copy from Target Budget to copy the values from the Target Budget row into the Total Cost and time-phased yearly cost fields. Select Clear Values to clear all numeric values in the dialog box.
Time-phased constraint values can be entered for the Planned Budget, Proposed Budget, and Forecast fields.
c. Select Save.
4) In the Primary Objective section, select the objective field that you want to maximize.
5) (Optional) In the Secondary Objective section, select Maximize or Minimize, and then select a secondary objective field.
Note: If you do not want to include a secondary objective in the optimization, select --Select-- to disable the field.
6) Select Optimize.
7) Review optimization results.
The Efficient Frontier chart displays results for the most recent optimization:
Hover over the Current Selection data point to view the optimal objective values based on the specified constraints.
The selection of projects in the table is the suggested selection based on the optimization results.
If you selected Portfolio Funds as your cost constraint input, you can also view the funds and fund values automatically allocated to your projects.
In the table, the State field is highlighted green for projects that have been selected, red for projects that have been deselected, and not highlighted for projects whose state did not change.
8) Make any necessary adjustments to the project selection.
9) Select Save.
Tips
If you choose to manually select projects in the table, the Current Selection data point is based on your selections, and an Optimal Selection data point is based on optimization results.
In the Constraints & Objectives section, select Default to reset the constraint and objective fields to their default values.
If the Optimization tool generates alternative distribution recommendations, select Recommendations to review them. Recommendations are not generated when using funds as constraints.
Portfolio Management User Guide
48
Use Optimization Recommendations in a Budget Planning Scenario
The budget scenario Optimization tool generates an optimal selection of projects based on given total and time-phased cost constraints. If possible, the tool also creates up to two alternative cost distribution scenarios that may offer a greater value than your current selection of projects. Each recommendation suggests a different distribution of time-phased constraints that achieves one or both objective values at the same or lower total cost. In the Recommendations dialog box, compare the total cost and objective values of any generated recommendations to your current optimization results. The Constraint Distribution detail window displays the total and time-phased constraints of your current distribution and selected recommendation. You can apply the selected recommendation's values to the current scenario or create a new one.
Notes:
Recommendations are only possible in scenarios with time-phased budgetary constraint values.
Recommendations are not generated when using funds as constraints.
To review optimization recommendations:
1) In the object selector, select a portfolio.
2) In the sidebar, hover over Cost and Funds, and select Budget Planning.
3) In the Constraints & Objectives section, configure your constraint and objective parameters, and then select Optimize.
4) Select Recommendations.
5) In the recommendations dialog box, use the chart, grid, and Constraint Distribution detail window to compare recommendation values with the results of your current selection of projects.
6) In the grid, select a scenario recommendation.
7) Select one of the following:
Apply to Current Scenario: Applies and saves the selected recommendation's project selections and cost constraint data to the current scenario.
Create New Scenario: Creates a new scenario based on the project selections and cost constraint data of the currently selected scenario. After you receive confirmation that the scenario has been created, select OK, and then select Close.
Tips
If there are two recommendations in the dialog box, you can select both and then select Create New Scenario to create a scenario for each recommendation.
Understanding Budget Scenario Optimization Calculations
The Optimization tool simulates different project selection scenarios to find the optimal selection of projects that meets your desired objective values. The optimal selection may be limited by project and cost constraints to meet budgetary or other cost requirements. After running the tool, two lines are generated:

Plan
49
Total Cost Constraint: This line includes the total cost constraint value only. The purpose of this curve is to show the best possible project selection using only a total cost constraint.
Total & Time-phased Cost Constraint: This line includes the total cost constraint value and time-phased cost constraint values. The purpose of this curve is to show the best possible project selection using all possible cost constraints.
Both lines also consider project budget constraints, project dependencies, and any projects with Forced In or Forced Out states.
The following examples demonstrate how the budget planning Optimization tool generates an optimized project selection result.
Note: The following examples are specific to manually input cost constraints, not portfolio funds.
Example 1
Example 1 only considers a total cost constraint value to determine a project selection that maximizes total project value while minimizing total project cost.
Project Cost 2017 2018 2019 2020 Project Value
A $400 $100 $200 $100 $1000
B $300 $50 $100 $100 $50 $400
C $200 $0 $50 $100 $50 $400
Total $900 $150 $350 $300 $100 $1800
If you consider a total cost constraint value of $500, the possible project selection scenarios are as follows:
Project A
Project B
Project C
Project B and Project C
Each of these selections meets the $500 total cost constraint. The selection that maximizes your Project Value is Project A, with a value of $1000 and a cost of $400.
Example 2
Example 2 considers a total cost constraint value as well as time-phased cost constraints. We will also see how the optimal project selection may vary based on changes to the input cost constraint values.

Portfolio Management User Guide
50
Project Cost 2017 2018 2019 2020 Project Value
A $400 $100 $200 $100 $1000
B $300 $50 $100 $100 $50 $400
C $200 $0 $100 $100 $50 $400
Total $900 $150 $300 $300 $100 $1800
Constraint Set 1
$500 $50 $250 $200 $100
Constraint Set 2
$500 $100 $200 $200 $100
Consider Constraint Set 1. The possible combinations of projects are as follows:
Project B
Project C
Project B and Project C
Each of these combinations not only meets the $500 total cost constraint, but also the time-phased cost constraints for each yearly period. The combination that maximizes the Project Value is Project B and Project C, with a total value of $800.00, at a total cost of $500.00.
Consider Constraint Set 2. Although similar to Constraint Set 1, the time-phased total cost values for 2017 and 2018 have both been modified. The possible combinations of projects that meet the constraint values in Constraint Set 2 are as follows:
Project A
Project B
Project C
Project B and Project C
Each of these combinations meets the $500 total cost constraint and each time-phased total cost constraint. The combination that maximizes Project Value is Project A, with a total value of $1000.00, at a total cost of $400.00.
The modification of the time-phased cost constraints has resulted in a greater possible Project Value.
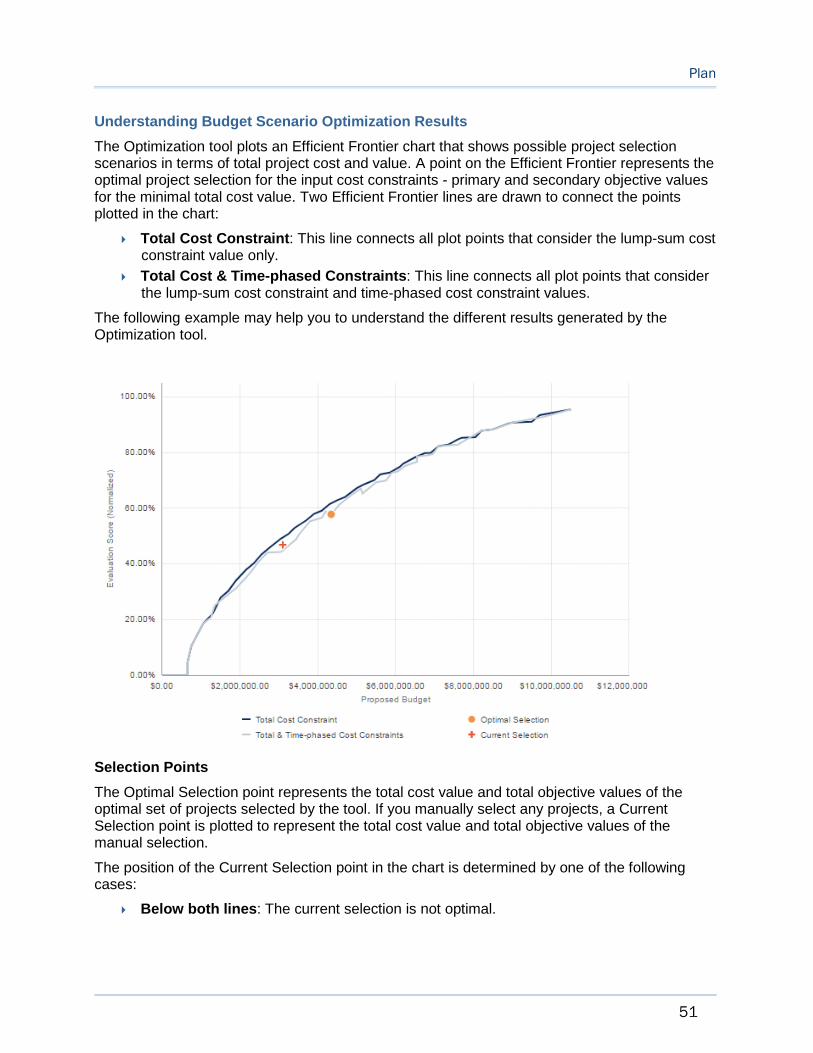
Plan
51
Understanding Budget Scenario Optimization Results
The Optimization tool plots an Efficient Frontier chart that shows possible project selection scenarios in terms of total project cost and value. A point on the Efficient Frontier represents the optimal project selection for the input cost constraints - primary and secondary objective values for the minimal total cost value. Two Efficient Frontier lines are drawn to connect the points plotted in the chart:
Total Cost Constraint: This line connects all plot points that consider the lump-sum cost constraint value only.
Total Cost & Time-phased Constraints: This line connects all plot points that consider the lump-sum cost constraint and time-phased cost constraint values.
The following example may help you to understand the different results generated by the Optimization tool.
Selection Points
The Optimal Selection point represents the total cost value and total objective values of the optimal set of projects selected by the tool. If you manually select any projects, a Current Selection point is plotted to represent the total cost value and total objective values of the manual selection.
The position of the Current Selection point in the chart is determined by one of the following cases:
Below both lines: The current selection is not optimal.

Portfolio Management User Guide
52
On the inner line: When manually selecting projects, only the total cost constraint value is considered. A current selection point on the inner line does not necessarily indicate an optimal selection.
Between the lines: The current selection meets the total time constraint value, but does not meet one or more time-phased constraint values.
On the outer line: The current selection is optimal, considering only the total cost constraint value.
Above both lines: The State of a project has been changed since last optimization, or project dependencies have been modified. The Optimization points were plotted using outdated information. Optimization should be run again.
When using funds as constraints, the Optimal Selection point may lie below both lines if there are allocation rules defined for at least one fund. If no allocation rules are present, the Optimal Selection point will lie on the Efficient Frontier.
Line Kinks
A "kink" in an Efficient Frontier line indicates that the total value decreased as the total cost increased from one set of selected projects to the next. The Optimization tool plots points on the chart that represent total objective and total cost values for different selections of projects. One selection of projects will have a specific total cost and specific total value, which is plotted as a point on the chart. It is possible that a different selection of projects with a higher cost but lower value may be plotted as the next point in the chart. This scenario is depicted in the chart above in the Total & Time-phased Cost Constraints line between the $4,000,000.00 and $6,000,000.00 axis lines. Kinks may be present if time-phased constraints are entered. If only a total cost constraint is entered, kinks would not be observed.
Line Shifts
Line shifts have two possible causes. A horizontal shift occurs when one or more projects have Forced In states. The minimum total cost value represents the sum total cost of all forced in projects at the time of optimization. There can be no project selection solution with a total cost less than this value. A vertical shift occurs when one or more projects have Forced Out states. When projects are forced out, the upper limit of either constraint line cannot reach 100% of the objective value.
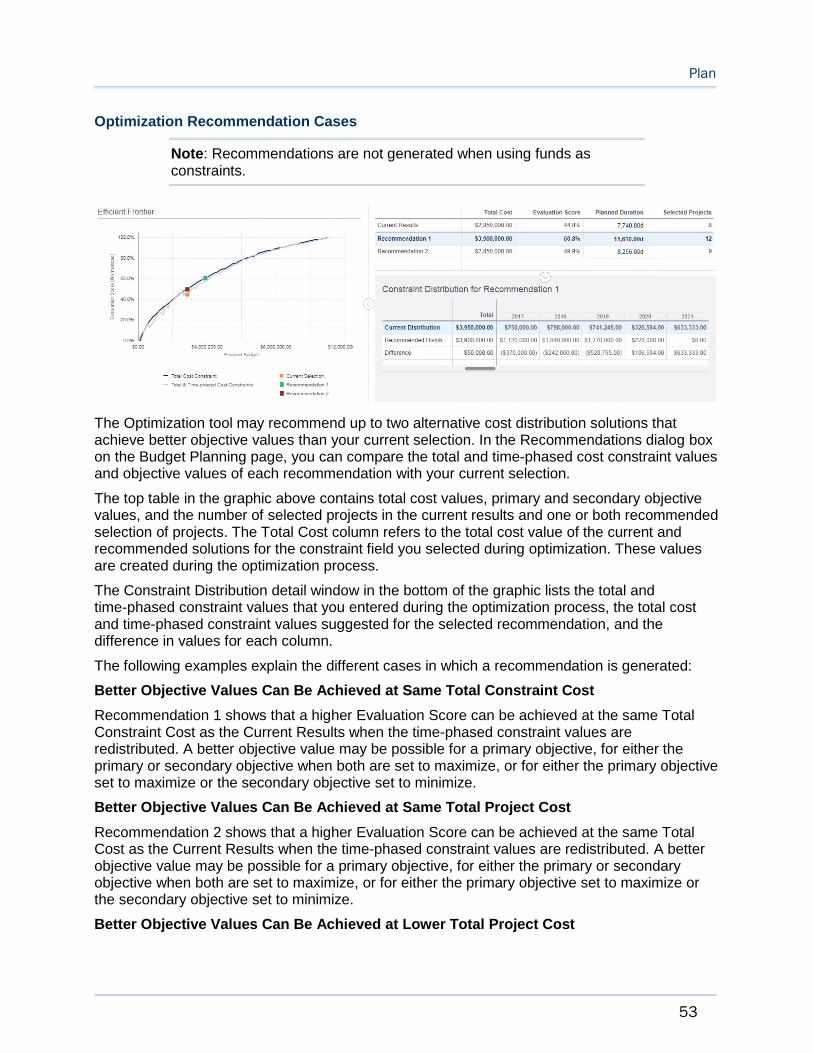
Plan
53
Optimization Recommendation Cases
Note: Recommendations are not generated when using funds as constraints.
The Optimization tool may recommend up to two alternative cost distribution solutions that achieve better objective values than your current selection. In the Recommendations dialog box on the Budget Planning page, you can compare the total and time-phased cost constraint values and objective values of each recommendation with your current selection.
The top table in the graphic above contains total cost values, primary and secondary objective values, and the number of selected projects in the current results and one or both recommended selection of projects. The Total Cost column refers to the total cost value of the current and recommended solutions for the constraint field you selected during optimization. These values are created during the optimization process.
The Constraint Distribution detail window in the bottom of the graphic lists the total and time-phased constraint values that you entered during the optimization process, the total cost and time-phased constraint values suggested for the selected recommendation, and the difference in values for each column.
The following examples explain the different cases in which a recommendation is generated:
Better Objective Values Can Be Achieved at Same Total Constraint Cost
Recommendation 1 shows that a higher Evaluation Score can be achieved at the same Total Constraint Cost as the Current Results when the time-phased constraint values are redistributed. A better objective value may be possible for a primary objective, for either the primary or secondary objective when both are set to maximize, or for either the primary objective set to maximize or the secondary objective set to minimize.
Better Objective Values Can Be Achieved at Same Total Project Cost
Recommendation 2 shows that a higher Evaluation Score can be achieved at the same Total Cost as the Current Results when the time-phased constraint values are redistributed. A better objective value may be possible for a primary objective, for either the primary or secondary objective when both are set to maximize, or for either the primary objective set to maximize or the secondary objective set to minimize.
Better Objective Values Can Be Achieved at Lower Total Project Cost

Portfolio Management User Guide
54
An optimized project solution plotted on a "kink" may occur when the time-phased constraint values yield a lower objective value. In this case, a recommendation may be generated that achieves better objective values at a lower cost than the optimized solution. This case would be covered by Recommendation 2.
Same Objective Value Can Be Achieved at Lower Total Project Cost
A recommendation may be generated if the same primary or secondary objective value can be achieved at a lower project cost. This case would be covered by Recommendation 2.
Fund Allocation Results
When using portfolio funds as constraints for Optimization, the tool generates the optimal selection of projects that meet all fund requirements. Funds are automatically assigned to the selected projects, with total and time-phased fund values allocated to the funds in a specific order. The tool is designed to completely allocate all the money in a fund before assigning another fund. If there are restricted funds with allocation rules defined, the tool allocates all of the money in the restricted funds before looking for money from unrestricted funds, if applicable. The assignment process selects funds in the order in which the funds were created.
Link a Project's Proposed Budget with a Forecast or Planned Budget Value
You can link a project's Forecast or Planned Budget values from the Cash Flow page to the proposed budget values on the Budget Planning page. Link date and cost fields, including Start, Finish, and Total Cost, to use in your budget plan scenarios.
To link scenario date and cost fields to the values proposed by the project manager:
1) In the object selector, select a portfolio.
2) In the sidebar, hover over Cost and Funds, and select Budget Planning.
3) To link one project, select Link.
To link multiple projects, use Ctrl+click to select each project. On the Actions menu, select Link, and then select Highlighted Projects.
Note: You cannot edit the Start, Finish, Total Cost, or time-phased cost fields when the link is enabled.
4) Select Save.
Directly Allocate a Proposed Budget and Dates for a Project Within Budget Plan Scenarios
As a budget planner, you can choose to link to the budget values and project dates as defined by the project manager, or you can propose different values.
To propose a budget and start and end dates for a project:
1) In the object selector, select a portfolio.
2) In the sidebar, hover over Cost and Funds, and select Budget Planning.
3) In the table, expand a project to view the values entered by the project manager. Determine whether to link to these values or propose new values.
Plan
55
4) To use the values entered by the project manager as a starting point, on the row with the project name, select Link to bring in the project manager's values, then select Unlinkto edit those values.
5) On the row with the project name, enter the proposed Total Cost for the project within the planning horizon.
Notes:
This amount appears in the Undistributed field until costs are allocated by time period.
If you see values in the Past or Future fields for the Forecast or Planned Budget, this is the budget for the project that extends beyond the current planning horizon.
6) To allocate the budget per time period, select the time period and enter an amount.
Note: The total allocated budget values for all time periods are calculated in the Distributed field.
7) To enter the Start and Finish dates, select the field and use the calendar selector to select a date.
Note: If you brought in the project manager's dates and costs and you change the dates, be sure to redistribute the costs per time period. Review the Undistributed field to determine the amount of costs to be distributed. If there is an amount in parentheses, your distributed costs exceed the amount in the Total Cost field.
8) Select Save.
Assign a Portfolio Fund to a Project
After you have added your portfolio-level funds and defined their allocation rules, you can assign them to projects during the budget planning process.
To assign a portfolio fund to a project:
1) In the object selector, select a portfolio.
2) In the sidebar, hover over Cost and Funds, and select Budget Planning.
3) On the Budget Planning page, select a scenario.
If the scenario is associated with a portfolio that has funds, the Funds tab is visible on this page.
4) Select the Funds tab.
5) In the table, highlight the row that represents the project to which you want to assign the fund.
The Fund Availability detail window shows you which funds are available.
6) By the project row, select Context and then select Assign Fund.
7) In the Assign Funds dialog box, select a fund, and then select OK.

Portfolio Management User Guide
56
Only funds that are eligible for use on the highlighted project are available here.
In the Funds tab, notice that the project row is accompanied by a row for the fund. This new fund row represents the fund's use in that project.
8) In the fund row, in the Total Cost column, enter a Proposed Fund value.
This value represents how much of the total fund will be available across the project's lifecycle. You can compare it against the Variance value at the project level to see how much more money is required to fund the given project.
9) For each time period column, enter a Proposed Fund value.
10) In the Fund Availability detail window, select one of the following views:
Grid: Displays cumulative data for all funds in the portfolio.
Surplus/Deficit Chart: Displays a graphical representation of the surplus and deficit values for each fund, for each time period.
Stacked Histogram: Displays totals for each fund. For each time period, totals for each project are stacked vertically.
The values you enter on this page are reflected in the totals shown in the Fund Availabilitydetail window.
You can try different combinations of fund assignments and select or deselect projects to make sure you are getting the most from your funds.
Select Check Funds Validity to see if there are any allocation rules or irregularities that make funds unavailable for allocation in the portfolio.
When the scenario is approved, the fund assignments and their proposed values are allocated to their respective projects. You can see the proposed fund values in the Total column in project fund sheet.
Selection Analysis Overview
Selection Analysis is the process of selecting the best group of projects in a portfolio to execute based on the analysis of a variety of financial attributes. While the Budget Planning page enables planners to select the right projects to execute based on budget constraints, the Selection Analysis page enables planners to analyze project attributes besides budget, such as Return on Investment, Net Present Value, and Profitability Index. One or more analysis views can be configured to graphically represent project data by different sets of criteria using a variety of charts and a grid. The charts are interactive based on the project selection in the grid.
Note: Analysis views are created in the settings and opened from the Published Views page. Opening an analysis view displays it on the Selection Analysis page. Analysis views are only available from the Published Views page if they have been created and associated to the portfolio.
Use the Selection Analysis page to:
Review the planned budget or forecasted costs entered by the project manager, and choose to link to those costs or propose an alternative budget.
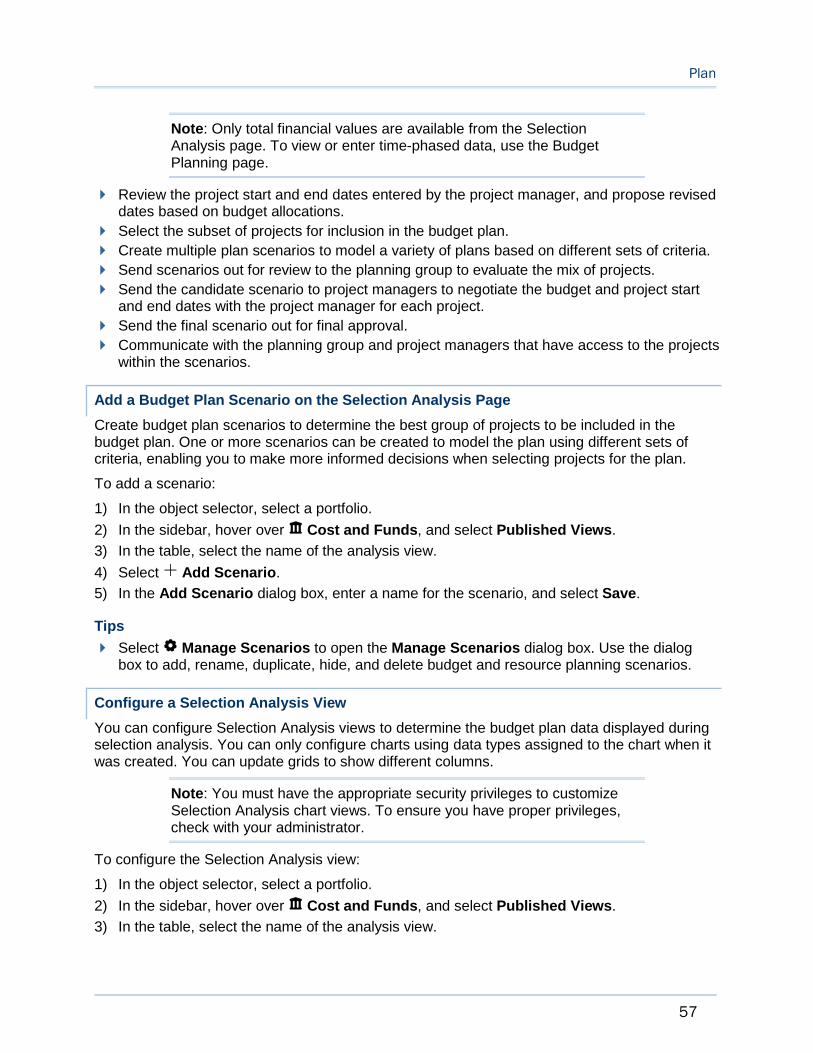
Plan
57
Note: Only total financial values are available from the Selection Analysis page. To view or enter time-phased data, use the Budget Planning page.
Review the project start and end dates entered by the project manager, and propose revised dates based on budget allocations.
Select the subset of projects for inclusion in the budget plan.
Create multiple plan scenarios to model a variety of plans based on different sets of criteria.
Send scenarios out for review to the planning group to evaluate the mix of projects.
Send the candidate scenario to project managers to negotiate the budget and project start and end dates with the project manager for each project.
Send the final scenario out for final approval.
Communicate with the planning group and project managers that have access to the projects within the scenarios.
Add a Budget Plan Scenario on the Selection Analysis Page
Create budget plan scenarios to determine the best group of projects to be included in the budget plan. One or more scenarios can be created to model the plan using different sets of criteria, enabling you to make more informed decisions when selecting projects for the plan.
To add a scenario:
1) In the object selector, select a portfolio.
2) In the sidebar, hover over Cost and Funds, and select Published Views.
3) In the table, select the name of the analysis view.
4) Select Add Scenario.
5) In the Add Scenario dialog box, enter a name for the scenario, and select Save.
Tips
Select Manage Scenarios to open the Manage Scenarios dialog box. Use the dialog box to add, rename, duplicate, hide, and delete budget and resource planning scenarios.
Configure a Selection Analysis View
You can configure Selection Analysis views to determine the budget plan data displayed during selection analysis. You can only configure charts using data types assigned to the chart when it was created. You can update grids to show different columns.
Note: You must have the appropriate security privileges to customize Selection Analysis chart views. To ensure you have proper privileges, check with your administrator.
To configure the Selection Analysis view:
1) In the object selector, select a portfolio.
2) In the sidebar, hover over Cost and Funds, and select Published Views.
3) In the table, select the name of the analysis view.
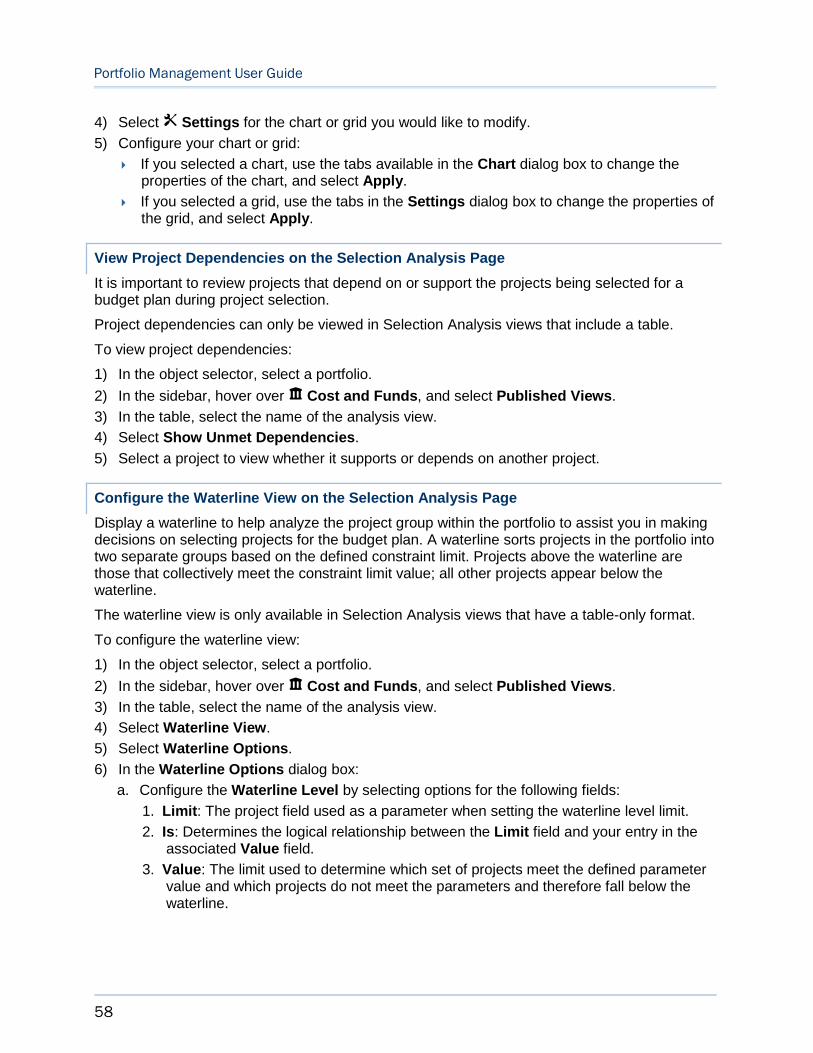
Portfolio Management User Guide
58
4) Select Settings for the chart or grid you would like to modify.
5) Configure your chart or grid:
If you selected a chart, use the tabs available in the Chart dialog box to change the properties of the chart, and select Apply.
If you selected a grid, use the tabs in the Settings dialog box to change the properties of the grid, and select Apply.
View Project Dependencies on the Selection Analysis Page
It is important to review projects that depend on or support the projects being selected for a budget plan during project selection.
Project dependencies can only be viewed in Selection Analysis views that include a table.
To view project dependencies:
1) In the object selector, select a portfolio.
2) In the sidebar, hover over Cost and Funds, and select Published Views.
3) In the table, select the name of the analysis view.
4) Select Show Unmet Dependencies.
5) Select a project to view whether it supports or depends on another project.
Configure the Waterline View on the Selection Analysis Page
Display a waterline to help analyze the project group within the portfolio to assist you in making decisions on selecting projects for the budget plan. A waterline sorts projects in the portfolio into two separate groups based on the defined constraint limit. Projects above the waterline are those that collectively meet the constraint limit value; all other projects appear below the waterline.
The waterline view is only available in Selection Analysis views that have a table-only format.
To configure the waterline view:
1) In the object selector, select a portfolio.
2) In the sidebar, hover over Cost and Funds, and select Published Views.
3) In the table, select the name of the analysis view.
4) Select Waterline View.
5) Select Waterline Options.
6) In the Waterline Options dialog box:
a. Configure the Waterline Level by selecting options for the following fields:
1. Limit: The project field used as a parameter when setting the waterline level limit.
2. Is: Determines the logical relationship between the Limit field and your entry in the associated Value field.
3. Value: The limit used to determine which set of projects meet the defined parameter value and which projects do not meet the parameters and therefore fall below the waterline.
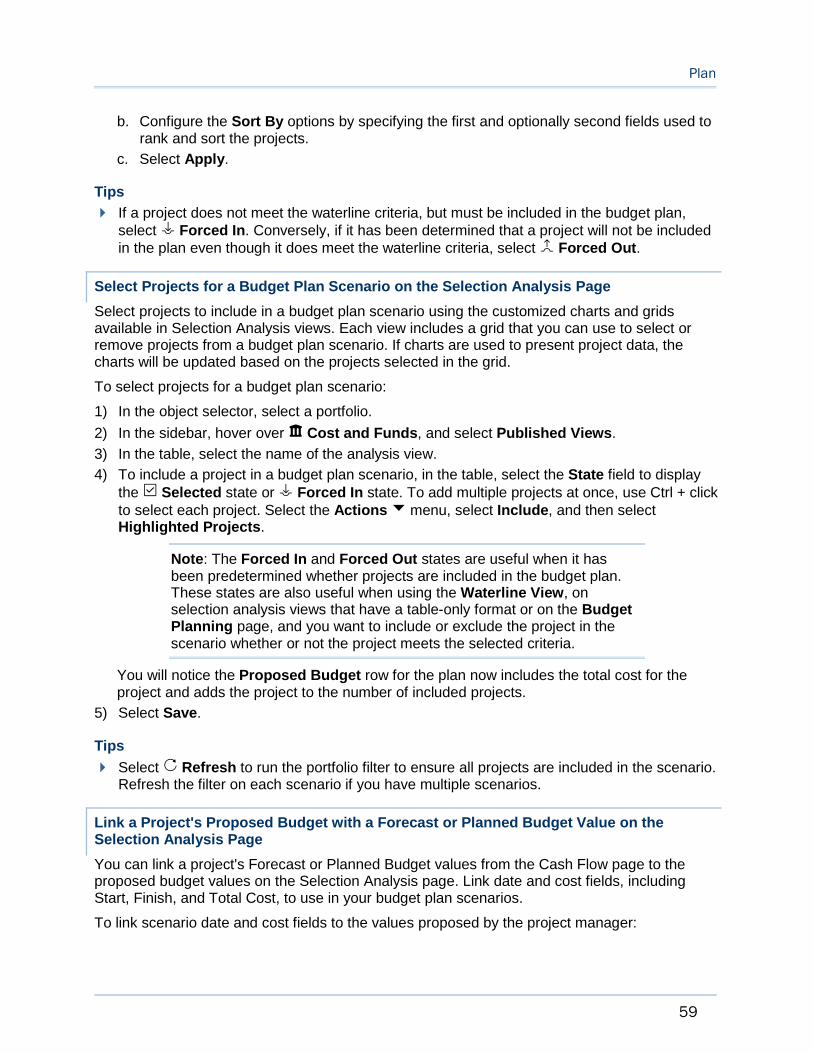
Plan
59
b. Configure the Sort By options by specifying the first and optionally second fields used to rank and sort the projects.
c. Select Apply.
Tips
If a project does not meet the waterline criteria, but must be included in the budget plan, select Forced In. Conversely, if it has been determined that a project will not be included in the plan even though it does meet the waterline criteria, select Forced Out.
Select Projects for a Budget Plan Scenario on the Selection Analysis Page
Select projects to include in a budget plan scenario using the customized charts and grids available in Selection Analysis views. Each view includes a grid that you can use to select or remove projects from a budget plan scenario. If charts are used to present project data, the charts will be updated based on the projects selected in the grid.
To select projects for a budget plan scenario:
1) In the object selector, select a portfolio.
2) In the sidebar, hover over Cost and Funds, and select Published Views.
3) In the table, select the name of the analysis view.
4) To include a project in a budget plan scenario, in the table, select the State field to display the Selected state or Forced In state. To add multiple projects at once, use Ctrl + click to select each project. Select the Actions menu, select Include, and then select Highlighted Projects.
Note: The Forced In and Forced Out states are useful when it has been predetermined whether projects are included in the budget plan. These states are also useful when using the Waterline View, on selection analysis views that have a table-only format or on the Budget Planning page, and you want to include or exclude the project in the scenario whether or not the project meets the selected criteria.
You will notice the Proposed Budget row for the plan now includes the total cost for the project and adds the project to the number of included projects.
5) Select Save.
Tips
Select Refresh to run the portfolio filter to ensure all projects are included in the scenario. Refresh the filter on each scenario if you have multiple scenarios.
Link a Project's Proposed Budget with a Forecast or Planned Budget Value on the Selection Analysis Page
You can link a project's Forecast or Planned Budget values from the Cash Flow page to the proposed budget values on the Selection Analysis page. Link date and cost fields, including Start, Finish, and Total Cost, to use in your budget plan scenarios.
To link scenario date and cost fields to the values proposed by the project manager:

Portfolio Management User Guide
60
1) In the object selector, select a portfolio.
2) In the sidebar, hover over Cost and Funds, and select Published Views.
3) In the table, select the name of the analysis view.
4) To link one project, in the table, select Link.
To link multiple projects, in the table, use Ctrl+click to select each project. On the Actionsmenu, select Link, and then select Highlighted Projects.
Note: You cannot edit the Start, Finish, Total Cost, or time-phased cost fields when the link is enabled.
5) Select Save.
Directly Allocate a Proposed Budget and Dates for Projects Within Budget Plan Scenarios on the Selection Analysis Page
As a budget planner, you can choose to link to the budget values and project dates as defined by the project manager, or you can propose different values.
From the Selection Analysis page, you can propose a total cost, but you cannot distribute the costs across the planning horizon. Use the Budget Planning page to distribute the costs.
To propose a budget and start and end dates for a project:
1) In the object selector, select a portfolio.
2) In the sidebar, hover over Cost and Funds, and select Published Views.
3) In the table, select the name of the analysis view.
4) Expand a project to view the values entered by the project manager. Determine whether to link to these values or propose new values.
5) To use the values entered by the project manager as a starting point, on the row with the project name, select Link to bring in the project manager's values, then select Unlinkto edit those values.
6) On the row with the project name, enter the proposed Total Cost for the project within the planning horizon.
Note: This amount appears in the Undistributed field until costs are allocated by time period, which must be done on the Budget Planningpage.
7) To enter the Start or Finish dates, select the field, and use the calendar selector to select a date.
Note: If you brought in the project manager's dates and costs and you change the dates, be sure to redistribute the costs per time period. Do this on the Budget Planning page. Review the Undistributed field to determine the amount of costs to be distributed. If there is an amount in parentheses, your distributed costs exceed the amount in the Total Costfield.
8) Select Save.

Plan
61
Create an Analysis View in a Portfolio
Create analysis views to analyze important project data while developing the portfolio budget. Analysis views are highly customizable and enable you to select the values important for evaluation, such as Return on Investment, Net Present Value, and Internal Rate of Return. Analysis views aid in providing budget planners with concise and clear information when selecting projects for a budget plan. In the portfolio-level settings, you can add analysis views to the portfolio or associate an analysis view from the parent workspace or another portfolio in the workspace.
After analysis views are created, they are opened from the Published Views page and used on the Selection Analysis page. You must have the appropriate security privileges to create an analysis view.
To create an analysis view:
1) Add an Analysis View (on page 61)
2) Configure an Analysis View (on page 62)
If an analysis view already exists, but is not associated with the portfolio, perform the following task:
Associate an Existing Analysis View (on page 62)
Add an Analysis View
Add an analysis view to create a meaningful display of portfolio budget plan scenario data. When adding an analysis view, you can select a view type to specify the arrangement for the charts and grids included in the view. You can associate and use analysis views with any of your budget plans.
To add an analysis view:
1) In the object selector, select a portfolio.
2) In the sidebar, select Summary & Settings.
3) On the Summary & Settings menu, select Analysis Views.
4) Select Add View, and select a type.
5) In the Name dialog box, enter a unique name for the analysis view.
6) Select OK.
7) Select Save.
8) In the Summary & Settings panel, select Close.
Tips
When editing an analysis view, select the Change Type menu on the View tab, and select a type to change the layout of the view after you have created it.
This setting is used in the following apps:
Cost and Funds

Portfolio Management User Guide
62
Configure an Analysis View
You can configure charts and grids through the chart and grid panes to tailor them to your analysis views.
To configure an analysis view:
1) In the object selector, select a portfolio.
2) In the sidebar, select Summary & Settings.
3) On the Summary & Settings menu, select Analysis Views.
4) Select an analysis view.
5) On the View tab, select the chart pane or grid pane you would like to modify, and select Configure.
6) Configure your chart or grid:
If you selected a chart, use the Configure Chart wizard to change the properties of the chart.
If you selected a grid, use the grid Settings dialog box to change the properties of the grid.
7) In the Portfolio Settings section, configure the following options:
Select Publish View to enable a user with the appropriate privileges to access the analysis view from the Published Views page for the portfolio.
Select User Customization to allow a user with the appropriate privileges to customize the analysis view while viewing data.
8) Select Save.
9) In the Summary & Settings panel, select Close.
This setting is used in the following apps:
Cost and Funds
Associate an Existing Analysis View
Associating analysis views to your portfolio enables you to use analysis views in the parent workspace or another portfolio in the workspace to view budget plan data. You can disassociate an analysis view from a plan at any time.
To associate an analysis view with a portfolio:
1) In the object selector, select a portfolio.
2) In the sidebar, select Summary & Settings.
3) On the Summary & Settings menu, select Analysis Views.
4) Select Add View, and select Associate Existing View.
5) In the Globally Defined Views dialog box, expand the type of the view you want to select, select the view, and select Move Right.
6) Select Save.
7) In the Summary & Settings panel, select Close.
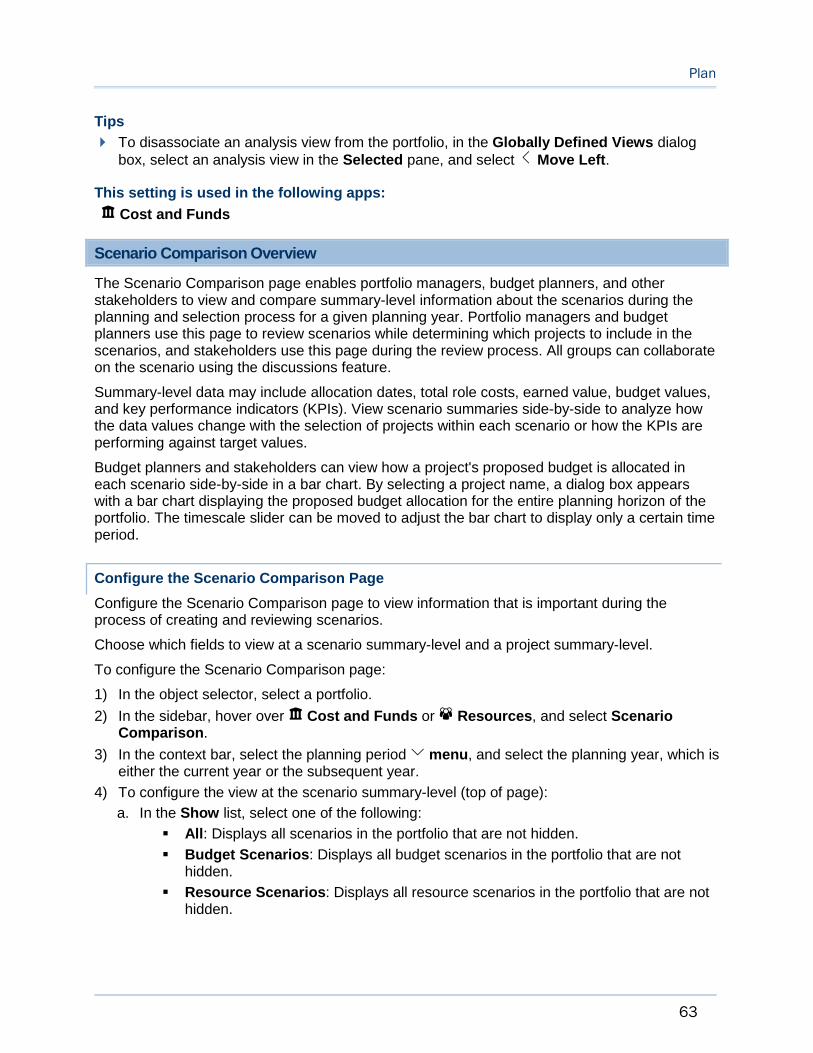
Plan
63
Tips
To disassociate an analysis view from the portfolio, in the Globally Defined Views dialog box, select an analysis view in the Selected pane, and select Move Left.
This setting is used in the following apps:
Cost and Funds
Scenario Comparison Overview
The Scenario Comparison page enables portfolio managers, budget planners, and other stakeholders to view and compare summary-level information about the scenarios during the planning and selection process for a given planning year. Portfolio managers and budget planners use this page to review scenarios while determining which projects to include in the scenarios, and stakeholders use this page during the review process. All groups can collaborate on the scenario using the discussions feature.
Summary-level data may include allocation dates, total role costs, earned value, budget values, and key performance indicators (KPIs). View scenario summaries side-by-side to analyze how the data values change with the selection of projects within each scenario or how the KPIs are performing against target values.
Budget planners and stakeholders can view how a project's proposed budget is allocated in each scenario side-by-side in a bar chart. By selecting a project name, a dialog box appears with a bar chart displaying the proposed budget allocation for the entire planning horizon of the portfolio. The timescale slider can be moved to adjust the bar chart to display only a certain time period.
Configure the Scenario Comparison Page
Configure the Scenario Comparison page to view information that is important during the process of creating and reviewing scenarios.
Choose which fields to view at a scenario summary-level and a project summary-level.
To configure the Scenario Comparison page:
1) In the object selector, select a portfolio.
2) In the sidebar, hover over Cost and Funds or Resources, and select Scenario Comparison.
3) In the context bar, select the planning period menu, and select the planning year, which is either the current year or the subsequent year.
4) To configure the view at the scenario summary-level (top of page):
a. In the Show list, select one of the following:
All: Displays all scenarios in the portfolio that are not hidden.
Budget Scenarios: Displays all budget scenarios in the portfolio that are not hidden.
Resource Scenarios: Displays all resource scenarios in the portfolio that are not hidden.

Portfolio Management User Guide
64
b. Select the Status list and select to view scenarios of a particular status. For example, you can view all scenarios that are Under Review.
c. Select the check box next to the scenario name to view the projects included in each scenario at the project summary-level. Hover over a scenario icon to view the scenario type.
d. Select Settings to configure the fields that display.
In the Settings panel, select the fields you want to view, and select Apply.
5) To configure the view at the project summary-level (bottom of page):
a. Select Show and select to filter the projects that display.
b. Select Settings to configure the fields that display.
In the Settings panel, select the fields you want to view, and select Apply.
Note: These configuration steps do not apply to the project dialog box that appears when you select a project name. The project dialog box displays the fields configured at the scenario summary-level at the top of the page.
Compare Scenarios
Compare scenarios to view summary-level information about the scenarios and their projects during the selection analysis process.
To compare scenarios:
1) In the object selector, select a portfolio.
2) In the sidebar, hover over Cost and Funds or Resources, and select Scenario Comparison.
3) In the context bar, select the planning period menu, and select the planning year, which is either the current year or the subsequent year.
4) Review the data shown for each scenario.
5) Select the check box next to the scenario name to view the projects included in each scenario at the project summary-level.
6) To review project summary-level information per scenario, select a project name.
7) In the project dialog box:
a. Review the data available in the scenario summary for each project.
b. View the Proposed Budget Allocation Per Scenario chart. To view a specific time period, slide the handles on timescale.
c. Select Close.

Plan
65
Build a Portfolio Resource Plan
The objective of portfolio resource planning is to select the right combination of projects to execute under the resource constraints present in an organization or department. A portfolio resource plan is created by developing scenarios to satisfy these constraints and then choosing your projects. To create the best possible scenario, you can manually allocate labor units to project roles, modify role allocation dates, analyze labor costs, and include or exclude projects from the plan. You can also use the Optimization tool to automatically select projects according to input constraints. After it is approved, the scenario serves as a guide for a resource planner to staff the selected projects in accordance with the plan. Portfolio resource planning can only be done on projects in the portfolio. If a portfolio includes another portfolio, that portfolio and its projects are not available on the Resource Planning page.
Portfolio managers can create multiple scenarios using the Resource Planning page to determine the best mix of projects for a resource plan. The Resource Planning page enables planners to view and modify time-phased resource data for all projects within the portfolio. The Scenario Comparison page is also available to enable planners to review the project selection and data at the summary-level for all scenarios created.
To build a resource plan:
1) Add a Resource Planning Scenario (on page 66)
2) Configure the Resource Planning Page (on page 66)
3) Select Projects
Manual selection: Select Projects for a Resource Planning Scenario (on page 67)
Automatic selection: Use Optimization to Select Projects for a Resource Planning Scenario (on page 74)
Resource Planning Overview
The Resource Planning page provides a time-phased view where portfolio managers can evaluate resource constraints and make the right project selections. This is where the high-level resource planning occurs.
Use this page to:
Create multiple scenarios to model a variety of resource plans based on different sets of criteria.
View individual role demands by project, and analyze role availability issues using charts, histograms, and tables.
Allocate labor units and revise allocation start dates to resolve role availability issues.
View total and time-phased costs for demand, allocation, and committed role units to aid your project selection decisions.
Select a subset of projects for inclusion in the resource plan that satisfy all of your resource constraints.
Use the resource planning optimization tool to suggest an optimal selection of projects for inclusion in the resource plan.
Send resource planning scenarios out for review to stakeholders in the planning group to evaluate the mix of projects.
Portfolio Management User Guide
66
Send the proposed scenario to project managers to negotiate the role allocation demand with the project manager for each project.
Send the final scenario out for final approval, and approve the plan to commit allocations to roles.
Understanding FTE Values
You can enter allocation units in time-phased intervals on the timescale as job-hours or as full-time equivalent values. FTE represents the number of full-time employees needed to complete the work in a specified time period. For example, an FTE value of 1.0 entered in a weekly period indicates that the equivalent of one full-time employee would be required to complete the work. An FTE of less than 1.0 indicates that the work could be accomplished by one or more part-time employees or a full-time employee working less than the number of hours expected for the time period, such as 40 hours in one week. Planning allocation units using FTE values makes it easy to compare work requirements across time intervals with different durations (such as months) and manage multiple roles that may all have different calendar availabilities.
Add a Resource Planning Scenario
Create resource planning scenarios to determine the best group of projects to execute under resource constraints for a given planning period. One or more scenarios can be created to model the plan using different sets of criteria, enabling you to make more informed decisions.
To add a scenario:
1) In the object selector, select a portfolio.
2) In the sidebar, hover over Resources, and select Resource Planning.
3) In the context bar, select the planning period menu, and select the planning year, which is either the current year or the subsequent year.
4) Select Add Scenario.
5) In the Add Scenario dialog box, enter a name for the scenario, and select Save.
Tips
All new scenarios have a status of In Planning. The status cannot be changed manually.
Select Manage Scenarios to open the Manage Scenarios dialog box. Use the dialog box to add, rename, duplicate, hide, and delete budget and resource planning scenarios.
To delete a scenario, the scenario must have a status of In Planning.
Configure the Resource Planning Page
Configure the resource planning page to view information that is important to you while building the portfolio resource plan.
To configure the resource planning page:
1) In the object selector, select a portfolio.
2) In the sidebar, hover over Resources, and select Resource Planning.
3) Select an in-progress scenario.
Plan
67
4) In the Show list, display projects according to their state:
All Projects: All projects in the portfolio.
Included Projects: All projects with the Selected or Forced In state.
Not included Projects: All projects with the Unselected or Forced Out state.
5) Select Grid to display time-phased work units for the roles assigned to the projects in your portfolio.
Select Gantt to display a graphical representation of allocation and project dates across a timeline.
6) Select Refresh to run the portfolio filter to ensure all projects are included in the scenario. Refresh the filter on each scenario if you have multiple scenarios.
7) To configure the table:
Select Settings, select Columns, Filtering, Grouping, Timescale, Spreadsheet Rows, and Formatting options, and then select Apply.
Note: You can also change the timescale interval by right-clicking on the timescale in the table and selecting an option.
8) To view a specific date, in the Go to field, select a date.
9) In the Role Availability detail window, select Settings to configure additional role availability information.
On the Filtering tab, select Show roles only for projects present in the view to only display roles for projects that are visible in the current filter. Select Show demand only for roles present in the view to filter roles from the top table that do not meet the Role Availability detail window filter parameters.
On the Chart Settings tab, choose Allocation Cost, Demand Cost, or Committed Cost to view time-phased role costs in the Stacked Histogram. Choose Allocation, Demand, or Committed to view time-phased role availability in the Stacked Histogram.
Tips
Select Highlight Deficits to highlight allocation values in the table that exceed a role's availability for the time period. Select FTE to display role units in the full-time equivalent values of the timescale interval.
Hover over bars in the Gantt view to view date information about each project.
Select Projects for a Resource Planning Scenario
In the portfolio planning process, it may not be possible to execute all of the projects in your portfolio due to budgetary, resource, or other types of constraints. The Resource Planning page enables you to analyze all of the projects in your portfolio for role availability restrictions and select the best combination of projects to execute.

Portfolio Management User Guide
68
Before selecting projects, first ensure assigned roles are available to perform the work. Review the role work demands created by a resource planner, and resolve availability issues by allocating work units to individual roles. Adjust project and role allocation start dates to spread role requirements over a less demanding period of time. To further aid you in the selection process, you can view total and time-phased role costs for the demand, allocation, and committed units for each project. Include or exclude projects in the scenario to view the impact on role availability. Prioritize projects to ensure the most important ones are included in the plan.
You can use some or all of these methods to create the ideal resource planning scenario. Create multiple scenarios to simulate different allocations and different selections of projects. When finished, you can compare your scenarios and approve the best scenario for execution.
To select projects:
Allocate Role Units on the Resource Planning Page (on page 68)
Modify Allocation Dates on the Resource Planning Page (on page 69)
Monitor Role Costs on the Resource Planning Page (on page 70)
Prioritize Projects for Execution on the Resource Planning Page (on page 71)
Allocate Role Units on the Resource Planning Page
Before you approve a resource plan, ensure that work requirements for the projects you choose to execute will be fulfilled. While more detailed resource assignments take place during the project planning process, you can make high-level role allocations during the portfolio analysis phase. This ensures that there will be a sufficient number of resources to perform the work on your projects.
Use the Resource Planning page to review and allocate units against individual role demands created by a resource planner. The table contains all of the projects in your portfolio and their role assignments. View role allocation start and finish dates, and demand and allocation values. The Highlight Deficits feature highlights time periods where a role's allocation exceeds its availability. These are the time periods where work units must be reallocated. In the Role Availability detail window, highlighted Surplus/Deficit values measure the number of units by which a role is overallocated for a time period. To resolve allocation issues, enter units by time period for a role or by Total Allocation. Values entered in the Total Allocation field are spread along the timescale in accordance with the role's allocation dates, duration, and calendar.
While you are allocating work units to project roles, consult the Role Availability detail window for additional time-phased role information. Updates you make in the table are reflected in the spreadsheet and charts in the Role Availability detail window.
To allocate work units to roles:
1) In the object selector, select a portfolio.
2) In the sidebar, hover over Resources, and select Resource Planning.
3) Select an in-progress scenario.
4) In the table, expand a project, and then select a role.
5) To allocate units to roles, do one of the following:
In the Total Allocation field, enter the total number of work units to allocate to the role.
In the Allocation spreadsheet row, enter work units to allocate to the role for the time period.
Plan
69
Note: If the Total Allocation column or Allocation spreadsheet row are not displayed in the table, select Settings, and add them to the page.
6) In the Role Availability detail window, select one of the following:
Grid: Displays cumulative role data for all projects in the portfolio. For each role, view Max Capacity, Availability, Surplus/Deficit, and Committed values.
Surplus/Deficit Chart: Displays a color-coded graphical representation of Surplus/Deficit values for each role. Toggle individual roles to view fewer bars in the chart.
Stacked Histogram: Displays total selected role data by project. In the Group Bylist, select a field by which to group the data in the histogram. Select Legend to view grouping details.
Select Settings in the detail window to configure Grid columns, filter the number of roles visible in the detail window, and choose which cost or unit field to display in the Stacked Histogram.
7) Select Save.
Tips
Select Highlight Deficits to highlight allocation values in the table that exceed a role's availability for the time period. Select FTE to display role units in the full-time equivalent values of the timescale interval.
Select Show only Highlighted Roles in the Role Availability detail window to only display roles that are highlighted in the top table. Highlight a project row to display all roles in that project.
Hover over bars in the Role Availability detail window to view date and allocation or cost information about each project or role.
The Max Capacity line on the Stacked Histogram chart represents the maximum availability of the selected roles.
Modify Allocation Dates on the Resource Planning Page
Role allocation values are spread across a time period according to the role's allocation start and finish dates and allocation duration. These values roll up to the project summary level. Deficits occur when role allocation values exceed availability. You may be able to create additional role availability by adjusting the dates in which the role is scheduled to work. This may help to spread a role's allocation over a time period where there is less demand.
You can modify a role's allocation start date to shift the work period earlier or later. You can also modify a project's allocation start date to change the allocation start date of all roles assigned to that project. When updating a role's allocation start date, all existing allocations move along the timescale in accordance with the date. For example, if you move a role's allocation start date one week earlier, the role's existing allocations will also move earlier. However, if you enter allocation units in a time period earlier than the allocation start date, the allocation start date will update, but existing allocations will not move.
Use the Role Availability detail window on the Resource Planning page to monitor the effects of your modifications.
To modify allocation dates:

Portfolio Management User Guide
70
1) In the object selector, select a portfolio.
2) In the sidebar, hover over Resources, and select Resource Planning.
3) Select an in-progress scenario.
4) In the table, expand a project to view individual role data.
5) Select Gantt to display a graphical representation of allocation and project dates across a timeline.
Note: You can change the timescale interval by right-clicking on the timescale in the table and selecting an option.
6) To view a specific date, in the Go to field, select a date.
7) To edit role or project allocation dates:
Select a role or project. In the Allocation Start field, select a date for the allocation start.
8) Select Save.
Tips
Select Highlight Deficits to highlight allocation values in the table that exceed a role's availability for the time period. Select FTE to display role units in the full-time equivalent values of the timescale interval.
Hover over bars in the Gantt view to view date information about each project.
Select Show only Highlighted Roles in the Role Availability detail window to only display roles that are highlighted in the top table. Highlight a project row to display all roles in that project.
Monitor Role Costs on the Resource Planning Page
View role costs on the Resource Planning page to gain a better understanding of the labor costs associated with the projects in your portfolio. Role rates are defined for individual roles at the workspace level and can be set to change over time. During the resource planning process, monitor total and time-phased role costs for role demand, proposed allocation, actual allocation, and committed values. Role costs are calculated using the current role rate and time-phased labor units. Compare demand costs against allocated costs to view the impact specific roles will have on your projects. Modify role units to view the effects on the corresponding role cost field. Cost values are updated after saving your changes.
To monitor role costs:
1) In the object selector, select a portfolio.
2) In the sidebar, hover over Resources, and select Resource Planning.
3) Select a scenario.
4) Select Settings to add role cost columns and spreadsheet rows to the table.
5) Select Apply.
6) Use the added columns to view total role costs by project and by role. Use the added spreadsheet rows to view time-phased role costs by project and by role.
Note: Individual role rates may change over time. To ensure the current scenario is displaying the most up-to-date role costs, select Actions,
Plan
71
and then select Recalculate Role Cost. You can also recalculate role costs for multiple scenarios at a time in the Manage Scenarios dialog box.
7) In the Role Availability detail window, select Stacked Histogram to view role costs by project. To change the field displayed in the histogram, select Settings, and then select a field on the Chart Settings tab.
Prioritize Projects for Execution on the Resource Planning Page
During the resource planning process, allocating work units to project roles may not be able to resolve all availability constraints. Excluding lower priority projects from the scenario may help to create additional role availability for the higher priority projects in your portfolio.
Use the Resource Planning page to include and exclude projects from your scenario. View the effects on role availability in the table and in the charts and histograms in the Role Availability detail window. In the Stacked Histogram, colored segments in each bar represent the total allocation of a specific project. Bars that exceed the Max Capacity line in the histogram have exceeded the total role capacity for that time period. Exclude one or more projects or adjust role allocations to satisfy the capacity limit.
To prioritize projects for execution:
1) In the object selector, select a portfolio.
2) In the sidebar, hover over Resources, and select Resource Planning.
3) Select an in-progress scenario.
4) To include a project in a resource plan scenario, in the table, select the State field to display Selected or Forced In. To add multiple projects at once, use Ctrl + click to highlight each project. Select the Actions menu, select Include, and then select Highlighted Projects.
Note: If a project must be included in the resource plan, select Forced In. Conversely, if it has been determined that a project will not be included in the resource plan, select Forced Out.
5) In the Role Availability detail window, select Stacked Histogram to view the effects of including or excluding a project. To change the field displayed in the histogram, select Settings, and then select a field on the Chart Settings tab.
6) Select Save.
Tips
Select Highlight Deficits to highlight allocation values in the table that exceed a role's availability for the time period. Select FTE to display role units in the full-time equivalent values of the timescale interval.
Select Show only Highlighted Roles in the Role Availability detail window to only display roles that are highlighted in the top table. Highlight a project row to display all roles in that project.
The Max Capacity line on the Stacked Histogram chart represents the maximum availability of the selected roles.

Portfolio Management User Guide
72
Resource Scenario Optimization Overview
The Resource Scenario Optimization tool enables portfolio managers to make optimal project selections for their portfolios by analyzing role availability and role demand or role allocation. The tool simulates the selection of different combinations of projects and suggests the optimal set of projects for inclusion in a resource planning scenario to realize the maximum portfolio value.
During the optimization process, the tool maximizes a primary objective value based on the weekly availability and demand or allocation values of the roles in your portfolio. For example, you may want to maximize the Evaluation Score of your portfolio without overallocating your assigned roles. Optionally, you can maximize or minimize a secondary objective value to further refine your optimization results. For example, you might select a primary objective which maximizes the Evaluation Score of your portfolio and a secondary objective that minimizes the Planned Duration value. The tool also enables you to constrain your optimization calculations by selecting planning horizon start and finish dates. Optimization is only run on dates within the horizon.
Resource scenario optimization selects projects that maximize your portfolio value without overallocating your roles. You can also run optimization with a specified percentage of acceptable overallocation. When this value is set, the optimization tool runs additional calculations using weekly role availability values increased by the specified overallocation percentage. The tool determines if there is a project selection scenario that increases your portfolio value given an increase in role availability. The increased values are used during optimization calculations, but do not overwrite the current role availability values. The results of this process may help you decide whether to hire additional roles to realize an increased portfolio value.
The optimal project selection with 0% role overallocation is plotted as a point in a chart, enabling you to view the total demand or total allocation units and the objective values for the selection. If you run optimization with an allowable percentage of role overallocation, an additional point is also plotted in the chart. Use the chart to compare selection results and determine the additional demand or allocation units necessary to realize the increased portfolio value.

Plan
73
Working with the Resource Scenario Optimization Tool
Use the Optimization tool on the Resource Planning page to generate an optimal selection of projects under role availability constraints. Specify objective values, an amount of allowable overallocation, and a planning horizon period, and then run the optimization to view the optimal selection.
Table of Screen Highlights
Item Description
1
Options: Select a primary objective field whose value you want to maximize. Optionally, maximize or minimize a secondary objective field value to further refine optimization results. Specify % Overallocation Allowed to run optimization with increased role availability values. In the More Options dialog box, choose to run optimization against role demand or role allocation. Constrain calculations to a specific period of time by selecting planning horizon start and finish dates.
2 Selection Points: The Optimal Selection - 0% Overallocation point represents the optimal selection of projects that achieves your objectives without overallocating your roles. A second point is plotted if you input a value in the % Overallocation Allowed field. This point represents the optimal selection of projects if role availability values are increased by the given percentage. If you manually select any projects, a Current Selection point is plotted to represent the unit and objective values of the projects in the manual selection.

Portfolio Management User Guide
74
Item Description
3 Selection Details: Hover over the Optimal Selection - 0% Overallocationpoint in the chart to view the number of selected projects in the solution, the values of the chosen objective fields, and the total number of demand or allocation units in the selection. If an additional point was plotted for allowable overallocation, hover over the point to view the additional number of demand or allocation units necessary to achieve the increased objective values.
4 Selected Projects: After optimizing, the State field is highlighted green for projects that have been selected, red for projects that have been deselected, and not highlighted for projects whose state did not change.
5 Role Availability: Use the detail window to view cumulative role data for all projects in the portfolio, a surplus/deficit chart to measure over- and under-allocations, and a stacked histogram to view selected role data by project.
Use Optimization to Select Projects for a Resource Planning Scenario
Use the Optimization tool to simulate different project selection scenarios. Specify primary and secondary objective fields, an allowable percentage of role overallocation, and start and finish dates for the planning horizon. Run the analysis to generate the optimal selection of projects.
To select projects using resource scenario optimization:
1) In the object selector, select a portfolio.
2) In the sidebar, hover over Resources, and select Resource Planning.
3) Specify Optimization parameters.
a. In the Options section, configure the following fields:
Primary Objective: Select the objective field that you want to maximize.
(Optional) Secondary Objective: Select Maximize or Minimize, and then select a secondary objective field.
Note: If you do not want to include a secondary objective in the optimization, select --Select-- to disable the field.
(Optional) % Overallocation Allowed: Select as a percent value the acceptable amount of increase in each role's weekly availability. The increased values are used during optimization calculations, but do not overwrite the current role availability values.
Select More Options to modify optimization unit preferences and horizon dates:
Optimize Against: Choose to run the optimization process against assigned role Demand Units or Allocation Units.
Horizon Start: Select a start date for the time period in which optimization calculations will be run.
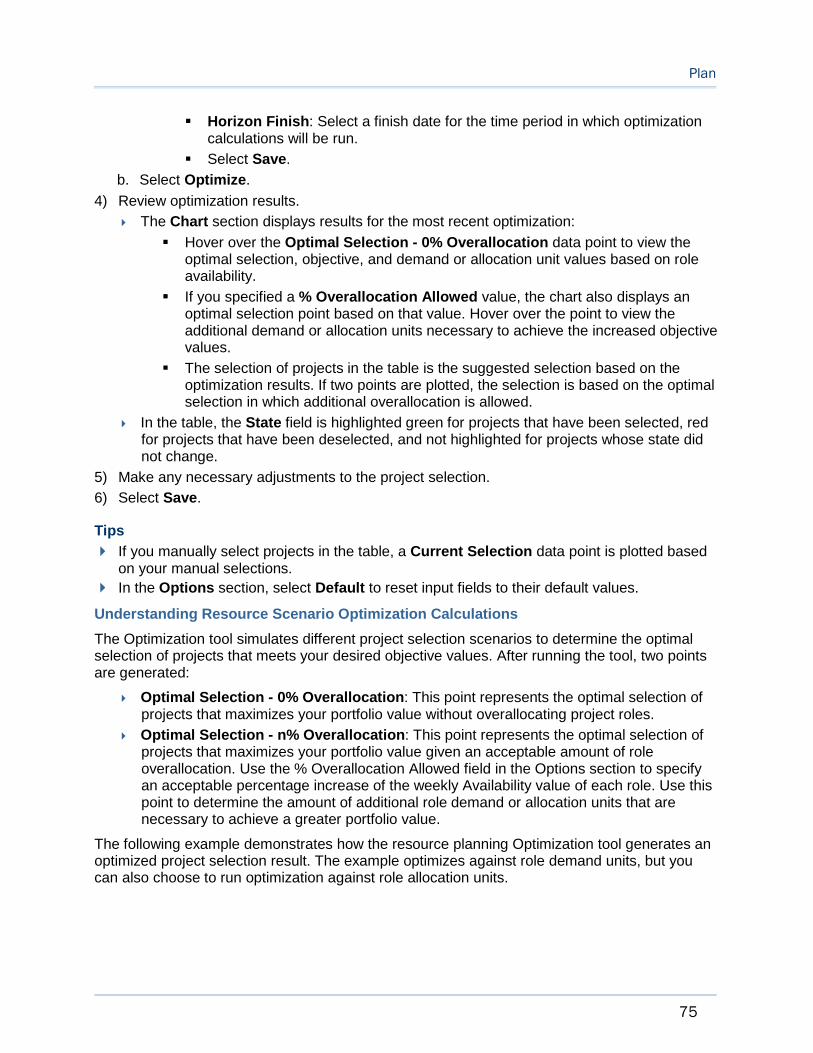
Plan
75
Horizon Finish: Select a finish date for the time period in which optimization calculations will be run.
Select Save.
b. Select Optimize.
4) Review optimization results.
The Chart section displays results for the most recent optimization:
Hover over the Optimal Selection - 0% Overallocation data point to view the optimal selection, objective, and demand or allocation unit values based on role availability.
If you specified a % Overallocation Allowed value, the chart also displays an optimal selection point based on that value. Hover over the point to view the additional demand or allocation units necessary to achieve the increased objective values.
The selection of projects in the table is the suggested selection based on the optimization results. If two points are plotted, the selection is based on the optimal selection in which additional overallocation is allowed.
In the table, the State field is highlighted green for projects that have been selected, red for projects that have been deselected, and not highlighted for projects whose state did not change.
5) Make any necessary adjustments to the project selection.
6) Select Save.
Tips
If you manually select projects in the table, a Current Selection data point is plotted based on your manual selections.
In the Options section, select Default to reset input fields to their default values.
Understanding Resource Scenario Optimization Calculations
The Optimization tool simulates different project selection scenarios to determine the optimal selection of projects that meets your desired objective values. After running the tool, two points are generated:
Optimal Selection - 0% Overallocation: This point represents the optimal selection of projects that maximizes your portfolio value without overallocating project roles.
Optimal Selection - n% Overallocation: This point represents the optimal selection of projects that maximizes your portfolio value given an acceptable amount of role overallocation. Use the % Overallocation Allowed field in the Options section to specify an acceptable percentage increase of the weekly Availability value of each role. Use this point to determine the amount of additional role demand or allocation units that are necessary to achieve a greater portfolio value.
The following example demonstrates how the resource planning Optimization tool generates an optimized project selection result. The example optimizes against role demand units, but you can also choose to run optimization against role allocation units.

Portfolio Management User Guide
76
In this example, a portfolio contains three projects, each with the same assigned roles. Each assigned role has a weekly role demand of 120h, 40h for each project. Weekly role availability values specify the total amount of work each role can perform without being overallocated. Each role has a weekly role availability of 80h. The objective of the optimization is to select projects that maximize total value without overallocating project roles.
May 1st May 8th May 15th May 22nd
Project A - Value: $100
Architect 40h 40h 40h 40h
Carpenter 40h 40h 40h 40h
Plumber 40h 40h 40h 40h
Project B - Value: $50
Architect 40h 40h 40h 40h
Carpenter 40h 40h 40h 40h
Plumber 40h 40h 40h 40h
Project C - Value: $75
Architect 40h 40h 40h 40h
Carpenter 40h 40h 40h 40h
Plumber 40h 40h 40h 40h
Role Availability
Architect 80h 80h 80h 80h
Carpenter 80h 80h 80h 80h
Plumber 80h 80h 80h 80h
Scenario 1: 0% Allocation Allowed
Given the total availability of the roles assigned to the projects, an optimal selection scenario with 0% overallocation is as follows:
Project A
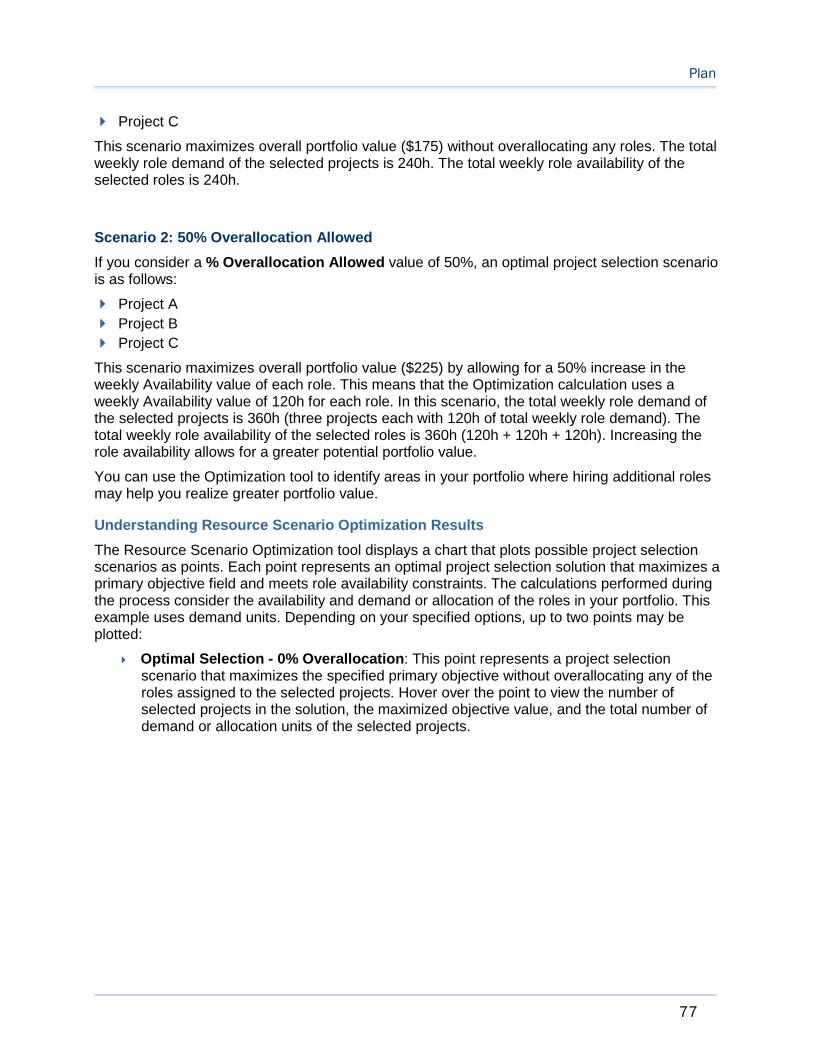
Plan
77
Project C
This scenario maximizes overall portfolio value ($175) without overallocating any roles. The total weekly role demand of the selected projects is 240h. The total weekly role availability of the selected roles is 240h.
Scenario 2: 50% Overallocation Allowed
If you consider a % Overallocation Allowed value of 50%, an optimal project selection scenario is as follows:
Project A
Project B
Project C
This scenario maximizes overall portfolio value ($225) by allowing for a 50% increase in the weekly Availability value of each role. This means that the Optimization calculation uses a weekly Availability value of 120h for each role. In this scenario, the total weekly role demand of the selected projects is 360h (three projects each with 120h of total weekly role demand). The total weekly role availability of the selected roles is 360h (120h + 120h + 120h). Increasing the role availability allows for a greater potential portfolio value.
You can use the Optimization tool to identify areas in your portfolio where hiring additional roles may help you realize greater portfolio value.
Understanding Resource Scenario Optimization Results
The Resource Scenario Optimization tool displays a chart that plots possible project selection scenarios as points. Each point represents an optimal project selection solution that maximizes a primary objective field and meets role availability constraints. The calculations performed during the process consider the availability and demand or allocation of the roles in your portfolio. This example uses demand units. Depending on your specified options, up to two points may be plotted:
Optimal Selection - 0% Overallocation: This point represents a project selection scenario that maximizes the specified primary objective without overallocating any of the roles assigned to the selected projects. Hover over the point to view the number of selected projects in the solution, the maximized objective value, and the total number of demand or allocation units of the selected projects.

Portfolio Management User Guide
78
Optimal Selection - n% Overallocation: This point represents an optimal project selection scenario given an acceptable amount of role allocation. The % Overallocation Allowed field in the Options section specifies the allowable percentage increase of the weekly Availability value of each role. Use this point to determine the amount of additional role demand or allocation units necessary to achieve a greater portfolio value.
Figure 1: Displays the difference in projects selected, and objective and unit values between an optimal selection with 0% overallocation allowed and an optimal selection with n% overallocation allowed.
Resource Planning Field Definitions
Date
Allocation Finish
The end date for the role allocation.
Allocation Start
The start date for the role allocation.
Actual Finish
The Actual Finish displays the date on which a project is considered complete.
This value can be entered manually or can be imported.
Actual Start
The Actual Start indicates the date work on the project began.
This value can be entered manually or can be imported.
Plan
79
Actuals Effective Date
The month in which an actuals value was last added to the project.
Committed Finish
The end date for the commitment.
Committed Start
The start date for the commitment.
Role Demand Finish
The finish date for the demand.
Calculated as Start plus Total Demand.
Role Demand Start
The start date for the demand.
Forecast Finish
The planned finish date of a project's remaining Forecast cost.
Forecast Start
The planned start date of a project's remaining Forecast cost.
Project Finish
The date on which all project work is complete.
This value can be entered manually or can be imported.
Project Planned Finish
The finish date for the time phased Planned Budget of the project.
Planned Budget cost spread will adjust when this date is changed.
Project Planned Start
The start date for the time phased Planned Budget of the project.
Planned Budget cost spread will adjust when this date is changed.
The Project Planned Start also represents the earliest date that activities can occur within a project schedule.
Project Start
The date on which work on the project starts.
This value can be entered manually or can be imported.
Durations
Allocation Duration
The total duration of the role allocation.
Actual Duration

Portfolio Management User Guide
80
The Actual Duration represents the total working time between the project Actual Start and Actual Finish for a project.
This value can be imported. The Actual Duration field is not editable.
Committed Duration
The total duration of the commitment.
Role Demand Duration
The total expected duration of the demand.
Planned Duration
The duration between Project Planned Start and Project Planned Finish.
This value can be entered manually or can be imported.
Remaining Duration
The duration between the Project Start and Project Finish.
This value can be entered manually or can be imported.
Variance - Finish Date
The duration between the project's finish date and default snapshot.
When the field value is generated through a P6 EPPM connection, then it represents the duration between the finish date in the current project and the baseline finish date.
This value can only be imported.
Variance - Start Date
The duration between the project's start date and default snapshot.
When the field value is generated through a P6 EPPM connection, then it represents the duration between the start date in the current project and the baseline start date.
This value can only be imported.
General
FTE - Allocation
The total allocated FTE for a single role.
Calculated as Total Allocation divided by Allocation Duration.
FTE - Committed
The total committed FTE for a single role.
Calculated as Total Committed divided by Role Committed Duration.
FTE - Role Demand
The total demand FTE. Calculated as total demand units divided by total demand duration.
Percentages
Evaluation Score
Plan
81
The quantitative score of a project based on the qualitative ranking of projects against different evaluation categories. This value is used by portfolio managers to prioritize projects.
Percent Complete
The estimated percentage of work that has been completed on the project.
Units
Past Committed
The total units previously committed to a role.
Allocation Units
The total units allocated to a single role.
Committed Units
The total units committed to a single role.
Role Demand
The sum of the demand units entered for a single role.
Total Variance
The difference between the Total Allocation and the Total Demand.
Undistributed Allocation
The total allocated units which are not distributed into any time intervals.
Spreadsheet Rows
Role Allocation Units
The allocation units entered for a single role.
Role Allocation FTE
The allocation FTE entered for a single role.
Role Committed Units
The committed units entered for a single role.
Role Committed FTE
The committed FTE entered for a single role.
Demand
The demand units entered for a single role.
Demand (FTE)
The demand FTE entered for a single role.
Variance (Allocation - Demand)
The difference between the Allocation units and the Demand units for a single role.
Variance (Allocation - Demand) (FTE)
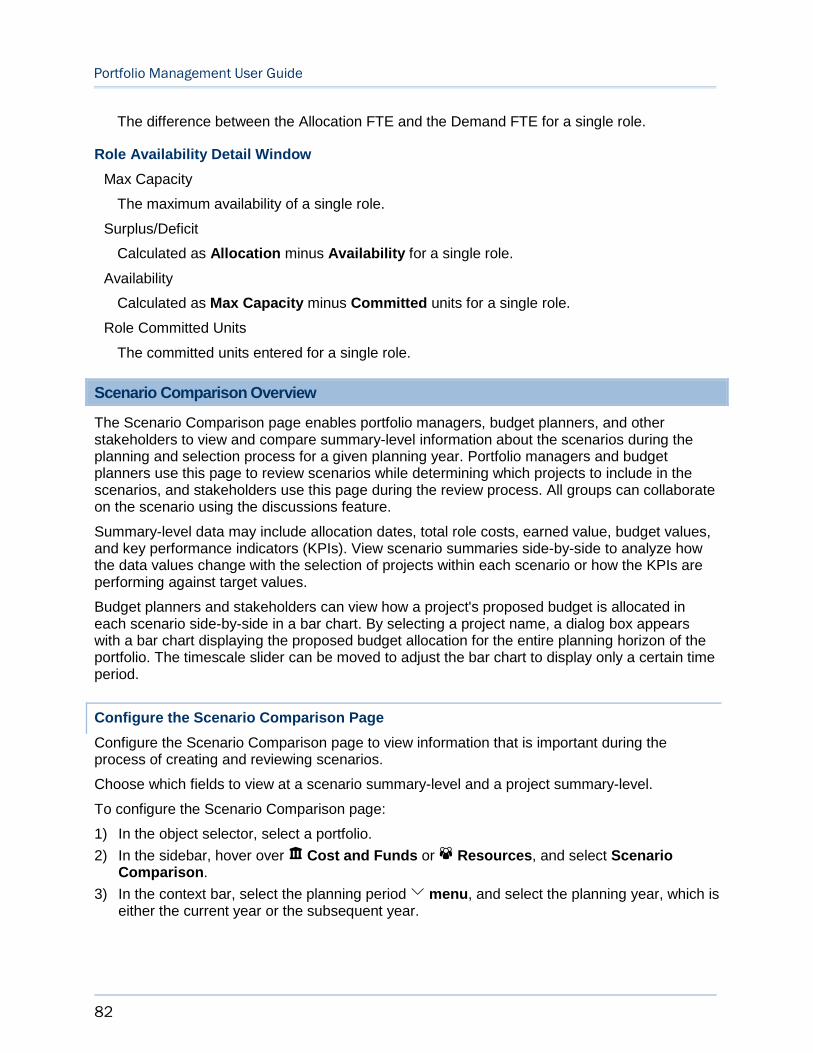
Portfolio Management User Guide
82
The difference between the Allocation FTE and the Demand FTE for a single role.
Role Availability Detail Window
Max Capacity
The maximum availability of a single role.
Surplus/Deficit
Calculated as Allocation minus Availability for a single role.
Availability
Calculated as Max Capacity minus Committed units for a single role.
Role Committed Units
The committed units entered for a single role.
Scenario Comparison Overview
The Scenario Comparison page enables portfolio managers, budget planners, and other stakeholders to view and compare summary-level information about the scenarios during the planning and selection process for a given planning year. Portfolio managers and budget planners use this page to review scenarios while determining which projects to include in the scenarios, and stakeholders use this page during the review process. All groups can collaborate on the scenario using the discussions feature.
Summary-level data may include allocation dates, total role costs, earned value, budget values, and key performance indicators (KPIs). View scenario summaries side-by-side to analyze how the data values change with the selection of projects within each scenario or how the KPIs are performing against target values.
Budget planners and stakeholders can view how a project's proposed budget is allocated in each scenario side-by-side in a bar chart. By selecting a project name, a dialog box appears with a bar chart displaying the proposed budget allocation for the entire planning horizon of the portfolio. The timescale slider can be moved to adjust the bar chart to display only a certain time period.
Configure the Scenario Comparison Page
Configure the Scenario Comparison page to view information that is important during the process of creating and reviewing scenarios.
Choose which fields to view at a scenario summary-level and a project summary-level.
To configure the Scenario Comparison page:
1) In the object selector, select a portfolio.
2) In the sidebar, hover over Cost and Funds or Resources, and select Scenario Comparison.
3) In the context bar, select the planning period menu, and select the planning year, which is either the current year or the subsequent year.

Plan
83
4) To configure the view at the scenario summary-level (top of page):
a. In the Show list, select one of the following:
All: Displays all scenarios in the portfolio that are not hidden.
Budget Scenarios: Displays all budget scenarios in the portfolio that are not hidden.
Resource Scenarios: Displays all resource scenarios in the portfolio that are not hidden.
b. Select the Status list and select to view scenarios of a particular status. For example, you can view all scenarios that are Under Review.
c. Select the check box next to the scenario name to view the projects included in each scenario at the project summary-level. Hover over a scenario icon to view the scenario type.
d. Select Settings to configure the fields that display.
In the Settings panel, select the fields you want to view, and select Apply.
5) To configure the view at the project summary-level (bottom of page):
a. Select Show and select to filter the projects that display.
b. Select Settings to configure the fields that display.
In the Settings panel, select the fields you want to view, and select Apply.
Note: These configuration steps do not apply to the project dialog box that appears when you select a project name. The project dialog box displays the fields configured at the scenario summary-level at the top of the page.
Compare Scenarios
Compare scenarios to view summary-level information about the scenarios and their projects during the selection analysis process.
To compare scenarios:
1) In the object selector, select a portfolio.
2) In the sidebar, hover over Cost and Funds or Resources, and select Scenario Comparison.
3) In the context bar, select the planning period menu, and select the planning year, which is either the current year or the subsequent year.
4) Review the data shown for each scenario.
5) Select the check box next to the scenario name to view the projects included in each scenario at the project summary-level.
6) To review project summary-level information per scenario, select a project name.
7) In the project dialog box:
a. Review the data available in the scenario summary for each project.
b. View the Proposed Budget Allocation Per Scenario chart. To view a specific time period, slide the handles on timescale.

Portfolio Management User Guide
84
c. Select Close.
Budget Plan Approval Process Overview
After one or more portfolio budget plan scenarios have been created by the budget planner, the planner typically sends one or more unapproved plan scenarios out for review to stakeholders, sends proposed project allocations to project managers for budget negotiations, and then sends the final plan scenario out for approval. There are default workflows built into the application to accommodate these processes. If your organization created custom workflows to follow your required business practices, then the process described here might be different for you.
Scenarios can be sent for review and approval by the budget planner from either the Budget Planning page or from the Published Views page. There are four options for reviewing or approving a scenario. Send for Review, Propose, and Send for Approval are optional steps.
Send for Review: The scenario is sent to users assigned the Reviewer role at the portfolio level. These users are typically a committee of people from different departments in the organization that review proposed scenarios before approval, referred to as stakeholders. The reviewers receive notifications about one or more scenarios that include a link to the Scenario Comparison page. On the Scenario Comparison page, reviewers can analyze the data, compare scenarios, and give feedback to the budget planner per scenario using the Discussions panel for each scenario.
Propose: The scenario is sent to users assigned the Owner role (typically project managers) for each project listed in the budget plan. This action is typically done when the budget planner has completed the what-if and scenario planning, has had a stakeholder review that resulted in narrowing down to one scenario to be proposed, and is ready to negotiate with the project owner the project dates and proposed budget allocation. The project owners receive notifications about the scenario that include a link to the Cash Flow page. On the Cash Flow page, the project owners can review the dates and proposed budget allocations from the budget planner and have the option to accept the budget or request changes.
Send for Approval: The scenario is sent to users assigned the Approver role at the portfolio level. The approvers receive notification about the scenario that includes a link to the scenario on the Budget Planning page. On the Budget Planning page, the approver can review the data in the scenario and provide any final comments and notify the budget planner of approval of the scenario by entering comments in the Discussion panel for the scenario.
Approve: After final comments have been received from the reviewers, the budget planner can mark this plan as approved. If the scenario does not require an approval process, the budget planner can select to approve the scenario without having it routed to anyone.
When a budget plan scenario is approved, the proposed budgets become the approved budget values for each project, and the approved scenario becomes the budget plan for the planning period.
Send a Portfolio Budget Plan Scenario for Review
Budget plan scenarios are sent to stakeholders for review after the budget planner has selected projects and proposed budget and dates for the projects in one or more scenarios.
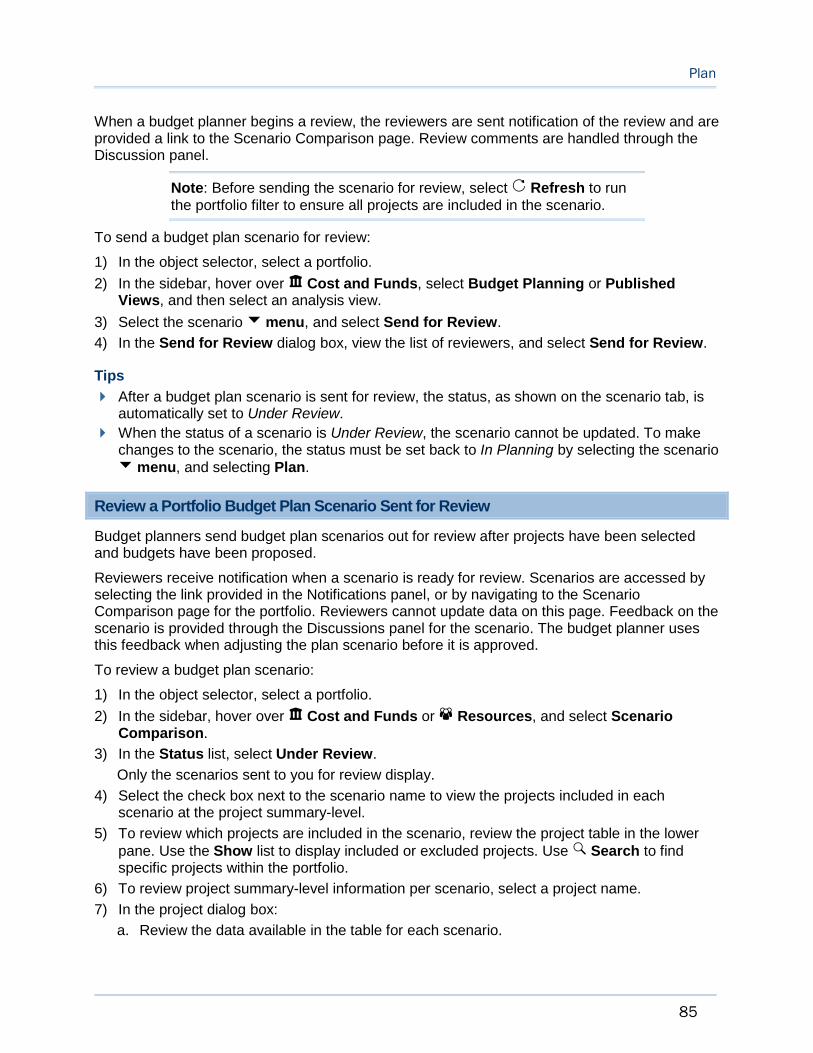
Plan
85
When a budget planner begins a review, the reviewers are sent notification of the review and are provided a link to the Scenario Comparison page. Review comments are handled through the Discussion panel.
Note: Before sending the scenario for review, select Refresh to run the portfolio filter to ensure all projects are included in the scenario.
To send a budget plan scenario for review:
1) In the object selector, select a portfolio.
2) In the sidebar, hover over Cost and Funds, select Budget Planning or Published Views, and then select an analysis view.
3) Select the scenario menu, and select Send for Review.
4) In the Send for Review dialog box, view the list of reviewers, and select Send for Review.
Tips
After a budget plan scenario is sent for review, the status, as shown on the scenario tab, is automatically set to Under Review.
When the status of a scenario is Under Review, the scenario cannot be updated. To make changes to the scenario, the status must be set back to In Planning by selecting the scenario menu, and selecting Plan.
Review a Portfolio Budget Plan Scenario Sent for Review
Budget planners send budget plan scenarios out for review after projects have been selected and budgets have been proposed.
Reviewers receive notification when a scenario is ready for review. Scenarios are accessed by selecting the link provided in the Notifications panel, or by navigating to the Scenario Comparison page for the portfolio. Reviewers cannot update data on this page. Feedback on the scenario is provided through the Discussions panel for the scenario. The budget planner uses this feedback when adjusting the plan scenario before it is approved.
To review a budget plan scenario:
1) In the object selector, select a portfolio.
2) In the sidebar, hover over Cost and Funds or Resources, and select Scenario Comparison.
3) In the Status list, select Under Review.
Only the scenarios sent to you for review display.
4) Select the check box next to the scenario name to view the projects included in each scenario at the project summary-level.
5) To review which projects are included in the scenario, review the project table in the lower pane. Use the Show list to display included or excluded projects. Use Search to find specific projects within the portfolio.
6) To review project summary-level information per scenario, select a project name.
7) In the project dialog box:
a. Review the data available in the table for each scenario.
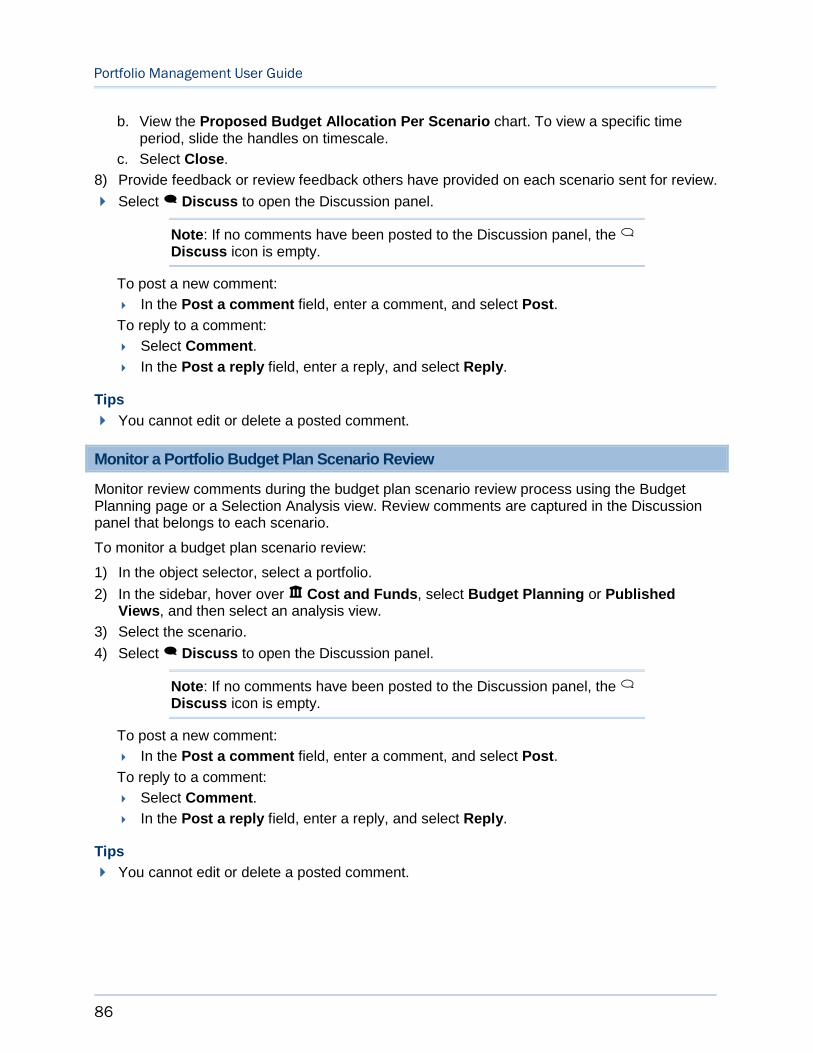
Portfolio Management User Guide
86
b. View the Proposed Budget Allocation Per Scenario chart. To view a specific time period, slide the handles on timescale.
c. Select Close.
8) Provide feedback or review feedback others have provided on each scenario sent for review.
Select Discuss to open the Discussion panel.
Note: If no comments have been posted to the Discussion panel, the Discuss icon is empty.
To post a new comment:
In the Post a comment field, enter a comment, and select Post.
To reply to a comment:
Select Comment.
In the Post a reply field, enter a reply, and select Reply.
Tips
You cannot edit or delete a posted comment.
Monitor a Portfolio Budget Plan Scenario Review
Monitor review comments during the budget plan scenario review process using the Budget Planning page or a Selection Analysis view. Review comments are captured in the Discussion panel that belongs to each scenario.
To monitor a budget plan scenario review:
1) In the object selector, select a portfolio.
2) In the sidebar, hover over Cost and Funds, select Budget Planning or Published Views, and then select an analysis view.
3) Select the scenario.
4) Select Discuss to open the Discussion panel.
Note: If no comments have been posted to the Discussion panel, the Discuss icon is empty.
To post a new comment:
In the Post a comment field, enter a comment, and select Post.
To reply to a comment:
Select Comment.
In the Post a reply field, enter a reply, and select Reply.
Tips
You cannot edit or delete a posted comment.
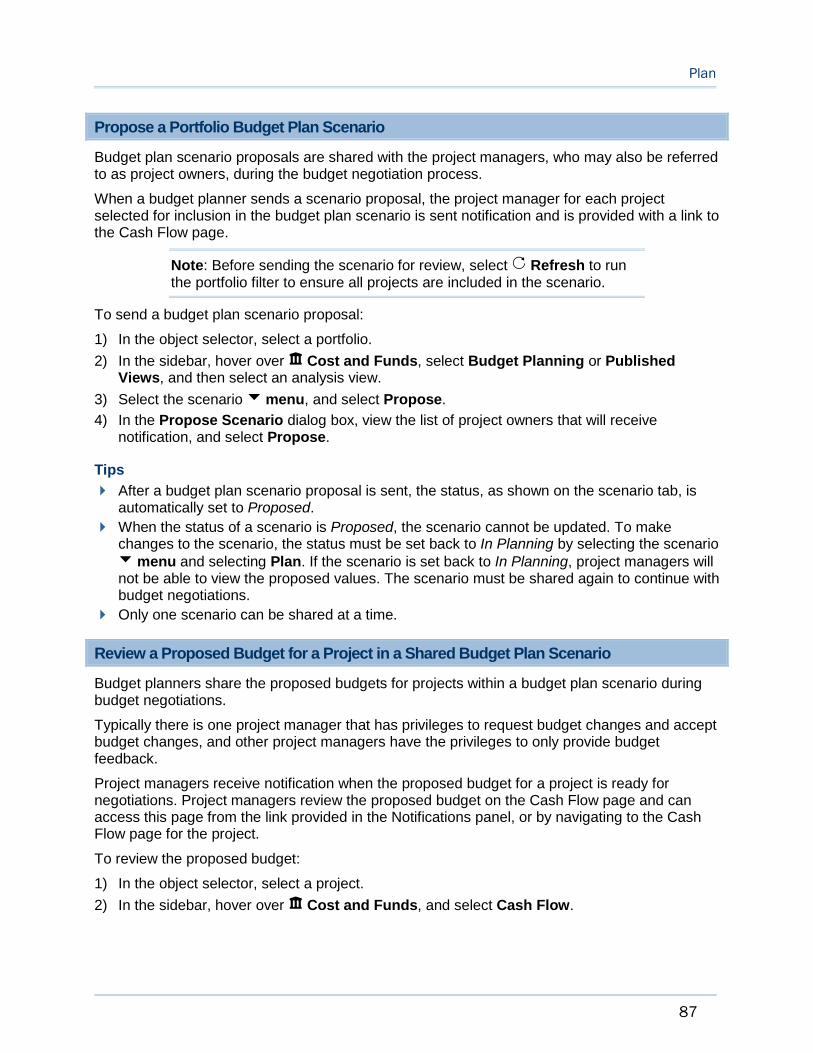
Plan
87
Propose a Portfolio Budget Plan Scenario
Budget plan scenario proposals are shared with the project managers, who may also be referred to as project owners, during the budget negotiation process.
When a budget planner sends a scenario proposal, the project manager for each project selected for inclusion in the budget plan scenario is sent notification and is provided with a link to the Cash Flow page.
Note: Before sending the scenario for review, select Refresh to run the portfolio filter to ensure all projects are included in the scenario.
To send a budget plan scenario proposal:
1) In the object selector, select a portfolio.
2) In the sidebar, hover over Cost and Funds, select Budget Planning or Published Views, and then select an analysis view.
3) Select the scenario menu, and select Propose.
4) In the Propose Scenario dialog box, view the list of project owners that will receive notification, and select Propose.
Tips
After a budget plan scenario proposal is sent, the status, as shown on the scenario tab, is automatically set to Proposed.
When the status of a scenario is Proposed, the scenario cannot be updated. To make changes to the scenario, the status must be set back to In Planning by selecting the scenario menu and selecting Plan. If the scenario is set back to In Planning, project managers will not be able to view the proposed values. The scenario must be shared again to continue with budget negotiations.
Only one scenario can be shared at a time.
Review a Proposed Budget for a Project in a Shared Budget Plan Scenario
Budget planners share the proposed budgets for projects within a budget plan scenario during budget negotiations.
Typically there is one project manager that has privileges to request budget changes and accept budget changes, and other project managers have the privileges to only provide budget feedback.
Project managers receive notification when the proposed budget for a project is ready for negotiations. Project managers review the proposed budget on the Cash Flow page and can access this page from the link provided in the Notifications panel, or by navigating to the Cash Flow page for the project.
To review the proposed budget:
1) In the object selector, select a project.
2) In the sidebar, hover over Cost and Funds, and select Cash Flow.

Portfolio Management User Guide
88
3) On the Cash Flow page, review the Proposed Budget row, and compare it against the Planned Budget or Forecast rows.
Note: If the budget for the project has been approved and is being revised, you can also review against the approved values in the Approved Budget row.
4) Review feedback others have provided or add your own feedback.
Select Discuss to open the Discussion panel.
Note: If no comments have been posted to the Discussion panel, the Discuss icon is empty.
To post a new comment:
In the Post a comment field, enter a comment, and select Post.
To reply to a comment:
Select Comment.
In the Post a reply field, enter a reply, and select Reply.
1) To indicate you have changes:
a. Select Request Changes.
b. In the Request Changes dialog box, enter change request details.
c. Select Save.
Note: The message is posted to the Discussion panel for the project on the Cash Flow page and for the project in the shared scenario on the Budget Planning page.
2) To accept the budget:
a. Select Accept Budget.
b. In the Accept Budget dialog box, optionally enter comments.
c. Select Save.
Note: The message is posted to the Discussion panel for the project on the Cash Flow page and for the project in the shared scenario on the Budget Planning page.
Tips
You cannot edit or delete a posted comment.
Monitor Budget Negotiations for a Proposed Budget Plan Scenario
Monitor the status of the budget negotiations with the project managers for each project in the budget plan scenario using the Budget Planning page. Comments are captured in the Discussion dialog box and change requests and approvals are indicated in the Budget Review Status column as well as in the Discussion dialog box for each project.

Plan
89
To monitor a budget plan scenario review:
1) In the object selector, select a portfolio.
2) In the sidebar, hover over Cost and Funds, select Budget Planning or Published Views, and then select an analysis view.
3) Select the shared scenario.
4) In the Show list, select Included Projects.
5) View the Budget Review Status column to review the status of the budget negotiations for each project. The values are Pending, Changes Requested, or Accepted.
Note: If the Budget Review Status column is not displayed, modify your columns using the Settings dialog box.
6) Select Discuss Budget for the project to open the Discussion panel for the project.
Tips
When the status of a scenario is Proposed, the scenario cannot be updated. To make changes to the scenario, the status must be set back to In Planning by selecting the scenario menu and selecting Plan. If the scenario is set back to In Planning, project managers will not be able to view the proposed values. The scenario proposal must be shared again to continue with budget negotiations.
Send a Portfolio Budget Plan Scenario for Approval
A budget plan scenario can be approved by the budget planner or by the designated reviewer, depending on your organizational practices.
When a planner sends the chosen scenario for approval, the designated approver is sent notification and is provided with a link to the Budget Planning page.
Note: Before sending the scenario for review, select Refresh to run the portfolio filter to ensure all projects are included in the scenario.
To send a budget plan for approval:
1) In the object selector, select a portfolio.
2) In the sidebar, hover over Cost and Funds, select Budget Planning or Published Views, and then select an analysis view.
3) Select the scenario menu, and select Send for Approval.
4) In the Send for Approval dialog box, view the name of the user assigned the approver role on the budget plan who will receive notification, and select Send for Approval.
Tips
After a budget plan scenario is sent for approval, the status, as shown on the scenario tab, is automatically set to Under Approval.
When the status of a scenario is Under Approval, the scenario cannot be updated. To make changes to the scenario, the status must be set back to In Planning by selecting the scenario menu and selecting Plan.
Portfolio Management User Guide
90
Approve a Portfolio Budget Plan Scenario
A budget plan scenario can be sent for approval or approved by the budget planner without being sent for approval.
To approve a budget plan scenario:
1) In the object selector, select a portfolio.
2) In the sidebar, hover over Cost and Funds, select Budget Planning or Published Views, and then select an analysis view.
3) Select the scenario for approval.
4) Select the scenario menu, and select Approve.
Tips
When the status of a scenario is Approved, the scenario becomes the approved budget plan and cannot be updated.
Scenarios that were not selected as the final plan, will remain in the Budget Planning page and the Published Views page. If you do not need to refer back to these plans, you can delete the scenarios or hide them. To delete the scenarios, select the scenario menu, and select Delete. To hide the scenarios, select Manage Scenarios and select Hidden for each scenario you do not want to view.
The discussions for the approved budget plan are stored in the discussions for the plan.
Update an Approved Portfolio Budget Plan
When it is determined that an approved portfolio budget plan must be revised, a new scenario can be created by duplicating the approved plan. The new scenario can then be sent through the same review, propose, and approval processes as needed. The approved plan will remain in the Approved state until the new scenario has been approved.
To update an approved budget plan:
1) In the object selector, select a portfolio.
2) In the sidebar, hover over Cost and Funds, select Budget Planning or Published Views, and then select an analysis view.
3) Select the approved scenario menu, and select Duplicate.
4) In the Duplicate Scenario dialog box, enter a name for the updated plan, and select Save.
5) Update the scenario.
6) Send the scenario through the Review, Propose, or Approval processes, if required.
Tips
When the status of the new scenario is set to Approved, the original approved budget plan is set to Retired.
An approved budget plan can also be updated by selecting Revise Budget Plan from the Scorecard or Spending pages.
Plan
91
Portfolio Budget Plan Scenario Status Reference
The status that displays for each scenario is automatically assigned during difference phases of the selection process.
In Planning: Default for all new scenarios.
Under Review: Set when the scenario is sent for review.
Proposed: Set when the scenario proposal is shared.
Under Approval: Set when the scenario is sent for approval.
Approved: Set when the scenario is approved. An approved scenario becomes the approved portfolio budget plan.
Retired: Only set when a scenario was approved in the past and another scenario is approved after it.
Resource Plan Approval Process Overview
After one or more portfolio resource plan scenarios have been created by the portfolio manager, the manager typically sends one or more unapproved plan scenarios out for review to stakeholders, sends proposed role allocations to project managers for negotiations, and then sends the final plan scenario out for approval. Before the process begins, you should assign users to the various approval process roles.
Scenarios can be sent for review and approval by the portfolio manager from the Resource Planning page. There are four options for reviewing or approving a scenario. Send for Review, Propose, and Send for Approval are optional steps.
Send for Review: The scenario is sent to users assigned the Reviewer role at the portfolio level. These users are typically a committee of people from different departments in the organization that review proposed scenarios before approval, referred to as stakeholders. The reviewers receive notifications about one or more scenarios that include a link to the Scenario Comparison page. On the Scenario Comparison page, reviewers can analyze the data, compare scenarios, and give feedback to the portfolio manager per scenario using the Discussions panel for each scenario.
Propose: The scenario is sent to users assigned the Owner role (typically project managers) for each project listed in the resource plan. This action is typically done when the portfolio manager has completed the what-if and scenario planning, has had a stakeholder review that resulted in narrowing down to one scenario to be proposed, and is ready to negotiate with the project owner the project dates and proposed role allocation. The project owners receive notifications about the scenario that include a link to the Resource Demand page. On the Resource Demand page, the project owners can review the dates and proposed role allocations from the portfolio manager and have the option to accept the allocations or request changes.
Send for Approval: The scenario is sent to users assigned the Approver role at the portfolio level. The approvers receive notification about the scenario that includes a link to the scenario on the Resource Planning page. On the Resource Planning page, the approver can review the data in the scenario and provide any final comments and notify the portfolio manager of approval of the scenario by entering comments in the Discussion panel for the scenario.
Portfolio Management User Guide
92
Approve: After final comments have been received from the reviewers, the portfolio manager can mark this plan as approved. If the scenario does not require an approval process, the portfolio manager can select to approve the scenario without having it routed to anyone.
When a resource plan scenario is approved, the proposed role allocations become the approved role allocation values for each project, and the approved scenario becomes the resource plan for the planning period.
Send a Resource Plan Scenario for Review
Resource plan scenarios are sent to stakeholders for review after the portfolio manager has selected projects and allocated role units for the projects in the scenario. The portfolio manager can send multiple scenarios for review.
When a portfolio manager begins a review, the reviewers are sent notification of the review and are provided a link to the Scenario Comparison page. Review comments are handled through the Discussion panel.
Note: Before sending the scenario for review, select Refresh to run the portfolio filter to ensure all projects are included in the scenario.
You must have the appropriate security privileges to send a resource plan scenario for review.
To send a resource plan scenario for review:
1) In the object selector, select a portfolio.
2) In the sidebar, hover over Resources, and select Resource Planning.
3) On the Resource Planning page, select the scenario menu, and select Send for Review.
4) In the Send for Review dialog box, view the list of reviewers, and select Send for Review.
Tips
After a resource plan scenario is sent for review, the status, as shown on the scenario tab, is automatically set to Under Review.
When the status of a scenario is Under Review, the scenario cannot be updated. To make changes to the scenario, the status must be set back to In Planning by selecting the scenario menu, and selecting Plan.
Review a Resource Plan Scenario Sent for Review
Portfolio managers send resource plan scenarios out for review after projects have been selected and role allocations have been proposed.
Reviewers receive notification when a scenario is ready for review. Scenarios are accessed by selecting the link provided in the Notifications panel or by navigating to the Scenario Comparison page for the portfolio. Reviewers cannot update data on this page. Feedback on the scenario is provided through the Discussions panel for the scenario. The portfolio manager uses this feedback when adjusting the plan scenario before it is approved.
Plan
93
To review a resource plan scenario:
1) In the object selector, select a portfolio.
2) In the sidebar, hover over Cost and Funds or Resources, and select Scenario Comparison.
3) In the Status list, select Under Review.
Only the scenarios sent to you for review display.
4) To add summary-level scenario columns to the table, select Settings.
5) Select the check box next to the scenario name to view the projects included in each scenario at the project summary-level.
6) To review which projects are included in the scenario, review the project table in the lower pane. Use the Show list to display included or excluded projects. Use Search to find specific projects within the portfolio.
7) Select Settings in the lower pane to add summary-level project columns.
8) Provide feedback or review feedback others have provided on each scenario sent for review.
Select Discuss to open the Discussion panel.
Note: If no comments have been posted to the Discussion panel, the Discuss icon is empty.
To post a new comment:
In the Post a comment field, enter a comment, and select Post.
To reply to a comment:
Select Comment.
In the Post a reply field, enter a reply, and select Reply.
Tips
You cannot edit or delete a posted comment.
Monitor a Resource Plan Scenario Review
Monitor review comments during the resource plan scenario review process using the Resource Planning page. Review comments are captured in the Discussion panel that belongs to each scenario.
To monitor a resource plan scenario review:
1) In the object selector, select a portfolio.
2) In the sidebar, hover over Resources, and select Resource Planning.
3) On the Resource Planning page, select the scenario.
4) Select Discuss to open the Discussion panel.
Note: If no comments have been posted to the Discussion panel, the Discuss icon is empty.
To post a new comment:

Portfolio Management User Guide
94
In the Post a comment field, enter a comment, and select Post.
To reply to a comment:
Select Comment.
In the Post a reply field, enter a reply, and select Reply.
Tips
You cannot edit or delete a posted comment.
Propose a Resource Plan Scenario
Resource plan scenario proposals are shared with the project managers, who may also be referred to as project owners, during the role allocation negotiation process. The proposal enables portfolio managers to gain input from the project owners before a final scenario approval. The project owners can accept the proposed allocations or request changes.
When a portfolio manager sends a scenario proposal, the project manager for each project included in the resource plan scenario is sent a notification and is provided with a link to the Resource Demand page.
Note: Before sending the scenario for review, select Refresh to run the portfolio filter to ensure all projects are included in the scenario.
You must have the appropriate security privileges to send a resource plan scenario proposal.
To send a resource plan scenario proposal:
1) In the object selector, select a portfolio.
2) In the sidebar, hover over Resources, and select Resource Planning.
3) On the Resource Planning page, select the scenario menu, and select Propose.
4) In the Propose Scenario dialog box, view the list of project owners that will receive notification, and select Propose.
Tips
After a resource plan scenario proposal is sent, the status, as shown on the scenario tab, is set to Pending Proposal. After the Propose Scenario process completes and the page is reloaded, the scenario is set to Proposed.
When the status of a scenario is Proposed, the scenario cannot be updated. To make changes to the scenario, the status must be set back to In Planning by selecting the scenario menu and selecting Plan. If the scenario is set back to In Planning, project managers will not be able to view the proposed values. The scenario must be shared again to continue with negotiations.
Only one scenario can be shared at a time.
Review a Proposed Resource Plan Scenario
Portfolio managers can share proposed role allocations for projects within a resource plan scenario during the planning process.
Plan
95
Typically there is one project manager that has privileges to request allocation changes and accept allocation changes, and other project managers have the privileges to only provide feedback.
Project managers receive a notification when the proposed role allocations for a project are ready for negotiations. Project managers review the proposed allocations on the Resource Demand page and can access this page from the link provided in the Notification panel, or by navigating to the Resource Demand page for the project.
You must have the appropriate security privileges to accept allocations or request changes.
To review the proposed role allocation:
1) In the object selector, select a project.
2) In the sidebar, hover over Resources, and select Resource Demand.
3) On the Resource Demand page, review the Proposed Allocation row, and compare it against the Demand row.
Note: If the resource plan for the project has been approved and is being revised, you can also review against the approved allocations in the Allocation row.
4) Review feedback others have provided or add your own feedback.
Select Discuss to open the Discussion panel.
Note: If no comments have been posted to the Discussion panel, the Discuss icon is empty.
To post a new comment:
In the Post a comment field, enter a comment, and select Post.
To reply to a comment:
Select Comment.
In the Post a reply field, enter a reply, and select Reply.
1) To indicate you have changes:
a. Select Request Changes.
b. In the Request Changes dialog box, enter change request details.
c. Select Save.
Note: The message is posted to the Discussion panel for the project on the Resource Demand page and for the project in the shared scenario on the Resource Planning page.
2) To accept the allocations:
a. Select Accept Proposed Allocations.
b. In the Accept Proposed Allocations dialog box, optionally enter comments.
c. Select Save.

Portfolio Management User Guide
96
Note: The message is posted to the Discussion panel for the project on the Resource Demand page and for the project in the shared scenario on the Resource Planning page.
Tips
You cannot edit or delete a posted comment.
Enable Demand Cost, Commitment Cost, and Proposed Allocation Cost spreadsheet rows to review role costs for the corresponding role units.
Monitor Resource Plan Negotiations for a Proposed Resource Plan Scenario
Monitor the status of the resource plan negotiations with the project managers for each project in the proposed resource plan scenario using the Resource Planning page. Comments are captured in the Discussion dialog box and change requests and approvals are indicated in the Resource Review Status column as well as in the Discussion dialog box for each project.
To monitor resource plan scenario proposals:
1) In the object selector, select a portfolio.
2) In the sidebar, hover over Resources, and select Resource Planning.
3) On the Resource Planning page, select the proposed scenario.
4) In the Show list, select Included Projects.
5) View the Resource Review Status column to review the status of the role allocation negotiations for each project. The values are Pending, Changes Requested, or Accepted.
Note: If the Resource Review Status column is not displayed, modify your columns using the Settings dialog box.
6) Select Discuss for the project to open the Discussion panel for the project.
Tips
When the status of a scenario is Proposed, the scenario cannot be updated. To make changes to the scenario, the status must be set back to In Planning by selecting the scenario menu and selecting Plan. If the scenario is set back to In Planning, project managers will not be able to view the proposed values. The scenario proposal must be shared again to continue with resource plan negotiations.
Send a Resource Plan Scenario for Approval
After a resource plan scenario is reviewed and its proposal of role allocation values is accepted by the project managers of the projects in the scenario, it can then be sent for approval.
When a portfolio manager sends the chosen scenario for approval, the designated approvers are sent a notification and are provided with a link to the Resource Planning page.

Plan
97
Note: Before sending the scenario for review, select Refresh to run the portfolio filter to ensure all projects are included in the scenario.
You must have the appropriate security privileges to send a resource plan scenario for approval.
To send a resource plan for approval:
1) In the object selector, select a portfolio.
2) In the sidebar, hover over Resources, and select Resource Planning.
3) On the Resource Planning page, select the scenario menu, and select Send for Approval.
4) In the Send for Approval dialog box, view the names of the users assigned the approver role on the portfolio who will receive notification, and select Send for Approval.
Tips
After a resource plan scenario is sent for approval, the status, as shown on the scenario tab, is automatically set to Under Approval.
When the status of a scenario is Under Approval, the scenario cannot be updated. To make changes to the scenario, the status must be set back to In Planning by selecting the scenario menu and selecting Plan.
Only one scenario can be shared at a time.
Approve a Resource Plan Scenario
When it is determined that the best possible scenario has been created and the correct group of projects has been selected for execution, then the scenario can be approved. When a resource scenario is approved, the proposed allocation units for the roles in each selected project become the committed unit values for the planning period. Committed units are visible on the Resource Demand page.
You must have the appropriate security privileges to approve a resource plan scenario.
To approve a resource plan scenario:
1) In the object selector, select a portfolio.
2) In the sidebar, hover over Resources, and select Resource Planning.
3) Select the scenario for approval.
4) Select the scenario menu, and select Approve.
Tips
When the status of a scenario is Approved, the scenario becomes the approved resource plan and cannot be updated.
After a scenario is approved, any existing committed units are overwritten with the approved units.
Scenarios that were not selected as the final plan will remain on the Resource Planningpage. If you do not need to refer back to these plans, you can delete the scenarios or hide them. To delete the scenarios, select the scenario menu, and select Delete. To hide the scenarios, select Hide for each scenario you do not want to view.
Portfolio Management User Guide
98
The discussions for the approved resource plan are stored in the discussions for the plan.
Update an Approved Resource Plan
When it is determined that an approved portfolio resource plan must be revised, an identical scenario can be created by duplicating the approved plan. The new scenario can then be updated as needed. The approved plan will remain in the Approved state until the new scenario has been approved.
To update an approved resource plan:
1) In the object selector, select a portfolio.
2) In the sidebar, hover over Resources, and select Resource Planning.
3) On the Resource Planning page, select the approved scenario menu, and select Duplicate.
4) In the Duplicate Scenario dialog box, enter a name for the updated plan, and select Save.
5) Update the scenario.
Tips
When the status of the new scenario is set to Approved, the original approved resource plan is set to Retired.
An approved resource plan can also be updated by selecting Revise Resource Plan from the Scorecard page.
Resource Plan Scenario Status Reference
The status that displays for each scenario is automatically assigned during difference phases of the selection process.
In Planning: Default for all new scenarios.
Under Review: Set when the scenario is sent for review.
Pending Proposal: Set when the Propose Scenario process is run.
Proposed: Set when the Propose Scenario process completes and the proposal is shared.
Under Approval: Set when the scenario is sent for approval.
Pending Approval: Set when the Approve Scenario process is run.
Approved: Set when the Approve Scenario process completes and the scenario is approved. An approved scenario becomes the approved portfolio resource plan.
Retired: Only set when a scenario was approved in the past and another scenario is approved after it.
Monitor
Monitor a Project
When a project is in execution, the project manager can update project data, take snapshots of project data, and review how the project is progressing by viewing cost curves and variances.
Monitor
99
To monitor a project:
Update and Review Project Data (on page 99) Create a Snapshot of Project Data (on page 100) View a Dashboard (on page 100)
Update and Review Project Data
Project costs, dates, and other financial data can be updated manually or brought in if connected with P6 EPPM using Primavera Gateway. Typically, the Actuals and Forecast fields are updated, but this all depends on the requirements of the organization.
If the source of the Total Cost for the Planned Budget or Forecast values are the Project Current Budget or a configured project field and have been updated, an indicator appears on the page in the Total Cost field.
If costs are updated through a connection with P6 EPPM, discuss the frequency of the updates with your administrator.
To update or review project data:
1) In the object selector, select a project.
2) In the sidebar, hover over Cost and Funds, and select Cash Flow.
3) If the cost sheet is the source for Planned Budget or Forecast Actuals values and the Score is out of sync indicator displays in the Total Cost field, perform the following steps:
a. Select Refresh to pull in the updated Total Cost values.
b. Update distributed values. Review the Undistributed field to determine the amount that has increased or decreased and reallocate the amounts in the appropriate time periods.
4) To display curves or variances, select Settings.
a. In the Settings dialog box, select the curves or variances to review.
b. Select Save.
5) To update a curve with values from another curve, select Copy and one of the following options:
Planned Budget to Forecast: This is typically done after budget negotiations have completed or the when a project has been re-estimated and the project manager wants to use the Planned Budget as a basis.
At Completion to Forecast: This option copies the At Completion values from the schedule in P6 EPPM to the Forecast curve in the application, enabling project managers to review up-to-date information. This option is only available if the application is connected with P6 EPPM.
Actual Cost from P6 to Actuals: This option copies the Actual Cost values from the schedule in P6 EPPM to the Actuals curve in the application, enabling project managers to adjust the values based on other incoming actuals that are not related to the schedule costs. This option is only available if the application is connected with P6 EPPM.
6) To update or view additional project data, select the Financial Fields detail window.
7) Select Save.

Portfolio Management User Guide
100
Create a Snapshot of Project Data
Capture project data at specific points in time to record the history of projects, enabling you to review how projects are progressing over time.
To create a snapshot:
1) In the object selector, select a project.
2) In the sidebar, hover over Cost and Funds, and select Cash Flow.
3) On the Cash Flow page, select Save Snapshot.
4) On the Save Snapshot dialog box, enter a name for the snapshot, and select Save.
View a Dashboard
View dashboards for a visual representation of workspace, project, and portfolio data.
To view a dashboard:
1) In the object selector, select a workspace, project, or portfolio.
2) In the sidebar, hover over Dashboards, and select Dashboard List.
3) On the Dashboard List page, select a dashboard tab to view that dashboard.
Working with Cost Curves
Cost curves present budget, forecast, and actuals data in a time-phased format, enabling project managers and budget planners to view and plan costs per time period. The various curves are viewable and editable from different pages within the application. The following is a summary of where these curves are used.
Budget Curves
Target Budget
The target budget for the entire planning horizon for the budget plan. This value can be adjusted per budget plan scenario.
Editable: Budget Planning, Published Views
Viewable: Budget Planning, Published Views
Planned Budget
The planned or estimated cost of a project for the life of the project.
Editable: Cash Flow. This value can be entered manually, replaced with the Project Current Budget or a project cost field from the Cost Sheet, or brought in through a connection with P6 EPPM.
Viewable: Cash Flow, Budget Planning, Published Views, Spending, Scorecard
Proposed Budget

Monitor
101
The proposed budget allocation for a project or a budget plan scenario spanning the portfolio's planning horizon, entered by the budget planner. The proposed budget allocation for a project is the budget value that the project manager and budget planner negotiate on. The Proposed Budget is a standard curve on the Cash Flow page at the budget plan level, but not at the project level.
Editable: Budget Planning, Published Views
Viewable: Cash Flow
Approved Budget
The multi-year approved budget assigned to the project or budget plan scenario by the budget planner for the current planning year. The Proposed Budget becomes the Approved Budget after a budget plan scenario is approved.
Editable: This value can only be populated through the approval of a new proposed budget.
Viewable: Cash Flow, Budget Planning, Published Views, Spending, Scorecard
Forecast Curves
Forecast
The remaining or forecast cost of the project. Forecast typically equals the Planned Budget before a project begins.
After a project begins, the Forecast is updated periodically throughout the life of the project, as the remaining cost estimates change and money is spent on the project.
This is a time-phased Forecast for the life of the project, which could span multiple years.
Editable: Cash Flow. This value can be entered manually, replaced with project cost field from the Cost Sheet, or brought in through a connection with P6 EPPM.
Viewable: Cash Flow, Budget Planning, Published Views, Spending, Scorecard
At Completion
The At Completion Total Cost from a cost-loaded P6 EPPM schedule.
This cost curve will only appear if the application is connected with P6 EPPM. This value can be copied into the Forecast curve by the project manager on the Cash Flow page.
Editable: Cannot be edited.
Viewable: Cash Flow
Actuals Curves
Actuals
The actual costs incurred for the project (such as invoices, payments, and accruals).
Editable: Cash Flow, Cost Sheet. This value can be entered manually on the Cash Flow page, replaced with Project Current Actuals value or project cost field from the Cost Sheet, or brought in through a connection with P6 EPPM. When connected with P6 EPPM, the Actuals from P6 EPPM are always brought into the Actual Cost from P6 curve, and then can either be copied in, or set as the source of the Actuals curve.
Viewable: Cash Flow, Cost Sheet, Budget Planning, Published Views, Spending, Scorecard
Actual Cost from P6
Portfolio Management User Guide
102
The actual total cost from a cost-loaded P6 EPPM schedule.
This cost curve will only appear if the application is connected with P6 EPPM. This value can be copied into the Actuals curve by the project manager, or set as the source of the Actuals curve on the Cash Flow page.
Editable: Cannot be edited.
Viewable: Cash Flow
Monitor a Portfolio
Monitor portfolios using Scorecards and Dashboards. Scorecards are available at the workspace-level and the portfolio-level. Dashboards are available at the portfolio-level.
Monitor a Summary Portfolio Scorecard (on page 110)
Monitor a Portfolio Scorecard (on page 111)
View a Dashboard (on page 100)
For Portfolios that have approved budget plans, see Monitor an Approved Portfolio Budget Plan (on page 113).
Measures Overview
Performance for portfolios and strategies is captured using measures. Measures are defined to monitor data such as number of projects on time and return on investment.
Measures have two dimensions: actual and target. These values can be calculated using a formula, or they can be set for manual entry. The target value can also be used when setting thresholds for the measure. Thresholds and indicators are defined to visually represent the status of a measure when monitoring a portfolio or strategy.
Measures are defined at the workspace level and can be associated to any portfolio or strategy node. Measures are created using aggregates of project attributes or by using existing measures. Measures using other measures can reference specific portfolios and strategy nodes. Project attributes and existing measures cannot be used in the same expression for a measure.
Portfolios are monitored using measures on the portfolios Scorecard page, the workspace Summary Scorecard page in the Portfolio Analysis app, and in Dashboards. Strategies are monitored on the workspace Summary Scorecard page in the Strategic Alignment app.
You can also create project measures to monitor activity attributes in a project. Project measures are configured in the Project Defaults & Options settings.
Create a Measure
Create measures to provide data that can be used for monitoring the health and status of portfolios or strategies.
To create a measure:
1) Add a Measure (on page 103)
2) Set a Threshold for a Measure (on page 104)
3) Associate a Measure with a Portfolio (on page 105)

Monitor
103
For more details, see:
Working with Creating Measures (on page 106)
Add a Measure
Add a measure to quantitatively monitor the health and status of portfolios and to monitor the performance of strategy nodes.
The target and actual values used for measures can be configured for manual entry or using a formula. Formulas are defined by creating expressions using project attributes or using existing measures.
For information on creating advanced formulas for measures, refer to the Prime Expression Language Guide.
To add a measure:
1) In the object selector, select a workspace.
2) In the sidebar, select Summary & Settings.
3) On the Summary & Settings menu, select Dictionaries, and then select Measures.
4) In the table, select Add.
Note: Select Context next to an existing measure, and then select Duplicate to duplicate the measure. Duplicated measures do not maintain the portfolio or strategy associations of the original measure.
5) In the table, complete the following fields as required:
Name: The name of the measure.
(Optional) Description: Details about the measure.
Data Type: The type of data that the formula generates. Options include Cost, Number, and Percentage.
Target Type: Determines whether the Target value of the measure is manually entered or calculated using a formula.
Actual Type: Determines whether the Actual value of the measure is manually entered or calculated using a formula.
Measure Based: Determines whether the measure is created using existing measures. Either Target Type or Actual Type must be set to Formula.
Tracking Frequency: Determines how frequently you want to monitor the measure. For example, if a formula-based measure's tracking frequency is set to Weekly, it is computed every week. If it is a manual measure with Weekly tracking frequency, you can enter measure values in weekly buckets.
6) Select the Data Source detail window to configure formulas if either Target Type, Actual Type, or both are set to Formula.
Note: The Data Source detail window does not display if Formula was not selected for either Target or Actual Type.
7) Select the field to enter a formula.
Actual: Formula that calculates the current values for the measure.

Portfolio Management User Guide
104
Target: Formula that calculates a value that can be used when setting thresholds to measure against.
Base Expression: The base expression for the Actual or Target formulas when Percentage is the selected Data Type.
8) Enter a formula manually or using a formula template.
a. To enter a formula manually:
1. Select the Field list to locate the field to use in the calculation. Select Insert Field.
2. Select the mathematical symbols for the expression.
3. Add any additional fields for mathematical symbols needed for the expression.
b. To use a formula template:
1. In the Aggregation Type list, select the calculation needed for the formula, and select Insert. The formula template appears.
2. To use the template, highlight or delete Field or Filter, including angle brackets, select a field from the Field list, and select Insert Field. Repeat for any additional fields or fields to filter by.
3. Add any additional mathematical symbols needed for the expression.
9) To insert measure based measures:
a. Select the Field list. All the measure based measures display in this list when the Measure Based option is selected.
b. Select one of the following:
A measure based measure. This inserts the formula for the measure based measure.
Referenced Measures. This opens a dialog box to select measures that are currently assigned to portfolios or strategies. Select the Portfolios or Strategiestab, select the measure based measure, and select Insert.
10) Select Validate Formula.
11) Select Save.
This setting is used in the following apps:
Dashboards
Portfolio Analysis
Strategic Alignment
Set a Threshold for a Measure
Set thresholds for measures to see the status of measures using visual indicators when monitoring portfolios and strategies.
To set a threshold:
1) In the object selector, select a workspace.
2) In the sidebar, select Summary & Settings.
3) On the Summary & Settings menu, select Dictionaries, and then select Measures.
4) In the table, select the measure.
5) Select the Thresholds detail window.
Monitor
105
6) Select Add.
7) In the Operator field, select a parameter to use in the threshold calculation.
8) In the Value field, enter a threshold value to use in the calculation.
9) In the High Value field, enter the top of the range when the operator is set to Within Range or Not Within Range.
10) In the Indicator Color field, select a color to visually represent status when the threshold is met.
11) In the Indicator Icon field, select an icon to visually represent status when the threshold is met.
12) In the Goal list, select whether a high or low value indicates a positive change in the measure.
For example, High Values would be selected when measuring Net Savings to represent that an increase in value is a positive change.
13) In the Threshold Computation Method, select how thresholds are calculated using Actual and Target values.
Actual Value: The current value. This is the value as calculated by the expression for Actual on the Data Source tab.
Percent of Target: The percentage of the actual value compared to the target value.
14) Add as many thresholds as necessary for the measure.
15) Select Save.
This setting is used in the following apps:
Dashboards
Portfolio Analysis
Strategic Alignment
Associate a Measure with a Portfolio
Associate measures with portfolios to perform quantitative analysis on project data.
To associate a measure with a portfolio:
1) In the object selector, select a workspace.
2) In the sidebar, select Summary & Settings.
3) On the Summary & Settings menu, select Dictionaries, and then select Measures.
4) In the table, select the measure.
5) Select the Portfolios detail window.
6) Select Link.
7) In the Link Portfolios dialog box, select the portfolios, and select Link.
8) Select Save.
9) In the Summary & Settings panel, select Close.
You can also perform this task from the Portfolios inventory panel:
1) In the object selector, select Portfolios, and then select View All Portfolios.
2) In the table, select the portfolio, and select the Measures detail window.

Portfolio Management User Guide
106
This setting is used in the following apps:
Portfolio Analysis
Strategic Alignment
Working with Creating Measures
Measures are configured data used to monitor the health and status of a portfolio and to measure strategy performance. Measures can be created using aggregates of project attributes, by using existing measures, or set for manual entry. Project attributes and existing measures cannot be used in the same expression for a measure.
Measures have two dimensions: actual and target. A target value can optionally be defined to use when setting thresholds for the measure. Thresholds and indicators are defined to visually represent the status of a measure when monitoring a portfolio on the Scorecard page or on a configured dashboard.
For information on creating advanced formulas for measures, refer to the Prime Expression Language Guide.
Table of Screen Highlights
Item Description
1 Aggregation Type: Provides a template for formulas that use Sum, Min, Max, Count, and Average equations. Select the Aggregation Type, and select Insert.
For example, the Sum template displays the following:
sum(< Field >,< Filter >)
Replace <Field> with the name of the field to be summed. Optionally, replace <Filter> with a field that will filter the results by. Add any additional filter requirements using the mathematical symbols provided.

Monitor
107
Item Description
2 Field: Provides all the fields that can be used in formulas.
If Measure Based is selected, only existing measures display. Select Referenced Measures in the Field list to view measures that are currently assigned to Portfolios or Strategies.
Select a field name, and select Insert Field. The proper formatting for the field displays.
3 Mathematical Symbols: Used when defining formulas manually or when using the aggregation type template.
4 Validate Formula: Verifies the formula works.
The following table provides examples of formulas that can be created. Total Cost is represented in the preceding image.
Table of Measure Examples
Measure Name
Data Type
Target Actual Base Expression (Actual)
Total Cost Cost sum(object.Project_currentApprovedBudgetBase)
sum(object.Project_atCompletionCost, object.Project_status=='Active')
Projects on Time
Percentage
count(object.ProjectCode_Code, object.Project_scheduleVariance<10)
count(object.ProjectCode_Code)
Cost/ROI Ratio
Number
object.'PortfolioMeasure_Total Cost'/object.'PortfolioMeasure_Return on Investment'
Note: This expression is Measure Based.
Project Count
Number
count(object.ProjectCode_Code,object.Project_status=='Active')
Return on Investment
Number
average(object.Project_returnInvestment)
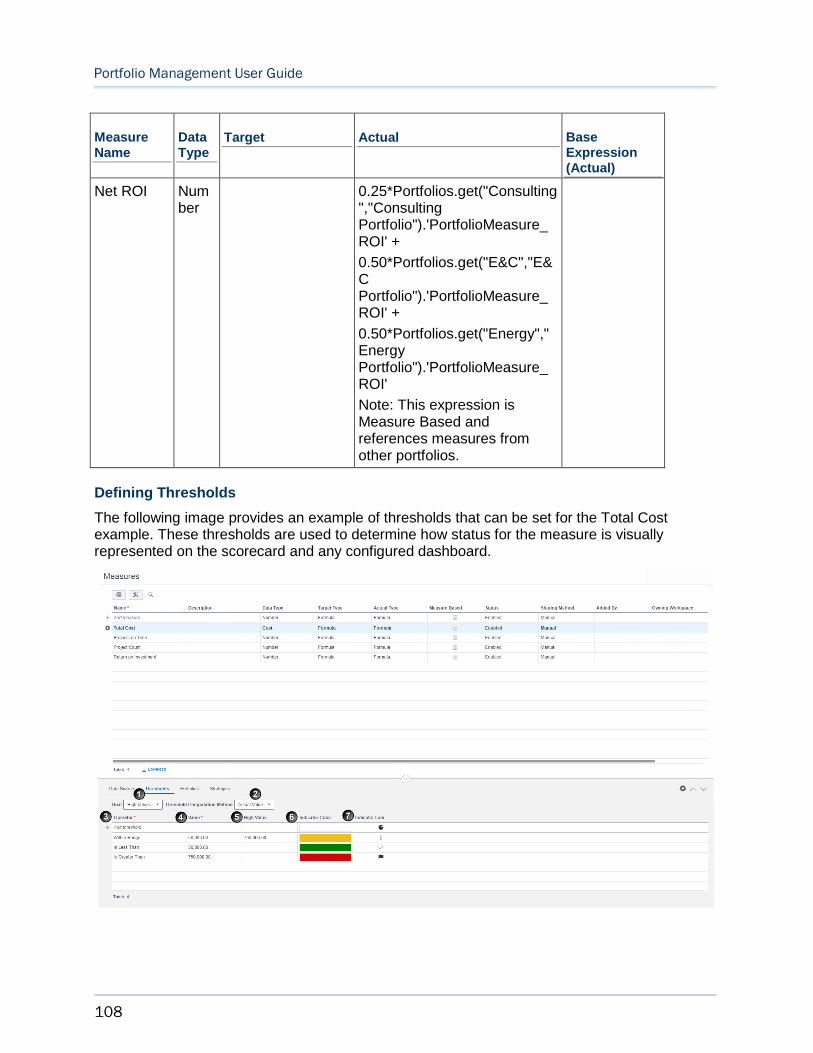
Portfolio Management User Guide
108
Measure Name
Data Type
Target Actual Base Expression (Actual)
Net ROI Number
0.25*Portfolios.get("Consulting","Consulting Portfolio").'PortfolioMeasure_ROI' +
0.50*Portfolios.get("E&C","E&C Portfolio").'PortfolioMeasure_ROI' +
0.50*Portfolios.get("Energy","Energy Portfolio").'PortfolioMeasure_ROI'
Note: This expression is Measure Based and references measures from other portfolios.
Defining Thresholds
The following image provides an example of thresholds that can be set for the Total Cost example. These thresholds are used to determine how status for the measure is visually represented on the scorecard and any configured dashboard.
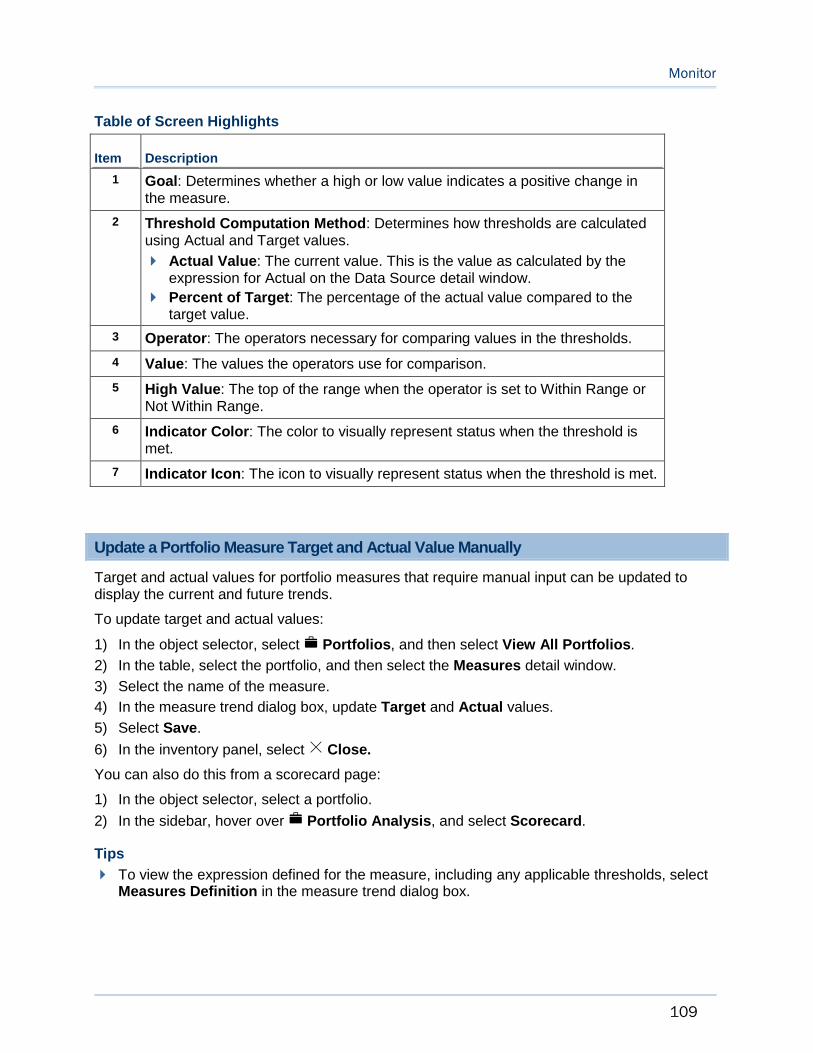
Monitor
109
Table of Screen Highlights
Item Description
1 Goal: Determines whether a high or low value indicates a positive change in the measure.
2 Threshold Computation Method: Determines how thresholds are calculated using Actual and Target values.
Actual Value: The current value. This is the value as calculated by the expression for Actual on the Data Source detail window.
Percent of Target: The percentage of the actual value compared to the target value.
3 Operator: The operators necessary for comparing values in the thresholds.
4 Value: The values the operators use for comparison.
5 High Value: The top of the range when the operator is set to Within Range or Not Within Range.
6 Indicator Color: The color to visually represent status when the threshold is met.
7 Indicator Icon: The icon to visually represent status when the threshold is met.
Update a Portfolio Measure Target and Actual Value Manually
Target and actual values for portfolio measures that require manual input can be updated to display the current and future trends.
To update target and actual values:
1) In the object selector, select Portfolios, and then select View All Portfolios.
2) In the table, select the portfolio, and then select the Measures detail window.
3) Select the name of the measure.
4) In the measure trend dialog box, update Target and Actual values.
5) Select Save.
6) In the inventory panel, select Close.
You can also do this from a scorecard page:
1) In the object selector, select a portfolio.
2) In the sidebar, hover over Portfolio Analysis, and select Scorecard.
Tips
To view the expression defined for the measure, including any applicable thresholds, select Measures Definition in the measure trend dialog box.
Portfolio Management User Guide
110
Monitor a Summary Portfolio Scorecard
Monitor the health and status of all portfolios you have access to in a workspace using the Summary Scorecard page. You can customize the view of this page to display the information about your portfolios that is most important to your organization.
Note: Not all measures are applicable to every portfolio. The measure must be assigned to the portfolio to view the data.
To review a summary portfolio scorecard:
1) In the object selector, select a workspace.
2) In the sidebar, hover over Portfolio Analysis, and select Summary Scorecard.
3) To review more in-depth detail about the portfolio and its projects or portfolios, select the portfolio name to open the scorecard for that portfolio.
Tips
Measure values are calculated at the end of every period for formula-based measures. Different measures can have different tracking frequencies, and the end of the period is determined by the tracking frequency. For example, a measure with Weekly tracking frequency would have the values computed for it every Sunday at 11:59 p.m.
To ensure the most up-to-date data displays, select Recalculate Measures. After you receive notification that the job is complete, refresh the browser page to see updated values.
To modify the view, in the View list, select Manage Views. You can create views at the workspace or personal level.
Scorecard Page Overview
The Scorecard page enables portfolio managers and budget planners to monitor the performance of a portfolio. Portfolios that have an approved budget plan are monitored here to determine which projects are influencing the performance of the plan.
Note: The approved budget plan data represents the latest approved budget plan. The latest approved plan could be from the current planning period or any of the past periods. For example, if you plan every 3 years and you had done planning for the 2016 planning period and approved it, in 2018, you would continue to see the budget plan data corresponding to 2016 budget as that is the currently approved plan. If a scenario is approved for 2018, you would start seeing data for 2018.
Use the Scorecard page to display measures for monitoring the portfolio.
In addition to the data this page displays for portfolios, the view displays approved budget plan and project performance data (key performance indicators), including visual indicators, based on thresholds defined for the budget plan.
An additional three levels of data are displayed on the scorecard when there is an approved budget plan.
Portfolio Statistics: Summarized key performance indicators.

Monitor
111
Project Summary: Summarized values of the projects in the approved budget plan.
Project: Metric values of the project.
As part of the monitoring process, budget planners can collaborate on the plan with use of Discussions, perform revisions on the plan if issues arise, and maintain versions of the approved plan by creating snapshots.
Monitor a Portfolio Scorecard
Monitor the health and status of a portfolio and its projects and portfolios using the Scorecard page. You can customize this page to view the measures defined by your organization that are important to review while monitoring the portfolio. If an approved portfolio budget plan is available, configured thresholds also display on this page.
If projects and portfolios are included in the portfolio, you can change the view to show the list of each. You can also customize the Projects and Portfolios tables to view data that provides insight into the status of the projects and portfolios within the portfolio.
To review a portfolio scorecard:
1) In the object selector, select a portfolio.
2) In the sidebar, hover over Portfolio Analysis, and select Scorecard.
3) To display measures:
a. Select Settings.
b. In the Manage Views panel, select the Measures tab.
c. Select the measures to display.
4) To display sparklines:
a. Select the Sparklines tab.
Show Sparklines: Select to display sparklines in the measure tiles.
Periods to Show: Enter the number of periods to display in the past.
Highlight High and Low points: Select to visually indicate this highest and lowest points on the sparkline.
5) Select Save.
6) In the Manage Views panel, select Close.
7) To display additional fields on the Projects or Portfolios table:
a. Select Projects or Portfolios.
b. Select Settings.
c. In the Settings panel, select the columns to view in the table, and select Apply.
8) On the Projects tab, in the Show list, select one of the following:
All: Displays all projects in the portfolio.
Review: Displays all projects with a selected flag in the Review column.
Budget Approved: Displays all projects in the approved budget scenario.
Resource Approved: Displays all projects in the approved resource scenario.

Portfolio Management User Guide
112
Tips
Measure values are calculated at the end of every period for formula-based measures. Different measures can have different tracking frequencies, and the end of the period is determined by the tracking frequency. For example, a measure with Weekly tracking frequency would have the values computed for it every Sunday at 11:59 p.m.
To ensure the most up-to-date data displays, select Recalculate Measures. After you receive notification that the job is complete, refresh the browser page to see updated values.
On the Projects tab, select Refresh to update the portfolio filter to ensure all projects are included in the Scorecard.
Scorecard Views Overview
A view is a named configuration of the visual layout of the Scorecard page. For each view, you can customize content and sparkline view options.
Views can be saved as one of the following types: personal and workspace. Personal views are private and only accessible to the user who created them. Workspace views are saved at the workspace level and are available to all users in the workspace.
Selecting the best view for your needs can facilitate the process of monitoring portfolio data.
Add a Scorecard View
When adding a new portfolio scorecard view, you can add a personal or workspace view. Personal views are private and only accessible to the user who created them. Workspace views are saved at the workspace level, and are available to other members of the workspace with the necessary security privileges.
Note: Your security privileges determine your ability to create workspace views.
To add a portfolio scorecard view:
1) In the object selector, select a portfolio.
2) In the sidebar, hover over Portfolio Analysis, and select Scorecard.
3) On the Scorecard page, in the View list, select Manage Views.
4) In the Manage Views panel, select a view type (Workspace or Personal), select the Context menu, and then select Add.
5) Enter a name for the new view.
6) Use the Measures and Sparklines tabs to customize the view.
7) Select Save.
8) In the Manage Views panel, select Close.
Apply a Scorecard View
Select a portfolio scorecard view to apply its display settings to the Portfolio Scorecard page.
To apply a portfolio scorecard view:
1) In the object selector, select a portfolio.

Monitor
113
2) In the sidebar, hover over Portfolio Analysis, and select Scorecard.
3) On the Scorecard page, in the View list, select Manage Views.
4) To apply a view, select the Context menu, and then select Set Active.
Tips
For quicker selection, the View list displays a list of the five most recently applied views.
View a Dashboard
View dashboards for a visual representation of workspace, project, and portfolio data.
To view a dashboard:
1) In the object selector, select a workspace, project, or portfolio.
2) In the sidebar, hover over Dashboards, and select Dashboard List.
3) On the Dashboard List page, select a dashboard tab to view that dashboard.
Monitor an Approved Portfolio Budget Plan
After a portfolio budget plan is approved, budget planners and stakeholders can monitor how the overall plan and individual projects included in the plan are progressing. The two main pages in the application for monitoring plans are the Scorecard page and the Spending page. You can also monitor portfolio plans using dashboards.
Scorecard Page Overview (on page 110)
Spending Page Overview (on page 116)
View a Dashboard (on page 100)
Scorecard Page Overview
The Scorecard page enables portfolio managers and budget planners to monitor the performance of a portfolio. Portfolios that have an approved budget plan are monitored here to determine which projects are influencing the performance of the plan.
Note: The approved budget plan data represents the latest approved budget plan. The latest approved plan could be from the current planning period or any of the past periods. For example, if you plan every 3 years and you had done planning for the 2016 planning period and approved it, in 2018, you would continue to see the budget plan data corresponding to 2016 budget as that is the currently approved plan. If a scenario is approved for 2018, you would start seeing data for 2018.
Use the Scorecard page to display measures for monitoring the portfolio.
In addition to the data this page displays for portfolios, the view displays approved budget plan and project performance data (key performance indicators), including visual indicators, based on thresholds defined for the budget plan.
Portfolio Management User Guide
114
An additional three levels of data are displayed on the scorecard when there is an approved budget plan.
Portfolio Statistics: Summarized key performance indicators.
Project Summary: Summarized values of the projects in the approved budget plan.
Project: Metric values of the project.
As part of the monitoring process, budget planners can collaborate on the plan with use of Discussions, perform revisions on the plan if issues arise, and maintain versions of the approved plan by creating snapshots.
Monitor an Approved Budget Plan from the Scorecard Page
Monitor projects within an approved portfolio budget plan to determine which projects are influencing the performance of the plan.
To monitor an approved budget plan:
1) In the object selector, select a portfolio.
2) In the sidebar, hover over Portfolio Analysis, and select Scorecard.
3) Review data for the overall plan using the tiles that display at the top of the page. These include threshold and measure data.
4) On the Projects tab, in the Show list, select one of the following:
All: Displays all projects in the portfolio.
Review: Displays all projects with a selected flag in the Review column.
Budget Approved: Displays all projects in the approved budget scenario.
Resource Approved: Displays all projects in the approved resource scenario.
5) To compare current project data against project snapshots, in the project row, select the Context menu, and select View Snapshots.
6) In the project dialog box:
a. Review the historical information provided in the snapshots.
b. Select OK.
7) If a project requires additional attention, mark it for review by selecting Review next to the project name.
Note: If further action is required, you can also revise the plan from this page.
Tips
On the Projects tab, select Refresh to update the portfolio filter to ensure all projects are included in the Scorecard.
Collaborate on an Approved Budget Plan from the Scorecard Page
When a portfolio budget plan is in execution, questions may arise about the performance of the plan. Collaborate with stakeholders when monitoring the performance of approved budget plans.
To collaborate on an approved budget plan:

Monitor
115
1) In the object selector, select a portfolio.
2) In the sidebar, hover over Portfolio Analysis, and select Scorecard.
3) Review data in the tiles.
4) Select the Projects tab.
5) In the Show list, select Budget Approved to review only the projects in the approved budget plan.
Select Discuss to open the Discussion panel.
Note: If no comments have been posted to the Discussion panel, the Discuss icon is empty.
To post a new comment:
In the Post a comment field, enter a comment, and select Post.
To reply to a comment:
Select Comment.
In the Post a reply field, enter a reply, and select Reply.
Tips
You cannot edit or delete a posted comment.
Discussion comments can also be made on the Spending page.
On the Projects tab, select Refresh to update the portfolio filter to ensure all projects are included in the Scorecard.
Create a Snapshot of a Budget Plan from the Scorecard Page
Snapshots are used to determine how projects are progressing over time and can be viewed when monitoring projects included in approved portfolio budget plans on the Scorecard page or Spending page. Snapshots are automatically created when budget plans are approved. Additional snapshots can be taken of approved plans at any point in time to capture history for the plan. Review snapshots in the portfolio-level settings.
To create a snapshot of an approved budget plan:
1) In the object selector, select a portfolio.
2) In the sidebar, hover over Portfolio Analysis, and select Scorecard.
3) Select the Actions menu and select Save Snapshot.
4) In the Save Snapshot dialog box, enter a name for the snapshot, and select Save.
Update an Approved Portfolio Budget Plan from the Scorecard Page
When it is determined that an approved budget plan may need to be revised, a new scenario can be created by duplicating the approved plan. The new scenario can then be sent through the same review, propose, and approval processes as needed. The approved plan will remain in the Approved state until the new scenario has been approved.
To update an approved budget plan:
1) In the object selector, select a portfolio.

Portfolio Management User Guide
116
2) In the sidebar, hover over Portfolio Analysis, and select Scorecard.
3) Select the Actions menu, and select Revise Budget Plan.
4) Enter a name for the new scenario, and select Go to Budget Planning.
5) On the Budget Planning page, update the plan as necessary.
Tips
When the status of the new scenario is set to Approved, the original approved budget plan is set to Retired.
You can update an approved budget plan directly on the Budget Planning page.
View a Dashboard
View dashboards for a visual representation of workspace, project, and portfolio data.
To view a dashboard:
1) In the object selector, select a workspace, project, or portfolio.
2) In the sidebar, hover over Dashboards, and select Dashboard List.
3) On the Dashboard List page, select a dashboard tab to view that dashboard.
Spending Page Overview
When a portfolio budget plan is approved and moves into the execution phase, the budget planner can use the Spending page to track costs against the approved budget of the plan. Costs for the projects can be entered monthly, quarterly, or yearly for each project by the project managers using the Cash Flow page or data can be brought in if connected with P6 EPPM. View time-phased budget, forecast, and spend cost curves in the Financial Summary chart, as well as Year End Forecast (sum of all forecast costs for the current year) and Year To Date Actuals (sum of actuals for the current year).
The Financial Summary section can be customized to show the cost curves incrementally, cumulatively, or both. Time-phased values are spread over the planning horizon of the portfolio for which the portfolio budget plan was created.
The Financial Breakdown section enables the budget planner to analyze detailed time-phased cost data. Cost values can be viewed by planning horizon or a specific year and can be compared to historical values from a snapshot. Select a time period from the Period column to view the projects in the budget plan and their individual costs. Projects can be flagged for review.
As part of the monitoring process, budget planners can collaborate on the plan with use of Discussions, perform revisions on the plan if issues arise and maintain version of the plan by creating snapshots.
Monitor a Budget Plan from the Spending Page
Monitor portfolio budget plans to determine which projects are influencing the performance of the plan.
To monitor a budget plan:
Monitor
117
1) In the object selector, select a portfolio.
2) In the sidebar, hover over Portfolio Analysis, and select Spending.
3) In the Financial Summary section:
a. Select whether to view Incremental or Cumulative values.
b. Select Settings to select which cost curves to view on the chart.
c. In the Chart Options dialog box, select the curves you want to view, and select Save.
4) In the Financial Breakdown section:
a. In the View list, select to view cost values by Planning Horizon or a specific year.
b. In the Compare To list, select whether to compare data against a snapshot to review historical data.
c. Select a time period from the Period column to view the projects in the budget plan and their individual costs.
5) In the Projects dialog box:
a. Review values against the Approved Budget.
b. If a project requires additional attention, mark it for review by selecting Review next to the project name.
c. Select Save or Cancel.
Collaborate on an Approved Portfolio Budget Plan from the Spending Page
When a portfolio budget plan is in execution, questions may arise about the performance of the plan as a whole or individual projects. Collaborate with stakeholders when monitoring the performance of portfolios and their budget plans.
To collaborate on an approved budget plan:
1) In the object selector, select a portfolio.
2) In the sidebar, hover over Portfolio Analysis, and select Spending.
3) On the Spending page, review data for the projects in the budget plan, and select to review or post a new comment.
Select Discuss to open the Discussion panel.
Note: If no comments have been posted to the Discussion panel, the Discuss icon is empty.
To post a new comment:
In the Post a comment field, enter a comment, and select Post.
To reply to a comment:
Select Comment.
In the Post a reply field, enter a reply, and select Reply.
Tips
Discussion comments can also be made on the Scorecard page.

Portfolio Management User Guide
118
Create a Snapshot of a Budget Plan from the Spending Page
Snapshots are used to determine how projects are progressing over time and can be viewed when monitoring projects included in portfolio budget plans on the Scorecard page or Spending page. Snapshots are automatically created when budget plans are approved. Additional snapshots can be taken of approved plans at any point in time to capture history for the plan. Review snapshot in the portfolio-level settings.
To create a snapshot of a budget plan:
1) In the object selector, select a portfolio.
2) In the sidebar, hover over Portfolio Analysis, and select Spending.
3) On the Spending page, select Save Snapshot.
4) In the Save Snapshot dialog box, enter a name for the snapshot, and select Save.
Update an Approved Budget Plan from the Spending Page
When it is determined that an approved portfolio budget plan may need to be revised, a new scenario can be created by duplicating the approved plan. The new scenario can then be sent through the same review, propose, and approval processes as needed. The approved plan will remain in the Approved state until the new scenario has been approved.
To update an approved budget plan:
1) In the object selector, select a portfolio.
2) In the sidebar, hover over Portfolio Analysis, and select Spending.
3) On the Spending page, select Revise Budget Plan.
4) Enter a name for the new scenario, and select Go to Budget Planning.
5) On the Budget Planning page, update the plan as necessary.
Tips
When the status of the new scenario is set to Approved, the original approved budget plan is set to Retired.
You can update an approved budget plan directly on the Budget Planning page.

119
Oracle Prime Projects Portfolio Management User Guide
Copyright © 2014, 2018, Oracle and/or its affiliates. All rights reserved. Oracle and Java are registered trademarks of Oracle and/or its affiliates. Other names may be trademarks of their respective owners.
Intel and Intel Xeon are trademarks or registered trademarks of Intel Corporation. All SPARC trademarks are used under license and are trademarks or registered trademarks of SPARC International, Inc. AMD, Opteron, the AMD logo, and the AMD Opteron logo are trademarks or registered trademarks of Advanced Micro Devices. UNIX is a registered trademark of The Open Group.
This software and related documentation are provided under a license agreement containing restrictions on use and disclosure and are protected by intellectual property laws. Except as expressly permitted in your license agreement or allowed by law, you may not use, copy, reproduce, translate, broadcast, modify, license, transmit, distribute, exhibit, perform, publish or display any part, in any form, or by any means. Reverse engineering, disassembly, or decompilation of this software, unless required by law for interoperability, is prohibited.
The information contained herein is subject to change without notice and is not warranted to be error-free. If you find any errors, please report them to us in writing.
If this is software or related documentation that is delivered to the U.S. Government or anyone licensing it on behalf of the U.S. Government, the following notice is applicable:
U.S. GOVERNMENT END USERS: Oracle programs, including any operating system, integrated software, any programs installed on the hardware, and/or documentation, delivered to U.S. Government end users are “commercial computer software" pursuant to the applicable Federal Acquisition Regulation and agency-specific supplemental regulations. As such, use, duplication, disclosure, modification, and adaptation of the programs, including any operating system, integrated software, any programs installed on the hardware, and/or documentation, shall be subject to license terms and license restrictions applicable to the programs. No other rights are granted to the U.S. Government.
This software or hardware is developed for general use in a variety of information management applications. It is not developed or intended for use in any inherently dangerous applications, including applications that may create a risk of personal injury. If you use this software or hardware in dangerous applications, then you shall be responsible to take all appropriate failsafe, backup, redundancy, and other measures to ensure its safe use. Oracle Corporation and its affiliates disclaim any liability for any damages caused by use of this software or hardware in dangerous applications.
This software or hardware and documentation may provide access to or information on content, products and services from third-parties. Oracle Corporation and its affiliates are not responsible for and expressly disclaim all warranties of any kind with respect to third-party content, products, and services. Oracle Corporation and its affiliates will not be responsible for any loss, costs, or damages incurred due to your access to or use of third-party content, products, or services.
Legal Notices