Embed Size (px)
Citation preview
PORTFOLIO ANALYSIS OF CARBON
SEQUESTRATION TECHNOLOGIES AND
BARRIERS TO ADOPTION
Jillian D. YOUNG-LORENZ
Bachelor of Arts (summa cum laude)
This thesis is presented for the degree of Master of Science (Geoscience)
at The University of Western Australia
School of Earth and Environment
2013

I
ABSTRACT
The effective targeting of investment funds and research efforts to reduce industrial carbon
dioxide (CO2) emissions, while preserving access to fossil fuel energy resources, requires
quantitative methods to assess and compare a diverse range of carbon capture and sequestration
(CCS) technologies in order to rank, prioritise and make sound policy and investment decisions.
Proposed CCS methods for the stabilisation of atmospheric CO2 levels need to be analysed for
project risks across a range of factors, from the socio-economic to the purely technical. As all
CCS technologies face uncertainties and risks to implementation for global commercial-scale
adoption, I advocate a portfolio approach for carbon management to spread the risk. The main
objective of this thesis is to develop a CCS technology assessment method, and use it to make
recommendations for an optimum carbon dioxide emissions reduction portfolio. I develop a
semi-quantitative methodology, performing the initial design and calibration on the CCS
technology of Geosequestration.
The methodology provides a standardised format for decision makers to assess CCS
technologies from different business, legal, social, scientific and engineering disciplines. It is
intended as a first pass risk assessment and big picture comparison of the current global status
of alternative carbon mitigation options for the purpose of developing a carbon management
strategy and building a portfolio of carbon sequestration technologies to spread risk. Flexibility
in the design of the methodology framework allows for review and modification to account for
technology progress and increased amounts of public domain data. This tool provides a multi-
criteria feasibility analysis which can be used by governments and industry to rank competing
or complementary carbon sequestration options. It can be applied across projects, scientific
disciplines and technologies (portfolio analysis) and with some modification, within a specific
technology or project (project analysis).
I apply the methodology to three carbon sequestration options: Geosequestration, Algae CCS
and Biochar CCS, to assess their technical readiness as carbon mitigation options. Based on the
application of the methodology, the three technologies are evaluated in terms of probability of
adoption from the near to mid-long term. The main differentiators for the top-ranked
technologies are non-technical factors like public acceptance, economics, and the existence of
regulatory frameworks.

II
III
TABLE OF CONTENTS
ABSTRACT ................................................................................................................................. I
TABLE OF CONTENTS ........................................................................................................... III
LIST OF FIGURES .................................................................................................................. VII
LIST OF TABLES .................................................................................................................... XV
ACKNOWLEDGMENTS ..................................................................................................... XVII
DECLARATION OF CANDIDATE CONTRIBUTION ....................................................... XIX
CHAPTER 1 INTRODUCTION ........................................................................................... 1
OVERVIEW .................................................................................................................. 1
1.1 BACKGROUND AND MOTIVATION ........................................................................ 3
1.1.1 Greenhouse gases and climate change ............................................................... 3
1.1.2 Climate mitigation strategies ............................................................................. 8
1.1.3 Carbon capture and sequestration .................................................................... 10
1.1.4 Portfolio Approach ........................................................................................... 11
1.1.5 Needs of LNG Operators NW Shelf of Australia ............................................. 12
1.2 RESEARCH OBJECTIVES........................................................................................... 13
1.3 THESIS ORGANISATION ...........................................................................................13
REFERENCES ............................................................................................................. 15
CHAPTER 2 METHODOLOGY DEVELOPMENT ........................................................ 19
OVERVIEW ................................................................................................................. 19
2.1 INTRODUCTION ........................................................................................................ 21
IV
2.2 MULTI-CRITERIA METHODOLOGY DEVELOPMENT ......................................... 22
2.3 MODEL DEVELOPMENT PROCESS ........................................................................ 26
2.4 FRAMEWORK COMPONENTS ................................................................................. 30
2.5 RANKING SYSTEM .................................................................................................... 35
2.5.1 Sub-Criteria Scorecard ..................... ............................................................... 36
2.6 DISCUSSION ............................................................................................................... 47
2.7 CONCLUSIONS ...........................................................................................................49
REFERENCES ............................................................................................................. 51
CHAPTER 3 APPLICATION OF METHODOLOGY:
GEOSEQUESTRATION:
CARBON CAPTURE AND STORAGE IN GEOLOGICAL FORMATIONS .................. 57
OVERVIEW ................................................................................................................. 57
3.1 INTRODUCTION ........................................................................................................ 59
3.2 METHODOLOGY ....................................................................................................... 62
3.2.1 Technology Element 1: Site Identification and Characterisation ................... 63
3.2.2 Technology Element 2: Capture ...................................................................... 68
3.2.3 Technology Element 3: Transportation ...........................................................72
3.2.4 Technology Element 4: Injection and Storage ................................................73
3.2.5 Technology Element 5: Measurement, Monitoring and Verification .............78
3.3 RESULTS ......................................................................................................................79
3.3.1 Public Acceptance ............................................................................................79
3.3.2 Regulatory Frameworks ...................................................................................81
3.3.3 Economics ....................................................................................................... 85
3.3.4 Storage Quality ................................................................................................ 88

V
3.3.5 Environmental Impact ..................................................................................... 92
3.3.6 Science and Technology: Sub-Matrix Assessment ......................................... 93
3.3.7 Summary of results: Overall Technology Rating .......................................... 102
3.4 DISCUSSION ............................................................................................................ 103
3.5 CONCLUSIONS ........................................................................................................ 107
REFERENCES ........................................................................................................... 109
CHAPTER 4 APPLICATION OF METHODOLOGY: ALGAE CCS .......................... 125
OVERVIEW ............................................................................................................... 125
4.1 APPLICATION OF METHODOLOGY: ALGAE CCS ............................................. 127
4.2 INTRODUCTION ...................................................................................................... 127
4.3 RESULTS .................................................................................................................. 133
4.3.1 Science and Technology: Sub-Matrix Assessment ...................................... 139
4.3.2 Summary of results: Overall Technology Rating .......................................... 146
4.4 DISCUSSION.............................................................................................................. 147
4.5 CONCLUSIONS ........................................................................................................ 148
REFERENCES ........................................................................................................... 151
CHAPTER 5 APPLICATION OF METHODOLOGY: BIOCHAR CCS ..................... 157
OVERVIEW................................................................................................................. 157
5.1 APPLICATION OF METHODOLOGY: BIOCHAR CCS ........................................ 159
5.2 INTRODUCTION ...................................................................................................... 159
5.3 RESULTS ................................................................................................................... 167
5.3.1 Science and Technology: Sub-Matrix Assessment ....................................... 176
5.3.2 Summary of results: Overall Technology Rating............................................ 183
VI
5.4 DISCUSSION ............................................................................................................ 185
5.5 CONCLUSIONS ........................................................................................................ 187
REFERENCES ........................................................................................................... 189
CHAPTER 6 DISCUSSION AND CONCLUSIONS ....................................................... 199
OVERVIEW ............................................................................................................... 199
6.1 DISCUSSION ............................................................................................................ 199
Methodology................................................................................................................ 199
CCS Technology Comparisons .................................................................................. 202
Example of Carbon Management Portfolio .............................................................. 206
6.2 CONCLUSIONS ........................................................................................................ 209
REFERENCES ........................................................................................................... 211

VII
LIST OF FIGURES
FIGURE PAGE
CHAPTER 1 INTRODUCTION
1.1 Historical trends in carbon dioxide concentrations and temperature,
on a geological and recent time scale ........................................................................................... 4
Ahlenius, H. (2007), Historical trends in carbon dioxide concentrations and temperature,
on a geological and recent time scale: from Collection: Global Outlook for Ice and Snow,
UNEP/GRID-Arendal Maps and Graphics Library.
http://maps.grida.no/go/graphic/historical-trends-in-carbon-dioxide-concentrations-and-
temperature-on-a-geological-and-recent-time-scale (accessed 7 May 2011).
1.2 Additional infrastructure costs in Alaska due to thawing of the permafrost ……….......….…… 6
Larsen, P., Goldsmith, S., Smith, O., Wilson, M., Strzepek, K., Chinowsky, P. and
Saylor, B. (2007), Estimating Future Costs for Alaska Public Infrastructure at Risk to
Climate Change: ISER Report, Institute of Social and Economic Research,
University of Alaska, Anchorage, AK, USA.
1.3 Satellite image of the heatwave of the Russian Federation (9 August 2010) ................................ 7
Image source: NASA.
http://eoimages.gsfc.nasa.gov/images/imagerecords/45000/45069/russialsta_tmo_2010208.jpg
(accessed 24 March 2013).
1.4 Rainfall over Pakistan between 26 and 29 July 2010 .................................................................... 7
Pakistan Meteorological Department (2010), Super Flood 2010 in Pakistan:
Brief by Mahmood, A., Director General, Pakistan Meteorological Department.
http://eit.dmi.gov.tr/FILES/sunular/Pakistan.ppt (accessed 24 March 2013).
1.5 Mismatch between computer modelled predictions of rising global mean
temperatures in °C and actual data recorded (adapted from Stott et al., 2013) ............................. 9
The Economist (2013), A sensitive matter: The Economist – Climate Science,
[from the print edition], 30 March 2013.
http://www.economist.com/news/science-and-technology/21574461-climate-may-be-heating-up-
less-response-greenhouse-gas-emissions (accessed 19 April 2013).

VIII
1.6 Pacala and Socolow: Stabilisation Wedges Triangle Model ......................................................... 9
Pacala, S., and Socolow, R. (2004), Stabilization Wedges: Solving the Climate Problem
for the Next 50 Years with Current Technologies, Science, 305(5686), 968-972.
1.7 Global Carbon Pools and fluxes .................................................................................................. 10
Figure adapted from: Lal, R. (2008), Carbon Sequestration: Philosophical Transactions of the
Royal Society B: Biological Sciences, 363, 1492, 815-830.
CHAPTER 2 METHODOLOGY DEVELOPMENT
2.1 Methodology Development Model .............................................................................................. 29
2.2 Master Matrix Step 1 ................................................................................................................... 30
2.3 Science and Technology Sub-Matrix........................................................................................... 30
2.4 Master Matrix Spreadsheet Template........................................................................................... 31
2.5 Science and Technology Sub-Matrix Spreadsheet Template for Geosequestration …................ 31
2.6 Schematic of Master Matrix Scorecard, Sub-matrix Scorecard, and Rating Scale ..................... 33
2.7 Portfolio Analysis Taxonomy....................................................................................................... 35
Adapted from Young-Lorenz, J.D. and Lumley, D. (2013), Portfolio analysis of
carbon sequestration technologies and barriers to adoption: General methodology
and application to geological storage: Energy Procedia, 37, 5063-5079.
2.8 Carbon prices over time in Europe for the period April 2010 to April 2012 .............................. 42
Image source: van Renssen, S. (2012), Saving EU climate policy:
Nature Climate Change, 2, 392-393.
http://www.nature.com/nclimate/journal/v2/n6/images/nclimate1561-f1.jpg
(accessed 15 April 2013).
2.9 Qingdo algae bloom off the coast of Qingdao in the Yellow Sea, China in 2008 ...................... 46
Image source: Earth Observatory, NASA
http://eoimages.gsfc.nasa.gov/images/imagerecords/8000/8897/qingdao_amo_2008180.jpg
(accessed 18 April 2013).
CHAPTER 3 APPLICATION OF METHODOLOGY: GEOSEQUESTRATION: CARBON
CAPTURE AND STORAGE IN GEOLOGICAL FORMATIONS
3.1 Schematic diagram of the Geosequestration Process................................................................... 60
Image source: Scottish Centre for Carbon Storage.
http://www.geos.ed.ac.uk/sccs/public/teachers/CCS-IV.jpg (accessed 7 May 2011).

IX
3.2 Map of Geosequestration Projects, 2012 .................................................................................... 61
Image source: CO2CRC http://www.co2crc.com.au/images/imagelibrary/gen_diag/selected-
large-scale-storage-projects_media.jpg (accessed 9 October 2012).
3.3 Injection of carbon dioxide into depleted oil and gas reservoir ................................................. 64
Image source: Scottish Centre for Carbon Storage.
http://www.sccs.org.uk/public/teachers/Injection-full.jpg (accessed 1 October 2012).
3.4 Phase diagram of CO2 illustrating temperature versus pressure and critical point ..................... 65
Image source: ChemicaLogic Corporation (1999)
http://www.chemicalogic.com/Documents/co2_phase_diagram.pdf (accessed 1 April 2013).
3.5 CO2 Depth versus Density Chart ................................................................................................ 66
Image source: CO2CRC
http://co2crc.com.au/images/imagelibrary/stor_diag/supercritical_highres.jpg
(accessed 1 October 2012).
3.6 Carbon Dioxide Capture Processes for LNG Processing, Post-Combustion,
Pre-Combustion and Oxyfuel....................................................................................................... 70
Image source: CO2CRC
http://co2crc.com.au/images/imagelibrary/cap_diag/Captureprocesses_media.jpg
(accessed 13 July 2012).
3.7 Absorption – Desorption Process................................................................................................. 72
Image source: CO2CRC
http://www.co2crc.com.au/images/imagelibrary/cap_diag/solvent_absorption_media.jpg
(accessed 13 July 2012).
3.8 CO2 Trapping Mechanisms - CO2 Trapped, and Applicability versus Time ............................ 74
Image source: Elements – Geoscience World
http://elements.geoscienceworld.org/content/4/5/325/F7.large.jpg (accessed 5 April 2013).
3.9 Structural and Stratigraphic Trapping ........................................................................................ 75
Image source: CO2CRC. http://www.co2crc.com.au (accessed 2 October 2011).
3.10 Residual Saturation /Capillary Trapping .................................................................................... 76
Image source: CO2CRC. http://www.co2crc.com.au (accessed 2 October 2011).
X
3.11 Solubility Trapping ....................................................................................... ............................. 77
Image source: CO2CRC
http://www.co2crc.com.au/images/imagelibrary/stor_diag/co2_dispersion_post_inject_media.jpg
(accessed 2 October 2011).
3.12 CO2 sources, pipelines and projects in the USA ......................................................................... 86
Image source: Melzer, L.S. (2011), Emergence Of Residual Zones, Price And Supply Factors
Usher In New Day In CO2 EOR: American Oil and Gas Reporter, February 2011 Cover Story.
http://www.aogr.com/index.php/magazine/cover-story/emergence-of-residual-zones-price-and-
supply-factors-usher-in-new-day-in-co (accessed 17 April 2013).
3.13 Carbon prices over time in Europe for the period April 2010 to April 2012 .............................. 88
Image source: van Renssen, S. (2012), Saving EU climate policy: Nature Climate Change, 2,
392-393.
http://www.nature.com/nclimate/journal/v2/n6/images/nclimate1561-f1.jpg
(accessed 15 April 2013).
3.14 The Gorgon Project Development Concept ................................................................................. 89
Image source: Chevron Australia
http://www.chevronaustralia.com/ourbusinesses/gorgon/globalsignificance.aspx
(accessed 17 April 2013).
3.15 Geophysical Techniques to characterise and monitor CO2 storage reservoirs ............................ 91
Image source: Subsurface Imaging Group, The Ohio State University
http://www.geology.ohio-state.edu/~jeff/geophysics1.htm (accessed 23 April 2012).
3.16 CO2 storage potential in Australia .............................................................................................. 94
Image source: CO2CRC (2011)
http://www.co2crc.com.au/images/imagelibrary/gen_diag/Australia_Storage_Potential_2011_me
dia.jpg (accessed 17 April 2013).
3.17 Pipeline Infrastructure Map of Western Australia as at 30 June 2010 ........................................ 97
Image Source: Economic Resource
http://www.erawa.com.au/access/gas-access/pipeline-infrastructure-map/
(accessed 17 April 2013).

XI
3.18 Onshore vs. Offshore storage costs for depleted oil and gas fields in Europe ............................ 99
Image source: Global CCS Institute
http://www.globalccsinstitute.com/publications/global-storage-resources-gap-analysis-policy-
makers/online/83236 (accessed 17 April 2013).
CHAPTER 4 APPLICATION OF METHODOLOGY: ALGAE CCS
4.1 Algal Biofuel and Bioenergy Pathways .................................................................................... 129
Figure adapted from: NNFCC (2012), Research Needs in Ecosystem Services to Support Algal
Biofuels,Bioenergy and Commodity Chemicals Production in the UK: A project for the Algal
Bioenergy Special Interest Group [Smith, N. and Higson, A.]: NNFCC Project Number: 12-008.
4.2 Example of open raceway pond in Israel for the cultivation of microalgae for biofuel ............ 130
Image source: Seambiotic
http://www.seambiotic.com/research/microalgae-speices/ (accessed 24 April 2013).
4.3 Example of a closed column tubular photobioreactor for microalgae
cultivation in China ............................................................................................ ...................... 130
Image source: Algae Energy Group
http://www.bioenergychina.org/ea/Facility.html (accessed 24 April 2013).
4.4 Aerial view of Cyanotech algae farm and facilities at Keahole Point, Hawaii ………………. 139
Image source: Cyanotech Corporation http://www.cyanotech.com/company/facility.html
(accessed 24 April 2013).
4.5 The Green Crude Farm facility being developed in Columbus, New Mexico, USA
by Sapphire Energy, the US Department of Energy [US DOE] and the
US Department of Agriculture ................................................................................................. 140
Image source: Sapphire Energy
http://www.sapphireenergy.com/locations/green-crude-farm.html
(accessed 25 April 2013).
4.6 Horizontal tubular photobioreactor microalgae cultivation system and biorefinery
at AlgaePARC Research Facility, Wageningen University and Research Centre,
Netherlands ............................................................................................................................... 145
Image source: AlgaePARC, Wageningen UR
http://www.wageningenur.nl/en/Expertise-Services/Facilities/AlgaePARC/Themes/Microalgae-
biorefinery.htm (accessed 24 April 2013).
XII
CHAPTER 5 APPLICATION OF METHODOLOGY: BIOCHAR CCS
5.1 Example of biochar.................................................................................................................... 160
Image source: Australia and New Zealand Biochar Researchers Network
http://www.anzbiochar.org/images/char600x358.jpg (accessed 24 April 2013).
5.2 Microscopic image of biochar showing its micropore structure............................................... 161
Image source: Biochar Project (Jocelyn)
http://biocharproject.org/wp-content/uploads/2011/08/Jocelyn-biochar-electron-microscope-
images-1.jpg (accessed 24 April 2013).
5.3 Potential ecosystem benefits from biochar production and application systems ...................... 163
Figure adapted from: Waters, D., Zwieten, L., Singh, B. P., Downie, A., Cowie, A. L.,
and Lehmann, J. (2011), Biochar in soil for climate change mitigation and adaptation:
In Soil Health and Climate Change: Springer Berlin Heidelberg, 15, 345-368.
5.4 Overview of the sustainable biochar concept ........................................................................... 163
Woolf, D., Amonette, J.E., Street-Perrott, F.A., Lehmann, J., and Joseph, S. (2010),
Sustainable biochar to mitigate global climate change: Nature Communications: 1, 56, 1-9.
5.5 Potential impacts of Biochar application to plant-soil systems ................................................. 165
Figure adapted from: Waters, D., Zwieten, L., Singh, B. P., Downie, A., Cowie, A. L.,
and Lehmann, J. (2011), Biochar in soil for climate change mitigation and adaptation:
In Soil Health and Climate Change: Springer Berlin Heidelberg, 15, 345-368.
5.6 Bales of corn stover collected from grain fields after harvesting .............................................. 171
Image source: Science Daily
http://images.sciencedaily.com/2007/07/070709103138-large.jpg (accessed 24 April 2013)
5.7 Modern pyrolysis stove ............................................................................................................. 175
SHALIN Finland in collaboration with Aalto University (link), Household Level Pyrolytic
StoveLinking energy, Forestry and Agriculture for local level climate change mitigation
and improved food security: SHALIN Finland in collaboration with Aalto University,
[Kuria, P. and Kagiri, E. (eds.), Lindberg, A., Mäkinen, I., Mäkelä, M., Ottelin, J., Kuria, P.
and Kagiri, E.]. http://www.into-ebooks.com/download/250/ (accessed 22 April 2013).

XIII
5.8 Traditional three-stone stove used in Kenya ............................................................................ 176
SHALIN Finland in collaboration with Aalto University (link), Household Level Pyrolytic
Stove Linking energy, Forestry and Agriculture for local level climate change mitigation
and improved food security: SHALIN Finland in collaboration with Aalto University,
[Kuria, P. and Kagiri, E. (eds.), Lindberg, A., Mäkinen, I., Mäkelä, M., Ottelin, J., Kuria, P.
and Kagiri, E.]. http://www.into-ebooks.com/download/250/ (accessed 22 April 2013).
5.9 500kW biomass gasification plant in Merced, California, USA .............................................. 181
Image source: International Biochar Initiative [IBI] (2012), Phoenix Energy’s business
model: Building small profitable plants: [in September 2012 newsletter][photo courtesy of
Phoenix Energy]. http://www.biochar-international.org/profile/Phoenix_Energy
(accessed 24 April 2013).

XIV

XV
LIST OF TABLES
TABLE PAGE
CHAPTER 1 INTRODUCTION
1.1 Predicted decrease in near-surface permafrost area and increase in thickness
of the active layer ........................................................................................................ ................. 5
Table source: United Nations Environment Programme [UNEP] (2012), Policy
Implications of Warming Permafrost: [Report], United Nations Environment
Programme, Nairobi, Kenya. http://www.unep.org/pdf/permafrost.pdf
(accessed 22 March 2013).
CHAPTER 2 METHODOLOGY DEVELOPMENT
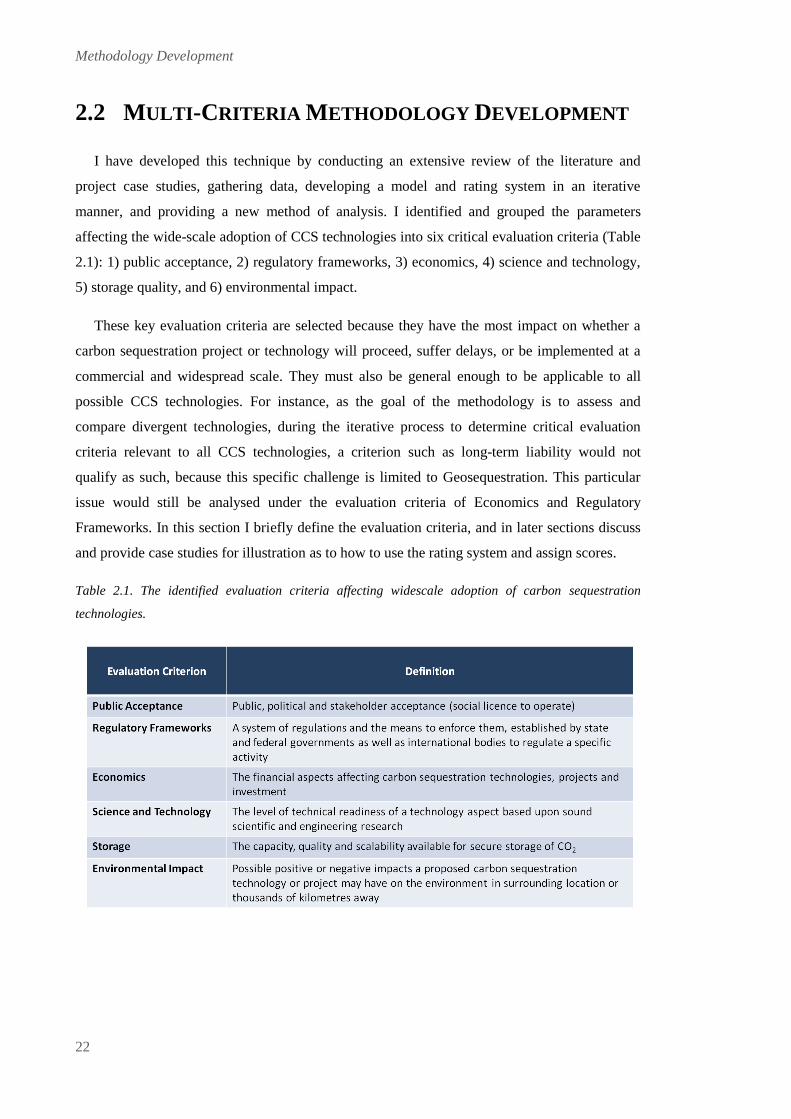
2.1 Identified Evaluation Criteria....................................................................................................... 22
2.2 Examples of Stakeholder Diversity.............................................................................................. 23
2.3 Associated Issues for Regulatory Frameworks............................................................................ 24
2.4 Economic and Financial Factors ................................................................................................. 25
2.5 Evaluation Criteria Rating Scale and Equivalents ...................................................................... 33
2.6 Evaluation Criteria Scorecard ................................................................................ ...................... 36
2.7 Sub-Criteria Scorecard ............................................................................................................... 37
CHAPTER 3 APPLICATION OF METHODOLOGY: GEOSEQUESTRATION:
CARBON CAPTURE AND STORAGE IN GEOLOGICAL FORMATIONS
3.1 Rock properties affecting ability to sequester CO2...................................................................... 67
3.2 Sedimentary basin assessment factors ........................................................................................ 68
3.3 Illustration of average score of sub-criteria input into Public Acceptance column of
the Master Matrix ....................................................................................................................... 81
3.4 Measurement, Monitoring and Verification (MMV) technologies and methods....................... 100
XVI
3.5 Technology Elements of Geosequestraton: Science and Technology
Sub-Matrix Assessment ............................................................................................................ 102
3.6 Overall risk assessment rating of Geosequestration: Master Matrix ........................................ 102
CHAPTER 4 APPLICATION OF METHODOLOGY: ALGAE CCS
4.1 Science and Technology Sub-Matrix Scorecard: Results of Application of Methodology
to Algae CCS ............................................................................................................................ 146
4.2 Overall technology rating of Algae CCS: Master Matrix ......................................................... 146
CHAPTER 5 APPLICATION OF METHODOLOGY: BIOCHAR CCS
5.1 Typical product yields (dry wood basis) obtained by different modes of wood pyrolysis ....... 162
Adapted from: International Energy Agency Bioenergy [IEA Bioenergy] (2007),
Biomass Pyrolysis: IEA Bioenergy [Bridgwater, T]: Aston University, United Kingdom,
T34:2007:01.
5.2 Science and Technology Sub-Matrix Scorecard: Results of Application of
Methodology to Biochar CCS.................................................................................................... 183
5.3 Overall technology rating of Biochar CCS: Master Matrix ...................................................... 183
CHAPTER 6 DISCUSSION AND CONCLUSIONS
6.1 Master Matrix: Overall Technology Ratings for Geosequestration, Algae CCS
and Biochar CCS ....................................................................................................................... 205
6.2 Science and Technology Sub-Matrix Scorecard: Results of Application of
Methodology to Geosequestration ……………................………...………………………… 205
6.3 Science and Technology Sub-Matrix Scorecard: Results of Application of
Methodology to Algae CCS ...................................................................... ................................ 206
6.4 Science and Technology Sub-Matrix Scorecard: Results of Application of
Methodology to Biochar CCS .................................................................... ............................... 206

XVII
ACKNOWLEDGEMENTS
Firstly, I would like to thank my coordinating supervisor, Winthrop Professor David Lumley,
for his insight, guidance and talent for understanding the “whole picture.” He has the ability to
to bring together the scientific and business perspectives needed to understand the multi-
disciplinary challenges in the adoption of carbon capture and sequestration technologies. I have
learned an inordinate amount from various scientific disciplines, notably geoscience, and
possibly more of maths and physics than I thought possible! I also thank my co-supervisor
Winthrop Professor David Day from the UWA Business School of Management and Leadership
for his continued support.
My research would not have been possible without the generous support of the University of
Western Australia, School of Earth Environment, the Centre for Petroleum Geoscience and CO2
Sequestration, and the UWA: Reservoir Monitoring Research Consortium. My thanks and
appreciation.
I thank the School of Earth and Environment’s Graduate Research School Coordinators,
Andrew Rate and Eun Jun Holden, for their practical advice and support. The same applies to
the Graduate Research School Education Officers, Krys Haq and Jo Edmonston. You were all
very helpful at all stages of my candidature, and I appreciate all your assistance. I would also
like to thank Adjunct Associate Professor Jo Voola for giving me my initial start at UWA in the
School of Mechanical and Chemical Engineering.
I thank my colleagues on the 4D Research Team and at the Centre for Petroleum Geoscience.
Big cheers to Helen Nash, Lisa Gavin, Philbilly Cilli, Mohammad (MoMo) Emami, Matty Saul,
Mike Dentith, James Deeks, Rafael de Souza, Wendy Young, Jeff Shragge, Nader Issa, Mudasa
Muhammad Saqab, UGuen Jang, Alan Pitman, and Polly Mahapatra. What a great team! Other
friends who have always been there when I needed them are Mao Luo, Tom Hoskins, Patricia
Alessi, and the administrative team at SEE North. And I cannot forget Michael Djohan; FNAS
IT would just break down without you! I value everybody’s advice, friendship, love and support
these past two years. I will miss the fun times, the jolly decent food at Uniclub, the
opportunities to bounce ideas, and even offering feedback on geophysics problems!
I thank God for his many blessings, including the support of my family at home in New
Zealand, and friends from St. Andrews and around the world. And finally, I would like to thank
my beloved husband, Lars Lorenz and fluffy son, Jaeger. Lars, I would not have been able to do
it without your loving support and fine editing skills. You helped to lessen the impact of my
complicated and convoluted German-style sentences. Thank you for your constant strength,

XVIII
humour, wisdom and love. Jaeger, you keep me sane, give me heaps of joy and playful fun, and
kept the loneliness at bay since your Daddy has been away.
Thank you one and all.

XIX
DECLARATION OF CANDIDATE CONTRIBUTION
This thesis is my own work, and no part of it has been presented for a degree at this, or at any
other, university.
This thesis contains published work and/or work prepared for publication, some of which has
been co-authored. The bibliographical detail of the work is outlined below (with percentage
contributions from authors in parentheses). This paper is based on material from Chapters 2 and
3 of this thesis.
Young-Lorenz, J.D. (70%) and Lumley, D. (30%) (2013) Portfolio analysis of carbon
sequestration technologies and barriers to adoption: General methodology and application to
geological storage: Energy Procedia, 37, 5063-5079.
We hereby declare that the individual authors have granted permission to the candidate
(Jillian D. Young-Lorenz) to use the results presented in this publication.
Student Signature .............................................................................
Coordinating Supervisor Signature .....................................................

XX

Introduction
1
CHAPTER 1
INTRODUCTION
OVERVIEW
This chapter introduces the background context of greenhouse gas (GHG) emissions and their
possible links to global warming and climate change. Although the causal link between
anthropogenic GHG and climate change cannot yet be definitively proven, the potential risks to
environment, economies, food and energy sources justify the development of carbon mitigation
strategies and tools for preventative measures. A global goal, shared by many governments and
international bodies, is the reduction of carbon dioxide (CO2) emission levels in the atmosphere.
Carbon capture and sequestration (CCS) technologies through biotic or abiotic means are
examples of such strategies. As all CCS technologies face uncertainties and risks to
implementation for global commercial-scale adoption, I advocate a portfolio approach for
carbon management to spread the risk. I introduce the development of a CCS technology
assessment method to be applied to various CCS technologies and to make recommendations
for an optimum CO2 emissions reduction portfolio. A description of the thesis organisation
concludes this chapter.

Introduction
2
Introduction
3
1.1 BACKGROUND AND MOTIVATION
1.1.1 Greenhouse Gases and Climate Change
Global emissions of greenhouse gases (GHGs) covered by the United Nations Framework
Convention on Climate Change [UNFCCC] have increased approximately 70% from 1970–
2004, and by 24% from 1990–2004 (Intergovernmental Panel on Climate Change [IPCC],
2007a) (Figure 1.1). GHGs absorb infrared radiation trapping heat within the Earth’s
atmosphere, and include the six common gases: carbon dioxide (CO2), methane (CH4), nitrous
oxide (N2O), hydrofluorocarbons (HFCs), perfluorocarbons (PFCs), and sulphur hexafluoride
(SF6). These gases can be compared by multiplying the emissions of a given gas by its global
warming potential to derive a common unit of CO2-equivalent (CO2-e) (IPCC, 2007a; Forster et
al, 2007). CO2 is thought to contribute ~64% of the total GHGs and radiative forcing, primarily
from combustion of fossil fuels, deforestation and changes in land-use since 1750 (IPCC,
2007a; Forster et al., 2007; World Meteorological Service [WMO], 2012a). Methane is the
second most important GHG contributing ~18% of total GHGs since 1750, with 60% of
methane emissions from human activities (cattle-rearing, rice planting, fossil fuel exploitation
and landfills), and 40% from natural sources (wetlands, permafrost)(WMO, 2012a). The third
largest contributor is nitrous oxide at ~6% of total GHGs, from anthropogenic (biomass
burning, fertiliser manufacture and application, industrial processes) and natural (oceans)
sources. The impact of nitrous oxide on the climate is ~300 times greater than equal emissions
of CO2 (IPCC, 2007a; Forster et al., 2007; WMO, 2012a), and in addition, this gas contributes
to the destruction of the stratospheric ozone layer.
The effect of CO2 on the global temperature was first described at the end of the nineteenth
century by Svante Arrhenius in 1896 as a response to a discussion at the Physical Society of
Stockholm about the possible cause of the Ice Age. He described the effect of a change in CO2
concentration on temperature in the following manner:
“If the quantity of carbonic acid increases in geometric progression, the augmentation
of the temperature will increase nearly in arithmetic progression.” (Arrhenius, 1896)
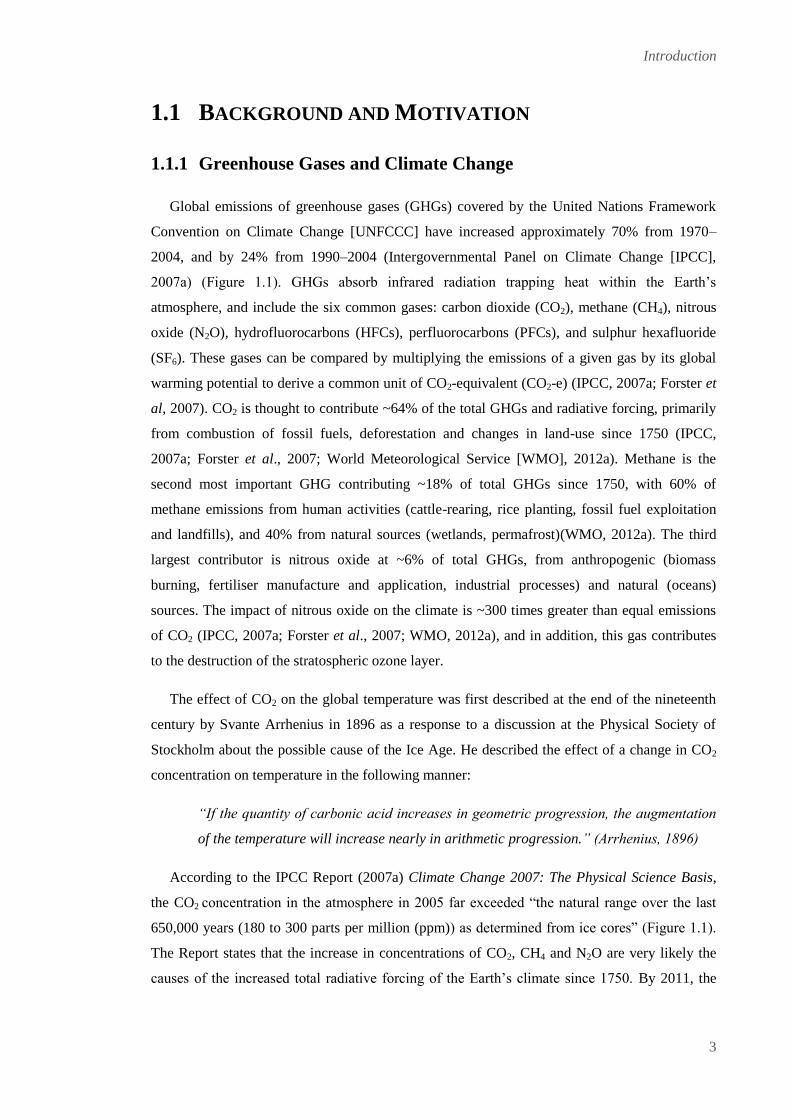
According to the IPCC Report (2007a) Climate Change 2007: The Physical Science Basis,
the CO2 concentration in the atmosphere in 2005 far exceeded “the natural range over the last
650,000 years (180 to 300 parts per million (ppm)) as determined from ice cores” (Figure 1.1).
The Report states that the increase in concentrations of CO2, CH4 and N2O are very likely the
causes of the increased total radiative forcing of the Earth’s climate since 1750. By 2011, the
Introduction
4
globally averaged mole fractions (number of molecules of the gas per million/billion molecules
of dry air) of CO2, CH4, and N2O in the atmosphere reached new highs, with CO2 reaching
390.9 ± 0.1ppm, CH4 1813 ± 2 parts per billion (ppb), and N2O 324.2 ± 0.1 ppb (WMO, 2012a).
Figure 1.1. Historical trends in carbon dioxide concentrations and temperature, on a geological and
recent time scale. Increasing temperatures are notable from the middle ages onward as the world
emerged from the Little Ice Age (LIA), around 1850. With the industrial era, human activities have at the
same time increased the level of carbon dioxide (CO2) in the atmosphere, primarily through the burning
of fossil fuels (IPCC, 2007a; Stern, 2007). The top part of the CO2 measurements, the observations, are
referred to as the 'Mauna Loa curve' or the 'Keeling curve' in reference to the dramatic increase in
atmospheric CO2 levels documented by Charles David Keeling from the Mauna Loa volcano research
station in Hawaii (Image source: Ahlenius, 2007).
The WMO, in its Provisional Statement on the Global Climate in 2012, describes the
previous twelve years as the warmest since records began in 1850. January to October 2012 was
the ninth warmest such period with global land and ocean surface temperatures for the period
about 0.45°C above the corresponding 1961–1990 average of 14.2°C (World Meteorological

Introduction
5
Organisation (WMO), 2012b). One of the most marked events attributed to the increase in
global temperatures, is the rapid loss of Arctic sea ice. The Report by Koç et al. in 2009 states
that rapid sea ice loss is an indicator of global climate change, with the Arctic shrinking by 40%
in the period from 1979 to 2009 (13% pa), and sea ice cover diminishing significantly faster
than climate model predictions. Between March and September 2012, the Arctic experienced a
sea ice loss of 11.83 million km2
(an area larger than the USA), the largest seasonal ice extent
loss in the 34-year satellite record (WMO, 2012c). Climate models predict that summer sea ice
may disappear in the Arctic within four to forty years (Plumer, 2012). A recent study of ice
cores from the Antarctic suggests that an accelerated snow melt is occurring in the Southern
Hemisphere as well. Even though it is not the only recorded period of increased snow melt, the
intensity of the melting since the beginning of the 20th century is unprecedented in the 1000 year
record analysed (Abram et al., 2013).
Another aspect of increasing average temperatures in the Arctic zone is the deepening of the
active layer of permafrost, the layer which undergoes annual thawing through the summer
months. By increasing the thickness of the layer, more organic matter which was previously
sequestered in the permafrost will be accessible for decay. This process is referred to as
permafrost carbon feedback and could potentially contribute 43 – 135 Gigatons (Gt) CO2-e by
2100 and 246-415 Gt CO2-e by 2200 to global GHG emissions. A large range of uncertainties is
related to these estimates as these feedback processes are currently not well understood, and
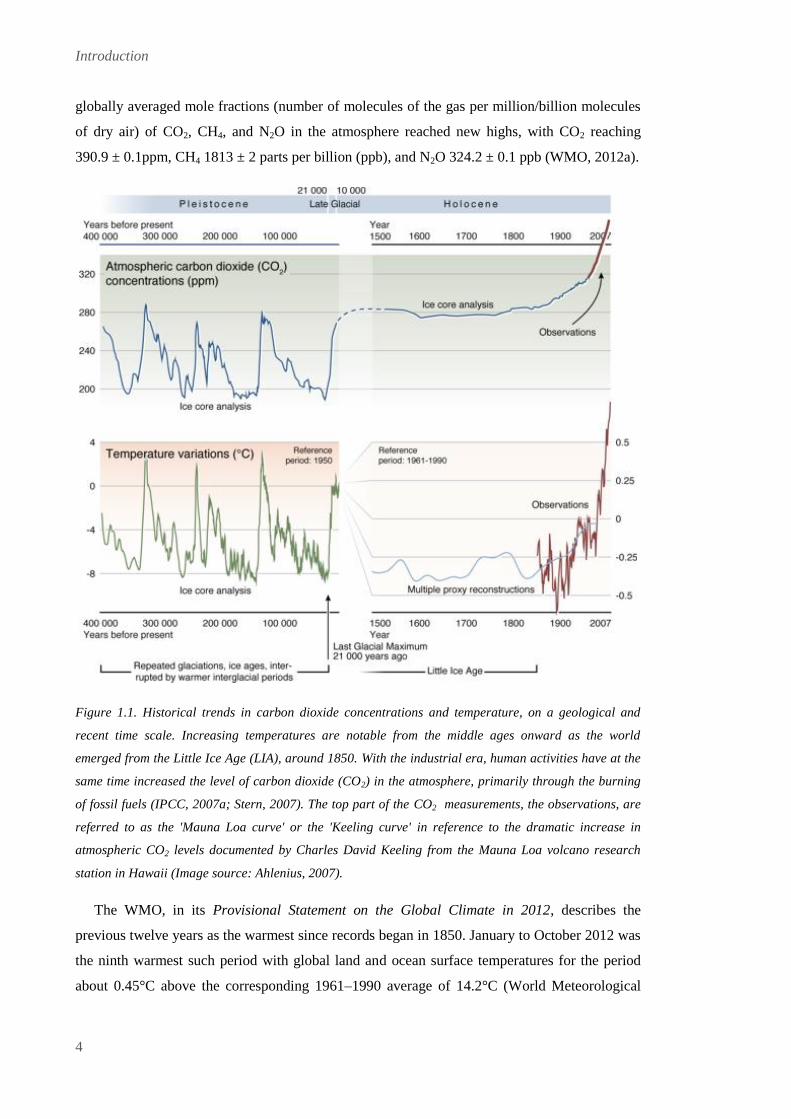
estimates for the affected portion of the permafrost differ widely (Table 1.1). A more immediate
impact will be felt in the form of damage to infrastructure and buildings which rely on the
permafrost as a solid foundation. A report by Larsen et al. from 2007 attempts to estimate the
additional economic costs for infrastructure in Alaska, concluding that the additional costs are
in the order of 10% - 15% (Figure 1.2).
Table 1.1. Predicted decrease in near-surface permafrost area and increase in thickness of the active
layer (United Nations Environment Programme [UNEP], 2012)
Introduction
6
Figure 1.2. Additional infrastructure costs in Alaska due to thawing of the permafrost (Larsen et al.,
2007).
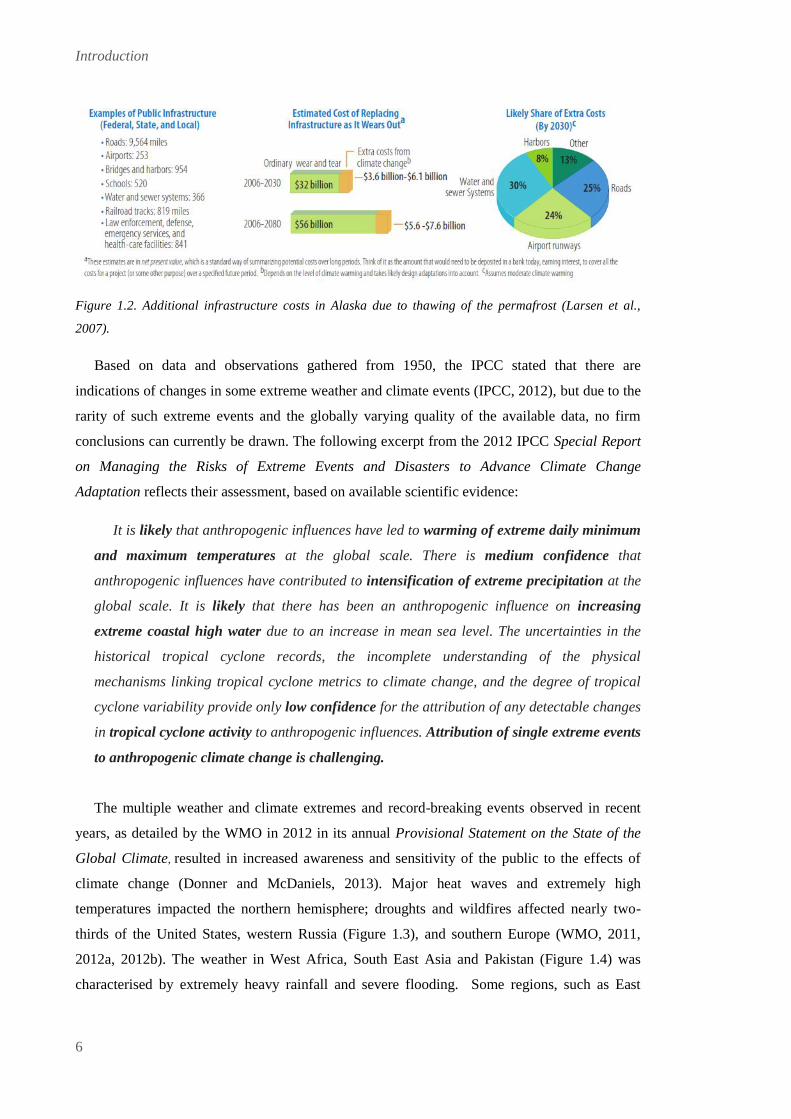
Based on data and observations gathered from 1950, the IPCC stated that there are
indications of changes in some extreme weather and climate events (IPCC, 2012), but due to the
rarity of such extreme events and the globally varying quality of the available data, no firm
conclusions can currently be drawn. The following excerpt from the 2012 IPCC Special Report
on Managing the Risks of Extreme Events and Disasters to Advance Climate Change
Adaptation reflects their assessment, based on available scientific evidence:
It is likely that anthropogenic influences have led to warming of extreme daily minimum
and maximum temperatures at the global scale. There is medium confidence that
anthropogenic influences have contributed to intensification of extreme precipitation at the
global scale. It is likely that there has been an anthropogenic influence on increasing
extreme coastal high water due to an increase in mean sea level. The uncertainties in the
historical tropical cyclone records, the incomplete understanding of the physical
mechanisms linking tropical cyclone metrics to climate change, and the degree of tropical
cyclone variability provide only low confidence for the attribution of any detectable changes
in tropical cyclone activity to anthropogenic influences. Attribution of single extreme events
to anthropogenic climate change is challenging.
The multiple weather and climate extremes and record-breaking events observed in recent
years, as detailed by the WMO in 2012 in its annual Provisional Statement on the State of the
Global Climate, resulted in increased awareness and sensitivity of the public to the effects of
climate change (Donner and McDaniels, 2013). Major heat waves and extremely high
temperatures impacted the northern hemisphere; droughts and wildfires affected nearly two-
thirds of the United States, western Russia (Figure 1.3), and southern Europe (WMO, 2011,
2012a, 2012b). The weather in West Africa, South East Asia and Pakistan (Figure 1.4) was
characterised by extremely heavy rainfall and severe flooding. Some regions, such as East

Introduction
7
Africa and Russia, were affected by multiple extreme events (WMO, 2012a). From late 2012 to
early 2013, Australia experienced record-breaking temperatures, bushfires, as well as intense
rainfall and flooding (Commonwealth of Australia, 2013). While these events are challenging to
causally link to global warming and GHG emissions as detailed by the IPCC, they find their
way into all levels of everyday society and politics as illustrated by their inclusion in the Press
et al. (2013) Australian Strategic Policy Institute, Special Report 49:
Climate change: The more severe effects of climate change, in particular the increase in
frequency and severity of natural disasters, compounded by competition over scarce natural
resources, may contribute to instability and tension around the globe, especially in fragile
states.
Figure 1.3. Satellite image of the heatwave of the Russian Federation (9 August 2010) (Image source:
NASA, 2010).
Figure 1.4.
Rainfall over Pakistan between 26
and 29 July 2010 (Image source:
Pakistan Meteorological
Department)

Introduction
8
The increased awareness of the general public and governments about the potential or real
economic and environmental costs of global warming, and further increases of GHGs drove the
implementation of the United Nations [UN] Kyoto Protocol in 1998 for the reduction of GHGs.
In recent years, more attention was directed to the impacts of climate change with the
implementation of emission limits (European Parliament and the Council of the European
Union [EU], 2001), carbon taxes (The Commonwealth of Australia, 2012), cap and trade
schemes (EU, 2013), or voluntary commitments for CO2 reduction (Aldy and Stavin, 2011).
1.1.2 Climate Mitigation Strategies
Carbon dioxide (CO2) is the largest contributor to increases in GHG concentrations, having
grown by about 80% (IPCC, 2007a). In order to limit temperature increases from pre-industrial
levels to 2°C, several global climate models suggest that atmospheric concentrations of GHG
must be stabilised at 450ppm of CO2-e by 2050 (IPCC, 2007a). In 2013, at the World Economic
Forum in Davos, Lord Stern said that he underestimated the risks in 2007, and should have been
more “blunt” about the threat to the economy from rising temperatures in The Stern Review: The
Economics of Climate Change. The Review indicated a 75% chance of global temperatures
rising by 2°C - 3°C, but Lord Stern now believes it will rise by 4°C – 5°C, as the atmosphere
and planet are not absorbing as much carbon as expected, and CO2 emissions are rising strongly
(Stewart and Elliott, 2013). Recent studies and failed climate negotiations highlight that it is
unlikely global average temperatures will be restricted to a rise of below 2°C with the current
trajectory of CO2 emissions (Peters et al., 2012; UNFCCC, 2011). Peters et al. state that
“Unless large and concerted global mitigation efforts are initiated soon, the goal of
remaining below 2°C will very soon become unachievable.”
On the other hand, a recent article in The Economist (2013) notes that other recent studies
observe that global mean temperatures have not risen as predicted (Figure 1.5) (Stott et al.,
2013) although GHG concentrations continue to rise. The 2007 IPCC Report on Climate
Change: The Physical Science Basis estimates that global temperatures would increase from
pre-industrial times in the range of 2°C to 4.5°C, with a best estimate around 3°C and an
increase of less than 1.5°C would be very unlikely. However, numerous researchers have
modelled various predictions revising the sensitivity down to a range from 1.2° to 4.1°C (The
Economist, 2013).

Introduction
9
Figure 1.6. Stabilization Triangle Model (Image source: Pacala and
Socolow, 2004).
In 2004, Pacala and Socolow published their Stabilisation Triangle Model (Figure 1.6),
outlining in a schematic manner a set of suggested measures to restrict the atmospheric CO2
concentration to 500+/-50 ppm (less than twice the pre-industrial concentration of 280 ppm).
The difference between a business-as-usual scenario and a constant 2004 base level is reflected
by the Stabilisation Triangle. The Triangle is subdivided into seven wedges, each representing a
current technology with a reduction potential of 1 Gigatonnes of carbon per year (GtCpa) by
2054 (Figure 1.6). Mitigation technologies include building, vehicle and coal-plant efficiencies,
use of nuclear power, and
renewables such as wind,
carbon capture and
sequestration, biofuels, and
several natural sink
wedges (afforestation,
biofuel energy plantations,
and no till/conservation
tillage systems). Although
mitigation strategies have
been recommended by
various international
bodies to address climate
Figure 1.5.
Mismatch between
computer modelled
predictions of rising global
mean temperatures in °C
and actual data recorded
(Image source: The
Economist, adapted from
Stott et al., 2013).

Introduction
10
change and offset the effects of GHGs, such measures have not been undertaken in the volumes
necessary (Brito and Stafford Smith, 2012; IEA, 2008; Global CCS Institute, 2012).
1.1.3 Carbon Capture and Sequestration
Definition
Carbon capture and sequestration (CCS), refers to the capture of carbon dioxide from the
atmosphere and its transfer into other carbon forms including oceanic, pedologic (soils), biotic
(plants and animals) and geological formations, for long term storage. The principal global
carbon stores and movement of carbon among these reservoirs (fluxes) are illustrated in Figure
1.6. Capture and sequestration of atmospheric CO2 can be achieved through engineered means
(e.g. chemical trapping of CO2 from industrial flue gases), or abiotic (mineralisation) and biotic
processes (photosynthesis). For the remainder of this thesis, I will use the terms carbon
sequestration and CCS interchangeably for engineered, abiotic and biotic methods.
Figure 1.7. Principal global carbon pools and fluxes between them. SOC = soil organic carbon (humus,
inert charcoal, plant and animal residues, microbiota). SIC = soil inorganic carbon (elemental carbon,
carbonate minerals, e.g. calcite, primary and secondary carbonates). Carbon pool sizes are given in
petagrams (Pg), which are also known as a Gigaton (Gt). A petagram is equal to one quadrillion
(1,000,000,000,000,000 or 1015
) grams (g). The transfer of carbon fluxes are shown in Pg per annum (Pg
pa) (adapted from Lal, 2008).

Introduction
11
The CCS option covers a diverse range of technologies. For example, ocean fertilisation
technologies aim to spur the growth of plankton by the addition of nutrients and increase the
dead biomass and naturally sequestered CO2 at the ocean floor. Biofuel production aims to
provide a carbon neutral or negative energy source by using biomass as the basis for fuel
generation instead of hydrocarbons. The conversion of any bio-material into biochar creates a
material with very high carbon content which can be used as a fuel, for soil enrichment, or as a
space efficient long term storage solution. One of the most promising options is carbon capture
and storage in geological formations (Geosequestration). Geosequestration involves the capture
of CO2 at industrial emission source points (coal-fired power generation, steel, chemical,
fertiliser, cement, mineral, or LNG plants), and transport of the captured CO2 via pipeline or
alternative method to suitable sites for underground injection and long-term geological storage.
According to the IEA 2008 Report, CCS in geological formations may be capable of accounting
for about 20% of the recommended CO2 emissions reduction by 2054. But significant
challenges to widespread adoption remain with very slow progress since 2004.
1.1.4 Portfolio Approach
Many people in society desire to mitigate the risks of climate change by reducing industrial
carbon dioxide (CO2) emissions while preserving access to fossil fuel energy sources. Most
projections estimate fossil fuels will continue to be the primary source of energy until at least
2050 (IPCC, 2005; IEA, 2008). Global energy demand, mainly from electricity generation, is
forecast to increase 35% for the period 2010 to 2040, with developing nations expected to
account for 65% of the rise (ExxonMobil, 2013).
All of the currently proposed CCS technologies to mitigate atmospheric GHG face barriers
to wide scale commercial adoption. A multitude of reasons can be found for this, including
industrial readiness and feasibility of possible mitigation technologies which originate from a
widely diverse range of scientific and technical/engineering disciplines. Feasibility could also
be related to economic, capacity, legal or social acceptance issues. The challenges and
uncertainties involved in the implementation of CCS technologies suggest industry and
governments should manage their risk exposure by utilising a portfolio of CO2 sequestration
technologies to spread the risk, rather than relying on a single method (Grubb, 2004). The risk
associated with reliance on a single CCS option is illustrated by the challenges Statoil
encountered with the Snøhvit Project. Due to lower reservoir permeability than originally
predicted, CO2 injectivity was also lower, resulting in decreased injection rates for the processed

Introduction
12
CO2 from the liquefied natural gas (LNG) plant (Molde, 2011). This significantly impacted the
project on both technical and economic levels as the operator did not have an alternate storage
option or carbon offset strategy to rely upon.
The risk-reward assessment by a project operator may vary widely depending upon its
dependency on a project or overall corporate strategy. For example, an operator who has the
opportunity to vent CO2 even if a penalty must be paid, or who can rely upon carbon reduction
credits generated from other CCS technologies in its carbon management strategy, is likely to be
more risk tolerant than an operator who has to stop or reduce production in the case of lower
than anticipated CO2 storage volumes. I suggest that rather than committing only to one solution
such as Geosequestration, a diversified portfolio approach may provide a lower risk exposure
and better outcomes.
1.1.5 Specific Needs of Liquefied Natural Gas (LNG) Operators on the
North West Shelf of Australia
Increased regulatory requirements and the introduction of a carbon tax are concerns for oil
and gas (O&G) operators, and more specifically for LNG operators as they consider
investments of approximately AUD250 billion to develop the multiple giant gas fields of the
North West (NW) Shelf of Australia (Lumley, 2010). The fields contain more than 150 trillion
cubic feet (Tcf) of natural gas which is intended for export via LNG (Geoscience Australia and
Bureau of Resources and Energy Economics (BREE), 2012). As some of these offshore gas
fields, such as the Greater Gorgon field in the Carnarvon Basin, and the Browse and Bonaparte
Basins, can be characterised by a high CO2 content, for example, up to 27% for Evans Shoal
(Geoscience Australia, 1998; Lumley, 2010), operators of these fields face the challenge of
disposing of the produced CO2, either by venting, which may become more heavily regulated in
the future, or by implementing a more climate friendly solution.
To offset the potentially substantial costs of a carbon tax on emissions (high CO2 content and
LNG processing), operators need an affordable option that is deployable in remote areas.
Ideally, such a solution can take advantage of existing technology and experience, with limited
additional infrastructure build, and readily available storage sites. As an alternative to
atmospheric venting, operator Chevron and its joint venture partners of the Gorgon Project,
being undertaken to develop the Gorgon and Jansz-lo Gas Fields on the NW Shelf, have opted
for Geosequestration. The CO2 Injection Project will inject up to 4.1 million tonnes per annum
Introduction
13
(Mtpa) of CO2 from the ~15% CO2 content in the raw gas into the Dupuy Formation, which is
about 2200 metres below Barrow Island, a Class A Nature Reserve (Scott et al., 2010).
1.2 RESEARCH OBJECTIVES
To facilitate the most effective targeting of investment funds and research efforts, as well as
manage the risk exposure across a variety of projects, both governments and industry need
quantitative methods to assess and compare carbon capture and sequestration (CCS)
technologies in order to rank, prioritise and make sound policy and investment decisions.
Proposed CCS methods for the stabilisation of atmospheric CO2 levels need to be analysed for
technology and project risks across a range of factors, from the socio-economic to the purely
scientific or technical. The many factors impacting the wide scale commercial adoption of CCS
methods need to be analysed within a consistent framework.
The main objective of this thesis is to develop a CCS technology assessment method, and
use it to make recommendations for an optimum carbon dioxide emissions reduction portfolio.
This general objective contains several more specific goals: 1) To identify the critical
parameters affecting commercial uptake and barriers to adoption of carbon capture and
sequestration technologies; 2) To develop a semi-quantitative methodology to assess qualitative
and quantitative data across various scientific and engineering disciplines for carbon
management decision-making/risk assessment; 3) To identify, compare and analyse the current
state and feasibility of carbon emission reduction technologies from a general global
perspective; 4) To rank carbon sequestration methods to better target scientific, industry and
governmental investment funds, policy, and research and development (R&D) efforts; 5) To
improve the understanding of, and differences between, carbon sequestration technologies and
the barriers to adoption for each, 6) To make recommendations for a diversified portfolio mix
for LNG operators on the North West Shelf of Australia.
1.3 THESIS ORGANISATION
This thesis consists of five chapters, including this Introduction. The second chapter covers
the development process of the semi-quantitative methodology which can be used to evaluate
and compare carbon sequestration technologies from multiple disciplines in a general or site-
specific manner. Examples are given to demonstrate how to apply the methodology. In the third

Introduction
14
chapter, I apply the methodology to Geosequestration. Chapter 4 evaluates two alternative
carbon sequestration technologies, Algae CCS and Biochar CCS. Chapters 3 and 4 include a
separate discussion and conclusion for each specific technology. The Discussion and
Conclusions Chapter provides a synthesis of the methodology and suggests directions for
further improvements. The three CCS technologies are compared to each other and conclusions
given. Portfolio recommendations are provided for LNG operators to consider when planning
their carbon management strategy and investments. References are provided at the end of each
chapter.
Certain content from my thesis has been presented at conferences and seminars, and is
included in the 2013 paper by Young-Lorenz and Lumley.
Introduction
15
REFERENCES
Abram, N.J., Mulvaney, R., Wolff, E.W., Triest, J., Kipfstuhl, S., Trusel., L.D., Vimeux, F., Fleet, L. and
Arrowsmith, C. (2013), Acceleration of snow melt in an Arctic Peninsula ice core during the twentieth
century, Nature Geoscience, 6, 5, 404-411.
Ahlenius, H. (2007), Historical trends in carbon dioxide concentrations and temperature, on a geological
and recent time scale: from Collection: Global Outlook for Ice and Snow, UNEP/GRID-Arendal Maps
and Graphics Library. http://maps.grida.no/go/graphic/historical-trends-in-carbon-dioxide-
concentrations-and-temperature-on-a-geological-and-recent-time-scale (accessed 7 May 2011).
Arrhenius, S. (1896), On the Influence of Carbonic Acid in the Air upon the Temperature of the Ground,
Philosophical Magazine and Journal of Science, 5, 41, 237–276.
Brito, L. and Stafford Smith, M. (2012), State of the Planet Declaration: New Knowledge Towards
Solutions, in Proceedings of the Planet Under Pressure, 26 – 29 March, 2012, London.
The Commonwealth of Australia (2012), The Clean Energy Legislative Package: The Commonwealth
of Australia. http://www.climatechange.gov.au/en/government/clean-energy-future/legislation.aspx
(accessed 12 August 2012).
Commonwealth of Australia (2013), The Angry Summer, [Steffan, W. (Climate Commission)],
Commonwealth of Australia, Department of Climate Change and Energy Efficiency, Canberra, ACT,
Australia.
Donner, S.D. and McDaniels, J. (2013), The influence of national temperature fluctuations on opinions
about climate change in the U.S. since 1990, Climactic Change, 118, 3-4, 537–550.
Exxon Mobil (2013), The Outlook for Energy: A View to 2040: Exxon Mobil Corporation, Texas, USA.
Forster, P., Ramaswamy, V., Artaxo, P., Berntsen, T., Betts, R., Fahey, D.W., Haywood, J., Lean, J.,
Lowe, D.C., G. Myhre, G., Nganga, J., Prinn, R., Raga, G., Schulz, M. and Van Dorland, R., (2007),
Changes in Atmospheric Constituents and in Radiative Forcing. In: Climate Change 2007:The
Physical Science Basis. Contribution of Working Group I to the Fourth Assessment Report of the
Intergovernmental Panel on ClimateChange [Solomon, S., D. Qin, M. Manning, Z. Chen, M.
Marquis, K.B. Averyt, M.Tignor and H.L. Miller (eds.)]. Cambridge University Press, Cambridge,
UK and New York, NY, USA.
Introduction
16
Geoscience Australia and Bureau of Resources and Energy Economics [BREE] (2012), Australian
Gas Resource Assessment 2012: [Bradshaw, M. and Hall, L. (Geoscience Australia), Copeland, A.,
and Hitchins, N. (BREE)], Canberra, ACT, Australia.
Geoscience Australia (1998), Well Report – The Summary: Evans Shoal 2: Canberra, ACT, Australia.
Global CCS Institute (2011), The Global Status of CCS: 2010, Global CCS Institute, Canberra, ACT,
Australia.
Global CCS Institute (2012), The Global status of CCS: 2012: Global CCS Institute, Canberra, ACT,
Australia.
Grubb, M. (2004), Technology Innovation and Climate Change Policy: An Overview of Issues and
Options: Keio Economic Studies, 41, 2, 103-132.
International Energy Agency [IEA] (2008a), CO2 capture and storage: A key carbon abatement option:
International Energy Agency, OECD, Paris, France.
Intergovernmental Panel on Climate Change [IPCC] (2005), Intergovernmental Panel on Climate
Change Special Report on Carbon Dioxide Capture and Storage: Prepared by Working Group III of
the Intergovernmental Panel on Climate Change [Metz, B.O., Davidson, H., de Coninck, C., Loos, M.
and Meyer, L.A. (eds.)]: Cambridge University Press, Cambridge, United Kingdom and New York,
NY, USA.
Intergovernmental Panel of Climate Change [IPCC] (2007a), Climate Change 2007: The Physical
Science Basis: Contribution of Working Group I to the Fourth Assessment Report of the
Intergovernmental Panel on Climate Change, [Solomon, S., Qin, D., Manning, M., Marquis, M.,
Averyt, K., Tignor, M. M. B., Miller Jr., H.L., and Chen, Z.], Cambridge University Press,
Cambridge, UK and New York, NY, USA.
Intergovernmental Panel on Climate Change [IPCC] (2007b), Climate Change 2007: Mitigation:
Contribution of Working Group III to the Fourth Assessment Report of the Intergovernmental Panel
on Climate Change, [Metz, B., Davidson, O., Bosch, P., Dave, R. and Meyer, L. (eds.)], Cambridge
University Press, Cambridge, UK and New York, NY, USA.
Intergovernmental Panel on Climate Change [IPCC] (2012), Summary for Policymakers. In:
Managing the Risks of Extreme Events and Disasters to Advance Climate Change Adaptation: A
Special Report of Working Groups I and II of the Intergovernmental Panel on Climate Change, [Field,
C.B., Barros, V., Stocker, T.F., Qin, D., Dokken, D.J., Ebi, K.L., Mastrandrea, M.D., Mach, K.J.,
Plattner, G.K., Allen, S.K., Tignor, M., and Midgley, P.M. (eds.)]. Cambridge University Press,
Cambridge, UK, and New York, NY, USA, 1-19.

Introduction
17
Koç, N., Njåstad, B., Armstrong, R., Corell, R.W., Jensen, D.D., Leslie, K.R., Rivera, A., Tandong, Y.
and Winther, J.G. (eds.) (2009), Melting Snow and Ice: A Call for Action, Centre for Ice, Climate and
Ecosystems, Norwegian Polar Institute, Polar Environmental Centre, Tromsø, Norway.
Larsen, P., Goldsmith, S., Smith, O., Wilson, M., Strzepek, K., Chinowsky, P. and Saylor, B. (2007),
Estimating Future Costs for Alaska Public Infrastructure at Risk to Climate Change: ISER Report,
Institute of Social and Economic Research, University of Alaska, Anchorage, AK, USA.
Lumley, D. (2010), 4D seismic monitoring of gas production and CO2 sequestration, North West
Australia: PESA News Resources, 104, 14-17.
Molde, A.I. (2011), Reservoaret klarer ikke mer Snøhvit-CO2: Petro.no: 20 May 2011.
http://www.petro.no/modules/module_123/proxy.asp?C=14&I=16697&D=2&mid=195 (accessed 26
May 2011).
Pacala, S., and Socolow, R. (2004), Stabilization Wedges: Solving the climate problem for the next 50
years with current technologies: Science, 305, 5686, 968-972.
Peters, G.P., Andrew, R.M., Boden, T., Canadell, J.G., Ciais, P., Le Quéré, C., Marland, G., Raupach,
M.R. and Wilson, C. (2012), The challenge to keep global warming below 2 [deg] C: Nature Climate
Change [opinion and comment][advance online publication], 1-3.
Plumer, B. (2012), When will the Arctic be ice-free in the summer? Maybe four years. Or 40: The
Washington Post, 20 September 2012.
http://www.washingtonpost.com/blogs/wonkblog/wp/2012/09/20/when-will-the-arctic-be-ice-free-
maybe-four-years-or-40/ (accessed 22 March 2013).
Press, T., Bergin, A. and Garnsey, E. (2013), Heavy weather: Climate and the Australian Defence Force:
Special Report Issue 49, Australia Strategic Policy Institute, Canberra, ACT, Australia.
Scott, K.C., Parker, D.J., Trupp, M., and Clulow, B. (2010), Setting New Environmental, Regulatory, and
Safety Benchmarks: The 2009 Gorgon CO2 3D Baseline Seismic Project, Barrow Island, Western
Australia: in Proceedings of the SPE Asia Pacific Oil and Gas Conference and Exhibition, edited,
Brisbane, Queensland, Australia.
Stern, N. (2007), The Stern Review: The Economics of Climate Change, Cambridge University Press,
Cambridge, UK.
Stewart, H., and Elliott, L., (2013) , Nicholas Stern: 'I got it wrong on climate change – it's far, far
worse': The Observer, 26 January 2013.
Introduction
18
http://www.guardian.co.uk/environment/2013/jan/27/nicholas-stern-climate-change-
davos?goback=.gde_67451_member_208430439 (accessed 28 January 2013).
Stott, P., Good, P., Jones, G., Gillett, N., and Hawkins, E. (2013), The upper end of climate model
temperature projections is inconsistent with past warming: Environmental Research Letters, 8, 1,
014024.
The Economist (2013), A sensitive matter: The Economist – Climate Science, [from the print edition], 30
March 2013. http://www.economist.com/news/science-and-technology/21574461-climate-may-be-
heating-up-less-response-greenhouse-gas-emissions (accessed 19 April 2013).
United Nations Environment Programme [UNEP] (2012), Policy Implications of Warming
Permafrost: [Report], United Nations Environment Programme, Nairobi, Kenya.
http://www.unep.org/pdf/permafrost.pdf (accessed 22 March 2013).
United Nations Framework Convention on Climate Change [UNFCCC] (2011), Establishment of an
Ad Hoc Working Group on the Durban Platform for Enhanced Action: Report of the Conference of
the Parties on its seventeenth session:United Nations Framework Convention on Climate Change,
CP/2011/9/Add.1. http://unfccc.int/resource/docs/2011/cop17/eng/09a01.pdf#page=2 (accessed 21
February 2013).
World Meteorological Organisation [WMO] (2011), Weather Extremes in a Changing Climate:
Hindsight on Foresight; World Meteorological Organisation, WMO-1075.
World Meteorological Organisation [WMO] (2012a), Greenhouse Gas Bulletin: The State of
Greenhouse Gases in the Atmosphere Based on Global Observations through 2011, World
Meteorological Organisation, No. 8.
World Meteorological Organisation [WMO] (2012b), Provisional Statement on the State of Global
Climate in 2012: presented at the 18th Conference of the Parties to the United Nations Framework
Convention on Climate Change (UNFCCC).
World Meteorological Organisation [WMO] (2012c), 2012: Record Arctic Sea Ice Melt, Multiple
Extremes and High Temperatures, Press Release No. 966, 18th Conference of the Parties to the
United Nations Framework Convention on Climate Change.
Young-Lorenz, J.D. and Lumley, D. (2013), Portfolio analysis of carbon sequestration technologies and
barriers to adoption: General methodology and application to geological storage: Energy Procedia, 37,
5063-5079.
Methodology Development
19
CHAPTER 2
METHODOLOGY DEVELOPMENT
OVERVIEW
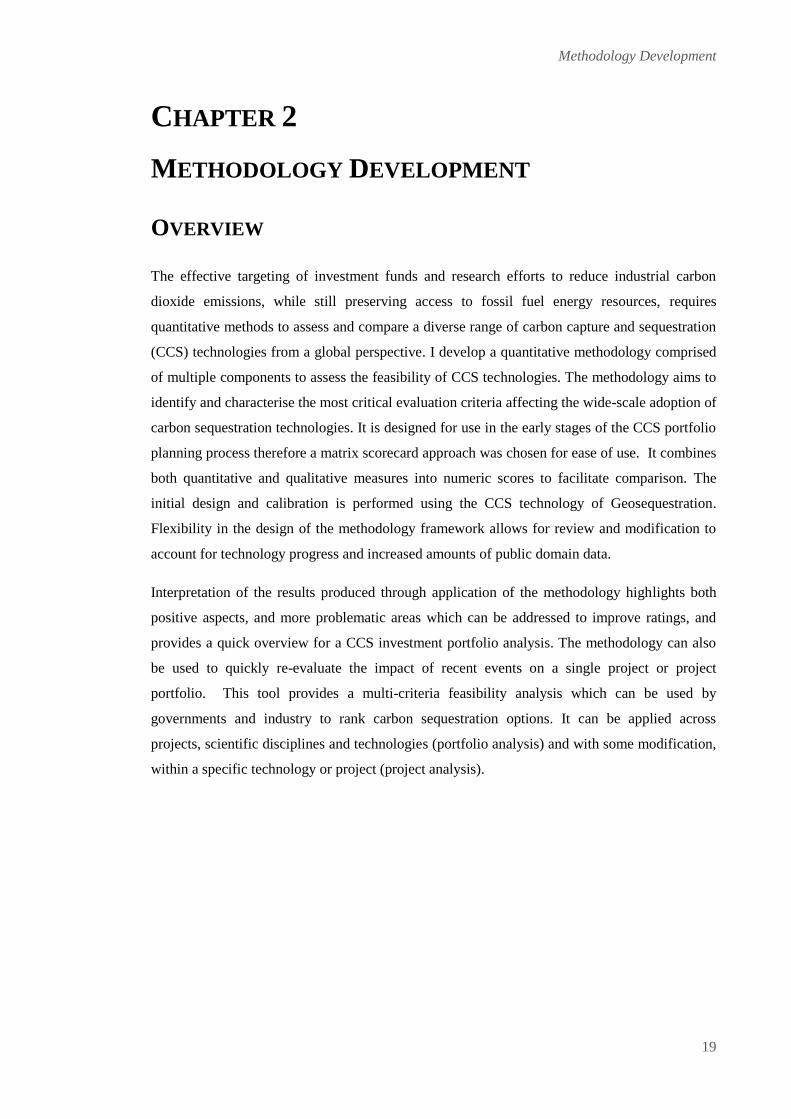
The effective targeting of investment funds and research efforts to reduce industrial carbon
dioxide emissions, while still preserving access to fossil fuel energy resources, requires
quantitative methods to assess and compare a diverse range of carbon capture and sequestration
(CCS) technologies from a global perspective. I develop a quantitative methodology comprised
of multiple components to assess the feasibility of CCS technologies. The methodology aims to
identify and characterise the most critical evaluation criteria affecting the wide-scale adoption of
carbon sequestration technologies. It is designed for use in the early stages of the CCS portfolio
planning process therefore a matrix scorecard approach was chosen for ease of use. It combines
both quantitative and qualitative measures into numeric scores to facilitate comparison. The
initial design and calibration is performed using the CCS technology of Geosequestration.
Flexibility in the design of the methodology framework allows for review and modification to
account for technology progress and increased amounts of public domain data.
Interpretation of the results produced through application of the methodology highlights both
positive aspects, and more problematic areas which can be addressed to improve ratings, and
provides a quick overview for a CCS investment portfolio analysis. The methodology can also
be used to quickly re-evaluate the impact of recent events on a single project or project
portfolio. This tool provides a multi-criteria feasibility analysis which can be used by
governments and industry to rank carbon sequestration options. It can be applied across
projects, scientific disciplines and technologies (portfolio analysis) and with some modification,
within a specific technology or project (project analysis).

Methodology Development
20

Methodology Development
21
2.1 INTRODUCTION
Many people in society desire to mitigate the risks of climate change by reducing industrial
carbon dioxide (CO2) emissions while preserving access to fossil fuel energy sources. Industrial
carbon emitters are faced with increasing regulation and carbon tax or debt while the available
carbon sequestration options face significant challenges and uncertainties. To facilitate the most
effective targeting of CCS investment funds and research efforts, both governments and
industry need quantitative methods to assess and compare CCS technologies in order to rank,
prioritise and make sound policy and investment decisions. Proposed CCS methods for the
stabilisation of atmospheric CO2 levels need to be analysed for project risks across a range of
factors, from the socio-economic to the purely technical. No easy-to-use reference methodology
to review or analyse CCS technologies was identified in a public domain literature search. The
goal of this thesis is to develop such a methodology in a quantitative format.
I develop a semi-quantitative methodology framework and matrix scorecard rating system
utilising a strategy similar to an “inversion by forward modelling” (Boschetti and Moresi, 2001)
or manual inversion approach. The methodology under development is used to create a
prediction (synthetic dataset) about the probability of success of a given technology and the
result is compared to an expectation scenario based on case studies or current understanding of a
technology. If differences are present, a manual update of the methodology is performed after
analysis of the causes of the differences. In order to develop a methodology to rate and rank the
most feasible options, I define the following objectives:
1. Identification of common critical parameters affecting the uptake of CCS technologies
at commercial scales
2. Identification of common measures or metrics applicable to evaluate CCS technologies
from a variety of scientific and engineering disciplines
3. Ease-of-use and reference
4. Flexibility for updating of the methodology
5. Application across scientific disciplines and technologies (scope - portfolio analysis)
6. Adaptable for application across projects (scope - project analysis within a CCS
technology)
Achieving these objectives requires an iterative process with ongoing research and review,
with possible updates to the model and methodology components, due to the rapidly changing
development cycle stages and diversity of CCS technologies. The iterative process is limited to
the updating of the model to ensure relevance and applicability for all CCS technologies.
Methodology Development
22
2.2 MULTI-CRITERIA METHODOLOGY DEVELOPMENT
I have developed this technique by conducting an extensive review of the literature and
project case studies, gathering data, developing a model and rating system in an iterative
manner, and providing a new method of analysis. I identified and grouped the parameters
affecting the wide-scale adoption of CCS technologies into six critical evaluation criteria (Table
2.1): 1) public acceptance, 2) regulatory frameworks, 3) economics, 4) science and technology,
5) storage quality, and 6) environmental impact.
These key evaluation criteria are selected because they have the most impact on whether a
carbon sequestration project or technology will proceed, suffer delays, or be implemented at a
commercial and widespread scale. They must also be general enough to be applicable to all
possible CCS technologies. For instance, as the goal of the methodology is to assess and
compare divergent technologies, during the iterative process to determine critical evaluation
criteria relevant to all CCS technologies, a criterion such as long-term liability would not
qualify as such, because this specific challenge is limited to Geosequestration. This particular
issue would still be analysed under the evaluation criteria of Economics and Regulatory
Frameworks. In this section I briefly define the evaluation criteria, and in later sections discuss
and provide case studies for illustration as to how to use the rating system and assign scores.
Table 2.1. The identified evaluation criteria affecting widescale adoption of carbon sequestration
technologies.

Methodology Development
23
Criterion 1: Public Acceptance
“Public Acceptance” refers to public, political and other stakeholder acceptance and is
increasingly seen by governments and industry as crucial to CCS technology adoption. This is
one of the main reasons for demonstration projects, such as the Mid-West Midwest Regional
Carbon Sequestration Project in Greenville, Ohio, USA, being cancelled at late stages after
years of investment from multiple stakeholders (Kessler, 2009). Stakeholders for carbon
sequestration technologies cover a diverse range of individuals and organisations, ranging from
the business community to individual property owners. Some examples of stakeholders are
given in Table 2.2.
Table 2.2. Some examples of stakeholder diversity under the “Public Acceptance” criterion for carbon
sequestration technologies and projects. This list is not exhaustive but included to provide a general idea
of the broad range of individuals and organisations affected.
Criterion 2: Regulatory Frameworks
“Regulatory Frameworks” describes a system of rules and the means of enforcement that can
favour or impede the uptake of CCS technologies. They are established by local, state and
federal governments as well as international bodies to regulate a specific activity and range from
the ease of land access, to policies for monitoring and remediation. Table 2.3 lists some
associated issues included under Regulatory Frameworks.

Methodology Development
24
Table 2.3. A range of associated issues related to “Regulatory Frameworks” which affect the uptake of
carbon sequestration technologies.
Criterion 3: Economics
“Economics” refers to the economic and financial aspects affecting CCS technologies,
projects and investment (Table 2.4). Individual projects must be profitable to provide the
necessary capital expenditure (CAPEX) and ongoing operational expenditure (OPEX). This can
be achieved as a stand-alone business, by trading in carbon credits, or through large scale
government incentives.
Criterion 4: Science and Technology
“Science and Technology” refers to the available knowledge and experience in research,
design and development (R&D) activities, and the ability to demonstrate the scientific concepts
and engineering solutions at different scales in the lab, and in the field for demonstration and
commercial scale projects. It includes the understanding of the impact of a CCS technology in
mitigating atmospheric CO2 associated with the implementation of such a technology.
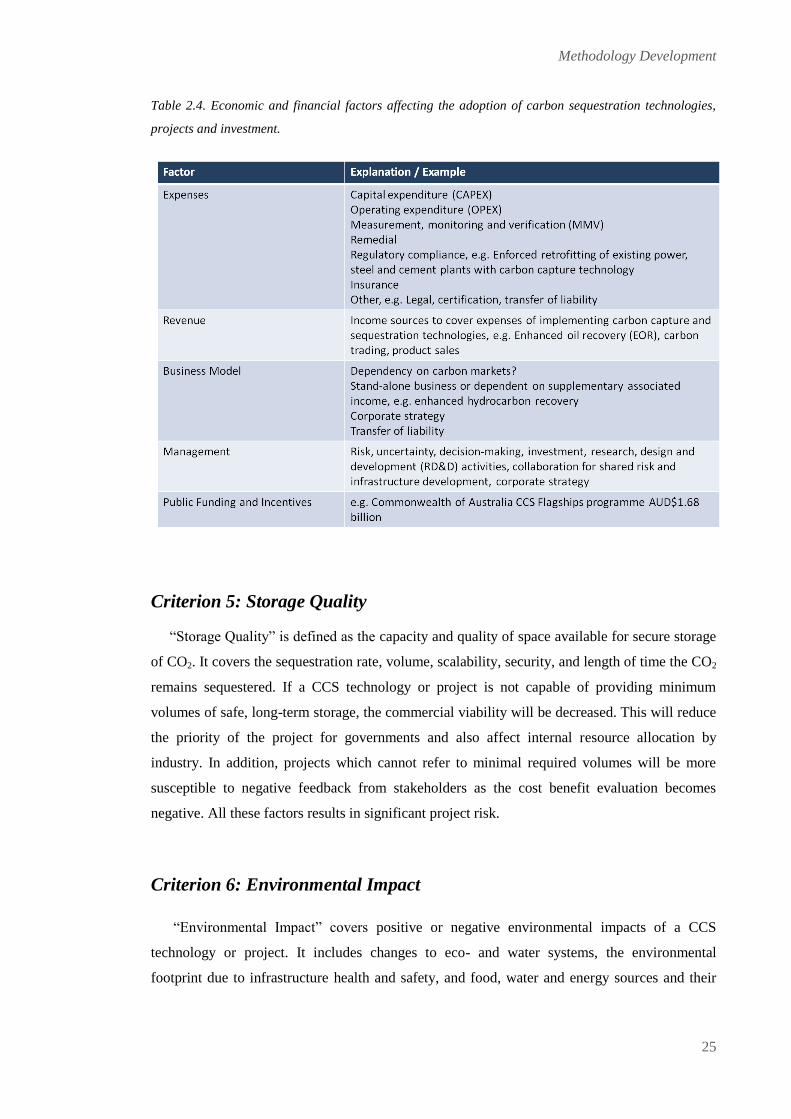
Methodology Development
25
Table 2.4. Economic and financial factors affecting the adoption of carbon sequestration technologies,
projects and investment.
Criterion 5: Storage Quality
“Storage Quality” is defined as the capacity and quality of space available for secure storage
of CO2. It covers the sequestration rate, volume, scalability, security, and length of time the CO2
remains sequestered. If a CCS technology or project is not capable of providing minimum
volumes of safe, long-term storage, the commercial viability will be decreased. This will reduce
the priority of the project for governments and also affect internal resource allocation by
industry. In addition, projects which cannot refer to minimal required volumes will be more
susceptible to negative feedback from stakeholders as the cost benefit evaluation becomes
negative. All these factors results in significant project risk.
Criterion 6: Environmental Impact
“Environmental Impact” covers positive or negative environmental impacts of a CCS
technology or project. It includes changes to eco- and water systems, the environmental
footprint due to infrastructure health and safety, and food, water and energy sources and their
Methodology Development
26
security. These impacts may be restricted to the immediate vicinity, or could impact locations at
significant distances from the source CCS technology activity. The concerns about any CS
technology are whether any side effects are unanticipated or could cause irreversible damage to
the environment. Baseline measurements, appropriate modelling, measurement monitoring and
verification (MMV), and remediation measures must be in place to predict and counter such
negative effects should they occur.
2.3 MODEL DEVELOPMENT PROCESS
The methodology aims to provide an assessment tool for a wide range of technologies, so it
has to account for the differences between the technologies without rendering the comparison
process completely arbitrary. To achieve this goal, an iterative approach is used to update the
methodology model. If differences are present between the expectation or reference data set and
the predicted outcome of the methodology application, updates to the model may include
redefinition of a sub-criterion or revision of sub-criteria measures. This is necessary as only one
well documented technology was available to calibrate the model against commercial scale case
studies, Geosequestration. All the other technologies dealt with an expectation scenario which
was derived from various sources but could not be ground truthed against the actual
performance of commercial scale deployments.
The general sequence of the methodology development first identified the critical parameters
(evaluation criteria) across which all technologies should be compared (as introduced in Section
2.2). The criteria and sub-criteria are then defined for which the given technology should be
ranked. The latter stage also comprises definitions of the cut-off points for the ranking.
Wherever possible, quantitative cut-off measures are preferred to qualitative measures. After
this procedure was performed for Geosequestration, and reflected the current status as given by
case studies and other data, the resulting outcome was applied to the next CCS technology. If
this application did not provide the indicated results as documented in the available literature
(the expectation scenarios) for this or any of the following technologies assessed, the process
was iterated. In this iteration, the evaluation criteria and sub-criteria were modified and the
initial calibration against Geosequestration repeated. Passing this stage, the modified evaluation
criteria and sub-criteria, were then applied to Algae CCS and Biochar CCS. Any further
mismatch between expectation scenarios for technologies and the assessment outcome resulted
in a new iteration.
Methodology Development
27
Figure 2.1 shows a simplified chart of the process which is discussed in this section. To
calibrate this process and define reference points, Geosequestration is used as the initial CCS
technology due to its more advanced stage of development, and associated larger volume of data
and case studies available in comparison to other CCS technologies under evaluation. The steps
to develop the methodology model are as follows:
Step 1: Identify evaluation criteria
From the literature review of a range of CCS technologies, the evaluation criteria
affecting technology adoption are identified and defined. These criteria form the
basis across which all technologies in the Master Matrix (Figure 2.2) and the
Science and Technology Sub-Matrix are scored (Figure 2.3) and should be
applicable to all CCS technologies to ease comparison. These criteria are used to
define general cut-off points on a scale from 1 to 3, and used as the basis of the
rating system.
Step 2: Define Science and Technology Sub-Matrix
The scientific and engineering elements specific to a CCS technology are identified
and defined. The initial Science and Technology Sub-Matrix is calibrated with
Geosequestration which provides the model technology elements which the
Science and Technology Sub-Matrices for all other technologies should ideally
replicate to allow for comparison. Where this is not feasible because a technology
element proves to be irrelevant, e.g. injectivity for Biochar CCS, it is substituted
with a relevant technology element of equivalent purpose or importance. Under the
Sub-Matrix, the evaluation criterion for Science and Technology is named
Demonstrated/Ready to better reflect the characteristic being measured.
Step 3: Establish ranking system and sub-criteria
Identify the specific questions or issues to evaluate the technology’s status for the
specific sub-criteria. Each is scored on a scale of 1 to 3, and the
compilation/average of all answers form the numerical value for the specific
technology evaluation criterion. Relevant cut-off points for the CCS technologies
are introduced.
Step 4: Develop reference dataset/benchmark
Derive a reference data set against which the outcome of the ranking process
should be compared. In the case of Geosequestration, case studies were used to

Methodology Development
28
define an expectation scenario. For later steps when assessing CCS technologies
which have not left the laboratory stage, available data is used to extrapolate an
expectation outcome which should be reflected by the ranking process.
Step 5: Apply ranking system
The ranking system is applied and the derived numerical values for both Science
and Technology Sub-Matrix and Master Matrix values are compiled. These values
are then compared to the reference data set which is provided by the expectation
scenario or extrapolated expectation scenario. I evaluate how well the quantitative
assessment of the methodology in the form of the derived combination of criteria
and sub-criteria (test data) is reflected by, or matches, the reference dataset.
Step 6: Test dataset matches reference dataset?
The test dataset is calibrated with the benchmark. The evaluation of the outcome of
the comparison is not restricted purely to “match”/ “does not match”. If the
reference dataset matches the analysis outcome through the application of the
ranking system, the next technology will be evaluated. If this is not the case, the
“no match” outcome is present, a form of reality check is introduced before the
result is discarded. This point has proven necessary because of the lack of, or very
limited data and case studies for most CCS technologies. To account for this, an in-
depth analysis of the results of the ranking methodology is performed to ensure that
the critical points which cause the disconnect between the expectations scenario
and ranking are not due to overly optimistic or pessimistic assumptions in the
reference data set.
Step 6a: Test with next CCS technology
If the ranking is successfully applied to a specific CCS technology, i.e.
Geosequestration as the initial and calibrating entity, the next CCS technology will
be evaluated (from Step 1 onwards). The evaluation criteria and sub-criteria are
reviewed for applicability. If any of the criteria or sub-criteria are proven not to be
applicable to this new technology, the whole process is reinitiated, and iterated,
starting with Geosequestration, and the whole Matrix scoring system is updated
until it is relevant to the next technology being evaluated.
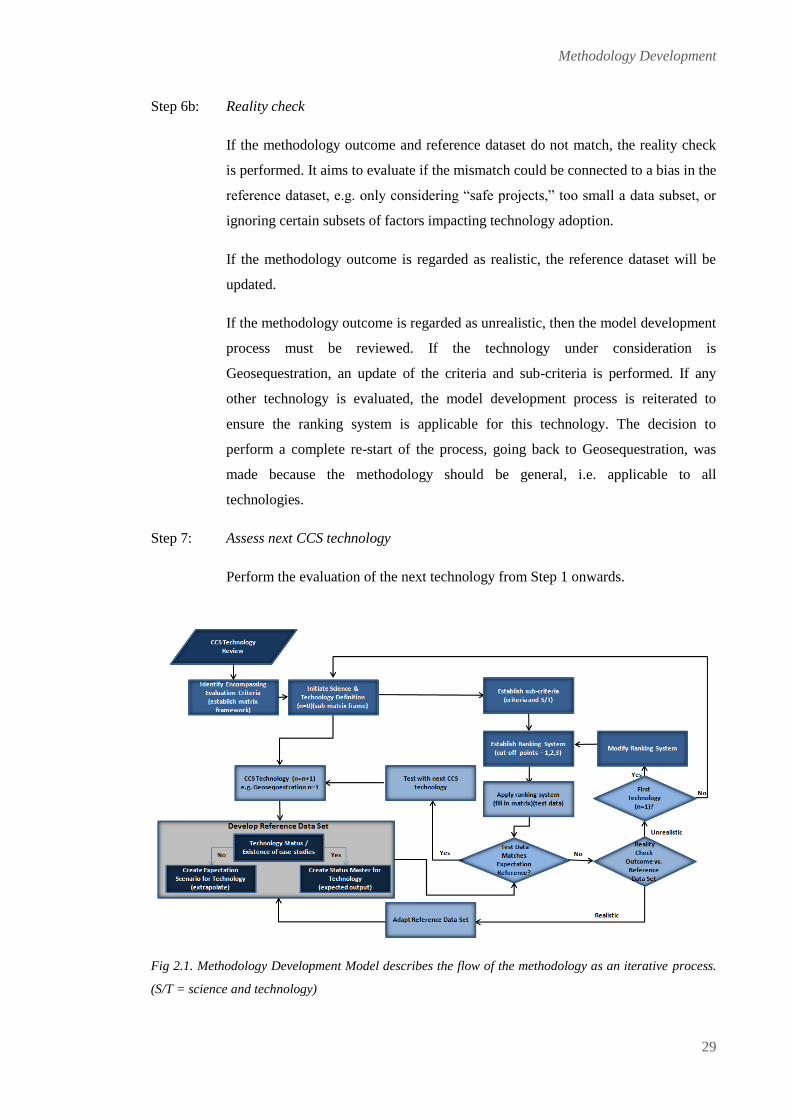
Methodology Development
29
Step 6b: Reality check
If the methodology outcome and reference dataset do not match, the reality check
is performed. It aims to evaluate if the mismatch could be connected to a bias in the
reference dataset, e.g. only considering “safe projects,” too small a data subset, or
ignoring certain subsets of factors impacting technology adoption.
If the methodology outcome is regarded as realistic, the reference dataset will be
updated.
If the methodology outcome is regarded as unrealistic, then the model development
process must be reviewed. If the technology under consideration is
Geosequestration, an update of the criteria and sub-criteria is performed. If any
other technology is evaluated, the model development process is reiterated to
ensure the ranking system is applicable for this technology. The decision to
perform a complete re-start of the process, going back to Geosequestration, was
made because the methodology should be general, i.e. applicable to all
technologies.
Step 7: Assess next CCS technology
Perform the evaluation of the next technology from Step 1 onwards.
Fig 2.1. Methodology Development Model describes the flow of the methodology as an iterative process.
(S/T = science and technology)

Methodology Development
30
Figure 2.2. Master Matrix Step 1: Identification of evaluation criteria, across which CCS technologies
and technical elements are scored in the Master Matrix and Science and Technology Sub-Matrix,
respectively.
Figure 2.3. Science and Technology Sub-Matrix.
2.4 FRAMEWORK COMPONENTS
Following the identification and grouping of the evaluation criteria, the results of my
research have led to the development of several methodology framework components which
operate together to comprise the whole ranking system. In addition to the iterative process (as
discussed in 2.3), I develop a ratings system to generate ratings from quantitative and qualitative
data, and a matrix scorecard framework that allows for ease of reference and application. In
developing a tool which can be easily utilised and referenced, a matrix scorecard format was
chosen because this framework is quickly accessed and understood. It also generates
quantitative numerical scores from lengthy qualitative data assessments thereby allowing for a
quick measure to compare projects, similar to the approach used to analyse 4D seismic project
feasibility (Lumley et al., 1997).

Methodology Development
31
Master Matrix Scorecard
The Master Matrix Scorecard acts as the primary portfolio analysis comparison tool of the
different CCS technologies. Each technology is ranked for each of the evaluation criterion, as
the same issues affect the adoption of all CCS methods. Behind the scenes is the Master Matrix
Spreadsheet Template where the calculations are made (Figure 2.4), averaging the total of the
six parameters to generate an overall risk rating for each of the analysed CCS technologies.
Figure 2.4. Master Matrix Spreadsheet Template
Sub-Matrix Scorecard (Science and Technology Sub-Analysis)
The Science and Technology evaluation criterion has an additional in-depth assessment in
the form of a Sub-Matrix because of the broad diversity of technologies which are considered
for carbon sequestration. This Sub-Matrix contains a set of scientific and technical elements,
unique for each of the CCS technology options. For example, Figure 2.5 illustrates the technical
elements for Geosequestration. While it would be beneficial to align the Sub-Matrix as much as
possible with the analysed carbon sequestration technologies for ease of comparison, this will
not always succeed if the CCS technology portfolio is too diverse.
Figure 2.5. Science and Technology Sub-Matrix Spreadsheet Template for Geosequestration
Methodology Development
32
Each technology element is assessed across the evaluation criteria with the exception of the
“Storage Quality” criterion as it is not applicable to all elements (but is important to all CCS
technologies). The Science and Technology column of the Sub-Matrix is defined as
“Demonstrated Technical Readiness” to minimise confusion and characterise the criterion. The
overall parameter score is taken from the average column and input into the Science and
Technology column in the Master Matrix in order to provide the average Science and
Technology rating of the CCS technology as a whole (Figure 2.6 below).
In addition, the technical elements can score very differently across the evaluation criteria.
For example, in the case of Geosequestration, “Public Acceptance” of “Injection and Storage” is
ranked poorly due to community concerns about issues such as storage site integrity and loss in
property values. However, public perception of the “Capture” component is rated highly
because it presents no perceived risk and beneficially prevents industrial generated CO2 from
entering the atmosphere. The Sub-matrix analysis identifies these types of differences within a
respective CCS option as well as for specific projects. It highlights areas which require a more
in-depth analysis to define focus points which are critical to the technology rating. These areas
will form the focus for development of most efficient strategies for potential upgrading of that
technical aspect. This will thus improve the overall rating of that CCS technology.
Consequently, use of the Sub-matrix emphasises the importance of the different technical
aspects for each of the CCS methodologies.
Evaluation Rating Scale
A simple numerical ranking value is used to generate quantitative data, facilitate ease of use
and align with the reference table character of the methodology (Table 2.5). Each CCS
technology in the Master Matrix, and technical element in the Sub-Matrix, is assigned a rating
across the evaluation criteria on a scale of 1 - 3, with 1 being the lowest rating and 3 the highest.
The cut-off points between low and medium are at 1.5, medium between 1.5 and 2.5, and high
above 2.5. For the general methodology development, all criteria have equal weighting. A
subjective weighting scheme could be introduced if the conditions require it, for example, in
densely populated areas like Western Europe, public acceptance may receive a higher weighting
while in sparsely populated areas, transportation may be more critical.

Methodology Development
33
Table 2.5. Evaluation Criteria Rating Scale and Equivalents
The schematic shown in Figure 2.6 summarises and illustrates the link between the three
discussed components of the methodology, and the interaction between the Master Matrix
Scorecard and Science and Technology Sub-Matrix. The average score of the technical elements
assessed in the Science and Technology Sub-Matrix is transferred into the Science and
Technology column of the Master Matrix. The overall technology risk assessment rating is
shown in the Technology Rating column.
Figure 2.6. Schematic showing how the Master Matrix Scorecard, Sub-matrix Scorecard, and Rating
Scale work in relation to each other.
Assessment Grade Numerical Average Range Equivalent
Scorecard Symbol Equivalent
Low <1.5 X
Medium >1.5 to <2.5 -
High >2.5 √

Methodology Development
34

Methodology Development
35
2.5 RANKING SYSTEM
This section first describes the Portfolio Analysis Taxonomy (Figure 2.7) which provides an
overview of the overall methodology structure, then defines the Evaluation Criteria (Table 2.6)
and Sub-Criteria Scorecards (Table 2.7) for the purposes of portfolio or project analysis.
Portfolio Analysis Taxonomy
The Portfolio Analysis Taxonomy (Figure 2.7) illustrates the overall methodology structure
(Young-Lorenz and Lumley, 2013). The six evaluation criteria, discussed in Section 2.2, are
defined in the Evaluation Criteria Scorecard (Table 2.6) and used to assign quantitative scores.
The sub-criteria provide the specific questions or issues to assess each evaluation criteria (Table
2.7) and represent the characteristics, used to establish the numerical score. Quantitative
measures, case studies, reports and other data are used to guide ranking and calibrate scores.
The average ratings of all sub-criteria provide the respective evaluation criteria score, while the
average of all evaluation criteria ratings provides the overall technology rating. The technical
readiness of the given technology is analysed in a separate sub-matrix to take into account the
technology elements specific to each CCS technology.
Figure 2.7. Portfolio Analysis Taxonomy showing elements (evaluation criteria and sub-criteria)
assessed in my methodology for each carbon sequestration technology in order to perform a portfolio
evaluation.

Methodology Development
36
Evaluation Criteria Scorecard
Each of the evaluation criteria is kept general to ease comparison across technologies. The
general interpretation of the rating for each criterion is provided in Table 2.6. Cut-off points for
the score assignment are preferably quantitative versus qualitative to enforce applicability of the
methodology across technologies and limit the influence of subjective judgment.
Table 2.6. Rating System Evaluation Criteria Scorecard illustrating the rating interpretation for each
criterion. This Scorecard works together with the Rating System Sub-criteria Scorecard to provide a
semi-quantitative analysis for each CCS technology.
2.5.1 Sub-Criteria Scorecard
The sub-criteria provide the specific questions or issues which must be answered under each
parameter criterion in order to evaluate the technology. They represent the characteristics used
to generate quantitative data (numerical scores) (Table 2.7), with quantitative measures, case
studies, reports and other data used to guide ranking and cut-off points. Likewise, when
applying the methodology, the assessor determines the overall rating for each sub-criterion
based on case studies and other relevant data. The compilation of all the sub-criterion scores
represents the criterion score.
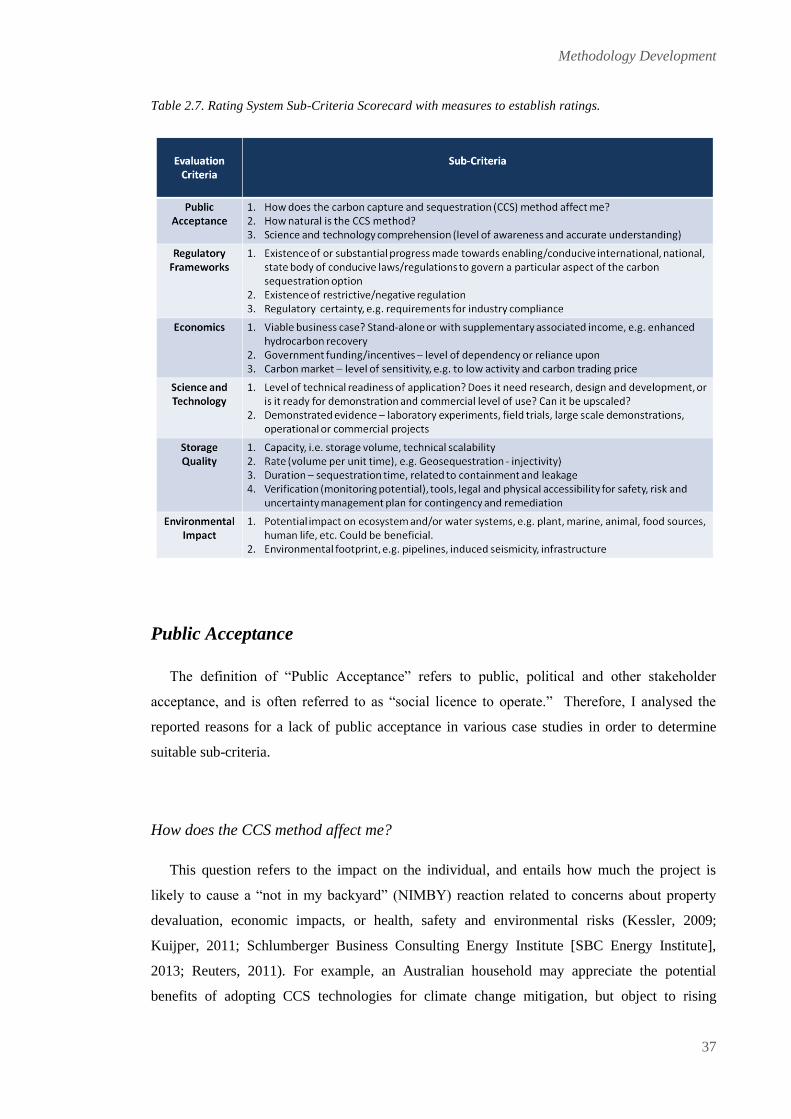
Methodology Development
37
Table 2.7. Rating System Sub-Criteria Scorecard with measures to establish ratings.
Public Acceptance
The definition of “Public Acceptance” refers to public, political and other stakeholder
acceptance, and is often referred to as “social licence to operate.” Therefore, I analysed the
reported reasons for a lack of public acceptance in various case studies in order to determine
suitable sub-criteria.
How does the CCS method affect me?
This question refers to the impact on the individual, and entails how much the project is
likely to cause a “not in my backyard” (NIMBY) reaction related to concerns about property
devaluation, economic impacts, or health, safety and environmental risks (Kessler, 2009;
Kuijper, 2011; Schlumberger Business Consulting Energy Institute [SBC Energy Institute],
2013; Reuters, 2011). For example, an Australian household may appreciate the potential
benefits of adopting CCS technologies for climate change mitigation, but object to rising
Methodology Development
38
electricity prices (Farr, 2012). The Sleipner Project in the North Sea (Reiner, 2008) would
represent a high scoring example due to its remote location offshore and no direct impact on
individuals; while the now cancelled Barendrecht (Netherlands) onshore project in a densely
populated area would represent a low scoring example (Kuijper, 2011; IEA GHG, 2009).
How natural is the CCS method?
A CCS technology, closely resembling a natural process in nature’s carbon cycle, is more
likely to receive a higher level of public acceptance from the local community and
environmental groups. Reforestation would represent a high scoring project as it is considered a
reestablishment of a natural balance, enhancing the natural carbon cycle, and a “safe” carbon
mitigation option (Silver et al., 2010: Ipsos-MORI, 2010); whereas Ocean Fertilisation would
be a low scoring CCS technology due to risks of disruption of the natural balance of marine life
systems on a global scale (IEA GHG, 2002).
Science and technology comprehension
An educated public with a solid comprehension of the scientific and engineering concepts
underpinning a CCS technology is less influenced by misinformation and special interest
groups. In addition, educated and engaged stakeholders are more likely to get involved and take
ownership of a project while sidelined stakeholders are more likely to resist a technology’s
adoption (Miller et al., 2008). The active involvement and communications of the Otway
Project with the public would represent a high score (Ashworth et al., 2010); while the
inadequate communications, education and engagement with the local community that resulted
in unjustified fears about the Barendrecht Project and its ultimate cancellation would represent a
low score (Kuijper, 2011; IEA GHG, 2009).

Methodology Development
39
Regulatory Frameworks
“Regulatory Frameworks” refers to a system of rules, regulations and legislation, and the
means to enforce them. These rules are established by state and federal governments as well as
international bodies and range from comprehensive frameworks to rules for very specific
activities.
Enabling regulation
The existence of enabling legislation or flexibility in the adaptation of existing rules to new
requirements, will favour the uptake of CCS technologies. In 1995, Porter and van der Linde
advocated the view that effective environmental legislation has positive effects on resource
productivity and innovation thus leading to competitive advantage. Enabling regulation could be
in the form of funding incentives such as the European Union’s New Entrance Reserve (NER
300) programme; or taxation schemes, like the Commonwealth of Australia’s Clean Energy
Legislative Package and Carbon Pollution Reduction Scheme. Regulatory requirements which
encourage industry compliance can positively affect adoption of a CCS technology as they
create a base need for research and development as well as deployment of a technology. High
scores are given to flexible regulators, like the amendment of existing pipeline legislation
(Western Australian Petroleum Pipelines Act 1969) to allow for CO2 transportation by the State
Government of Western Australia (The Parliament of Western Australia, 2011), and the
required retrofitting of CCS equipment to coal-fired power plants, as in the United Kingdom
(UK) (Department of Energy and Climate Change [DECC], 2010). A low scoring example
would be the absence or retraction of planned legislation, or the passing of politically
controversial regulations which are dependent on single party support.
Restrictive or negative regulation
The existence of restrictive or negative legislation, or a comprehensive but negative
regulatory framework, can negatively impact the adoption of certain technical aspects of CCS
technologies. A high scoring example may be a country with no negative or restrictive
regulation. A low scoring scenario may be a government banning access to a significant portion
of technically and economically suitable storage sites, such as in the Netherlands (ICIS Heren,
2011).

Methodology Development
40
Regulatory certainty
Regulatory certainty refers to the presence or absence of a comprehensive regulatory
framework. High policy uncertainty can result in a significant increase of risk and planning
uncertainty (costs, liability and project delays), which can motivate commercial enterprises to
delay or cancel projects and thus further hinder the adoption of a CCS technology (Bachu,
2008). A high score is given for the existence of either positive or negative comprehensive
legislation, because this provides the ability to conduct economic analysis and planning with a
significant degree of certainty. In the USA, some corporations and industries are pushing for
unified federal and state legislation while setting voluntary greenhouse gas (GHG) reduction
targets for near-term strategic advantage as well as preparing for future mandatory requirements
(Hoffman, 2005). A low score is assigned where the absence of a regulatory framework yields
high risk for a project since it is difficult to plan in the face of regulatory uncertainty. For
example, the delay in enactment of proposed CCS legislation by the German government,
contributed to the decision of Swedish power utility Vattenfall to cancel the Jänschwalde project
in Brandenburg (Helseth, 2011; Reuters, 2011).
Economics
“Economics” refers to the economic and financial aspects affecting CCS technologies,
projects and investment.
Viable business case
Significant funds are required to invest in CCS technologies (CAPEX, OPEX, monitoring,
regulatory compliance and carbon accounting) especially at the early adopter stage, and
operators need these to be offset by consistent revenue streams and predictable, sustainable
business models. Regulatory requirements which enforce industry compliance act to define both
corporate strategy and cost, not only in the initial stages for CAPEX but also in the long-term
with OPEX and MMV expenses. A high scoring example may be the presence of sufficient
carbon tax savings through the use of CCS technology as is the case at Sleipner (Torp and
Brown, 2002). A low scoring example would be a project which is dependent on a highly
uncertain revenue stream, especially to cover OPEX. Dependence on direct government funding
of OPEX, or dependency on floating CO2 surcharges to electricity prices would be additional
illustrations of low scoring cases.
Methodology Development
41
Government Funding/Incentives
This sub-criterion refers to the level of dependence upon government funding or other
incentives. A high scoring example would be a project that is not reliant upon such subsidies to
encourage the adoption of the CCS technology. Enhanced oil recovery (EOR) projects with
sufficient increased oil production due to CO2 injection are currently one of the few profitable
examples which can achieve a high score (SBC Energy Institute, 2012). If a project is not a
stand-alone viable business, then a heavy reliance on government incentives or intervention
make a project susceptible to a business strategy review or regulatory change. This is illustrated
by the Longannet CCS project in Fife, Scotland, after the takeover of Scottish Power by
Iberdrola. This project was cancelled after the UK Government would not increase the funding
support and the project partners would not agree to cover the additional GB₤520,000 risk,
especially as coal-fired power plants did not fit with Iberdrola’s business focus which is on
renewable energy (Iberdrola Group, 2013; Haszeldine, 2011; BBC Online 2011a: BBC Online,
2011b).
A high reliance on subsidies or incentives would score a low rating, such as a project which
cannot proceed without significant government financial intervention. For example, plans to
develop the South West CO2 Sequestration Hub project in Western Australia can proceed only
with the financial support under the Commonwealth of Australia’s Carbon Capture and Storage
Flagships programme (Government of Western Australia, 2011). This research and
demonstration project brings together government and large-scale CO2 emitters from different
industries to capture and inject CO2 into an onshore storage site and thereby build crucial
experience and capabilities (Stalker et al., 2013). Financial support from both the State and
Federal Governments encourages participation by industry by limiting the financial risk of the
industry partners, and enables this pilot project to demonstrate the commercial-scale feasibility
of CCS technologies in Australia (Zero Emission Resource Organisation [ZERO], 2013).
Carbon Market
This sub-criterion is defined by the level of sensitivity to the carbon market. The carbon
market is still immature with a decreased international price of carbon (Figure 2.8), which is
predicted to stay low until 2020 as a result of economic weakness in Europe and an oversupply
of emissions abatement permits (Maher, 2012). A high score would be given to a business
model which does not rely upon trade or sale of carbon credits. A high sensitivity to trade

Methodology Development
42
volumes and carbon price is a disadvantage and would thus merit a low score as the market is
currently artificial and dependent on political will and cooperation.
Figure 2.8. Carbon prices over time in Europe for the period April 2010 to April 2012 (Image source:
van Renssen, 2012).
Science and Technology
“Science and Technology” is defined as the capability and efficacy of a CCS technology in
mitigating atmospheric CO2, and understanding of the associated environmental risks, with a
basis in sound scientific concepts and engineering solutions. Technical Readiness and
Demonstrated Evidence are both required for industrial scale adoption as no economic
assessment is feasible without knowledge of these sub-criteria. If risks are present, their impact
has to be quantifiable, and means for remediation available.
Technical Readiness
Technical readiness refers to the status of a CCS application, that is, whether it needs more
research and development, or is ready for demonstration, or is already available at commercial
Methodology Development
43
scale. The cut-off points approximate the adoption times of those of the Gartner S-curve
technology development life cycle, as illustrated in the Evaluation Criteria Scorecard (Table
2.6), with timelines from concept to market (Fenn et al., 2009). Technical readiness can also be
illustrated by the complementary Grubb curve which outlines the initial increase then decrease
in costs and effort as induced endogenous technological changes and learning progress beyond
the emerging stage (Grubb et al. 2002). The lower the level of Technical Readiness of a CCS
technology, the higher the economic and implementation risks. Public awareness and
acceptance are also impacted by whether a technology is immature or perceived as novel and
untested. One method of assessing the level of technical readiness of a CCS solution is the
availability of commercial products and tools, such as software and services, which are already
used by industry for this or similar purposes. The adaptation of CO2 capture technologies used
by the oil and gas (O&G) industry for gas processing for utilisation by other industries, such as
coal-fired power generators, would be an example of a high scoring case. Another high score
illustration would be the utilisation or modification of knowledge and tools for CCS purposes
from the O&G industry which has over forty years of knowledge, experience and tools gained
from safely injecting CO2 into oil and gas reservoirs to enhance hydrocarbon recovery. A low
scoring example would be a technology like Algae CCS with significant development needs to
ascertain the most suitable microalgae strains and achieve efficient high volume production
levels (Global CCS Institute, 2011).
Demonstrated Evidence
Demonstrated evidence refers to the established nature of scientific concepts, engineering
solutions, benefits and safety for each technical element specific to a given CCS option both in
the lab and field. A skilled labour force is also needed to implement and prove the benefits and
safety of all technical elements for a particular CCS option through measurement, monitoring
and verification (MMV) activities, management and remedial plans. A high scoring example
would be Geosequestration, which has been safely demonstrated for over forty years of EOR for
CCS purposes via numerous large-scale demonstration projects (Eiken et al., 2004, 2011;
Hovorka et al., 2011). A low scoring example would be an immature or unproven scientific
concept or technical solution, such as the deposition of CO2 in solid phase on the deep ocean
floor (Brewer et al., 1999), which may work in theory, however field trials are unlikely due to
the inability to qualify and quantify the risks associated with it.

Methodology Development
44
Storage Quality
“Storage Quality” is defined as the capacity and the quality of the space available for long-
term secure storage of CO2. This sub-criteria reflect the standards proposed by international
agencies for the qualification of storage sites by considering capacity, injectivity, containment,
and monitoring potential (Bachu, 2000; Bradshaw et al. 2007; Det Norske Veritas [DNV],
2012a, 2012b; Aarnes et al., 2009).
Capacity
Capacity refers to the total volume of CO2 which can be stored and scaleability of the
technology. A high score example would be given to a massive deep saline formation with an
assessed storage volume capable of supporting a number of major commercial CCS projects, for
example 10+ GtC, such as the Mount Simon Sandstone (North American Carbon Storage Atlas
[NACSA], 2012). A low scoring example would be a very localised storage site, such as a small
depleted hydrocarbon reservoir, or an unreasonably large dependency on areal space
requirements such as that required for algae ponds (Global CCS Institute, 2011; Benneman,
2003).
Rate
Rate is the volume of CO2 that can be stored per unit time, or the speed at which CO2 can be
sequestered. A high scoring example would be the ability to store CO2 at the same rate as which
the CO2 is captured or produced, such as Geosequestration is capable of doing, for example at
the Sleipner Project where more than 1 MtC have been stored each year for 15+ years (Eiken et
al., 2011). A low scoring example could be Reforestation since the rate of CO2 storage is
constrained by the relatively slow growth of trees. The average carbon sequestration rate
estimate per unit of tree cover in the USA is 0.277 kilograms carbon per square metre per year
(kg m2pa) and the net sequestration rate 0.205 kg m
2pa accounting for the decomposition of
dead trees (Nowak et al., 2013).
Duration
Duration refers to the length of secure CO2 storage in time, and is therefore related to
containment and leakage issues. A high scoring example may Biochar CCS as radiocarbon
dating of the Amazonian Terra Preta soils measured the mean residence time (MRT) of carbon
Methodology Development
45
as ranging from 500-7000 years (Neves et al., 2003). A low scoring example may be Algae
CCS, as the CO2 is only stored temporarily during the growth cycle, which ranges from days to
months depending on climatic conditions and algae strain, until the algae biomass either
decomposes (Jewell and McCarty, 1971) or is harvested and converted into the desired end-
product, e.g. biofuels.
Verification
Verification is the ability to monitor the sequestered CO2 for storage behaviour,
environmental interactions, containment, leakage and economic auditing. A high scoring
example would be Geosequestration due to the commercial availability of geophysical methods
and equipment used by the energy industry for exploration, production and enhanced
hydrocarbon recovery (Hovorka et al. 2011; Hill et al. 2013). A low scoring example may be
Afforestation, which is the establishment of a forest in a location where there was none
previously, because it is difficult to access and monitor large tracts of land to check if the
planted trees are still standing, and to accurately account for the carbon they are sequestering.
Environmental Impact
“Environmental Impact” relates to the possible positive or negative environmental impacts
that a CCS technology or project may have locally, regionally or globally. Other issues related
to this criterion are health and safety, damage to resources, competition for groundwater and
land resources, such as agriculture versus biomass cultivation, as well as food and energy
sources and security.
Potential impact on ecosystems and water systems
Impacts include any potential side-effects or changes experienced in eco- and water systems
and may even occur thousands of kilometres away from the project site. A high scoring example
would be Geosequestration, where any CO2 leakage is likely to be small and constrained to the
immediate site vicinity because of the rigorous process of site characterisation and monitoring
(Bachu, 2000; CSA Group and IPAC-CO2 Research Incorporated [CSA IPAC-CO2], 2012).
Ocean Fertilisation may be a low scoring example, since the effects of micronutrients at
commercial scales on marine systems and tidal effects are unknown, and could impact coastal
areas and food sources tens of thousands of kilometres from the site of fertilisation. An analogue
for the global footprint of ocean fertilisation could be found in the June 2008 and July 2011
algae blooms in the Yellow Sea, China (Ghosh, 2011; Marris, 2008) (Figure 2.9).
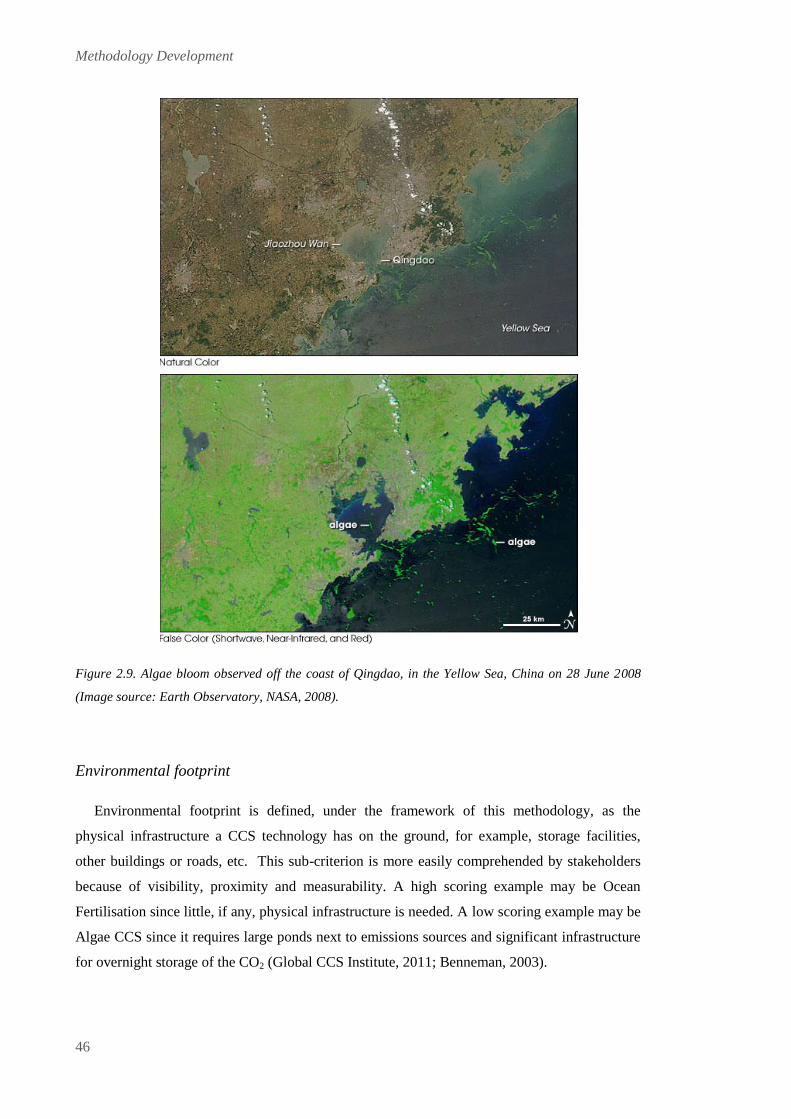
Methodology Development
46
Figure 2.9. Algae bloom observed off the coast of Qingdao, in the Yellow Sea, China on 28 June 2008
(Image source: Earth Observatory, NASA, 2008).
Environmental footprint
Environmental footprint is defined, under the framework of this methodology, as the
physical infrastructure a CCS technology has on the ground, for example, storage facilities,
other buildings or roads, etc. This sub-criterion is more easily comprehended by stakeholders
because of visibility, proximity and measurability. A high scoring example may be Ocean
Fertilisation since little, if any, physical infrastructure is needed. A low scoring example may be
Algae CCS since it requires large ponds next to emissions sources and significant infrastructure
for overnight storage of the CO2 (Global CCS Institute, 2011; Benneman, 2003).
Methodology Development
47
2.6 DISCUSSION
This quantitative methodology is designed as a first pass assessment of CCS technologies for
the purpose of providing a quick overview for a carbon management investment portfolio. Of
course, this can be followed up with more detailed assessment of individual evaluation criteria
or specific projects, and would take significantly more time, financial analysis and project-
specific information, e.g. exact costs from service providers. It is intended to provide a broad-
brush first selection mode for decision makers to: a) identify the CCS technologies which may
be applicable in a respective situation, and b) obtain an understanding of the main challenges
and risks which various CCS technologies may experience. The development and primary
calibration of the methodology is based on Geosequestration. This CCS option comprises the
most advanced set of carbon mitigation technologies, thus providing better availability of public
domain literature and case studies. While my preference is to use as much quantitative data as
possible, in large parts, such quantitative data is not easily accessible, and could not be
generated through statistical analysis due to the absence or very limited availability of data in
the public domain.
Applications and Future Improvements
Some applications of, and future improvements to, my methodology are as follows:
The in-depth analysis of the Master Matrix and Science and Technology Sub-Matrix
can highlight beneficial as well as less certain/higher risk areas that require further
improvement, R&D or assessment. This could include potential business opportunities,
e.g. sale of capture technologies by the O&G industry to other heavy emitter industries
such as coal-fired power generators or steel manufacturers; or the need to improve
certain practices, e.g. earlier and better engagement of local communities for improved
public acceptance rates.
The flexibility of the methodology allows for efficient reevaluation and updating of
criteria and sub-criteria to take into account the impact of recent events on a project
portfolio. For example, the Netherlands government legislation banning onshore storage
has forced Vattenfall to delay or cancel projects (Barendrecht, Eemscentrale and
Magnum) and rush to find economically and technically viable offshore storage sites
(ICIS Heren, 2011).
Methodology Development
48
The methodology can be tailored for a specific portfolio assessment or improved by
introducing weights for country or region specific issues. This would need further
detailed evaluation by the user, but the methodology is flexible enough to account for
this. With some adjustment this methodology can also compare projects based on the
same CCS technology. The application of the technique in this manner could provide
the most quantitative or least subjective comparative assessment.
The evaluation criteria currently have equal weighting. The methodology could be
improved and further extended by introducing variable weighting.
Flexibility in the methodology framework and design means that as a technology
progresses and more quantitative data becomes available, the methodology can be
updated and the sub-criteria modified if necessary.
Challenges
Some of the challenges I experienced in developing the methodology and rating system, and
issues to consider when applying it, are as follows:
The complexity of establishing suitable standardised measures or metrics and cut-off
points to compare across multiple CCS technologies encompassing multiple scientific
and technical disciplines.
The quantitative assessment of qualitative data (case studies, published literature and
reports) and transformation into quantitative scores, may still reflect user bias in the
decision making process, i.e. is still subjective to a certain degree.
One possibility to derive a more quantitative assessment would be a statistical analysis
of cancelled and delayed projects, however, such a database and/or analysis is not
readily available for Geosequestration as the calibrating CCS technology, and this
measure is not applicable for other technologies still at laboratory stage.
Additional calibration with other CCS technologies should be performed, especially if
in-house information is available.
To apply the methodology to other CCS technologies requires a time-consuming
literature review. To manage the large quantity and variety of data from multiple
disciplines, support documentation, such as fact sheets, analysis tables and databases, are

Methodology Development
49
also developed in order to make a full assessment. However, once the methodology has
been applied and analysis is complete (for that moment in time), the results can quickly
be updated as the hard work with the initial literature review has already been done.
Despite the challenges discussed above, the new availability of a standardised semi-
quantitative methodology to compare various CCS solutions should significantly assist with
focusing of research efforts and limited resources in order to help reduce atmospheric CO2
emissions.
2.7 CONCLUSIONS
I develop and present a new methodology to assess and compare multiple CCS technologies
and their barriers to adoption. I have defined a general evaluation criteria and ranking/scoring
system for CCS projects calibrated to the specific CCS technology of Geosequestration. This
semi-quantitative methodology can be applied to multiple alternative CCS technologies in both
a general and site-specific comparative manner, allowing the ranking of competing or
complementary technologies across a CCS project portfolio, and highlighting benefits or areas
that can yield improvement in the respective score. My new methodology should be both
practical and useful for CCS portfolio analysis of commercial-scale CO2 sequestration solutions.
In the next chapter, I apply the new methodology to evaluate Geosequestration as a carbon
mitigation option.

Methodology Development
50
Methodology Development
51
REFERENCES
Aarnes, J.E., Selmer-Olsen, S., Carpenter, M.E., and Flach, T.A. (2009), Towards guidelines for
selection, characterization and qualification of sites and projects for geological storage of CO2: Energy
Procedia, 1, 1, 1735–1742.
Ashworth, P., Rodriguez, S., and Miller, A. (2010), Case study of the CO2CRC Otway Project: CSIRO,
EP 103388, commissioned by Global CCS Institute, Canberra, ACT, Australia.
Bachu, S. (2000), Sequestration of CO2 in geological media: criteria and approach for site selection in
response to climate change: Energy Conversion and Management, 41, 9, 953–970.
Bachu, S. (2008), CO2 storage in geological media: Role, means, status and barriers to deployment,”
Progress in Energy and Combustion Science, 34, 254–273.
Benneman, J. (2003), Technology Roadmap–Biofixation of CO2 with Microalgae: Final Report
(7010000926) to the US Department of Energy, National Energy Technology Laboratory,
Morgantown-Pittsburgh, USA.
Boschetti, F., and Moresi, L. (2001), Interactive inversion in geosciences: Geophysics, 66, 4, 1226-1234.
Bradshaw, J., Bachu, S., Bonijoly, D., Burruss, R., Holloway, S., Christensen, N.P., and Mathiassen,
O.M., (2007), CO2 storage capacity estimation: Issues and development of standards: International
Journal of Greenhouse Gas Control, 1, 1, 62–68.
Brewer, P. G., Friederich, G., Peltzer, E. T., & Orr, F. M. (1999), Direct experiments on the ocean
disposal of fossil fuel CO2: Science, 284, 5686, 943-945.
Chevron Australia (2012), Injecting Billions of Dollars across Australia: Chevron Australia Pty. Ltd.
http://www.chevronaustralia.com/ourbusinesses/gorgon.aspx (accessed 20 June 2012).
CSA Group and IPAC-CO2 Research Incorporated [CSA IPAC-CO2] (2012), CSA Group and IPAC-
CO2 Research Inc. Announce World’s First Bi-National Standard for Geologic Storage of Carbon
Dioxide: [news release] 15 November 2012, CSA Group IPAC-CO2: Regina and Toronto, Canada.
http://www.ipac-co2.com/uploads/File/PDFs/CSA%20IPAC-
CO2%20CCS%20Standard%202012%20Final%20News%20Release%20v1%20copy.pdf (accessed
30 November 2012).
Department of Energy and Climate Change [DECC] (2010), Clean coal: an industrial strategy for the
development of carbon capture and storage across the UK: Her Majesty’s Govenment, Department of
Energy and Climate Change, URN 10D/570.

Methodology Development
52
Det Norske Veritas [DNV] (2012a), Recommended Practice DNV-RP-J203: Geological Storage of
Carbon Dioxide.
Det Norske Veritas [DNV] (2012b), DNV Service Specification DNV-DSS-402: Qualification
Management for Geological Storage of CO2.[replace dnv in text?]
Eiken, O., Zumberge, M., Torkjell, T., Sasagawa, G., and Nooner, S. (2004), Gravimetric monitoring of
gas production from the Troll Field: Presented at SEG 74th
Annual Meeting.
Eiken, O., Ringrose, P., Hermanrud, C., Nazarian, B., Torp, T.A., and Loier, L. (2011), Lessons learned
from 14 years of CCS operations: Sleipner, In Salah and Snohvit: Energy Procedia, 4, 5541-5548.
Farr, M. (2012), Carbon tax to blame for rise in electricity costs,” Herald Sun, 13 June 2012.
http://www.heraldsun.com.au/news/more-news/carbon-tax-to-blame-for-hike-in-electricity-
costs/story-e6frf7l6-1226394637354 (accessed 18 June 2012)
Fenn, J., Raskino, M. and Gammage, B. (2009), Gartner's Hype Cycle Special Report for 2009: ID No:
G00169747, Gartner Inc.
http://www.bnlcp.org.uk/sites/bnlcp/files/report/Gartners_hype_cycle_special_2009.pdf (accessed 21
June 2012).
Ghosh, P. (2011), China’s Eastern Coastline Teeming With Green Algae Bloom: International Business
Times: Science, 26 July 2011. http://www.ibtimes.com/articles/186963/20110726/china-algae-bloom-
qingdao.htm (accessed 17 May 2012).
Global CCS Institute (2011), Accelerating the uptake of CCS: Industrial use of captured carbon
dioxide: [Parsons Brinckerhoff], Global CCS Institute, Canberra, ACT, Australia.
Government of Western Australia (2011), Collie-South West CO2 Geosequestration Hub – Project and
Activity Progress Report for the Global Carbon Capture and Storage Institute: Government of
Western Australia, Department of Mines and Petroleum, Perth, Western Australia, Australia: Report
No. DMPNOV11_1578.
Grubb, M., Köhler, J., and Anderson, D. (2002), Induced technical change in energy and environmental
modeling: Analytic approaches and policy implications, Annual Review of Energy and the
Environment, 27, 1, 271-308.
Haszeldine, S. (2011), Why the UK buried a world-first carbon-capture scheme: New Scientist: Opinion,
21 October 2011. http://www.newscientist.com/article/dn21080-why-the-uk-buried-a-worldfirst-
carboncapture-scheme.html?full=true (accessed 7 June 2012).

Methodology Development
53
Helseth, J. (2011), CCS in Germany – is it game over?: Global CCS Institute,
http://www.globalccsinstitute.com/community/blogs/authors/jonashelseth/2011/10/10/ccs-germany-it-
game-over (accessed 7 June 2012).
Hoffman, A.J. (2005), Climate Change Strategy: The Business Logic Behind Voluntary Greenhouse Gas
Reductions: California Management Review, 47, 3, 21-46.
Hill, B., Hovorka, S., and Metzer, S. (2013), Geologic carbon storage through enhanced oil recovery: in
Proceedings of the 11th International Conference on Greenhouse Gas Control Technologies (GHGT-
11). http://www.fossiltransition.org/filebin/images/GHGT11_Hill_Hovorka_Melzer-2.pdf (accessed
1 April 2013) [in press].
Hovorka, S.D., Meckel, T.A., Trevino, R.H., Lu, J., Nicot, J.P., Choi, J.W., Freeman, D., Cook, P.,
Daley, T.M., Ajo-Franklin, J.B., Freifeild, B.M., Doughty, C., Carrigan, C.R. La Brecque, D.,
Kharaka, Y.K., Thordsen, J.J., Phelps, T.J. Yang, C. Romanak, K.D., Zhang, T., Holt, R.M., Lindler,
J.S., and Butsch, R. J. (2011), Monitoring a large volume CO2 injection: Year two results from
SECARB project at Denbury’s Cranfield, Mississippi, USA: Energy Procedia, 4, 3478-3485.
Iberdrola Group (2013), Lines of business.
http://www.iberdrola.com/webibd/corporativa/iberdrola?IDPAG=ENWEBCONLINEA&codCache=1
3662759340511511 (accessed 18 April 2013).
ICIS Heren (2011), Dutch CCS in disarray as ‘on land’ storage ruled out: ICIS Heren, 15 February 2011.
http://www.icis.com/heren/articles/2011/02/15/9435644/dutch-ccs-in-disarray-as-on-land-storage-
ruled-out.html (accessed 15 June 2012).
International Energy Agency Greenhouse Gas R&D Programme [IEA GHG] (2002), Ocean Storage
of CO2: 2nd Edition (revised), IEA Greenhouse Gas R&D Programme [Ormerod, W.G., Freund, P.
and Smith, A. (compilers), Davison J. (revisor)],
http://www.ieaghg.org/docs/general_publications/oceanrep.pdf (accessed 15 October 2011).
International Energy Agency Greenhouse Gas R&D Programme [IEA GHG] (2009), Natural and
Industrial Analogues for Geological Storage of Carbon Dioxide. IEA Greenhouse Gas R&D
Programme [Stenhouse, M. (compiler)], Cheltenham, Gloucestershire, UK.
Intergovernmental Panel on Climate Change [IPCC] (2005), Intergovernmental Panel on Climate
Change Special Report on Carbon Dioxide Capture and Storage: Prepared by Working Group III of
the Intergovernmental Panel on Climate Change [Metz, B.O., Davidson, H., de Coninck, C., Loos, M.
and Meyer, L.A. (eds.)]: Cambridge University Press, Cambridge, United Kingdom and New York,
NY, USA.

Methodology Development
54
Ipsos-MORI (2010), Experiment Earth: Report on a Public Dialogue on Geoengineering: Natural
Environment Research Council, Swindon, United Kingdom.
www.nerc.ac.uk/about/consult/geoengineering-dialogue-final-report.pdf (accessed 21 February 2013).
Jewell, W.J. and McCarty, P.L. (1971), Aerobic decomposition of algae: Environmental Science and
Technology, 5, 10, 1023-1031.
Kessler, R.A. (2009), Midwest group cancels Ohio CCS project despite DOE funding: Recharge, 21
August 2009. http://www.rechargenews.com/business_area/innovation/article186348.ece (accessed 30
May 2012).
Kuijper, M. (2011), Public acceptance challenges for onshore CO2 storage in Barendrecht: Energy
Procedia, 4, 6226-6233.
Lumley, D.E., Behrens, R.A., and Wang, Z. (1997), Assessing the technical risk of a 4-D seismic project:
The Leading Edge, 16, 9, 1287-1291.
Maher, S. (2012), Carbon Floor Price Warning: The Australian, 22 May 2012.
http://www.theaustralian.com.au/national-affairs/climate/carbon-floor-price-warning/story-e6frg6xf-
1226362855884 (accessed 20 June 2012).
Marris, E. (2008), Scientists identify algae that almost swamped the Olympics: Nature, 4 August 2008.
http://www.nature.com/news/2008/080804/full/news.2008.998.html (accessed 17 May 2012).
Miller, E., Summerville, J., Buys, L., and Bell, L. (2008), Initial public perceptions of carbon
sequestration: implications for engagement and environmental risk communication strategies:
International Journal of Global Environmental Issues, 8, (1), 147-164.
Neves, E.G., Petersen, J.B., Bartone, R.N. and Silva, C.A.D. (2003), Historical and socio-cultural origins
of Amazonian Dark Earths: In Amazonian Dark Earths: Origin, Properties, Management, [Lehmann,
J., Kern, D.C., Glaser, B, and Woods, W.I. (Eds.)]: Kluwer Academic Publishers, Dordrecht, The
Netherlands, 29-50.
North American Carbon Storage Atlas [NACSA] (2012), The North American Carbon Storage Atlas
2012: First Edition. http://www.netl.doe.gov/technologies/carbon_seq/refshelf/NACSA2012.pdf
(accessed 17 July 2012).
Nowak, D. J., Greenfield, E. J., Hoehn, R. E., and Lapoint, E. (2013), Carbon storage and sequestration
by trees in urban and community areas of the United States: Environmental Pollution, 178, 229-236.
Pacala, S., and Socolow, R. (2004), Stabilization Wedges: Solving the Climate Problem for the Next 50
Years with Current Technologies: Science, 305, 5686, 968-972.
Methodology Development
55
Porter, M.E. and van der Linde, C. (1995), Green and Competitive: Ending the Stalemate: Harvard
Business Review, Reprint 90557, 119-134.
Reiner, D.M. (2008), A looming rhetorical gap: A survey of public communications activities for carbon
dioxide and storage technologies: Electricity Policy Research Group, Working Papers, No. 801.
Reuters (2011), Update 2 – Vattenfall drops carbon capture project in Germany: Reuters, 5 December
2011. http://www.reuters.com/article/2011/12/05/vattenfall-carbon-idUSL5E7N53PG20111205
(accessed 7 June 2012).
Schlumberger Business Consulting Energy Institute [SBC Energy Institute] (2012), Leading the
Energy Transition: Bringing Carbon Capture and Storage to Market, [Soupa, O., Lajoie, B., Long,
A., and Alvarez, H.]: Schlumberger Business Consulting Energy Institute.
Schlumberger Business Consulting Energy Institute [SBC Energy Institute] (2013), Leading the
Energy Transition: Carbon Capture and Storage: Bringing Carbon Capture and Storage to Market:
Factbook Edition, January 2013 Update: Schlumberger Business Consulting Energy Institute.
Scott, K.C., Parker, D.J., Trupp, M., and Clulow, B. (2010), Setting New Environmental, Regulatory, and
Safety Benchmarks: The 2009 Gorgon CO2 3D Baseline Seismic Project, Barrow Island, Western
Australia: in Proceedings of the SPE Asia Pacific Oil and Gas Conference and Exhibition, edited,
Brisbane, Queensland, Australia.
Silver, W.L., Ostertag, R., and Lugo, A.E. (2000), The Potential for Sequestration Through Reforestation
of Abandoned Tropical and Pastural Lands: Restoration Ecology, 8, 4, 394-407.
Stalker, L., Varma, S., Van Gent, D., Haworth, J. and Sharma, S. (2013), South West Hub: a carbon
capture and storage project, Australian Journal of Earth Sciences: An International Geoscience
Journal of the Geological Society of Australia, 60, 45-58.
The Parliament of Western Australia (2011), Petroleum and Geothermal Energy Legislation
Amendment Bill 2011: Draft 3: Perth, Western Australia, Australia.
http://www.dmp.wa.gov.au/documents/Petroleum_and_Geothermal_Energy_Legislation_Amendment
_Bill_2011.pdf (accessed 1 April 2013).
Torp, T. and Brown, K. (2002), CO2 Underground Storage Costs as Experienced at Sleipner and
Weyburn: in Proceedings of the 7th International Conference on Greenhouse Gas Control
Technologies (GHGT-7).
Young-Lorenz, J.D. and Lumley, D. (2013), Portfolio analysis of carbon sequestration technologies and
barriers to adoption: General methodology and application to geological storage: Energy Procedia, 37,
5063-5079.

Methodology Development
56
Zero Emission Resource Organisation [ZERO] (2013), Collie South West CO2 hub.
http://www.zeroco2.no/projects/collie-south-west-hub (accessed 18 April 2013).

Geosequestration
57
CHAPTER 3
APPLICATION OF METHODOLOGY:
GEOSEQUESTRATION: CARBON CAPTURE AND
STORAGE IN GEOLOGICAL FORMATIONS
OVERVIEW
In this chapter, the methodology and rating system discussed in Chapter 2 are applied to
evaluate Geosequestration (GS); i.e. carbon capture and storage (CCS) in subsurface geological
formations. Although the rating of projects is site-specific, particularly when comparing onshore
and offshore, the storage capacity of geological formations to sequester large amounts of carbon
dioxide (CO2) within a relatively short time frame is recognised as a major advantage of this
carbon management strategy. The technical capacity of storage sites is defined by the capacity
which is available to reduce greenhouse gas (GHG) emissions with current technologies, and is
not equivalent to economic capacity. Economic capacity is the available storage capacity within
economic and social constraints. The quality of storage available worldwide is a major
advantage of GS in mitigating atmospheric CO2. Surprisingly, the expectation of a high rating
for the Science and Technology criterion of GS was not upheld, even though there are forty
years of relevant petroleum industry experience in injecting and producing fluids, drilling,
finding traps, and characterising and monitoring reservoirs. A lack of social licence to operate
for onshore CO2 storage, and the high costs of capture and long-term monitoring, lower the
rating. Additional issues relate to technology novelty in applying the technology for the storage
of CO2 rather than for oil and gas extraction, and technology transfer to other high emitter
industries. My results indicate that the most critical barriers to widespread commercial adoption
of GS are not technology- or capacity-related, but instead relate to issues of public acceptance
and economics. Despite these concerns, the analysis suggests that GS has a medium to high
probability of success as a commercial-scale CO2 storage option.

Geosequestration
58
Geosequestration
59
3.1 INTRODUCTION
As discussed in the Introduction chapter, global emissions of greenhouse gases (GHG)
covered by the Kyoto Protocol have increased approximately 70 percent (%) from 1970–2004,
and by 24% from 1990–2004. Carbon dioxide (CO2) is the largest contributor to this increase,
having grown by about 80% (IPCC, 2007). In order to limit temperature increases from pre-
industrial levels to 2 degrees Celsius (°C) several global climate models suggest that
atmospheric concentrations of GHG must be stabilised at 450 parts per million (ppm) of CO2
equivalent by 2050 (Global CCS Institute, 2011a). In the Stabilisation Triangle Model,
presented by Pacala and Socolow in 2004, GS represents one of the most promising strategies to
mitigate CO2.
According to the International Energy Agency’s [IEA] Energy Technology Perspectives
2012, GS may be capable of accounting for about 17% of the recommended CO2 emissions
reductions required by 2050. GS involves the capture of CO2 at industrial emission source
points, transport of the CO2 to a storage site, and injection of the CO2 into a subsurface
geological storage reservoir. Industrial CO2 source points include coal-fired power generation,
steel, chemical, fertiliser, cement, mineral, and liquified natural gas (LNG) plants. Transport of
the captured CO2 occurs via pipeline or alternative methods such as shipping, trucking etc.
Suitable storage sites are typically geological formations deeper than ~1km where a
combination of porous reservoir rock (e.g. sandstone) and non-permeable cap-rock (e.g. shale)
form a reservoir-seal pair. The 1km upper depth limit results from the pressures and
temperatures needed to keep CO2 in a compressed liquid form. The most favourable storage
formations are depleted oil and gas reservoirs and saline aquifers deep in the subsurface. Oil and
gas reservoirs are subsurface rock formations that act as natural traps of fluids and gases (fossil
fuels). They already have a proven reservoir-seal pair as hydrocarbons were held in place prior
to production for millions of years. Once the majority of the hydrocarbons have been produced
and the reservoirs end their economic life, the reservoirs are said to be depleted. Saline aquifers,
sometimes referred to as saline sinks, are porous and permeable rock formations containing very
salty brine water that are located deep in the subsurface of sedimentary basins both onshore, and
offshore on the continental shelves. The water resources are not potable (drinkable) and
therefore have limited or no economic value. The CO2 in liquid supercritical phase is injected
and sequestered by a variety of geological trapping mechanisms over time. Figure 3.2 shows a
schematic of the GS process.

Geosequestration
60
Figure 3.1. Schematic Diagram of the Geosequestration Process. Methane gas produced from offshore
gas reservoirs is piped onshore and converted to LNG for transport or burned to generate electricity).
The CO2 is separated from the gas stream and piped onshore or offshore for injection and storage in
depleted oil and gas reservoirs, and deep saline aquifers (Image source: Scottish Centre for Carbon
Storage, 2011).
There are currently only a few commercial-scale GS projects active around the world.
Commercial-scale GS projects are defined as storing 1 metric tonne of Carbon per annum
(Mtpa). A metric tonne (1000 kilogram (kg) = 2240 pounds (lbs) in comparison to an
imperial/US/short ton (2000 lbs = 907kg). A tonne is approximately 10% more than a ton.
Sleipner, a gas field in the Norwegian North Sea, was the first commercial CO2 storage project.
Since 1996, 16Mt CO2 has been injected at a rate of 1Mtpa, at about 1,000m below sea level
into the Utsira Formation, a saline sandstone formation (Eiken et al., 2011). The Weyburn-
Midale project (Saskatchewan, Canada), operational since 2000, utilises CO2 piped from the
Great Plains Synfuels Plant in North Dakota, USA for enhanced oil recovery, injecting CO2 into
the Weyburn (2.4Mtpa CO2) and into Midale (0.4Mtpa CO2) carbonate reservoir oil reservoirs
(Whittaker et al., 2011; Whittaker, 2004; Wilson and Monea, 2004). At the In Salah CCS
project in Algeria, 1.2Mtpa CO2 from gas processing has been injected 1800m into the Krechba
Formation, a depleted oil reservoir in Algeria since 2004 (Eiken et al., 2011).
The Cranfield Project in Mississippi, USA, began in 2008 as a pilot test project and by
March 2012 had injected a total of 5 million metric tonnes CO2 (3.5 million metric tonnes from
the Jackson Dome natural source and 1.5 million metric tonnes produced and recycled from
Plant Barry Power station) into the lower Tuscaloosa Formation, a deep sandstone saline aquifer
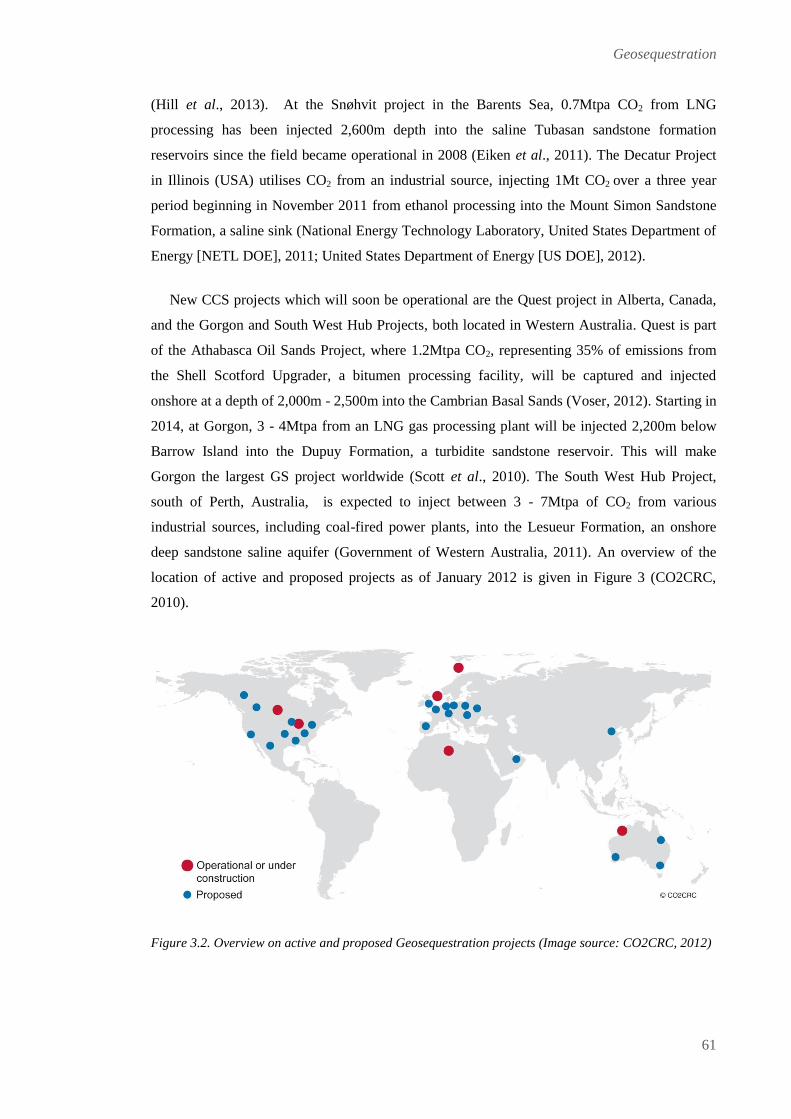
Geosequestration
61
(Hill et al., 2013). At the Snøhvit project in the Barents Sea, 0.7Mtpa CO2 from LNG
processing has been injected 2,600m depth into the saline Tubasan sandstone formation
reservoirs since the field became operational in 2008 (Eiken et al., 2011). The Decatur Project
in Illinois (USA) utilises CO2 from an industrial source, injecting 1Mt CO2 over a three year
period beginning in November 2011 from ethanol processing into the Mount Simon Sandstone
Formation, a saline sink (National Energy Technology Laboratory, United States Department of
Energy [NETL DOE], 2011; United States Department of Energy [US DOE], 2012).
New CCS projects which will soon be operational are the Quest project in Alberta, Canada,
and the Gorgon and South West Hub Projects, both located in Western Australia. Quest is part
of the Athabasca Oil Sands Project, where 1.2Mtpa CO2, representing 35% of emissions from
the Shell Scotford Upgrader, a bitumen processing facility, will be captured and injected
onshore at a depth of 2,000m - 2,500m into the Cambrian Basal Sands (Voser, 2012). Starting in
2014, at Gorgon, 3 - 4Mtpa from an LNG gas processing plant will be injected 2,200m below
Barrow Island into the Dupuy Formation, a turbidite sandstone reservoir. This will make
Gorgon the largest GS project worldwide (Scott et al., 2010). The South West Hub Project,
south of Perth, Australia, is expected to inject between 3 - 7Mtpa of CO2 from various
industrial sources, including coal-fired power plants, into the Lesueur Formation, an onshore
deep sandstone saline aquifer (Government of Western Australia, 2011). An overview of the
location of active and proposed projects as of January 2012 is given in Figure 3 (CO2CRC,
2010).
Figure 3.2. Overview on active and proposed Geosequestration projects (Image source: CO2CRC, 2012)

Geosequestration
62
A wide range of numerous small CCS pilot and demonstration projects of < 100 kilo tonnes
per annum (ktpa) have been implemented globally over the past 10+ years (Jenkins et al., 2011;
Schilling et al., 2009; Aimard et al., 2007). These include the Otway Project in Victoria
(Australia) where over 65,000 tonnes (t) CO2 has been injected at a depth of 2000m into the
Waarre-C Formation, a depleted sandstone gas reservoir (Jenkins et al., 2011). In Germany,
Ketzin became a major European CO2 storage test site in 2008, injecting a total of 60kt CO2
since inception into a shallow saline formation at about 650m depth (Schilling et al., 2009).
Since 2010, the TOTAL Lacq Project has injected 75kt of CO2 from oxyfuel combustion at
4,500m depth into an onshore depleted natural gas field (Aimard et al., 2007). A key objective
of these many test projects is to perform research experiments and develop the necessary
expertise for commercial upscaling of GS.
In the following sections, the new methodology developed in this thesis will be applied
specifically to GS to evaluate its current status and capability as part of a carbon mitigation
strategy, and to highlight its benefits and challenges for full-scale commercial adoption. Case
studies and examples will be provided to support the assessed scores. I conclude the chapter
with a discussion of the applicability of my methodology to CCS technologies in general and
the outcome of its application to GS.
3.2 METHODOLOGY
The technology elements unique to GS as a CCS option are identified and input into the Sub-
Matrix (refer to Table 3.4):
1) Site Identification and Characterisation,
2) Capture,
3) Transportation,
4) Injection and Storage, and
5) Measurement, Monitoring and Verification (MMV).
I have identified these technology elements from a major literature review of GS including
governmental, international agency and corporate reports, journal databases, websites, etc.
(IPCC, 2005; IEA GHG, 2012; Schlumberger Business Consulting Energy Institute [SBC
Energy Institute], 2012). A description of each element, including core scientific and

Geosequestration
63
engineering concepts, is discussed in this section. An assessment across the evaluation criteria
generates individual ratings and these provide the overall technical readiness score in the
Science and Technology column of the Master Matrix (Table 3.5).
3.2.1 Technology Element 1: Site Identification and Characterisation
“Site Identification and Characterisation” encompasses the assessment of the economic and
technical feasibility of geological storage sites capable of sequestering CO2, for secure, long
term storage at the volumes necessary to offset anthropogenic CO2 emissions. Many of the
scientific and technical issues discussed under this element, such as storage capacity controls
and the properties of injected CO2, also affect Technology Element 4: Injection and Storage.
CO2 can be injected into sedimentary basins that contain both porous permeable rocks (e.g.
sandstone) as a storage formation and non-permeable rocks (e.g. claystone, shale) as a seal, or
cap rock. Porosity is the measure of the void space in the rock for fluids or gases, and
permeability is the measure of the ability of the rock to allow fluid flow. These reservoir-seal
pairs provide suitable storage sites for CO2 (Figure 3.4) and include depleted oil and gas (O&G)
reservoirs and saline formations. Depleted O&G reservoirs are considered the best immediate
candidates for storage of CO2 as they have high porosity and permeability, traps and seals, and
their retention potential is proven with fossil fuels trapped for millions of years. In addition,
many of these reservoirs are already well characterised as part of hydrocarbon exploration and
production, including computer earth models developed to predict and match the movement of
the hydrocarbon displacement and history matched with the production data. Existing
infrastructure and wells can also be utilised for GS. While the number of depleted O&G fields
is limited and global capacity of known discoveries estimated between 675 - 900 GtCO2, the
global storage potential of deep saline aquifers in sedimentary basins is estimated between 1000
to 11,000GtCO2. Saline formations represent the largest storage potential but are currently not
well characterised, with many uncertainties about permeability, porosity, seals or traps. (IPCC,
2005)
Ideally, storage sites should be located close to the source point of emissions, which could be
sources such as oil and gas production characterised by high CO2 content, or an industrially
emitted source, such as coal-fired power generators or natural gas processing plants (Figure
3.1). The geological, geophysical and geochemical aspects of each basin are assessed to
estimate volume capacity and ability to securely store CO2 for the long term. The trapping
mechanisms of geological sequestration (e.g. structural and stratigraphic traps, capillary

Geosequestration
64
pressure / residual saturation, solubility and mineralisation) (Bachu, 2003) are discussed under
Section 3.2.4.2 (Technology Element 4: Injection and Storage).
Figure 3.3. Injection of carbon dioxide into depleted oil and gas reservoir (Image source: Scottish Centre
for Carbon Storage, 2012.)
Properties of Carbon Dioxide
One prerequisite of site characterisation is the identification of the depths at which CO2
changes phase and becomes a supercritical fluid. This is dependent on temperature and pressure,
with the critical point of pure CO2 being 31.1 degrees Celsius (⁰C) and 7.3 megapascals (MPa)
(Angus et al., 1973) (Figure 3.4). A 400-fold decrease in volume occurs when CO2 changes to
supercritical or dense-phase, typically at >800m depth, with the exact threshold depending on
the geothermal temperature and pressure gradient of the Basin (Figure 3.5). CO2 is transported
and injected in a supercritical state as it exhibits gas-like viscosity and liquid-like density, with
volume efficiencies and better fluid-flow diffusion properties.
When CO2 is first injected, it does not dissolve immediately in the formation water, and also
may not mix homogeneously. Instead, it is said to be free-phase or largely immiscible. In
supercritical phase, it is less dense than the formation water and due to gravity, migrates
upwards driven by buoyancy (the density difference between the CO2 and formation water) until
it becomes trapped on the seal rock surface. Buoyancy pressure (Pb) is opposed by capillary
pressure (Pc), which is the difference in pressure across the surface of two immiscible fluids.
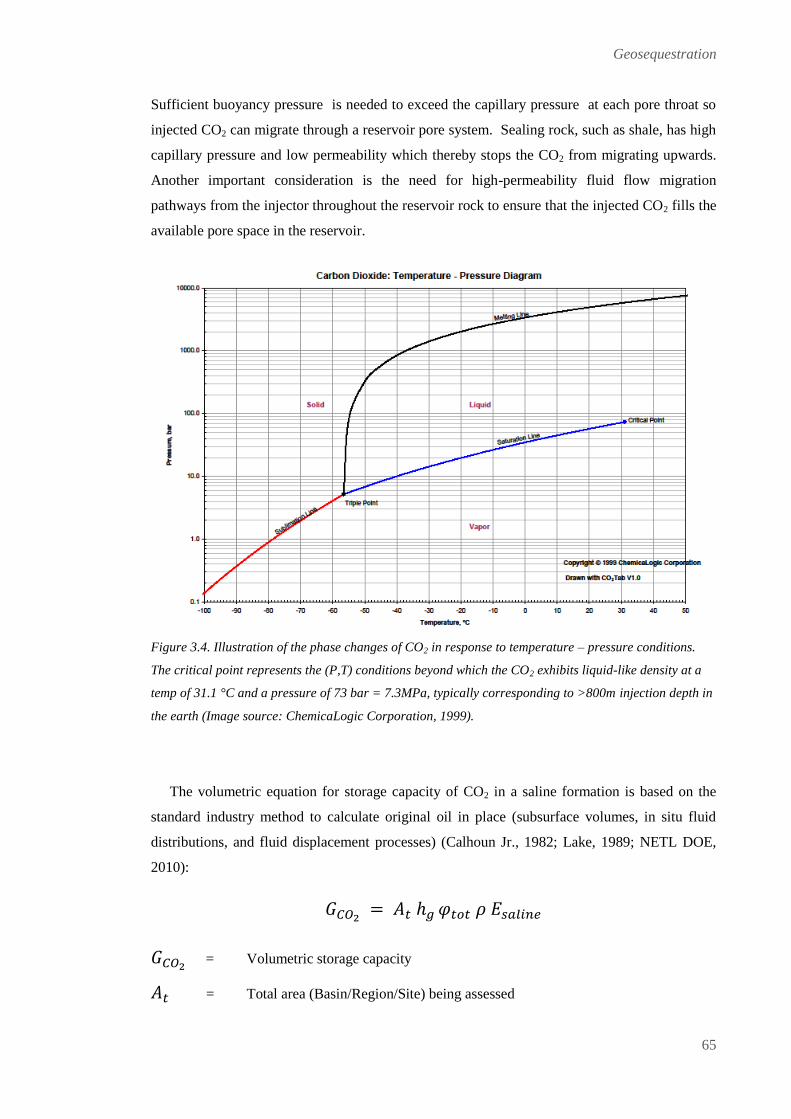
Geosequestration
65
Sufficient buoyancy pressure is needed to exceed the capillary pressure at each pore throat so
injected CO2 can migrate through a reservoir pore system. Sealing rock, such as shale, has high
capillary pressure and low permeability which thereby stops the CO2 from migrating upwards.
Another important consideration is the need for high-permeability fluid flow migration
pathways from the injector throughout the reservoir rock to ensure that the injected CO2 fills the
available pore space in the reservoir.
Figure 3.4. Illustration of the phase changes of CO2 in response to temperature – pressure conditions.
The critical point represents the (P,T) conditions beyond which the CO2 exhibits liquid-like density at a
temp of 31.1 °C and a pressure of 73 bar = 7.3MPa, typically corresponding to >800m injection depth in
the earth (Image source: ChemicaLogic Corporation, 1999).
The volumetric equation for storage capacity of CO2 in a saline formation is based on the
standard industry method to calculate original oil in place (subsurface volumes, in situ fluid
distributions, and fluid displacement processes) (Calhoun Jr., 1982; Lake, 1989; NETL DOE,
2010):
= Volumetric storage capacity
= Total area (Basin/Region/Site) being assessed
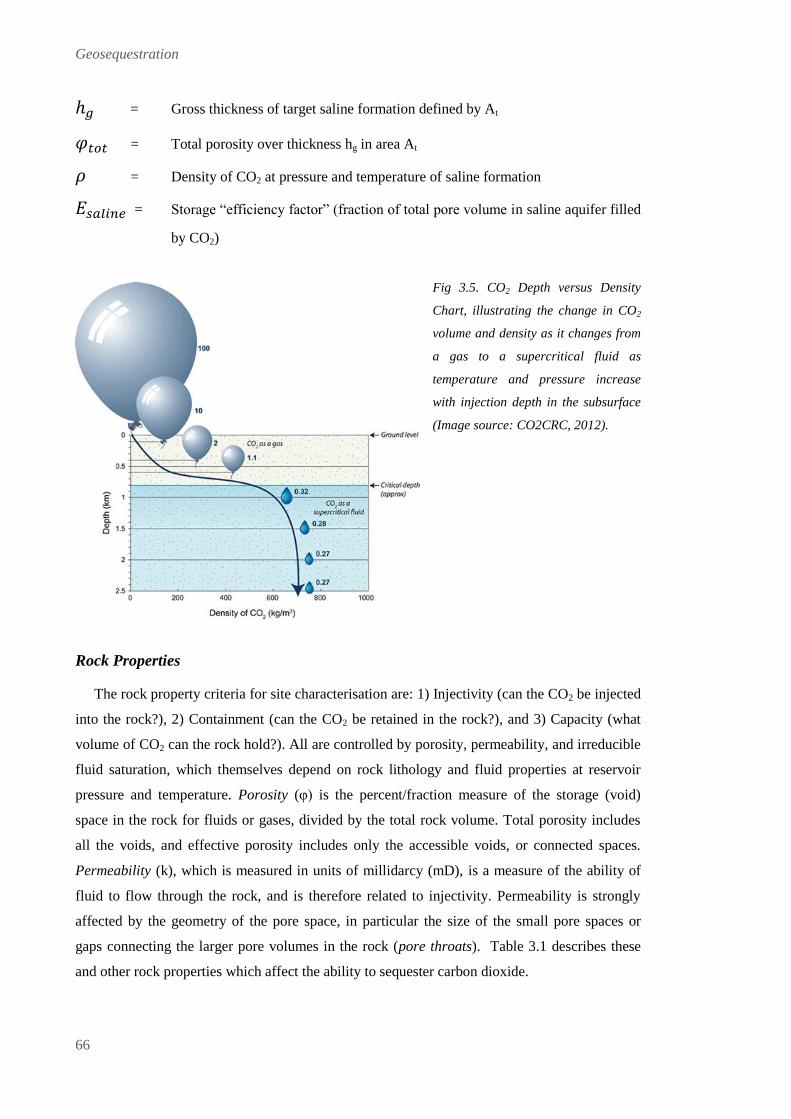
Geosequestration
66
= Gross thickness of target saline formation defined by At
= Total porosity over thickness hg in area At
= Density of CO2 at pressure and temperature of saline formation
= Storage “efficiency factor” (fraction of total pore volume in saline aquifer filled
by CO2)
Fig 3.5. CO2 Depth versus Density
Chart, illustrating the change in CO2
volume and density as it changes from
a gas to a supercritical fluid as
temperature and pressure increase
with injection depth in the subsurface
(Image source: CO2CRC, 2012).
Rock Properties
The rock property criteria for site characterisation are: 1) Injectivity (can the CO2 be injected
into the rock?), 2) Containment (can the CO2 be retained in the rock?), and 3) Capacity (what
volume of CO2 can the rock hold?). All are controlled by porosity, permeability, and irreducible
fluid saturation, which themselves depend on rock lithology and fluid properties at reservoir
pressure and temperature. Porosity (φ) is the percent/fraction measure of the storage (void)
space in the rock for fluids or gases, divided by the total rock volume. Total porosity includes
all the voids, and effective porosity includes only the accessible voids, or connected spaces.
Permeability (k), which is measured in units of millidarcy (mD), is a measure of the ability of
fluid to flow through the rock, and is therefore related to injectivity. Permeability is strongly
affected by the geometry of the pore space, in particular the size of the small pore spaces or
gaps connecting the larger pore volumes in the rock (pore throats). Table 3.1 describes these
and other rock properties which affect the ability to sequester carbon dioxide.

Geosequestration
67
Table 3.1. Rock properties affecting the ability to sequester CO2 (Sheriff, 2002; Selley, 1998; Angus et al.,
1973; CO2CRC, 2008).
Fluid saturation refers to the relative volume (percentage/fraction) of a fluid or gas
compared to the available pore space or porosity. Subsurface rocks naturally contain some
amount of water, brine, oil and gas that must be compressed or displaced in order to accept the
injected CO2. When CO2 is injected, the water is displaced out of the rock. It will not displace
100% of the original fluid, and the amount which remains is the irreducible fluid saturation of
that phase. For example, a thin film of water remains around each grain because of surface
tension forces, thereby “wetting” the rock grains. The irreducible fluid saturation depends on
specific rock types. It is a critical control on storage capacity and relates to relative permeability
(the permeability of one fluid compared to another, usually water). A low irreducible fluid
saturation reflects a high capacity of storage availability, for example, an irreducible water
saturation (SWIRR) of 7% means 93% of connected pore space is available for storage.
Sedimentary Basin Assessment
Assessment of a sedimentary basin for CO2 storage requires evaluation of a range of factors
(Table 3.1) including regional and structural geology studies (outcrops, rock/well core samples),
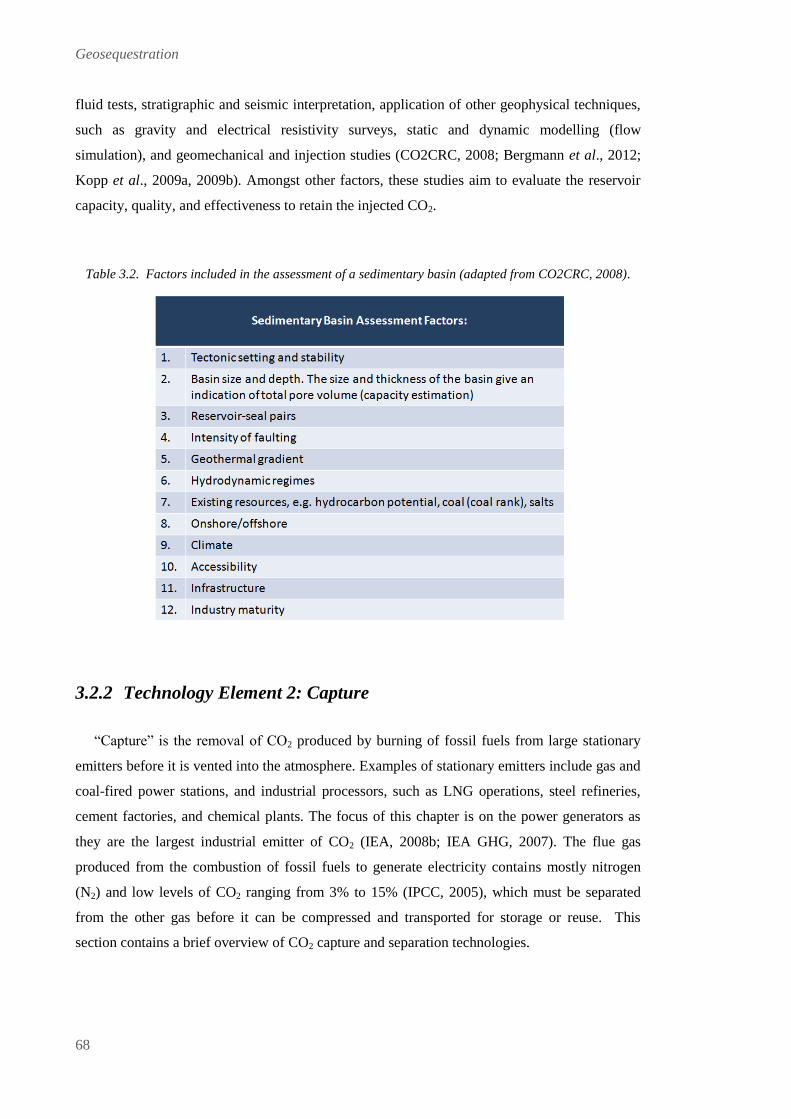
Geosequestration
68
fluid tests, stratigraphic and seismic interpretation, application of other geophysical techniques,
such as gravity and electrical resistivity surveys, static and dynamic modelling (flow
simulation), and geomechanical and injection studies (CO2CRC, 2008; Bergmann et al., 2012;
Kopp et al., 2009a, 2009b). Amongst other factors, these studies aim to evaluate the reservoir
capacity, quality, and effectiveness to retain the injected CO2.
Table 3.2. Factors included in the assessment of a sedimentary basin (adapted from CO2CRC, 2008).
3.2.2 Technology Element 2: Capture
“Capture” is the removal of CO2 produced by burning of fossil fuels from large stationary
emitters before it is vented into the atmosphere. Examples of stationary emitters include gas and
coal-fired power stations, and industrial processors, such as LNG operations, steel refineries,
cement factories, and chemical plants. The focus of this chapter is on the power generators as
they are the largest industrial emitter of CO2 (IEA, 2008b; IEA GHG, 2007). The flue gas
produced from the combustion of fossil fuels to generate electricity contains mostly nitrogen
(N2) and low levels of CO2 ranging from 3% to 15% (IPCC, 2005), which must be separated
from the other gas before it can be compressed and transported for storage or reuse. This
section contains a brief overview of CO2 capture and separation technologies.

Geosequestration
69
Capture Processes
The three basic types of CO2 capture process are Post-Combustion, Pre-Combustion, and
Oxyfuel. Figure 3.6 illustrates these processes as well as natural gas processing.
Post-Combustion
Post-Combustion, or “end-of-pipe,” capture technologies can be installed on existing power
plants through retrofitting, and for future power plants (IPCC, 2005; Rackley, 2010a).
Following combustion of the fossil fuel, the flue gas passes through several processes of
separation which “clean” it through the use of liquid sorbents, such as amines, e.g.
monoethanolamine (MEA), absorbing the CO2 through chemical binding and then removing it
from the flue gas. Following the capture, the sorbent is regenerated through a desorber. This
allows the reuse of the sorbent and releases the captured CO2 for sequestration, or utilisation for
industrial purposes (IPCC, 2005; MacDowell et al., 2010).
Pre-Combustion
Pre-Combustion capture technologies, also known as Integrated Gasification Combined
Cycle (IGCC), use chemical processes to gasify the fossil fuel. A stream of almost pure oxygen
(O2) reacts with the fossil fuel through high pressure and temperature to form synthetic gas, or
“syngas,” which contains carbon monoxide (CO), CO2 and hydrogen (H2). By further
processing of the gas stream with water, the CO is converted to CO2 and H2. The H2 is extracted
and combusted through steam turbines to generate electricity, and the CO2 is captured using a
physical wash. (IPCC, 2005; MacDowell et al., 2010)
Oxyfuel
Oxyfuel combustion, also known as oxyfiring, uses pure O2 instead of air to combust the
fossil fuels, producing only CO2 and water as emissions. An air separation unit removes the N2
from the air (+/-78% volume), and produces O2. The fossil fuels are then combusted with the O2
in a boiler where steam is produced to power turbines and generate electricity. The flue gas
from this process contains high CO2 concentrations (>80% volume) which can easily and
efficiently be separated. (IPCC, 2005; MacDowell et al., 2010)

Geosequestration
70
Figure 3.6. Carbon Dioxide Capture Processes for LNG Processing, Post-Combustion, Pre-Combustion
and Oxyfuel (Image source: CO2CRC, 2012).
Capture and Separation Technologies
Absorption
Solvent-based absorption is a process in which carbon dioxide is absorbed from a gas stream
by using a liquid solvent, such as an amine like monoethanolamine (MEA), and waste heat
(Figure 3.8). Other solvents include carbonates and bicarbonates, but all are used in substantial
quantities. Recovery, or regeneration, of the solvent for reuse also requires a large amount of
power to remove impurities, for example, fly ash, soot, nitrogen oxides (NOX) and sulphur
oxides (SOX), which can reduce the absorption capacity of the solvent. The CO2 is removed
from the liquid which is recycled, and the gas stream emitted to the atmosphere. Absorption is
used in post-combustion capture (IPCC, 2005; MacDowell et al., 2010).

Geosequestration
71
Adsorption
Adsorption is a process where CO2 molecules are adsorbed from a gas stream and attracted
to accumulate on the surface of a solid or liquid (adsorbent) through physical or chemical
sorption. Examples of adsorbents include: silica gels and aluminas, metal organic frameworks,
other organic-inorganic hybrids, mineral zeolites, and meso-porous carbons. Amines can be
added to the pores of the adsorbent to attract CO2 molecules thus improving the adsorption
capacity of the material. Adsorption is used in Pre- and Post-Combustion capture that both
involve hot and wet flue gases. The three steps taken in adsorption systems are adsorption of
CO2, removal of impure gases, and desorption (IPCC, 2005; MacDowell et al., 2010).
Desorption
Desorption refers to the extraction, or recovery and release of CO2 from the liquid solvent
adsorbent with the use of membranes, temperature and pressure changes. This process is
achieved through a number of methods including: Thermal Swing Adsorption, Vacuum Swing
Adsorption, Pressure Swing Adsorption, and Electrical Swing Adsorption (Redhead, 1962;
Rackley, 2010b).
Membranes
Membranes can be used to filter out CO2 from gas streams. Made from polymers or
ceramics, the materials can be designed to work as physical gas separation membranes, or to
incorporate liquid solvent absorption stages and capture the CO2 during diffusion between the
pores of the membrane. For gas separation, the membrane acts as a semi-permeable barrier
through which the CO2 passes more easily than other gases. Enough pressure difference is
needed to drive separation across the membrane. The most common mechanisms for gas
separation in membranes are molecular sieving and solution-diffusion. Mechanisms for
membrane gas separation include spiral wound, flat sheet and hollow fibre (IPCC, 2005;
Rackley, 2010c). Systems combining the use of membranes with solvents can be used in the
absorption and desorption (Feron and Jansen, 2002).

Geosequestration
72
Figure 3.7. Absorption – Desorption is a cyclical process that captures CO2 by solvent-based absorption,
recovers the CO2, and re-utilises the solvent and waste heat (Image source: CO2CRC, 2012).
Cryogenic Technique
The use of low temperatures to cool, condense and purify CO2 from moderately concentrated
gas streams is called the Cryogenic technique and used in Oxyfuel combustion. The flue gas is
cooled to sub-zero temperatures under high pressure so only the CO2 condenses and other gases
(N2 and O2) are separated and released (Burt et al., 2009; MacDowell et al., 2010). Chilled
water is passed through cooling flue gas to form hydrate crystals with CO2 trapped inside. The
CO2 is released from the hydrates by heating (Surovtseva et al., 2011).
3.2.3 Technology Element 3: Transportation
The third technical element of GS is the safe and secure “Transportation” of the CO2 from
emissions source points to injection sites. CO2 can be transported as a solid, liquid or gas,
although gaseous CO2 is large volumetrically and not practical to handle. Methods of liquid CO2
transportation include ships, rail and road tankers, however, pipelines are the most common

Geosequestration
73
form of transportation used to transfer supercritical CO2. As CO2 is corrosive, pipelines are
generally constructed from carbon steel (Seiersten, 2001). Impurities (SO2, NO2, and H2S) are
removed and the CO2 is dried (<50ppm) before compression and liquefication to mitigate
corrosion and the risk of gas hydrate formation (IPCC, 2005).
The USA has extensive experience and a good safety record with the transportation of
supercritical CO2 by pipeline for enhanced oil recovery purposes, with ~ 6,200km of pipeline in
operation (Rackley, 2010e; IEA GHG, 2012). A high pressure between 13 - 19Mpa is
maintained for transport. The operating temperature for CO2 pipelines in the USA varies
between 4⁰C to 24⁰C (Hooper, 2011), with the CO2 alternating between supercritical and dense
phase. The alternative method of large volume transport is ships which carry liquid CO2.
Recommended transportation conditions are around 0.7MPa and -50⁰C. Offshore discharge of
CO2 requires heating and compression equipment on either the ship or offshore platforms in
order to inject the CO2 for storage (IPCC, 2005).
3.2.4 Technology Element 4: Injection and Storage
“Injection and Storage” include some of the points previously discussed under Technology
Element 1: Site Identification and Characterisation; specifically the properties of injected CO2,
and storage capacity controls (porosity, permeability and irreducible fluid saturation).
Injection
CO2 is injected at higher pressure than the initial reservoir pressure, resulting in reservoir
pressure build up. This pressure has to be kept below fracture pressure at which point the seal
rock could break and leakage could occur. The injection rate (volume/time) depends upon: the
area of the wellbore in contact with the formation, injection pressure, and permeability (Streit et
al., 2005; CO2CRC, 2008). Clean unconsolidated sandstone would be an example of a high
permeability reservoir rock with high injectivity. An example of a low permeability reservoir
rock with low injectivity would be a heavily cemented and mineralised sandstone.

Geosequestration
74
Storage
Secure long-term storage of injected CO2 in geological formations is dependent upon a
mixture of the four main types of trapping mechanisms: 1) Structural and Stratigraphic, 2)
Residual Saturation, 3) Solubility, and 4) Mineralisation. The way in which the CO2 is injected
and flows through the geological formation (plume migration), together with the time it remains
in storage, determines the relative proportion of the trapping mechanisms over time (Figure
3.9). CO2 plume migration in the reservoir depends on a number of factors including the
heterogeneity of the reservoir rock as well as the type of displaced fluid and presence of
permeability flow paths and barriers (CO2CRC, 2008; IPCC, 2005).
Figure 3.8. Illustration of physical and geochemical trapping mechanisms showing percentage of CO2
trapped and mechanism applicability versus time. The storage security of later trapping mechanisms is
higher than earlier mechanisms (Image source: Elements: Geoscience World, 2013).
Structural and Stratigraphic Trapping
Structural and stratigraphic trapping are physical mechanisms and the most familiar and best
understood form of trapping by geoscientists and thus present the lowest risk. Structural
trapping describes the process of CO2 being trapped in a local structural high like an anticline or

Geosequestration
75
tilted fault block which is covered by a non-porous, non-permeable seal rock (claystone or
shale) and thus inhibits further ascent of the fluid (Salvi et al., 2000; Selley, 1998). Stratigraphic
traps refer to geological containers where the lateral seals are provided by a change in rock type
(facies change), thereby preventing further lateral migration, and encompass features like pinch-
outs, unconformities, and channels (Selley, 1998). Structural and stratigraphic trapping occurs
within an immediate timeframe and continues as the plume migrates throughout the formation
(Figures 3.8 and 3.9) (IPCC, 2005).
Figure 3.9. Structural and Stratigraphic Carbon Dioxide Physical Trapping Mechanisms. Top left:
Structural - Fault trapping, Top right: Structural - Anticline or Dome/Fold trapping, Lower left:
Stratigraphic – Pinch-out or Facies Change trapping, Lower right: Stratigraphic - Unconformity
trapping (Image source: CO2CRC, 2011).
Residual Saturation Trapping
Residual CO2 saturation trapping during plume migration occurs when the CO2 is trapped in
pore space by surface tension or capillary pressure. It is a hydrodynamic process also referred to
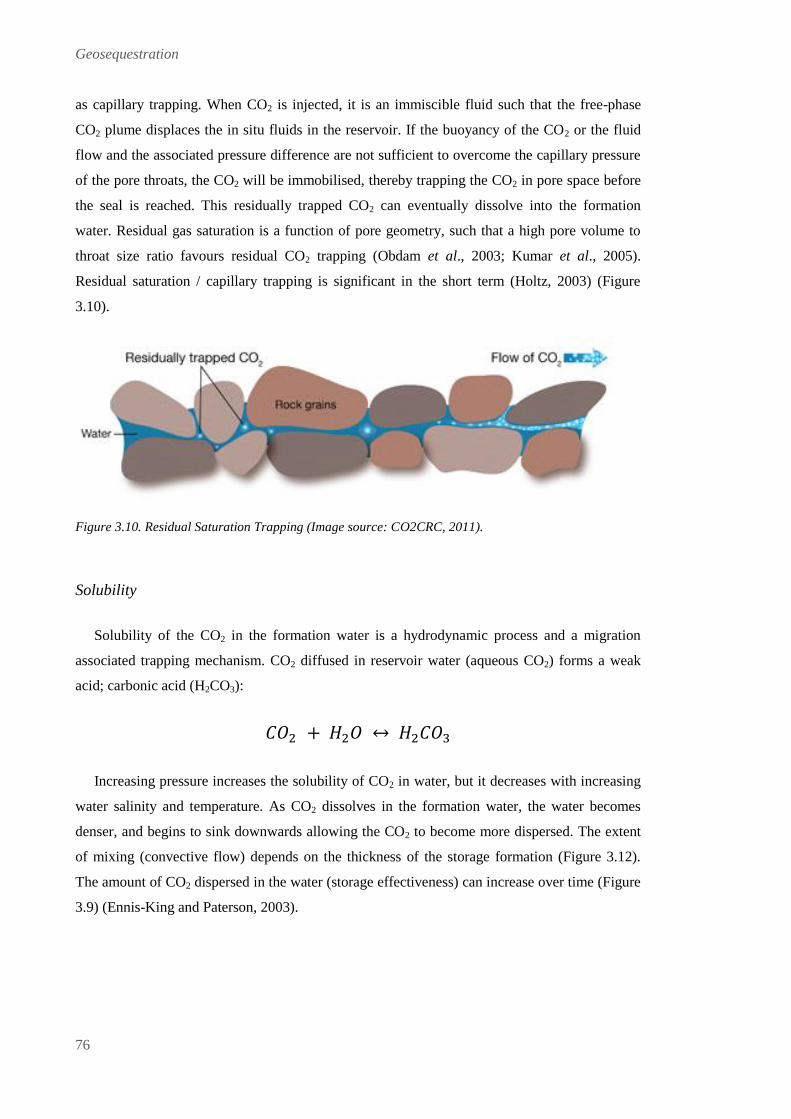
Geosequestration
76
as capillary trapping. When CO2 is injected, it is an immiscible fluid such that the free-phase
CO2 plume displaces the in situ fluids in the reservoir. If the buoyancy of the CO2 or the fluid
flow and the associated pressure difference are not sufficient to overcome the capillary pressure
of the pore throats, the CO2 will be immobilised, thereby trapping the CO2 in pore space before
the seal is reached. This residually trapped CO2 can eventually dissolve into the formation
water. Residual gas saturation is a function of pore geometry, such that a high pore volume to
throat size ratio favours residual CO2 trapping (Obdam et al., 2003; Kumar et al., 2005).
Residual saturation / capillary trapping is significant in the short term (Holtz, 2003) (Figure
3.10).
Figure 3.10. Residual Saturation Trapping (Image source: CO2CRC, 2011).
Solubility
Solubility of the CO2 in the formation water is a hydrodynamic process and a migration
associated trapping mechanism. CO2 diffused in reservoir water (aqueous CO2) forms a weak
acid; carbonic acid (H2CO3):
Increasing pressure increases the solubility of CO2 in water, but it decreases with increasing
water salinity and temperature. As CO2 dissolves in the formation water, the water becomes
denser, and begins to sink downwards allowing the CO2 to become more dispersed. The extent
of mixing (convective flow) depends on the thickness of the storage formation (Figure 3.12).
The amount of CO2 dispersed in the water (storage effectiveness) can increase over time (Figure
3.9) (Ennis-King and Paterson, 2003).

Geosequestration
77
Figure 3.11.
Solubility Trapping Mechanism
(Image source: CO2CRC,
2011).
Mineral Trapping
Mineral trapping (mineralisation) is a geochemical process closely linked with solubility
trapping. It refers to the Water – Rock – CO2 chemical interactions which occur when CO2 is
dissolved in water. The carbonic acid reacts with the reservoir rock to form and precipitate solid
carbonate minerals thus trapping CO2 in its most stable form as a mineral. Examples of solid
carbonate minerals are calcium carbonate, or calcite (CaCO3), and magnesite. The potential for
geochemical reactions to occur and form these precipitates/minerals depends on: composition of
the reservoir rock, rate of fluid flow, temperature and pressure, chemical composition of the
water, and water to rock contact area. (Gunter et al., 1993, 1997: Perkins et al., 2005)
An example of calcite mineralisation is given in the following geochemical reaction:
CO2 storage effectiveness increases with time for mineral trapping, and the process could
continue for over a thousand years after injection. Mineralisation is considered the ideal
trapping mechanism and most secure form of CO2 sequestration (IPCC, 2005).

Geosequestration
78
3.2.5 Technology Element 5: Measurement, Monitoring and Verification (MMV)
CO2 project operators, governments and other stakeholders are very concerned that the CO2
does not leak from the geological formations, potentially causing environmental damage or
posing hazardous situations and health risks (IEA, 2011; Jenkins et al., 2011; IPCC, 2005).
MMV provides a mechanism for assurance monitoring by taking measurements of geological,
geophysical and geochemical data as well as of air and water quality to ensure the technical
integrity of the storage site, and provide assurance to both regulators and the public. Operators
also need to account for the stored volume of carbon to gain economic benefits such as carbon
credits or to offset carbon debt (Hill et al., 2013).
It is important to take baseline measurements (including seasonal fluctuations) prior to
injection as there could be pre-existing, naturally occurring levels of CO2 within a reservoir or
in the surrounding environment. MMV provides an early warning system of CO2 leaks or
unexpected reservoir behaviour. MMV is used to check the accuracy of dynamic reservoir
models and predicted CO2 plume migration paths through further calibration and updating as
measurements are made over time. Operators and governments need to measure and monitor the
volumes of CO2 injected and how much remains securely contained in the geological formation
(Jenkins et al., 2011; Gorecki et al., 2012; Hill et al., 2013; IPCC, 2005).

Geosequestration
79
3.3 RESULTS
In this section, I apply the general concepts of my methodology for a semi-quantitative
assessment to the specific CCS technology of GS at its current state of development for a
general overview and from a global perspective. The more in-depth assessment for Science and
Technology is presented last for ease of reading/reference (Section 3.3.1). These results
represent an analysis of data from available case studies and regional bias could be attributed to
project location and public information. This analysis follows the one presented in Young-
Lorenz and Lumley (2013).
3.3.1 Public Acceptance
Public, stakeholder and political acceptance is increasingly seen by governments and
industry as crucial for the adoption of carbon mitigation projects to proceed. It has proven
difficult for GS project proponents to establish credibility and trust without extensive public
engagement (Kuijper, 2011; Itaoka et al. 2012). A lack of social licence to operate can result in
vocal public opposition and rejection by stakeholders, contributing to a negative perception.
Lack of public acceptance is compounded by involvement from non-local political
organisations, e.g. environmental activists, and media interactions which amplify possible risk
events and can even spread scientific misinformation (Itaoko et al., 2012).
How does GS affect me?
The CCS benefits of GS are generally accepted by the wider public (Shackley et al., 2007;
Ashworth et al., 2009; Itaoka et al., 2004; Reiner et al., 2006), and storage in remote and
offshore locations is generally deemed to be publicly acceptable, as for example at Sleipner
(Reiner, 2008). Concerns about onshore storage due to feared loss in property values, and health
and safety issues, often result in a not in my backyard (NIMBY) response that can lead to
cancellation of projects such as Barendrecht (Kuijper, 2011) and the Midwest Regional Carbon
Sequestration Project (Itaoka et al., 2012). Other local community fears include induced
seismicity, undesirable property access, and potential leakage into potable water supplies
(Kessler, 2009; Kuijper, 2011; SBC Energy Institute, 2013; Reuters, 2011; Global CCS
Institute, 2011b).

Geosequestration
80
The Barendrecht demonstration project in the Netherlands was cancelled at a late stage
because of fears of CO2 leakage, despite the long-term presence and production of methane
previously stored in the two depleted reservoirs. Failure to effectively engage the local
community resulted in demonstrations by active local groups which utilised internet activity to
generate opposition to the project (Kuijper, 2011). The Midwest Regional Carbon
Sequestration Project in Greenville, Ohio was also cancelled at a late stage of development. This
project would have injected 1Mtpa CO2 from a nearby ethanol plant more than 3000 feet
beneath the surface into the Mount Simon Sandstone formation. After reaching the execute
stage, the project was cancelled in August 2009 because of fears of increased seismic activity
and lowered property values, and in spite of receiving US$61 million funding from the
Department of Energy (Kessler, 2009). The balancing of public acceptance of offshore storage
but not onshore leads to an overall score of 2 for the how does GS affect me sub-criterion.
How natural is GS?
GS is viewed as an acceleration of a natural process in the carbon cycle in which CO2 is
stored naturally in geological formations for tens of thousands to millions of years (IEA GHG,
2009). Natural accumulations of CO2 exist in locations all over the world (IPCC, 2005). During
oil and gas extraction and processing, the CO2 is extracted at these locations and following
processing, is either vented or can be re-injected back into the geological site where it had been
safely stored for geological time scales. Thus, the how natural is GS sub-criterion scores highly
at 3.
Science and technology comprehension
The public generally has a limited knowledge about the scientific concepts underlying GS
and this can negatively impact the level of acceptance (Itaoka et al., 2012; Global CCS Institute,
2011b, Whitmarsh et al., 2011; European Commission, 2011). A common misconception about
geological storage is that the injection process into the subsurface is similar to blowing up a
huge balloon underground, i.e. leading to pressure build-up and potential leakage (Wallquist et
al., 2010) or induced seismicity (Global CCS Institute, 2011b). Unreasonable fears of
asphyxiation due to pressure build up and sudden CO2 release are partly responsible for the
cancellation of projects such as Barendrecht (Wallquist et al., 2010; Kuijper, 2011). For these
reasons, science and technology comprehension scores a 1.

Geosequestration
81
The combination of the sub-criteria scores results in an overall “public neutral” (2) Public
Acceptance rating. This is the score that is input into the Public Acceptance column of the
Master Matrix as illustrated in Table 3.3. Similarly, the evaluation criteria ratings will be
entered into the relevant columns of the Master Matrix.
Table 3.3 Illustration of average score of sub-criteria input into Public Acceptance column of the Master
Matrix.
3.3.2 Regulatory Frameworks
Enabling Body of Laws and Regulations
Much progress has been made in establishing regulatory frameworks for the implementation
of GS with the United Kingdom (UK), European Union (EU), Alberta (Canada), Norway, State
Government of Western Australia, and the Commonwealth of Australia leading.
The enabling body of laws and regulations fall mainly into three categories:
a) Emission limits
Emission limits are imposed on a national or regional level in the form of specific
emission limits or the introduction of a cost for CO2 emission. An example for specific
limits would be the recently introduced amendment to the UK Energy Bill, proposing a
statutory emission rate of 200g/kWh. This would require new gas-fired power generators
to install CCS technology (Bellona, 2013a). Other limits on emitters are introduced
through the setting of a carbon price, like the Australia’s Clean Energy Legislative
Package taxation scheme, which establishes a carbon price of AUD $23 until it switches
to a cap-and-trade market pricing in July 2015, linking with the EU’s Emission’s Trading
Scheme (ETS) and/or other carbon markets (The Commonwealth of Australia, 2012).
b) Funding incentives
Funding incentives are provided to companies to compensate for the higher CAPEX and
OPEX due to the introduction/integration of CCS technologies and encourage adoption.

Geosequestration
82
Examples are the EU’s New Entrance Reserve (NER 300) programme and the UK’s re-
launch of the £1 billion fund, previously allocated to Longannet, for a second CCS
Commercialisation Programme competition to develop a viable CCS industry in the UK.
c) Storage and Infrastructure
Legislation and regulation for storage and infrastructure introduces new or modifies
current laws to allow for CO2 storage and transportation, e.g. the amendment of existing
pipeline legislation in Western Australia to include the transportation of CO2 by pipeline
(The Parliament of Western Australia, 2011). In 2006, the amendment of The London
Convention and Protocol on the Prevention of Marine Pollution by Dumping of Wastes
and Other Matter, incorporated CO2 storage in geological formations under the sea bed
into international treaties. In 2007, The Convention for the Protection of the Marine
Environment of the North-East Atlantic (“OSPAR Convention”) was also amended to
allow for geological storage under the seabed; however this has yet to be ratified.
While significant progress has been made to establish regulatory frameworks for GS,
inconsistencies in regulation at both national and international levels, e.g. USA and Australia
(IEA, 2011), still negatively impact its uptake and application. The London Convention permits
storage, but does not allow for trans-border transportation impacting offshore storage in
particular (IEA, 2011). A draft Communication from the European Commission to EU member
states calls for greater commitment from both governments and industry to regulate sectoral
emission performance standards and/or mandatory CCS certificate schemes (Bellona, 2013b).
For the reasons discussed above, the enabling regulation sub-criterion scores a 2 rating.
Negative legislation?
Negative legislation in the form of restricted access to economically viable storage space, or
restrictions on the use of transport infrastructure, limits the uptake of GS. The Barendrecht,
Magnum and Eeemscentrale projects in the Netherlands are negatively impacted by the lack of
access to onshore storage sites (ICIS Heren, 2011). In the UK, access to the transport
infrastructure for CO2 is severely limited as no supercritical CO2 can be piped onshore (WA
ERA, 2010). While some of these negative legislations are historic and can be solved through
amendments to existing legislation as in Western Australia (The Parliament of Western
Australia, 2011), others are recent enactments as is the case in the Netherlands. As a result,
negative legislation scores a 1.

Geosequestration
83
Regulatory Certainty
Areas of priority for regulators are the long-term liability of GS projects and cross-border
jurisdictions, especially for onshore vs. offshore, marine dumping and transportation (IEA,
2011). High policy uncertainty for CCS can result in a significant increase of risk and planning
uncertainty (costs, liability and project delays), which may motivate commercial enterprises to
cancel projects and thus further hinder the adoption of a CCS technology (Bachu, 2008). For
example, the delay in enactment of proposed CCS legislation by the German government,
apparently led Swedish power utility Vattenfall to cancel the Jänschwalde project in
Brandenburg (Reuters, 2011; Helseth, 2011). This 1.5 billion Euro demonstration project would
have stored 1.7Mtpa CO2 in an onshore saline aquifer.
In 2008, the Commonwealth of Australia became the first country to legislate federal
exploration leases for CO2 offshore storage sites. This established the framework for temporary
ownership rights and provides operators with more certainty to plan for long-term projects.
Similar regulation was introduced in the UK, where the Crown owns the rights, and would issue
land leases for offshore CO2 storage up to the 200 mile (320 km) continental shelf international
boundary. The CO2 storage licences would be obtained through the Department of Energy and
Climate Change (DECC), with a draft licensing structure modelled on the current gas licensing
structure (Parliamentary Office of Science and Technology [POST], 2009).
Regulatory compliance to reduce CO2 emissions and/or mandate utilisation of CCS
equipment can significantly speed up the adoption process by making it a cost of doing
business. The mandated retrofitting of coal-fired power plants with CCS equipment by 2025 in
the UK (IEA, 2011) or the EU’s Large Combustion Plant Directive (European Union [EU],
2001) are two examples that provide a level competitive playing field for power plant operators.
It is estimated approximately one-third of the UK’s power requirements will be generated from
gas and coal-fired plants employing CCS by 2050 (National Audit Office, 2012). The costs of
retrofitting or inclusion of CCS equipment can be transferred to the consumer through price
increases without loss of competitiveness, if mandates to reduce CO2 emissions are legislated
and price increases approved.
The lack of certainty about long-term liability after handover is a significant barrier as it
poses significant economic risk for the operator. In the EU, any damage to the environment is
covered by the 2009 EU Environmental Liabilities Directive. The site operator is liable for
damage up to 30 years after an incident takes place, irrespective of the time the facility closes.
While not ideal due to the continuing liability beyond project end, it still provides a clearly
defined time frame for liability. The IEA’s CCS Review (2011) stated that the trend tends to be

Geosequestration
84
towards transferral of long-term liability from the operator to government, but that there are
notable differences between jurisdictions as to interpretation and processes of the transferral
requirements.
Operators in the UK and EU are responsible, under Article 18 of the EU Directive on the
Geological Storage of CO2, and must cover post-closure costs, liabilities and all other
obligations until project end when the reservoir is sealed and the facilities decommissioned.
Transfer of liability to the government only occurs once the operator provides a report to
demonstrate the following:
(a) the conformity of the actual behaviour of the injected CO2 with the modelled
behaviour;
(b) the absence of any detectable leakage;
(c) that the storage site is evolving towards a situation of long-term stability.
(European Parliament and the Council of the European Union [EU],2009)
MMV rules must also be in place for operators and governments to qualify or audit for
carbon accounting (payment of money or credits), or make it clear when legal obligations are
fulfilled, e.g. EU CCS Directive and the EU ETS Monitoring and Reporting Guidelines. An
independently managed fund may be required for CO2 storage liabilities as per the nuclear
experience (UKERC, 2012), however, to date, there is no such independent insurance fund or
special trust fund which covers the post-closure liabilities of leakage remediation (IEA, 2011) or
liability associated with emission repayments due to leakage (SBC Energy Institute, 2012).
Regulatory certainty scores a 2 rating.
Averaging the three sub-criteria thus brings the overall Regulatory Frameworks score to a
“neutral” (2) rating, which is entered into the Regulatory Frameworks column of the Master
Matrix.

Geosequestration
85
3.3.3 Economics
Viable Business Case
Oil and gas (O&G) operators use Carbon Capture and Utilisation and Storage (CCUS) to
generate supplementary income from enhanced oil recovery (EOR) which is not readily
available to other industrial CO2 emitters. Without this economic benefit, they would be
unlikely to commit the significant investment CCS represents on a large scale (with the
exception of possible R&D or test case purposes) unless regulation made it mandatory.
Combining GS with reutilisation of CO2 for hydrocarbon recovery offers the opportunity to
achieve both economic viability and CO2 mitigation. R&D efforts are underway to gain insight
about CO2 projects in EOR contexts (Gorecki et al., 2012). The Sectoral Assessment CO2
Enhanced Oil Recovery Report (2011), by Advanced Resources International for the United
Nations Industrial Development Organisation (UNIDO), estimates the long-term storage
volumes of CO2 through EOR at 318GtCO2, with the capacity of the largest 54 oil basins in the
world about 140GtCO2, and the potential recovery of 470 billion additional barrels of oil. Figure
3.13 illustrates CO2 sources, pipelines and CO2 projects in the USA.
The petroleum industry also has the advantage of technical expertise and experience with
onshore EOR in the USA since 1972, whereas the coal and other heavy CO2 emitter industries
do not, so a significant gap of GS knowledge and experience exists between the industries. The
slow adoption of GS also means that skill sets are developed but lost as experts, engineers and
technicians move to more financially stable industries. Events like the Global Finance Crisis
have negatively impacted uptake of GS technologies and projects, for example, both the
Freeport Gasification Project in Texas (Global CCS Institute, 2011c), and Phase 2 of the
American Electric Power [AEP] Mountaineer Project in West Virginia (Wald and Broder, 2011;
AEP, 2011) were cancelled because of the uncertainty of US climate policy and weak economic
conditions.
GS is costly but not prohibitive (Cook, 2012) with the most significant expenditure at the
capture stage. Other factors impacting the economics of a project include the existence of
reusable legacy wells, distance between emissions source point and storage site, and number of
emissions sources (SBC Energy Institute, 2012). The cost of CO2 avoided is lower for coal-fired
CCS power plants than for some alternatives such as renewables like solar and offshore wind
(Global CCS Institute, 2011d; SBC Energy Institute, 2012; ZEP, 2011). The levelised cost of
electricity (LCOE) of a CCS coal-fired plant is US$89-139 per megawatt hour (/Mwh) and for a
CCS natural gas plant US$107-119/MWh (Global CCS Institute, 2011d). A dollar value is put

Geosequestration
86
on emissions through the “cost of CO2 avoided,” expressed in dollars per tonne of CO2. The cost
of CO2 emissions avoided for a coal-fired power plant with CCS technology ranges between
US$23–92/t compared with US$139-201/t for solar thermal and US$90-176/t for offshore wind
(Global CCS Institute, 2011d). The 2011 European Technology Platform for Zero Emission
Fossil Fuel Power Plants [ZEP] Report on the Costs of CO2 Capture, Transport and Storage:
Post-demonstration CCS in the EU stated that CCS will be cost-competitive with other low-
carbon energy technologies after 2020.
Figure 3.12. Overview of onshore CO2 projects in the USA, together with the utilised CO2 sources and the
associated pipeline network. The CO2 is primarily used for EOR (Image source: Melzer, 2011).
In the presence of CO2 emissions penalties, the CAPEX and OPEX costs can be offset
through financial savings in penalty rates. For instance, the Norwegian Government has both
emissions legislation and a carbon price; therefore state-owned operator Statoil had economic
frameworks to assess decisions for projects like Sleipner where 1Mtpa CO2 is injected into the
reservoir until 2025, saving Statoil around US$100,000 in carbon taxes every day (Torp and
Brown, 2001). In 2012, the DECC (UK), announced plans under its proposed new energy bill,
to introduce an agreed Contract for Difference (CfD) for CCS generated power which would be
competitive with strike prices against other low carbon generation technologies and against the
traded electricity market price. The CfD would provide an instrument of long term support for
the high CAPEX and means electricity companies can make investment decisions to build CCS
equipped fossil fuel power stations without Government capital. With this, CCS and low-carbon
fossil-fuelled electricity generation has the potential to be a profitable industry. (The House of
Commons, 2013)
The discussion above indicates that the viable business case sub-criterion scores a 2 rating.

Geosequestration
87
Dependency Public Funding
There is currently a high level of dependency on government financial incentives for
projects, for example Longannet (Haszeldine, 2011; BBC News Online [BBC] 2011a, 2011b)
and the South West (SW) CO2 Sequestration Hub project (Government of Western Australia,
2011). GS projects without the supplementary income from enhanced hydrocarbon recovery are
currently only financially viable with government support, making them very susceptible to
policy changes. The Longannet Project, located in Scotland and winner of the CCS Competition
(£1billion) was the only planned commercial project in the UK, but was cancelled when the UK
Government withdrew its support after failure to agree terms with the consortium partners.
Longannet is the third largest coal-fired plant in Europe, producing 2400MW and one of the
largest polluters (7-8Mtpa CO2). A 2Mt, 260km pipeline was planned to transport CO2 from
Longannet, Fife to the North Sea for injection into depleted oil and gas reservoirs. The SW Hub
project in Western Australia was allocated AUD52 million from the Commonwealth of
Australia’s AUD1.68 billion Carbon Capture and Storage Flagships (CCS Flagships)
programme, part of the Australian Government’s $5 billion Clean Energy Initiative in June
2011. An additional AUD330 million is available should it progress past the current stage
(Government of Western Australia, 2011).
Government funding and incentives dependency earns a rating of 1.
Carbon Market?
At the Climate Summit held in Durban at the end of 2011, the Kyoto Protocol was extended
to 2017/2020 and CCS was included as a Clean Development Mechanism (CDM) that enables
the generation of Certified Emissions Reductions (CERs) carbon credits for sale on carbon
markets. As this is a relatively recent inclusion, GS is not sensitive to a weak carbon price and
immature market at this time. Inclusion of GS as a CDM will encourage developing nations to
adopt CCS technologies, but the largest GHG emitters, China, India and the USA, do not
qualify to generate CER carbon credits for trade or offset. Cap and trade systems are still under
development and cannot be relied upon for long-term reliable revenue streams (Aldy and
Stavins, 2011). The price of carbon has significantly decreased as a result of the lack of a global
regulatory framework and an oversupply of carbon credits. In 2011, the weighted average price
of carbon credits globally was only US$15/t CO2 (SBC Energy Institute, 2012). Therefore the
carbon market sub-criterion earns a neutral (2) rating.
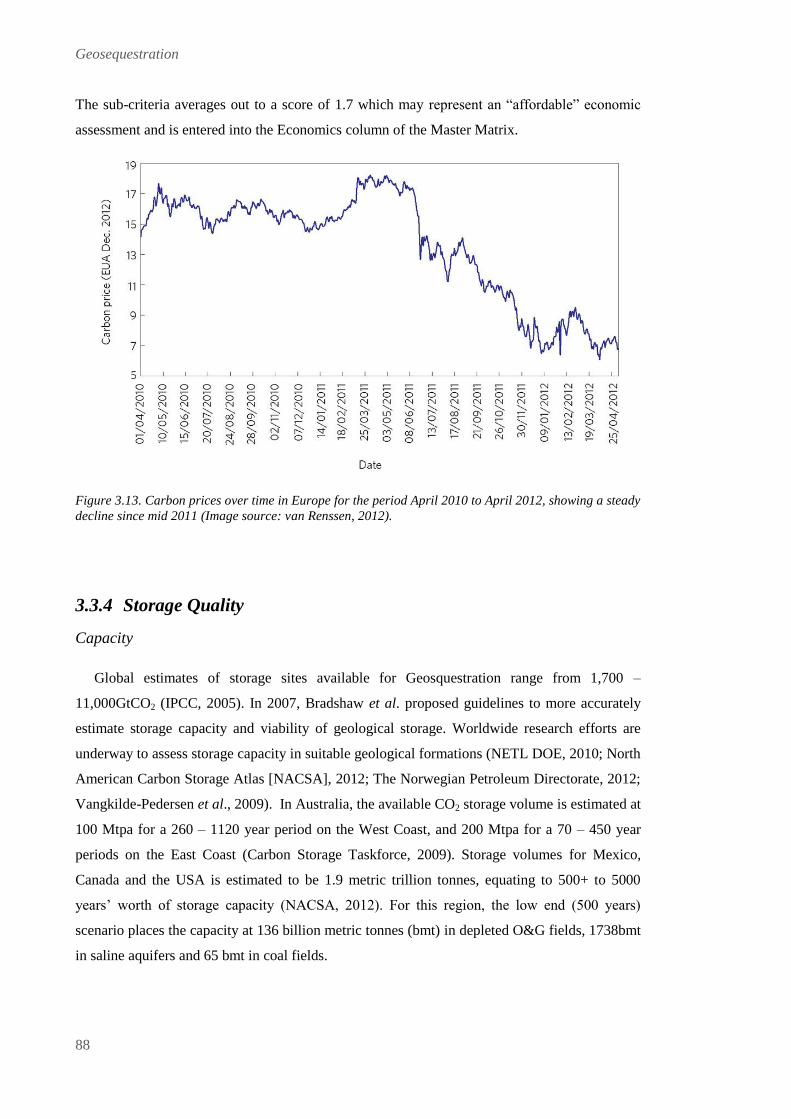
Geosequestration
88
The sub-criteria averages out to a score of 1.7 which may represent an “affordable” economic
assessment and is entered into the Economics column of the Master Matrix.
Figure 3.13. Carbon prices over time in Europe for the period April 2010 to April 2012, showing a steady
decline since mid 2011 (Image source: van Renssen, 2012).
3.3.4 Storage Quality
Capacity
Global estimates of storage sites available for Geosquestration range from 1,700 –
11,000GtCO2 (IPCC, 2005). In 2007, Bradshaw et al. proposed guidelines to more accurately
estimate storage capacity and viability of geological storage. Worldwide research efforts are
underway to assess storage capacity in suitable geological formations (NETL DOE, 2010; North
American Carbon Storage Atlas [NACSA], 2012; The Norwegian Petroleum Directorate, 2012;
Vangkilde-Pedersen et al., 2009). In Australia, the available CO2 storage volume is estimated at
100 Mtpa for a 260 – 1120 year period on the West Coast, and 200 Mtpa for a 70 – 450 year
periods on the East Coast (Carbon Storage Taskforce, 2009). Storage volumes for Mexico,
Canada and the USA is estimated to be 1.9 metric trillion tonnes, equating to 500+ to 5000
years’ worth of storage capacity (NACSA, 2012). For this region, the low end (500 years)
scenario places the capacity at 136 billion metric tonnes (bmt) in depleted O&G fields, 1738bmt
in saline aquifers and 65 bmt in coal fields.

Geosequestration
89
Depleted O&G fields are considered the best immediate candidates for storage of CO2 as
they have high porosity and permeability, and their retention potential is proven with fossil fuels
having been trapped for millions of years. In addition, many of these fields are already well
characterised through their production history. While the number of depleted O&G fields is
limited, the global storage potential of deep saline aquifers in sedimentary basins is estimated
between 100 - 11,000 Gt, but they are currently not well characterised (IPCC, 2005).
GS is very site and situation specific, with geological and lithological aspects of a site
affecting storage capacity. Operators need certain volumes of capacity to match project needs.
For example, the Gorgon project on the North West Shelf of Australia will soon be the largest
CO2 sequestration project in the world. Operator Chevron, requires a certain volume to be
injected over the life of the project, a 15mtpa liquefied natural gas (LNG) plant on Barrow
Island and a domestic gas plant for the Western Australia market (300 terajoules per day). An
estimated 3.4 - 4 mtpa of CO2 will be injected into a deep saline aquifer 2.5km below Barrow
Island into the Dupuy Formation for approximately forty years (Scott et al., 2010; Chevron,
2012) (Figure 3.15). An estimated 250 mtCO2 storage space will be needed to meet the project’s
volume requirements. Economic and social constraints result in a differentiation of technical
and economic storage capacity because of land and resource competition and the matching of
emissions sources to logistically suitable and publically acceptable sinks; however the large
volumes of technical capacity around the world justify a volume rating of 3
.
Figure 3.14. The Gorgon Project Development Concept illustrating the Greater Gorgon gas fields, gas
plant, and pipeline network to the mainland and Barrow Island.

Geosequestration
90
Rate
Large volumes of CO2 can be injected into reservoir formations quickly at pressures below
fracturing (fracking) point. While the rate of injection is related to the number of injection wells
(Hosa et al., 2011), the injectivity rate is site specific and largely dependent on the permeability
of the reservoir rock, thickness of the formation and the pressure gradient. The technically
feasible injection rate of a storage site must be aligned with the needs of the project. In the case
of the Snøhvit gas field, the CO2 injectivity of the rock was lower than initially predicted,
resulting in pressure build up and the risk of exceeding the fracking point by September 2011
(Molde, 2011; Helgesen, 2010). The resulting reduction in injection rate had technical and
economic implications for operator Statoil which has no permission to vent. From a
comparative perspective, the rate of GS compares more favourably to other CCS technologies
such as Afforestation or Algae which depend on photosynthesis and individual growth rates,
therefore GS rate earns a 3.
Duration
Storage of CO2 in geological formations is considered long-term and secure with duration
and storage integrity increasing over time, and dependent on the four CO2 trapping mechanisms
discussed in Section 3.2.4 (IPCC, 2005). Geological uncertainty caused by a lack of site
characterisation constrains the ability to predict and model interactions between the injected
CO2 with the reservoir rock, or the trapping mechanisms of capillary, dissolution and mineral
trapping. Limited knowledge exists about the effects of mineral and rock diagenesis due to the
presence of CO2 and the associated effects on porosity and permeability beyond the extraction
time frame (WA ERA, 2010). This can be offset through experiments on core samples (e.g. core
flood, formation fluid chemistry for rates of mineral dissolution) to build up a knowledge base
for different types of reservoir rock (Ketzer et al., 2009). Extensive knowledge about the
behaviour of fluids with respect to structural and stratigraphic trapping mechanisms is available
throughout the O&G industry due to their analogies with the hydrocarbon extraction process.
For these reasons, duration earns a 3.
Verification Potential
Current commercially available MMV technologies are capable of monitoring the CO2 plume
migration, identifying the presence of CO2 leakage, and provide input to static and dynamic

Geosequestration
91
reservoir models in offshore and onshore environments. These include chemical measurements
to assess soil, air, fluid, well cores, etc. as well as geophysical techniques with Figure 3.15
providing a brief overview (Lumley, 2001, 2011; Rackley, 2010d; Hill et al., 2013, Hovorka et
al., 2011; Eiken et al., 2004, 2011; Gilfillan et al., 2009). Examples are discussed in Section
3.3.6 (Technology Element 5: Measurement Monitoring and Verification) Increasing experience
will result in improved interpretation of the measurements to address geological uncertainties.
In addition, most countries have an existing legislative framework to allow for land access for
geophysical surveying work. This legal framework can be adapted to the needs of MMV
activities which typically require longer term arrangements to accommodate for land ownership
changes, re-zoning, as well as a higher frequency of access. For safety, risk and uncertainty
management procedures, the experience of the O&G industry with hazardous gases can be
utilised. Verification also merits a 3 rating.
Storage Quality scores a “high” (3) rating which is input into the Storage Quality column of the
Master Matrix. This evaluation criterion is a major advantage of GS as a carbon mitigation
option.
Figure 3.15. Geophysical techniques to characterise sedimentary basins for suitability as CO2 storage
sites and to monitor changes in the reservoirs (Image source: Subsurface Imaging Group, The Ohio State
University, 2012).
Geosequestration
92
3.3.5 Environmental Impact
Potential impact on ecosystems and water systems
Globally, CCS prevents the discharge of GHG and contributes to the mitigation of climate
change, thereby positively impacting the environment (IPCC, 2005). Injection occurs at depths
where the CO2 is unlikely to interfere with surface resources, unlike other CCS technologies
such as Ocean Fertilisation. The localised impact of any negative event due to the defined
storage location limits the environmental impact. Public concerns about health, safety and
environmental impacts are framed by inappropriate analogy with rapid emission of large
volumes of naturally occurring CO2 in volcanic areas which resulted in fatalities in Indonesia
and West Africa, or damage to the local ecosystem in California, USA (IEA GHG, 2009).
There are no recorded incidents of sudden CO2 emissions from sedimentary basins, and
although slow natural seepage has been detected along faults or from boreholes, very few
examples of localised environmental damage have been linked to this phenomena (IEA GHG,
2008, 2009, Link 1). Hazardous CO2 release requires the build up of trapped CO2 in gas phase
(IEA GHG, Link 1), which can be identified through ongoing MMV activities.
While amine solvents, used in the capture process, could potentially produce carcinogens,
current technologies and management practices can mitigate the impact on environment and
health (Shao and Stangeland, 2009). Recent research suggests that the risk of formation and
spreading of nitrosamines is less than previously thought (Skriung, 2011). The potential risks
associated with injection of CO2 into the subsurface are that acute or chronic leakage of the CO2
could cause damage or contaminate resources in other subsurface zones, affecting access to
resources such as hydrocarbons, groundwater, mineral deposits, geothermal, minerals, coal, etc.
(Bachu, 2008; Holloway, 2001). These risks can be minimised through rigorous site selection
and characterisation. Potential impact on ecosystems and water systems scores a 3.
Environmental Footprint
There is some environmental footprint from characterisation, infrastructure, transportation
(pipelines) and MMV activities. The footprint is not larger than for conventional O&G
activities, which is commonly considered tolerable if not in highly environmentally sensitive
areas. Existing regulations and impact management plans can be modified to manage the above
factors. The concern that the injection of large volumes of CO2 in areas close to faults can result
in sufficient pressure build-up to trigger earthquakes (induced seismicity) and may lead to the
Geosequestration
93
fracturing of the reservoir seals and release of the stored CO2 (Zobeck and Gorelick, 2012)
seems highly improbable, and in any event such risks can be minimised by rigorous site
selection in tectonically stable regions, active monitoring and engineering mitigation solutions
(Bachu, 2003; McClure, 2012; Det Norske Veritas, 2012a; National Research Council, 2012),
therefore environmental footprint earns a 2 rating.
Environmental Impact thus has an overall “high” (2.5) score which is input in the
Environmental Impact column of the Master Matrix.
3.3.6 Science and Technology: Sub-Matrix Assessment
I identified the Science and Technology elements specific to GS, and evaluated each against
the evaluation criteria. The Technology elements are:
1) Site identification and characterisation
2) Capture
3) Transportation
4) Injection and Storage
5) Measurement, Monitoring and Verification (MMV)
Technology Element 1: Site Identification and Characterisation
In general, the wider public is not typically aware of the activities undertaken to gather the
information required to identify and characterise potential CO2 storage sites. Interaction with
property owners is restricted to terrestrial surveys and test drilling, but only affects a very
restricted area. Offshore or regional acquisition with air-borne surveying (onshore) is
straightforward and requires no to minimal interaction with local property owners, therefore
Public Acceptance scores a 3. There is no consistent legislation regulating these activities,
although existing legislation already covers most survey activities requiring licensing, such as
land access. The DNV CCS certification framework released in 2012 and the CSA IPAC-CO2
bi-national Canada-USA consensus standard (CSA Z741) announced the same year provide the
basis for internationally recognised processes for site characterisation based on industry best
practice and compliance with regulations, international standards and directives (DNV, 2012a,
2012b; CSA IPAC-CO2, 2012; Aarnes et al., 2009). Regulatory Frameworks scores a 2.

Geosequestration
94
Site characterisation is the most time-consuming and costly part of the site selection process,
but not unaffordable, with assessment of suitable geological storage sites being undertaken
worldwide (NASCA, 2012; The Norwegian Petroleum Directorate, 2012; Carbon Storage
Taskforce, 2009). Figure 3.17 shows the result of the technical analysis for Australia. Therefore
Economics earns a rating of 2. The technology needed to identify and characterise geological
formations is often the same as that used by the energy and minerals industries, therefore
Demonstrated Technical Readiness rates a 3. There is some footprint from characterisation
activities, particularly terrestrial geophysical surveys and test drilling so Environmental Impact
scores a 2.
The combined average rating for the Site Identification and Characterisation is very positive
(2.4).
Figure 3.16 CO2 storage potential and emissions sources in Australia (Image source: CO2CRC,
2013).
Technology Element 2: Capture
Capture involves the separation and removal of CO2 from flue gas produced by the burning
of fossil fuels at power plants and other industries prior to venting into the atmosphere. The
IEA’s Energy Technology Analysis Report (2008b) states that the long-term potential of CCS in
mitigating CO2 levels comes from power generation (50%), industrial hydrogen (30%), heavy
Geosequestration
95
industries (16%), and natural gas processing (4%). This element gets a 3 rating for Public
Acceptance because there is no perceived risk, and it is seen to benefit the environment. Few
countries have legislated industry compliance to utilise capture technologies or cap emissions,
therefore Regulatory Frameworks earns a 1.
Capture represents the most costly part of CCS because flue gas contains low concentrations
of CO2, making separation a complicated and expensive process. Current R&D efforts are
focused on improving efficiencies of capture technologies and lowering its costs (ZEP, 2011;
Burt et al., 2009; Baxter et al., 2009; CO2CRC, 2012; IEA 2008a). Examples include the
reduction of parasitic energy use, new/improved solvents, configuration of separation devices,
and incorporation of membrane liquid adsorption. For these reasons, Economics earns a 1.
Demonstrated Technical Readiness scores a 3, with post-combustion the most mature capture
method (IPCC, 2005), capturing ~90% of CO2 from industrial operations, although a system-
dependent energy penalty of 16% to 30% applies (SBC Energy Institute, 2012; IEA GHG,
2007). Capture prevents CO2 release, and current technologies and management practices can
mitigate the impact of amine solvents on environment and health (Shao and Stangeland, 2009,
Skriung, 2011) therefore Environmental Impact scores a 3.
Capture scores a “medium” (2.2) rating.
Technology Element 3: Transportation
Pipelines are the main solution for high volume transportation of CO2, although scattered
emission source points, remote offshore storage sites or environmentally hostile transit areas
may favour the use of maritime transport. Only pipelines are analysed as all active or planned
projects are based on this mode of transportation. The environmental footprint associated with
pipeline infrastructure could negatively impact Public Acceptance if located through densely
populated or environmentally sensitive areas, therefore Public Acceptance of Transportation
scores a 2. CO2 transportation can be covered by existing or modified pipeline legislation, as is
the case in Western Australia (The Parliament of Western Australia, 2011). Figure 3.18
illustrates the extent of the overall pipeline network in Western Australia. Adaptation of
regulatory health and safety codes for the design and operation of pipeline routing may be
required (Gale and Davison, 2004; IPCC, 2005; Carbon Storage Taskforce, 2009). In 2010, Det
Norske Veritas [DNV] published a Recommended Practice guideline for the design and
operation of CO2 pipelines. The availability of existing regulatory frameworks, recommended
Geosequestration
96
practice guidelines, and political flexibility to adapt legislation yields a Regulatory Framework
rating of 3.
Pipelines are the most effective and economic onshore solution. The building costs of
pipeline infrastructure are impacted more by transport distance and environment than transport
capacity, e.g. the CAPEX costs of onshore CO2 pipeline infrastructure are $0.2-0.4 million/km
for a 50cm diameter, 10MtCO2pa capacity, but 40 – 70% higher for offshore (Gale and Davison,
2004; SBC Energy Institute, 2012). North America is currently the only region with a dedicated
pipeline network for CO2 transport (IEA GHG, 2012; Watt, 2010). In Australia, more than
5,000 km of large diameter pipeline is needed to transport CO2 (Carbon Storage Taskforce,
2009). In Europe, an integrated and inter-country pipeline infrastructure (30,000 – 150,000km)
needs to be built (IEA GHG, 2005). In order to develop integrated onshore and offshore pipeline
infrastructure, passage and land acquisition rights, monitoring for pressure, leakage, and
pipeline integrity, metering, gating from different emitters, cost-effective materials, custody
transfer across county, state and country borders and associated costs should be included in any
planning (Congressional Research Service [CRS], 2009; Watt, 2010; Seevam et al., 2008).
Both economic and technical feasibility of transportation systems are dependent on the
number of source points and chemical composition of the CO2. The upgrading or reuse of
existing pipeline networks requires fit-for-purpose technical analysis as supercritical CO2 has
higher acidity and requires higher pressure than natural gas (SBC Energy Institute, 2012), but
could significantly reduce CAPEX. The OPEX of pipeline transportation for CO2 is lower than
that of natural gas or hydrogen because of its density in supercritical state (IEA, 2008a).
Pipeline networks create economies of scale to lower risk and share costs, e.g. multi-user “hub-
and-spoke” approaches are planned for both the South West Hub project, Western Australia and
CarbonNET project in Victoria (WA ERA, 2010). The Economics of Transportation earns a
score of 3.
The use of pipeline technology for the transportation of more volatile gases than CO2 is
already mature (IPCC, 2005) and the challenges of transporting supercritical CO2 are well
understood. The USA has an excellent safety record with four decades of experience in CO2-
dedicated pipeline networks for onshore EOR (>40Mtpa over 7,300km of pipeline), with the
CO2 coming mainly from naturally occurring and therefore, relatively pure CO2 (SBC Global
Institute, 2012; CRS, 2007, 2009; Watt, 2010). Offshore pipelines for Sleipner in the North Sea
and Snøhvit in the Barents Sea, the latter being a very hostile environment, provide technical
reference cases for offshore transportation (Watt, 2010). For these reasons Demonstrated

Geosequestration
97
Technical Readiness scores a 3. Environmental Impact is rated a 2 because of the
environmental footprint from pipeline networks.
The overall score for Transportation technology is (2.6) which counts as a high rating.
Figure 3.17.
Gas Pipeline Infrastructure
map of Western Australia as
at 30 June 2010
(Image source: Economic
Regulation Authority, 2010).
Technology Element 4: Injection and Storage
Injection and Storage refers to the injection of supercritical CO2 (greater than 31.1⁰C and
7.3MPa) into geological formations suitable for long-term storage and secure containment.
While the rate of injection is related to the number of injection wells (Hosa et al., 2011), the
injectivity rate is site specific and largely dependent on the permeability of the reservoir rock,
thickness of the formation and the pressure gradient. The USEPA’s Underground Control

Geosequestration
98
Program (USA) demonstrated that fracture pressures range from 11 - 21 kilo Pascals (kPa)
(IPCC, 2005). Too high a pressure can cause fracturing, thereby affecting storage estimates and
impacting the technical and economic parameters of a dependent project, as Statoil discovered
while injecting at Snøvit in the Barents Sea (Molde, 2011; Helgesen, 2010).
Frequent community concerns about economic impact, health, safety and environmental
damage from CO2 injection activities and potential leakage at onshore storage sites give a score
of 1 for Public Acceptance. Nation-specific legislation both supports (Australia) (The
Commonwealth of Australia, 2012) and restricts (Netherlands) (ICIS Heren, 2011) the ability
for storage of CO2 in geological formations. This balances out in a Regulatory Frameworks
score of 2. The costs for injection and storage infrastructure are site-specific, but these can be
approximated from the drilling of similar wells in the O&G industry (IEA, 2008a). Additional
expenses are monitoring equipment and well bore isolation (cementing) to mitigate potential
interaction of the CO2 with the reservoir. Offshore wells are more expensive than onshore (IEA,
2008a)(Figure 3.19). The Economics of Injection and Storage earns a score of 2. Demonstrated
Technical Readiness has been proven with 40+ years of EOR experience (over 100 projects) by
the O&G industry (IPCC, 2005; Beckworth, 2011) and it therefore earns a score of 3.
Environmental Impact rates a 2 because of environmental footprint from injection and
monitoring wells, and the potential of induced microseismic events.
The overall rating for Injectivity and Storage is “medium” (2).
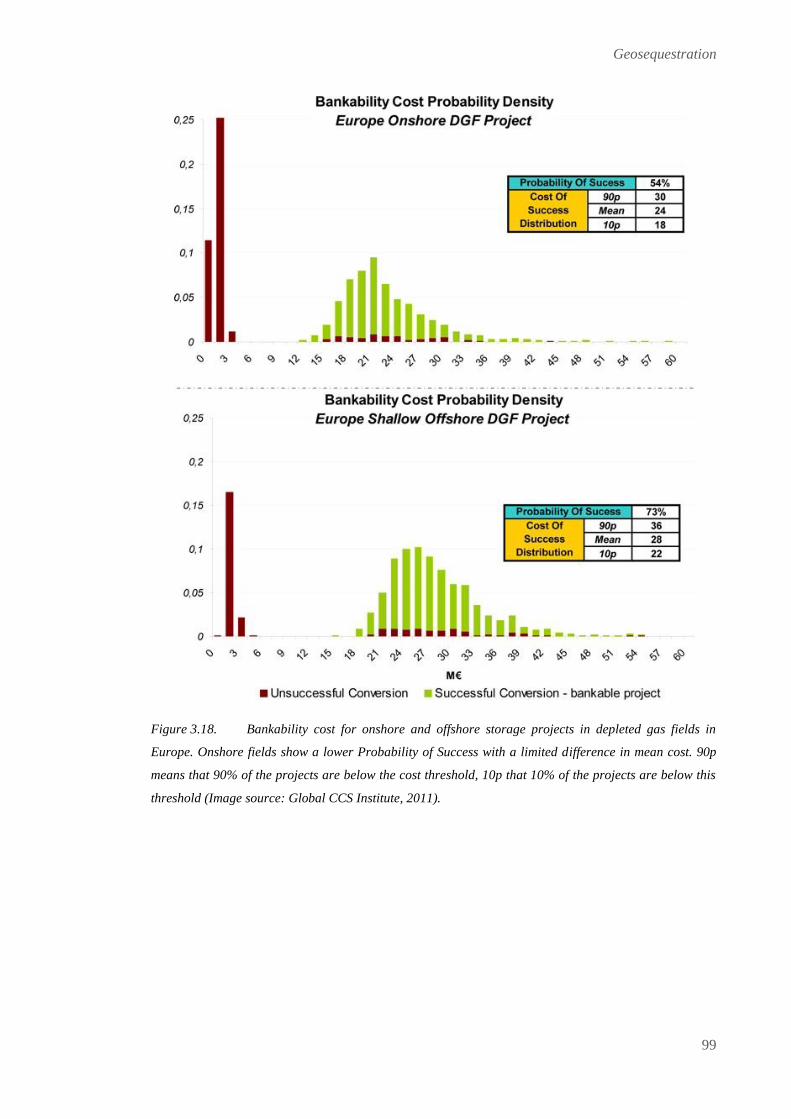
Geosequestration
99
Figure 3.18. Bankability cost for onshore and offshore storage projects in depleted gas fields in
Europe. Onshore fields show a lower Probability of Success with a limited difference in mean cost. 90p
means that 90% of the projects are below the cost threshold, 10p that 10% of the projects are below this
threshold (Image source: Global CCS Institute, 2011).

Geosequestration
100
Technology Element 5: Measurement Monitoring and Verification (MMV)
Measurement, Monitoring and Verification (MMV) refers to the use of tools and tests to
monitor CO2 injected into geological formations by use of geophysical and chemical data
(seismic, gravity, EM, inSAR, rock, fluid, mineralisation, air, soil, etc.) to build an accurate
accounting of the stored volume and its security or retention capability, for safety and economic
purposes (IPCC, 2005; WA ERA, 2010). Table 3.4 illustrates the variety of technologies and
methods available to monitor the CO2 distribution in the subsurface and at the surface for CO2
leak detection.
Table 3.4. Measurement, Monitoring and Verification (MMV) Technologies and Methods available to
monitor the CO2 distribution in the subsurface and at the surface for CO2 leak detection.

Geosequestration
101
All surveys and tests, whether subsurface or surface based, require the acquisition of baseline
surveys, preferably with seasonal variations, to define the changes over time. These data sets
will be integrated in a similar way as for production monitoring in the O&G industry to create
and update geological and geomechanical models of the subsurface processes and define the
progress of the plume migration (Vanorio et al., 2010). Legacy wells require special attention
because they can compromise the integrity of the storage reservoir (WA ERA, 2010).
Stakeholders want assurance about the safe and secure containment of the CO2 thus Public
Acceptance of MMV is rated 3. Some regulatory framework exists, but there is no consistent
global legislation for the handover of liability, legal responsibilities and MMV obligations (IEA,
2011) and Regulatory Frameworks balances out as a score of 2. The costs of MMV activities are
affordable, however these occur over the long term (>50 years) with the frequency of
measurement significantly higher than for a typical O&G monitoring project which typically
would continue for twenty years. The frequency may not be determined by technical necessity,
but by public and political concerns. For example, expensive time-lapse seismic surveys may
be acquired annually representing a significant long-term ongoing cost unless permanent arrays
or more affordable forms of time-lapse tests become available. The exact nature and amount of
expenses will depend on the regulatory regime for the hand-over of MMV to governments and
the structure of a remediation or insurance fund. The costs of MMV can be estimated by
considering recommended practice guidelines such as the DNV Recommended Practice (RP)
J203, DNV Service Specification (DSS) 402 and CSA Z741. Therefore, Economics rates a 2.
Demonstrated Technical Readiness scores a 3 as current available technologies can be
utilised and industry best practice guidelines such as that of DNV exist to provide best practices
guidelines and certification frameworks of MMV and cover parameters such as injection
standards (maximum injection pressures, fracture gradients), well integrity, well spacing, etc.
Environmental Impact earns a 2 rating because there is some footprint with the presence of
infrastructure such as permanent monitoring arrays and monitoring stations.
MMV scores a rating of “mid-long term” (2.4).

Geosequestration
102
Summary of Science and Technology Sub-Matrix Assessment
Certain technology elements specific to GS rate poorly (Table 3.5) because of public
concerns or technology novelty. The public concerns are related to anticipation of economic
disadvantages and/or environmental, health and safety hazards. For example, Injection and
Storage is ranked poorly due to community concerns about hazardous CO2 gas build-up;
however, Capture is rated highly because there is no perceived risk, and it beneficially prevents
industrial-generated CO2 from entering the atmosphere and raising GHG levels. Technology
novelty relates to the transferability of existing CCS knowledge and technology from the O&G
industry to other high emitter industries, such as electricity generators. Therefore my previous
expectation of a high rating was not upheld, despite forty years of relevant petroleum industry
experience with enhanced hydrocarbon recovery in North America. The Science and
Technology Sub-Matrix received a “mid-long term” (2.3) rating which is entered into the
Science and Technology column of the Master Matrix. A medium score, rather than the
expected high, for the Science and Technology evaluation criterion does not diminish the
overall assessment of GS.
Table 3.5. Science and Technology Sub-Matrix Scorecard: Results of Application of Methodology to
Geosequestration.
3.3.7 Summary of Results: Overall Technology Rating
The overall rating for GS at 2.3 (Table 3.6), as detailed above, suggests a medium to high
probability of success as a commercial-scale CO2 storage option. This is consistent with recent
trends in CO2 GS, as well as published government and industry experience.
Table 3.6. Overall risk assessment rating of Geosequestration in Master Matrix.
Geosequestration
103
3.4 DISCUSSION
Observations
My assessment of GS from a general global perspective yielded a number of observations
which should be taken into account when planning a carbon management portfolio or project:
1. Public Acceptance (particularly for onshore storage and transportation pipelines) and
economics are identified as the most critical barriers to deployment of GS on a wide
scale commercial level.
2. A high level of interrelationship between some of the Evaluation Criteria is apparent,
i.e. Public and Political Acceptance very strongly affect the establishment of Regulatory
Frameworks, which in turn impacts Economics (higher planning uncertainty, risk of
delays, limitation of available storage sites or transport solutions). Although progress
has been made in the establishment of national and regional legislation and regulation,
the lack of a unified global framework reflects a lack of unity by the global community
and slows progress on adoption.
3. A clear need for regulatory guidelines was identified including mandatory compliance
and economic incentives for heavy emitters but also in areas of MMV and liability
transfer. Current commercially viable business models are limited to EOR, with most
other projects still heavily reliant on government subsidies or incentives.
4. The evaluation of project locations requires effective source-to-sink matching
procedures, balancing economics and public acceptance, to manage infrastructure and
logistics costs. Although offshore storage sites compare unfavourably with onshore in
terms of economics, higher levels of public acceptance and lower levels of resource
conflicts and land use competition are favourable.
5. A broader range of business models is required to make projects more economically
robust and less vulnerable to policy changes. While R&D efforts are focused on
lowering costs and improving efficiencies of capture technologies, the long term
ongoing costs of MMV should not be underestimated. Although many tools are
commercially available to monitor geological, geophysical and geochemical data, these
tools must be modified to act as low-cost, minimal manpower and footprint sentinel
monitoring systems that are fit-for-purpose to suit a variety of environmental scenarios.
The IEA Greenhouse Gas R&D Programme’s Overview of Monitoring Projects for
Geosequestration
104
Geologic Storage Projects Report (2004) describes a methodology for the operational
monitoring of the CO2 plume through time-lapse EM, gravity and seismic surveys over
a thirty year period (plant/project operation) and post-closure monitoring for the
following fifty years (for a total of eighty years).
6. According to the IPCC Special Report on CCS (2005), the length of sequestration time
is ideally permanent. Permanence is a concern because O&G technologies have not
previously been deployed at such time scales, as long-term storage of the CO2 has not
been the petroleum industry’s priority. Demonstrations of the different CO2 trapping
mechanisms for the reservoir categories and lithologies need more research to assess the
long-term effects of CO2 interactions in geological formations, as lessons learned from
O&G projects regarding this cannot necessarily be translated to long-term sequestration.
7. Transportation solutions require careful evaluation, including the reutilisation of
existing pipeline networks and ship designs. The latter requires more RD&D to capture
economies of scale for CO2 transportation, with one option the dual-purpose built CO2
and LNG transportation vessels. A possible combination of both offshore pipelines for
near shore locations, and ships (long distance off-shore) could be the most economic
transportation solution. Transportation by ship is flexible, scalable and may be more
cost-effective than offshore pipelines for large distances (Barrio et al., 2004). This
mode of transport is most economical at distances between 700km – 1500km, and
requires less CAPEX for infrastructure costs (IEA, 2008a). It can provide a better
solution to deal with scattered emissions source points of CO2 and distant geological
storage sites. When considering combined ship transport, LNG/LPG vs. CO2,
compression, as well as refrigeration, are needed for ships designed to transport CO2
(Aspelund et al., 2004). Currently, there are only a few dedicated CO2 vessels with a
capacity of only 1000-1500m3 for liquefied food-grade CO2, providing a total shipped
volume of 1MtCO2 (IPCC, 2005). Research, design and development of mid-range
ships are underway in Japan (Chiyoda Corporation, 2011) and Norway. A Norwegian
example is the collaboration between Statoil Hydro and SINTEF, which aims to
develop four to six tank vessels with 20,000 m3 liquefied CO2 capacity (~24kt CO2) and
injection turrets (Rackley, 2010e).
8. The recently released global standards (DNV certification framework (DNV, 2012a,
2012b) and CSA Z741 (CSA IPAC-CO2, 2012) provide internationally recognised
process methodologies for CO2 storage site selection, risk assessment, monitoring and
verification based on industry best practice and intergovernmental directives (Aarnes et
Geosequestration
105
al., 2009). These are important because international standards and experience help to
increase confidence in the technical feasibility and operability of CCS in geological
formations, site integrity, and support economic auditing.
9. Technologies are available but need to be improved for monitoring the subsurface. For
instance, seismic imaging is proven for both terrestrial and offshore environments, but
the quality of image resolution at low frequencies could be improved to use seismic data
in a quantitative manner to evaluate CO2 distribution. Both CSEM and gravity are
sensitive to CO2 volume, however, both require more research and demonstration. New
tools, techniques and technology are needed for commercial implementation as some
technology gap exists for remote sensing technologies, such as anti-corrosive equipment
and material suitable for long-term CO2 exposure in sub-surface environments
(pressure, temperature) (WA ERA, 2010). The goal is to establish passive sentinels to
minimise cost, manpower and environmental footprint with strategically placed
samplers, such as soil-gas, and permanent arrays (seismic monitoring). This requires
remote and WIFI instruments to improve data acquisition and send data back to a
central location.
Suggestions to Improve Uptake
I suggest the following as areas/means to improve or accelerate the wide-spread commercial
deployment of GS:
Early engagement and empowerment of local stakeholders by addressing concerns (e.g.
legacy issues, like public opposition to existing plants), potential risks and highlighting
socio-economic benefits to the local community such as employment opportunities and
stimulation of the local economy (Miller et al., 2008; de Best-Waldhober et al., 2009;
Anderson et al., 2007; Roberts and Mander, 2011; Reiner, 2008). Scientists/academics
could be utilised as providers of information, as they are perceived as more credible,
trustworthy and independent than government and industry (Global CCS Institute,
2011b; European Commission, 2011).
Placing GS and the CCS industry in the context of climate change as an important part
of a diverse, low-carbon, energy mix/strategy for energy security as well as climate
change mitigation to increase levels of public acceptance (Ashworth et al., 2009, 2010;
Anderson et al., 2007; European Commission, 2011), i.e. not at the expense of
renewable energy solutions (Shackley et al., 2009; Itaoka et al., 2004).
Geosequestration
106
Improved cooperation and collaboration between stakeholders to educate and make
more informed decisions, e.g. counter misinformation about scientific concepts, learn
from shared experience, and scale up technology transfer from the petroleum to other
heavy emitter industries and within the CCS industry. Regulators and operators should
also be better prepared to educate and develop a working relationship with the media
and environmental non-governmental organisations (ENGO’s) (Wong-Parodi et al.,
2008).
The effective use of media, especially online social media, which can be quickly and
effectively utilised to communicate a series of successful case histories of good practice
or any unexpected leakage to prove efficiency of early detection and mitigation
strategies and develop an atmosphere of transparency with stakeholders.
A balance between financial support mechanisms and international standard of
regulations to provide legal certainty and a flexible regulatory framework that is
adaptable to changing circumstances. This should include faster, more efficient and
transparent permit approval and bureaucratic processes.
Suggested means to improve business models:
The capture and reutilisation of CO2 for hydrocarbon recovery and production of
unconventionals (methane, previously-fracked brown fields, shale beds,
geothermal). Recent studies discuss the possibility that the hydraulic fracturing
industry could extract more natural gas from spent fields by injecting liquid or
supercritical CO2 instead of pressurised water into methane-rich shale formations
(Ishida et al., 2012). The CO2 is better at fracturing the rock, releasing the methane,
even in previously fracked shale formations, so the rock releases more methane in
favour of the more chemically attractive CO2 which would remain stored in the
shale (McKenna, 2012). A combination of fracking with CCS to maximise recovery
from depleted reservoirs improves project economics, decreases the volume of
water needed, and encourages the commercial adoption of GS by the petroleum
industry.
Cost reductions in capture and monitoring technologies; e.g., the recent
development of a cheaper more efficient non-toxic absorber instead of expensive
amines (Wickham, 2012).
Improved source-sink matching, and matching states or countries with an
abundance of available storage sites with project owners and emitters with a lack of

Geosequestration
107
same. Leasing of the storage space could provide an additional revenue stream for
those with excess capacity. The CO2 could be transported by ship as a method to
counter the distance problem.
Shared infrastructure to improve economies of scale, increase efficiency and decrease
risk, e.g. R&D knowledge sharing and infrastructure hubs. This may require the
overcoming of technical challenges, such as the different quality of CO2 coming from a
variety of emissions sources when utilising a pipeline hub-and-spoke network.
3.5 CONCLUSIONS
I apply my new methodology to assess GS as a carbon mitigation option and the barriers to
its wide scale adoption. My analysis suggests that GS has a medium to high probability of
success as a commercial-scale CO2 storage option. GS will form an integral part of any
sequestration portfolio because of its technical capability to quickly capture and store large
volumes of CO2 in a number of locations worldwide and at the volumes necessary to mitigate
GHG levels. The high quality of storage (large available global capacity, ability to inject high
volumes in a short timeframe, long-term sequestration duration, and available MMV capability)
is a major advantage of GS as a carbon mitigation option. This technology allows for continued
access to fossil fuels resources and utilisation of existing energy generating and industrial
infrastructure with industrial scale deployment anticipated in the medium term. The comparably
well-understood interactions taking place at the storage site in comparison to other CCS
technologies, and the localised environmental impact of projects make GS a suitable bridging
technology for global carbon management for the next fifty years until renewables are available
at commercial scales. Recent research indicates the potential to utilise CO2 for unconventional
hydrocarbon production (methane, shale gas, geothermal) thereby strengthening the economics
of GS by expansion of the carbon capture utilisation and storage (CCUS) business case beyond
EOR. GS should be an essential component of any low-energy carbon management portfolio
strategy for regulators and industry.

Geosequestration
108
Geosequestration
109
REFERENCES
Aarnes, J.E., Selmer-Olsen, S., Carpenter, M.E., and Flach, T.A. (2009), Towards guidelines for
selection, characterization and qualification of sites and projects for geological storage of CO2: Energy
Procedia, 1, 1, 1735–1742.
Aimard, N., Lescanne, M., Mouronval, G., and Prebende, C. (2007), The CO2 pilot at Lacq: An
integrated oxycombustion CO2 capture and geological storage project in the South West of France:
Presented at the International Petroleum Technology Conference.
Aldy, J.E. and Stavins, R.N., (2011) The Promise and Problems of Pricing Carbon: Theory and
Experience: Discussion Paper 2011-12, Cambridge, Mass, USA.
American Electric Power Service Corporation [AEP] (2011), CCS Business Case Report:
Mountaineer Commercial Scale Carbon Capture and Storage (CCS) Project: American Electric
Power [Tamms, K. and Gilliland, D.], Project No. PRO 004.
Anderson, J., de Coninck, H., Curnow, P., Flach, T., Groenenberg, H., Norton, C., Reiner, D., Shackley,
S., Upham, P., Eldevik, F., and Sigurthorsson, G. (2007), Multidisciplinary analysis and gap-filling
strategies: The ACCSEPT Project, Report No. BRINO912OGSIG2007-1242.
Angus, S., Armstrong, B., and de Reuck, K.M. (1973), International Thermodynamic Tables of the Fluid
State Volume 3 Carbon Dioxide, International Union of Pure and Applied Chemistry, Division of
Physical Chemistry, Pergamon Press, London, 266–359.
Ashworth, P., Boughen, N., Mayhew, M., and Millar, F. (2009), An integrated roadmap of
communication activities around carbon capture and storage in Australia and beyond: Energy
Procedia, 1, 1, 4749-4756.
Ashworth, P., Boughen, N., Mayhew, M., and Millar, F. (2010), From research to action: Now we have
to move on CCS communication: International Journal of Greenhouse Gas Control, 4, 2, 426-433.
Aspelund, A., Sandvik, T.E., Krogstad, H., and De Koeijer, G. (2004), Liquifaction of captured CO2 for
ship-based transportation: in Proceedings of the 7th International Conference on Greenhouse Gas
Control Technologies (GHGT-7).
Bachu, S. (2003), Screening and ranking of sedimentary basins for sequestration of CO2
in geological
media in response to climate change: Environmental Geology, 44, 277-289.

Geosequestration
110
Bachu, S. (2008), CO2 storage in geological media: Role, means, status and barriers to deployment,”
Progress in Energy and Combustion Science, 34, 254–273.
Barrio, M., Aspelund, A.,Weydahl, T., Sandvik, T.E., L.R. Wongraven, L.R., Krogstad, H., and
Henningsen, R., Mølnvik, M., and Eide, S.I. (2004), Ship-based transport of CO2: in Proceedings of
7th International Conference on Greenhouse Gas Control Technologies (GHGT-7).
Batzle, M. and Wang, Z. (1992), Seismic properties of pore fluids: Geophysics, 57, 11, 1396-1408.
Baxter, L., Baxter, A. and Burt, S. (2009), Cryogenic CO2 Capture as a Cost-Effective CO2 Capture
Process: Presented at International Pittsburgh Coal Conference.
BBC News Online [BBC] (2011a), Concern grows over Longannet carbon capture plans: BBC News
Online, 6 October 2011. http://www.bbc.co.uk/news/uk-scotland-scotland-business-15207268
(accessed 9 October 2012).
BBC News Online [BBC] (2011b), Longannet carbon capture scheme scrapped: BBC News Online
19 October 2011. http://www.bbc.co.uk/news/uk-scotland-north-east-orkney-shetland-15371258
(accessed 9 October 2012).
Beckworth, R. (2011), Carbon Capture and Storage: A Mixed Review, Journal of Petroleum Technology,
63, 5, 42-45.
Bellona (2013a), The UK Labour party introduces an amendment to require CCS for new gas power
plants: Bellona Environmental CCS Team, 1 February 2013. http://bellona.org/ccs/ccs-news-
events/news/article/the-uk-labour-party-introduces-an-amendment-to-require-ccs-for-new-gas-power-
plants.html (accessed 12 February 2013).
Bellona (2013b), New EU CCS Policy: "The most important document that the European Commission
has produced on CCS for the last two years", says Frederic Hauge: The Bellona Foundation,13
February 2013. http://www.bellona.org/articles/articles_2012/1358108616.37 (accessed 12 February
2013).
Bergmann, P., Schmidt-Hattenberger, C., Kiessling, D., Rücker, C., Labitzke, T., Henninges, J,
Baumann, G. and Schütt, H. (2012), Surface-downhole electrical resistivity tomography applied to
monitoring of CO2 storage at Ketzin, Germany: Geophysics, 77, 6, B253-B267.
Bradshaw, J., Bachu, S., Bonijoly, D., Burruss, R., Holloway, S., Christensen, N.P., and Mathiassen,
O.M., (2007), CO2 storage capacity estimation: Issues and development of standards: International
Journal of Greenhouse Gas Control, 1, 1, 62–68.

Geosequestration
111
Burt, S., Baxter, A. and Baxter, L. (2009), Cryogenic CO2 Capture to Control Climate Change
Emissions: in Proceedings of the 34th International Technical Conference on Clean Coal and Fuel
System: The Clearwater Clean Coal Conference.
Calhoun Jr., J.C. (1982), Fundamentals of Reservoir Engineering: University of Oklahoma Press:
Norman, OK, USA.
Carbon Storage Taskforce (2009), National Carbon Mapping and Infrastructure Plan – Australia:
Concise Report: Department of Resources, Energy and Tourism, Canberra, ACT. Australia.
Chevron Australia (2012), Injecting Billions of Dollars across Australia: Chevron Australia Pty. Ltd.
http://www.chevronaustralia.com/ourbusinesses/gorgon.aspx (accessed 20 June 2012).
Chiyoda Corporation (2011), Preliminary Feasibility Study on CO2 Carrier for Ship-based CCS,
Chiyoda Corporation, Report supported by Global CCS Institute.
http://www.globalccsinstitute.com/publications/preliminary-feasibility-study-co2-carrier-ship-based-
ccs (accessed 21 November 2013).
Cooperative Research Centre for Greenhouse Gas Technologies [CO2CRC] (2008), Storage
Capacity Estimation, Site Selection and Characterisation for CO2 Storage Projects: Report No.
RPT08-1001 [Kaldi, J. G., and Gibson-Poole, C. M. (Eds.)], CO2CRC, Canberra, ACT, Australia.
Cooperative Research Centre for Greenhouse Gas Technologies [CO2CRC] (2012), New system
reduces carbon capture costs by $20 per tonne : CO2CRC [Media release] (6 June 2012).
http://co2crc.com.au/dls/media/12/UNOClearwater.pdf (accesssed 17 June 2012).
Congressional Research Service [CRS] (2007), CRS Report for Congress: Underground Carbon
Storage: Frequently Asked Questions: [Folger, P.] Order Code RL34218.
Congressional Research Service [CRS] (2009), CRS Report for Congress: Carbon Dioxide (CO2)
Pipelines for Carbon Sequestration: Emerging Policy Issues: [Parfomak, P.W., Folger, P., Vann, A.]
Order Code RL33971.
Cook, P.J. (2012), Clean energy, climate and carbon: Carbon Management, 3, 3, 259–263.
CSA Group and IPAC-CO2 Research Incorporated [CSA IPAC-CO2] (2012), CSA Group and IPAC-
CO2 Research Inc. Announce World’s First Bi-National Standard for Geologic Storage of Carbon
Dioxide: [news release] 15 November 2012, CSA Group IPAC-CO2: Regina and Toronto, Canada.
http://www.ipac-co2.com/uploads/File/PDFs/CSA%20IPAC-
CO2%20CCS%20Standard%202012%20Final%20News%20Release%20v1%20copy.pdf (accessed
30 November 2012).
Geosequestration
112
de Best-Waldhober, M., Daamen, D., and Faaij, A. (2009), Informed and uninformed public opinions on
CO2 capture and storage technologies in the Netherlands: International Journal of Greenhouse Gas
Control, 3, 3, 322-332.
Det Norske Veritas [DNV] (2010), Recommended Practice DNV-RP-J202: Design and Operation of
CO2 Pipelines.
Det Norske Veritas [DNV] (2012a), Recommended Practice DNV-RP-J203: Geological Storage of
Carbon Dioxide.
Det Norske Veritas [DNV] (2012b), DNV Service Specification DNV-DSS-402: Qualification
Management for Geological Storage of CO2.
Eiken, O., Zumberge, M., Torkjell, T., Sasagawa, G., and Nooner, S. (2004), Gravimetric monitoring of
gas production from the Troll Field: Presented at SEG 74th
Annual Meeting.
Eiken, O., Ringrose, P., Hermanrud, C., Nazarian, B., Torp, T.A., and Loier, L. (2011), Lessons learned
from 14 years of CCS operations: Sleipner, In Salah and Snohvit: Energy Procedia, 4, 5541-5548.
European Parliament and the Council of the European Union [EU] (2001), Directive 2001/80/EC of
the European Parliament and of the Council of the European Union on the limitation of emissions of
certain pollutants into the air from large combustion plants: Official Journal of the European Union,
23 October 2001.
European Parliament and the Council of the European Union [EU] (2009), Directive 2009/31/EC of
the European Parliament and of the Council on the geological storage of carbon dioxide: Official
Journal of the European Union, 23 April 2009.
European Commission (2011), Special Eurobarometer 364: Public awareness and acceptance of CO2,
capture and storage: [TNS Opinion and Social], Directorate-General for Energy, Brussels, Belgium.
European Technology Platform for Zero Emission Fossil Fuel Power Plants [ZEP] (2011), The Costs
of CO2 Capture, Transport and Storage: Post-demonstration CCS in the EU: ZEP.
http://www.zeroemissionsplatform.eu/library/publication/165-zep-cost-report-summary.html
(accessed 1 March 2012).
Feron, P. H. and Jansen, A. E. (2002), CO2 separation with polyolefin membrane contactors and
dedicated absorption liquids: performances and prospects: Separation and Purification Technology,
27, 3, 231-242.
Geosequestration
113
Gale, J. and Davison, J. (2004), Transmission of CO2—safety and economic considerations: Energy 29,
9, 1319–1328.
Gasperikova, E., and Hoversten, G.M. (2006), A feasibility study of nonseismic geophysical methods for
monitoring geologic CO2 sequestration: The Leading Edge, 25, 10, 1282-1288.
Gilfillan, S.M.V., Lollar, B. S., Holland, G., Blagburn, D., Stevens, S., Schoell, M., Cassidy, M., Ding,
Z., Zhou, Z., Lacrampe-Couloume, G., and Chris J. Ballentine, C.J. (2009), Solubility trapping in
formation water as dominant CO2 sink in natural gas fields: Nature, 458, 7852, 614-618.
Global CCS Institute (2011a), The Global Status of CCS: 2010, Global CCS Institute, Canberra, ACT,
Australia.
Global CCS Institute (2011b), Communicating the risks of CCS, Report [Bradbury, J., Greenberg, S.,
and Wade, S.]: Global CCS Institute, Canberra, ACT, Australia.
Global CCS Institute (2011c), Global status of large-scale integrated CCS projects: June 2011 update:
Global CCS Institute, Canberra, ACT, Australia.
Global CCS Institute (2011d), The Costs of CCS and Other Low-Carbon Technologies: Issues Brief
2011, No. 2: [Abellera, C., and Short, C.]: Global CCS Institute, Canberra, ACT, Australia.
Gorecki, C.D., Hamling, J.A., Klapperich, R.J., Steadman, E.N., and Harju, J.A. (2012), Integrating CO2
EOR and CO2 Storage in the Bell Creek Oil Field: Presented at Carbon Management Technology
Conference 2012, Paper No. CMTC 151476.
Government of Western Australia (2011), Collie-South West CO2 Geosequestration Hub – Project and
Activity Progress Report for the Global Carbon Capture and Storage Institute: Government of
Western Australia, Department of Mines and Petroleum, Perth, Western Australia, Australia: Report
No. DMPNOV11_1578.
Gunter, W.D., Perkins, E.H. and McCann, T.J. (1993), Aquifer disposal of CO2-rich gases: reaction
design for added capacity: Energy Conversion and Management, 34, 9-11, 941-948.
Gunter, W. D., Wiwehar, B., and Perkins, E. H. (1997), Aquifer disposal of CO2-rich greenhouse gases:
extension of the time scale of experiment for CO2-sequestering reactions by geochemical modelling:
Mineralogy and Petrology, 59, 1-2, 121-140.
Haszeldine, S. (2011), Why the UK buried a world-first carbon-capture scheme: New Scientist: Opinion,
21 October 2011. http://www.newscientist.com/article/dn21080-why-the-uk-buried-a-worldfirst-
carboncapture-scheme.html?full=true (accessed 7 June 2012).

Geosequestration
114
Helgesen, O.K. (2010), CO2-problemer på Snøhvit : Statoil klarer ikke å lagre all CO2-en fra Snøhvit:
Teknisk Ukeblad, 10 March, 2010. http://www.tu.no/olje-gass/2010/03/10/co2-problemer-pa-snohvit
(accessed 28 February 2013).
Helseth, J. (2011), CCS in Germany – is it game over?: Global CCS Institute,
http://www.globalccsinstitute.com/community/blogs/authors/jonashelseth/2011/10/10/ccs-germany-it-
game-over (accessed 7 June 2012)
Hill, B., Hovorka, S., and Metzer, S. (2013), Geologic carbon storage through enhanced oil recovery: in
Proceedings of the 11th International Conference on Greenhouse Gas Control Technologies (GHGT-
11). http://www.fossiltransition.org/filebin/images/GHGT11_Hill_Hovorka_Melzer-2.pdf (accessed
1 April 2013) [in press].
Holloway, S. (2001), Storage of fossil fuel-derived carbon dioxide beneath the surface of the earth:
Annual Review of Energy and the Environment, 26, 1, 145-166.
Holtz, M.H. (2003), Optimization of CO2 sequestered as a residual phase in brine-saturated formations:
In Briefing book: Second Annual Conference on Carbon Sequestration: developing & validating the
technology base to reduce carbon intensity, Gulf Coast Carbon Center [GCCC] Digital Publication
Series 03-03, unpaginated.
Hooper, B. (2011), Transport: CO2CRC Education and Training: The 2011 CO2CRC CCS School, The
University of Melbourne, Victoria, Australia [unpublished].
Hosa, A., Esentia, M., Stewart, J., and Haszeldine, S. (2011), Injection of CO2 into saline formations:
Benchmarking worldwide projects: Chemical Engineering Research and Design, 89, 1855-1864.
Hovorka, S.D., Meckel, T.A., Trevino, R.H., Lu, J., Nicot, J.P., Choi, J.W., Freeman, D., Cook, P.,
Daley, T.M., Ajo-Franklin, J.B., Freifeild, B.M., Doughty, C., Carrigan, C.R. La Brecque, D.,
Kharaka, Y.K., Thordsen, J.J., Phelps, T.J. Yang, C. Romanak, K.D., Zhang, T., Holt, R.M., Lindler,
J.S., and Butsch, R. J. (2011), Monitoring a large volume CO2 injection: Year two results from
SECARB project at Denbury’s Cranfield, Mississippi, USA: Energy Procedia, 4, 3478-3485.
ICIS Heren (2011), Dutch CCS in disarray as ‘on land’ storage ruled out: ICIS Heren, 15 February 2011.
http://www.icis.com/heren/articles/2011/02/15/9435644/dutch-ccs-in-disarray-as-on-land-storage-
ruled-out.html (accessed 15 June 2012).
International Energy Agency [IEA] (2008a), CO2 capture and storage: A key carbon abatement option:
International Energy Agency, OECD, Paris, France.
Geosequestration
115
International Energy Agency [IEA] (2008b), World Energy Outlook 2008: International Energy
Agency, OECD, Paris, France.
International Energy Agency [IEA] (2009), Technology Roadmap – Carbon Capture and Storage:
International Energy Agency, OECD, Paris, France.
International Energy Agency [IEA] (2011), Carbon Capture and Storage Legal and Regulatory
Review: Edition 2: International Energy Agency, OECD [Garrett, J., Beck, B., Lipponen, J., McCoy,
S., Houssin, D., Volk, D., Yoshimura, T., Finkenrath, M. and Gaghen, R.]: Paris, France.
International Energy Agency [IEA] (2012), Energy Technology Perspectives 2012: International
Energy Agency, OECD, Paris, France.
International Energy Agency Greenhouse Gas R&D Programme [IEA GHG] (Link 1), Natural
Releases of CO2: IEA Greenhouse Gas R&D Programme [Mike Stenhouse, Monitor Scientific
(compiler)] Cheltenham, Gloucestershire, UK.
International Energy Agency Greenhouse Gas R&D Programme [IEA GHG] (2004), Overview of
Monitoring Requirements for Geologic Storage Projects: IEA Greenhouse Gas R&D Programme,
Report No. PH4/29.
International Energy Agency Greenhouse Gas R&D Programme [IEA GHG] (2005), Building the
Cost Curves for CO2 Storage: European Sector, Report 2005/02, IEA Greenhouse Gas R&D
Programme. http://www.ieaghg.org/docs/overviews/2005-2.pdf (accessed 19 July 2012).
International Energy Agency Greenhouse Gas R&D Programme [IEA GHG] (2007), Capturing
CO2, IEA Greenhouse Gas R&D Programme [Adams, D. and Davison, J.], Cheltenham,
Gloucestershire, UK.
International Energy Agency Greenhouse Gas R&D Programme [IEA GHG] (2008), Geologic
Storage of Carbon Dioxide: Staying Safely Underground, IEA Greenhouse Gas R&D Programme,
[Price, J., and Smith, B.], Virginia, USA.
International Energy Agency Greenhouse Gas R&D Programme [IEA GHG] (2009), Natural and
Industrial Analogues for Geological Storage of Carbon Dioxide. IEA Greenhouse Gas R&D
Programme [Stenhouse, M. (compiler)], Cheltenham, Gloucestershire, UK.
International Energy Agency Greenhouse Gas R&D Programme [IEA GHG] (2012), Capture,
Transport and Storage of CO2, IEA Greenhouse Gas R&D Programme, Cheltenham, Gloucestershire,
UK

Geosequestration
116
Intergovernmental Panel on Climate Change [IPCC] (2005), Intergovernmental Panel on Climate
Change Special Report on Carbon Dioxide Capture and Storage: Prepared by Working Group III of
the Intergovernmental Panel on Climate Change [Metz, B.O., Davidson, H., de Coninck, C., Loos, M.
and Meyer, L.A. (eds.)]: Cambridge University Press, Cambridge, United Kingdom and New York,
NY, USA.
Intergovernmental Panel on Climate Change [IPCC] (2007), Climate Change 2007: Mitigation:
Contribution of Working Group III to the Fourth Assessment Report of the Intergovernmental Panel
on Climate Change, [Metz, B., Davidson, O., Bosch, P., Dave, R. and Meyer, L. (eds.)], Cambridge
University Press, Cambridge, UK and New York, NY, USA.
Ishida, T., Aoyagi, K., Niwa, T., Chen, Y., Murata, S., Chen, Q., and Nakayama, Y. (2012), Acoustic
emission monitoring of hydraulic fracturing laboratory experiment with supercritical and liquid CO2:
Geophysical Research Letters, 39, 16.
Itaoka, K., Saito, A., and Akai, M. (2004), Public acceptance of CO2 capture and storage technology: A
survey of public opinion to explore influential factors: in Proceedings of the 7th International
Conference on Greenhouse Gas Control Technologies (GHGT-7).
Itaoka, K., Saito, A., Paukovic, M., de Best-Waldhober, M., Dowd, A-M., Jeanneret, T., Ashworth, P.
and James, M. (2012), Understanding how individuals perceive carbon dioxide: Implications for
acceptance of carbon dioxide capture and storage: CSIRO Report No. EP 118160, Australia.
Jenkins, C.R., Cook, P.J., Ennis-King, J., Undershultz, J., Boreham, C., Dance, T., de Caritat, P.,
Etheridge, D.M., Freifeld, B.M., Hortle, A., Kirste, D., Paterson, L., Pevzner, R., Schact, U., Sharma,
S., Stalker, L., and Urosevic, M. (2011), Safe storage and effective monitoring of CO2 in depleted gas
fields: in Proceedings of the National Academy of Sciences (PNAS) Early Edition.
http://www.pnas.org/content/early/2011/12/16/1107255108.full.pdf+html (accessed 9 October 2012).
Kaldi, J. (2011), Site Selection and Characterisation I: Capacity, trapping and injectivity: CO2CRC
Education and Training: The 2011 CO2CRC CCS School, The University of Melbourne, Victoria,
Australia [unpublished].
Kessler, R.A. (2009), Midwest group cancels Ohio CCS project despite DOE funding: Recharge, 21
August 2009. http://www.rechargenews.com/business_area/innovation/article186348.ece (accessed 30
May 2012).
Ketzer, J. M., Iglesias, R., Einloft, S., Dullius, J., Ligabue, R., and De Lima, V. (2009), Water–rock–
CO2 interactions in saline aquifers aimed for carbon dioxide storage: Experimental and numerical
Geosequestration
117
modeling studies of the Rio Bonito Formation (Permian), southern Brazil: Applied Geochemistry, 24,
5, 760-767.
Kopp, A., Class, H. and Helmig, R. (2009a), Investigations on CO2 Storage Capacity in Saline Aquifers
Part 1: Dimensional Analysis of Flow Processes and Reservoir Characteristics: International Journal
of Greenhouse Gas Control, 3, 263–276.
Kopp, A., Class, H., and Helmig, R. (2009b), Investigations on CO2 Storage Capacity in Saline Aquifers
Part 2: Estimation of Storage Capacity Coefficients: International Journal of Greenhouse Gas
Control, 3, 277–287.
Kuijper, M. (2011), Public acceptance challenges for onshore CO2 storage in Barendrecht: Energy
Procedia, 4, 6226-6233.
Kumar, A., Noh, M., Ozah, R., Pope, G., Bryant, S., Sepehrnoori, K., and Lake, L. (2005), Reservoir
Simulation of CO2 Storage in Aquifers: SPE Journal, 10, 3, 336-348.
Lake, L.W. (1989), Enhanced Oil Recovery. Prentice Hall: Englewood Cliffs, NJ, USA.
Lumley, D. (2001), Time-lapse seismic reservoir monitoring: Geophysics, 66, 50-53.
Lumley, D. (2010), 4D Seismic monitoring of CO2 sequestration: The Leading Edge, 29, 2, 150-155.
Lumley, D., Sherlock, D., Daley, T., Huang, L., Lawton, D., Masters, R., Verliac, M., and White, D.,
(2010), Highlights of the 2009 SEG summer research workshop on CO2 sequestration geophysics: The
Leading Edge, 29, 2, 138-144.
Lumley, D. (2011), 4D Seismic Monitoring of CO2 Sequestration – Theory and Practice: GeoProc2011,
Paper No. GP059.
MacDowell, N., Florin, N., Buchard, A., Hallett, J., Galindo, A., Jackson, G., Adjiman, C.S., Williams,
C.K., Shah, N. and Fennell, P. (2010), An overview of CO2 capture technologies: Energy and
Environmental Science, 3, 1645-1669.
McClure, M. (2012), Carbon capture and storage likely to cause earthquakes, say Stanford researchers:
Stanford Report, June 19, 2012. http://news.stanford.edu/news/2012/june/carbon-capture-earthquakes-
061912.html (accessed 20 June 2012).
McKenna, P. (2012), Fracking could be combined with carbon capture plans: New Scientist:
Environment, 31 August 2012. http://www.newscientist.com/article/dn22232-fracking-could-be-
combined-with-carbon-capture-plans.html (accessed 9 September 2012).

Geosequestration
118
Miller, E., Summerville, J., Buys, L., and Bell, L. (2008), Initial public perceptions of carbon
sequestration: implications for engagement and environmental risk communication strategies:
International Journal of Global Environmental Issues, 8, (1), 147-164.
Molde, A.I. (2011), Reservoaret klarer ikke mer Snøhvit-CO2: Petro.no: 20 May 2011.
http://www.petro.no/modules/module_123/proxy.asp?C=14&I=16697&D=2&mid=195 (accessed 26
May 2011).
North American Carbon Storage Atlas [NACSA] (2012), The North American Carbon Storage Atlas
2012: First Edition. http://www.netl.doe.gov/technologies/carbon_seq/refshelf/NACSA2012.pdf
(accessed 17 July 2012).
National Audit Office (2012), Department of Energy and Climate Change: Carbon Capture and
Storage: lessons from the competition for the first UK demonstration: Report by the Comptroller and
Auditor General, National Audit Office, UK, Report No. HC 1829 Session 2010-2012.
National Research Council (2012), Induced Seismicity Potential in Energy Technologies: The National
Academies Press, Washington, DC.
National Energy Technology Laboratory, Department of Energy [NETL DOE] (2010), Carbon
Sequestration Atlas of the United States and Canada – Third Edition (Atlas III): Appendix B -
Summary of the Methodology for Development of Geologic Storage Estimates for Carbon Dioxide:
National Energy Technology Laboratory (NETL), Department of Energy (DOE).
http://www.netl.doe.gov/technologies/carbon_seq/refshelf/atlasIII/2010AtlasIII_AppendixB.pdf
(accessed 19 July 2012).
National Energy Technology Laboratory, United States Department of Energy [NETL DOE]
(2011), Archer Daniels Midland Company: CO2 Capture from Biofuels Production and Sequestration
into the Mt. Simon Sandstone: [Project Fact Sheet]: National Energy Technology Laboratory, United
States Department of Energy,
http://sequestration.mit.edu/tools/projects/DOE%20projects/Industrial%20CCS%20projects/Archer-
Midland-Daniels-Tech-Update-2011.pdf (accessed 17 April 2013).
Obdam, A., L.G.H. Van der Meer, May, F., Bech, N., Kervevan, C. and Wildenberg, A., (2003),
Effective CO2 Storage Capacity in Aquifers and in Hydrocarbon Fields: in Proceedings of the 6th
International Conference on Greenhouse Gas Control Technologies (GHGT-6), [Gale J. and Kaya, Y.
(eds.)], 1; 339-344.
Pacala, S., and Socolow, R. (2004), Stabilization Wedges: Solving the Climate Problem for the Next 50
Years with Current Technologies: Science, 305, 5686, 968-972.

Geosequestration
119
Parliamentary Office of Science and Technology [POST] (2009), CO2 Capture, Transport and Storage:
Postnote, June 2009, No. 335, London, United Kingdom.
Perkins, E., Czernichowski-Lauriol, I., Azaroual, M., and Durst, P. (2004), Long term predictions of CO2
storage by mineral and solubility trapping in the Weyburn Midale Reservoir: in Proceedings of the 7th
International Conference on Greenhouse Gas Control Technologies (GHGT-7), 2093-2096.
Rackley, S.A. (2010a), Carbon capture from power generation. In Carbon capture and storage,
Butterworth-Heinemann, Elsevier Inc., Burlington, MA, USA, 4, 65-93.
Rackley, S.A. (2010b), Adsorption capture systems. In Carbon capture and storage, Butterworth-
Heinemann, Elsevier Inc., Burlington, MA, USA, 7, 133 - 157.
Rackley, S.A. (2010c), Membrane separation systems. In Carbon capture and storage, Butterworth-
Heinemann, Elsevier Inc., Burlington, MA, USA, 8, 159-194.
Rackley, S.A. (2010d), Geological storage. In Carbon capture and storage, Butterworth-Heinemann,
Elsevier Inc., Burlington, MA, USA, 11, 229-266.
Rackley, S.A. (2010e), Carbon dioxide transportation. In Carbon capture and storage, Butterworth-
Heinemann, Elsevier Inc., Burlington, MA, USA, 15, 329-344.
Redhead, P.A. (1962), Thermal desorption of gases: Vacuum, 12, 4, 203-211.
Reiner, D., Curry, T., de Figueiredo, M., Herzog, H., Ansolabehere, S., Itaoka, K., Akai M., Johnsson, F.,
and Odenbergerm M. (2006), An international comparison of public attitudes towards carbon capture
and storage technologies: Presented at 8th International Conference on Greenhouse Gas Control
Technologies (GHGT-8).
Reiner, D.M. (2008), A looming rhetorical gap: A survey of public communications activities for carbon
dioxide and storage technologies: Electricity Policy Research Group, Working Papers, No. 801.
Reuters (2011), Update 2 – Vattenfall drops carbon capture project in Germany: Reuters, 5 December
2011. http://www.reuters.com/article/2011/12/05/vattenfall-carbon-idUSL5E7N53PG20111205
(accessed 7 June 2012).
Roberts, T., and Mander, S. (2011), Assessing public perceptions of CCS: Benefits, challenges and
methods: Energy Procedia, 4, 6307–6314.
Salvi, S., Quattrocchi, F., Angelone, M., Brunori, C.A., Billi, A., Buongiorno, F. Doumaz, F., Funiciello,
R. Guerra, M., Lombardi, S., Mele, F., Pizzino, L. and Salvini, F. (2000), A multidisciplinary
approach to earthquake research: implementation of a Geochemical Geographic Information System
for the Gargano site, Southern Italy: Natural Hazard, 20, 1, 255–278.
Geosequestration
120
Schlumberger Business Consulting Energy Institute [SBC Energy Institute] (2012), Leading the
Energy Transition: Bringing Carbon Capture and Storage to Market, [Soupa, O., Lajoie, B., Long,
A., and Alvarez, H.]: Schlumberger Business Consulting Energy Institute.
Schlumberger Business Consulting Energy Institute [SBC Energy Institute] (2013), Leading the
Energy Transition: Carbon Capture and Storage: Bringing Carbon Capture and Storage to Market:
Factbook Edition, January 2013 Update: Schlumberger Business Consulting Energy Institute.
Schilling, F., Borm, G., Würdemann, H., Möller, F., and Kühn, M. (2009), Status report on the first
European on-shore CO2 storage site at Ketzin (Germany): Energy Procedia, 1, 1, 2029–2035.
Scott, K.C., Parker, D.J., Trupp, M., and Clulow, B. (2010), Setting New Environmental, Regulatory, and
Safety Benchmarks: The 2009 Gorgon CO2 3D Baseline Seismic Project, Barrow Island, Western
Australia: in Proceedings of the SPE Asia Pacific Oil and Gas Conference and Exhibition, edited,
Brisbane, Queensland, Australia.
Seiersten, M. (2001), Material selection for separation, transportation and disposal of CO2. In
Proceedings Corrosion, National Association of Corrosion Engineers, Paper No. 01042.
Seevam, P., Race, J.M., and Downie, M.J. (2008), CO2 Transport UKCCSC Progress Report:
[PowerPoint presentation], Newcastle University, Newcastle, UK.
http://www.findthatpowerpoint.com/search-5083712-hDOC/download-documents-newcastle08-
ppt.htm (accessed 6 January 2012).
Selley, R.C. (1998), Elements of Petroleum Geology 2nd
Edition: Academic Press, California, USA and
London, UK.
Shackley, S., Waterman, H., Godfroij, P., Reiner, D., Anderson, J., Draxlbauer, K., de Coninck, H.,
Groenenberg, H., Flach, T. and Flagstad, O. (2007), Stakeholder Perceptions of CO2 Capture and
Storage in Europe: Results from the EU-funded ACCSEPT Survey: Main Report: The ACCSEPT
project, Manchester, United Kingdom.
Shackley, S., Reiner, D., Upham, P., de Coninck, H., Sigurthorsson, G., and Anderson, J. (2009), The
acceptability of CO2 capture and storage (CCS) in Europe: An assessment of the key determining
factors: Part 2. The social acceptability of CCS and the wider impacts and repercussions of its
implementation: International Journal of Greenhouse Gas Control, 3, 3, 344–356.
Shao, R. and Stangeland, A. (2009), Amines Used in CO2 Capture- Health and Environmental Impacts:
Bellona Report 2009: The Bellona Foundation, Oslo, Norway.
Geosequestration
121
Sheriff, R.E. (2002), Encyclopedic Dictionary of Applied Geophysics (4th
Edition, reprinted 2011),
Society of Exploration Geophysicists, Tulsa, OK, USA.
Skriung, C.S. (2011), The amine technology is qualified: Zero Emissions Resource Organisation
(ZERO), 30 August 2011. http://www.zeroco2.no/the-amine-technology-is-qualified (accessed 11
February 2013).
Streit, J., A. Siggins and B. Evans, 2005: Predicting and monitoring geomechanical effects of CO2
injection, Carbon Dioxide Capture for Storage in Deep Geologic Formations—Results from the CO2
Capture Project, v. 2: Geologic Storage of Carbon Dioxide with Monitoring and Verification,
[Benson, S.M. (ed.)], Elsevier Science, London, 751–766.
Surovtseva, D., Amin, R. and Barifcani, A. (2011), Design and operation of pilot plant for CO2 capture
from IGCC flue gases by combined cryogenic and hydrate method: Chemical Engineering Research
and Design, 89, 9, 1752–1757.
The Commonwealth of Australia (2012), The Clean Energy Legislative Package: The Commonwealth
of Australia. http://www.climatechange.gov.au/en/government/clean-energy-future/legislation.aspx
(accessed 12 August 2012).
The House of Commons (2012), Energy Bill 135: [as amended in Public Bill Committee], The House of
Commons, London, UK.
The Norwegian Petroleum Directorate (2012), CO2 Storage Atlas Norwegian North Sea, [Halland,
E.K., Johansen, W.T. and Riis, F. (eds.)], The Norwegian Petroleum Directorate, Stavanger, Norway.
http://www.npd.no/Global/Norsk/3-Publikasjoner/Rapporter/PDF/CO2-ATLAS-lav.pdf (accessed 27
August 2012).
The Parliament of Western Australia (2011), Petroleum and Geothermal Energy Legislation
Amendment Bill 2011: Draft 3: Perth, Western Australia, Australia.
http://www.dmp.wa.gov.au/documents/Petroleum_and_Geothermal_Energy_Legislation_Amendment
_Bill_2011.pdf (accessed 1 April 2013).
Torp, T. and Brown, K. (2002), CO2 Underground Storage Costs as Experienced at Sleipner and
Weyburn: in Proceedings of the 7th International Conference on Greenhouse Gas Control
Technologies (GHGT-7).
United Kingdom Energy Research Centre [UKERC] (2012), UKERC Research Project: Carbon
Capture and Storage: Realising the potential? [Watson J. (ed.), Kern, F., Gross, M., Gross, R.,
Heptonstall, P., Jones, F., Haszeldine, S., Ascui, F., Chalmers, H., Ghaleigh, N., Gibbins, J.,

Geosequestration
122
Marusson, M., Marsen, W., Rossati, D., Russell, S., Winskel, M., Pearson, P., and Araposthathis, S.]:
UK Energy Research Centre. www.ukerc.ac.uk (accessed 2 July 2012).
United Nations Industrial Development Organisation [UNIDO] (2011), Global Technology Roadmap
for CCS in Industry: Sectoral Assessment CO2 Enhanced Oil Recovery: prepared by Advanced
Resources International for United Nations Industrial Development Organisation, Arlington, VA,
USA.
United States Department of Energy [US DOE] (2012), Carbon Storage Partner Completes First Year
of CO2 Injection Operations in Illinois: United States Department of Energy, Fossil Energy Office of
Communications, 19 November 2012. http://www.fossil.energy.gov/news/techlines/2012/12056-
Carbon_Storage_Partner_Completes_F.html (accessed 31 March 2013).
Vangkilde-Pedersen, T., Anthonsen, K.L., Smith, N., Kirk, K., Neele, F., van der Meer, B., Le Gallo, Y.,
Bossie-Codreanu, D., Wojcicki, A., Le Nindre, Y-M, Hendriks, C., Dalhoff, F., Christensen, N.P.
(2009), Assessing European capacity for geological storage of carbon dioxide–the EU GeoCapacity
project, Energy Procedia, 1, 1, 2663–2670.
Vanorio, T., Mavko, G., Vialle, S., and Spratt, K. (2010), The rock physics basis for 4D seismic
monitoring of CO2 fate: Are we there yet?: The Leading Edge, 29, 2, 156-162.
Vialle, S. and Vanorio, T. (2011), Laboratory measurements of elastic properties of carbonate
rocks during injection of reactive CO2 saturated water: Geophysical Research Letters, 38, 1.
Voser, P. (2012), Shell to construct world’s first oil sands CCS project: Royal Dutch Shell, [Press
Release], 5 September 2012. http://www.shell.ca/en/aboutshell/media-centre/news-and-media-
releases/archive/2012/0905quest.html (accessed 1 April 2013).
WA Energy Research Alliance [WA ERA] (2010), Geosequestration R&D: A Report to Australian
National Low Emission Coal R&D Program, March 2010.
Wald, M.L. and Broder, J.M. (2011), Utility shelves ambitious plan to limit carbon: NY Times, 13
February 2011. http://www.nytimes.com/2011/07/14/business/energy-environment/utility-shelves-
plan-to-capture-carbon-dioxide.html?_r=2& (accessed 31 July 2012).
Wallquist, L., Visschers, V.M., and Siegrist, M. (2010), Impact of Knowledge and
Misconceptions on Benefit and Risk Perception of CCS: Environmental Science & Technology, 44, 17,
6557-6562.
Watt, J. (2010), Carbon dioxide transport infrastructure key learning and critical issues: Journal of
Pipeline Engineering, 9, 4, 213-222.
Geosequestration
123
Whitmarsh, L., Seyfang, G., and O'Neill, S. (2011), Public engagement with carbon and climate change:
To what extent is the public 'carbon capable'? Global Environmental Change, 21, 1, 56-65.
Whittaker, S.G. (2004), Investigating geological storage of greenhouse gases in southeastern
Saskatchewan: The IEA Weyburn CO2 Monitoring and Storage Project: in Summary of Investigations:
Saskatchewan Geological Survey, Saskatchewan Industry Resources, Misc. Rep. 2004-4.1, Paper A-2.
Whittaker, S., Rostron, B., Hawkes, C., Gardner, C., White, D., Johnson, J., Chalaturnyk, R., and
Seeburger, D. (2011), A decade of CO2 injection into depleting oil fields: monitoring and research
activities of the Weyburn-Midale CO2 Monitoring and Storage Project:Energy Procedia, 4, 6069-
6076.
Wickham, C. (2012), Boost for carbon capture from new non-toxic absorber: Reuters, 23 September
2012. http://uk.reuters.com/article/2012/09/23/us-science-carbon-emissions-
idUKBRE88M0BM20120923 (accessed 30 September 2012).
Wilson, M., and Monea, M. (2004), IEA GHG Weyburn CO2 monitoring and storage project. Summary
report 2000-2004: in Proceedings of the 7th
International Conference on Greenhouse Gas Control
Technologies (GHGT-7).
Wong-Parodi, G., Ray, I., and Farrell, A.E. (2008), Environmental non-government organisations'
perception of geologic sequestration: Environment Research Letters 3, 1-4.
Young-Lorenz, J.D. and Lumley, D. (2013), Portfolio analysis of carbon sequestration technologies and
barriers to adoption: General methodology and application to geological storage: Energy Procedia, 37,
5063-5079.
Zoback, M.D. and Gorelick, S.M. (2012), Earthquake triggering and large-scale geologic storage of
carbon dioxide: in Proceedings of the National Academy of Sciences (PNAS) 2012.

Algae CCS
124

Algae CCS
125
CHAPTER 4
APPLICATION OF METHODOLOGY:
ALGAE CCS
OVERVIEW
The new assessment methodology and rating system are applied to Algae CCS. Algae CCS
provides a source of renewable energy that temporarily captures and stores CO2 through
artificially accelerated photosynthetic processes until the biomass is converted to bioenergy or
biofuels. Algae CCS offers a range of possible revenue streams and environmental benefits, but
the time scale for commercial implementation is in the medium to long term due to significant
R&D requirements. A lack of published case studies and generalised life cycle assessments for
this technology required the extrapolation of some evaluation criteria from analogues such as
renewables and bioenergy. Following an initial review of the applicability of the methodology
and an introduction to Algae CCS, I apply my new methodology, then summarise and discuss
the results.

Algae CCS
126
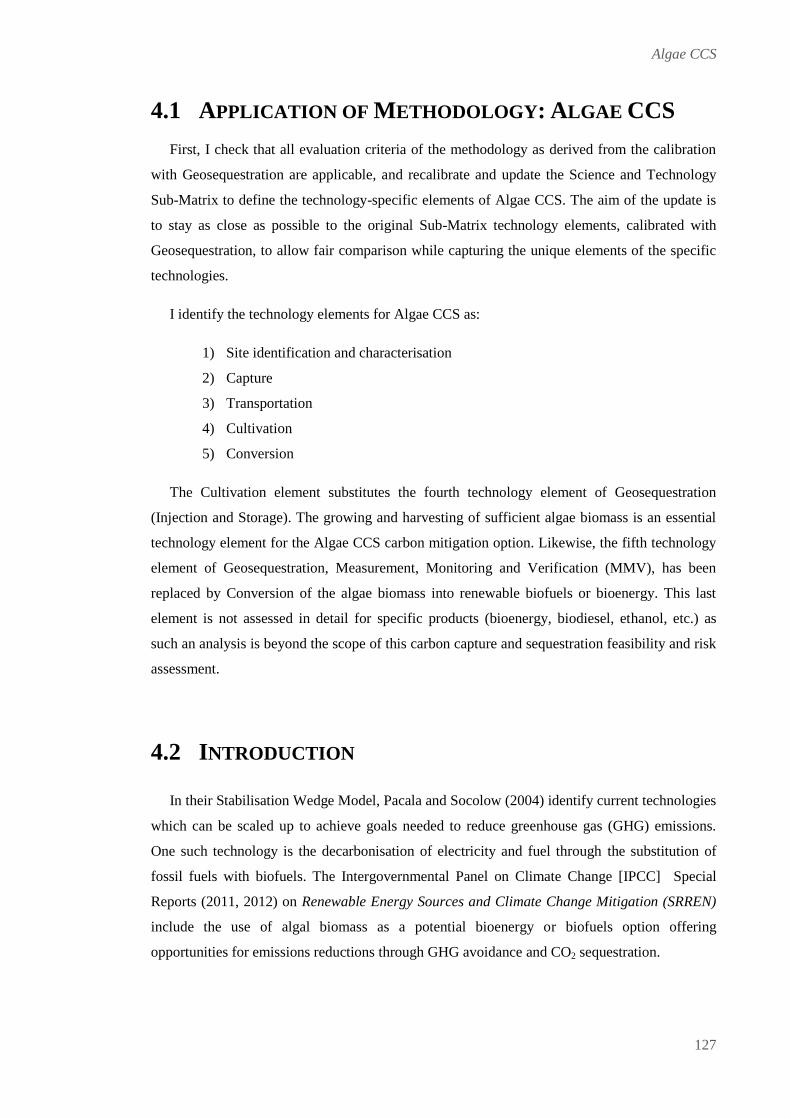
Algae CCS
127
4.1 APPLICATION OF METHODOLOGY: ALGAE CCS
First, I check that all evaluation criteria of the methodology as derived from the calibration
with Geosequestration are applicable, and recalibrate and update the Science and Technology
Sub-Matrix to define the technology-specific elements of Algae CCS. The aim of the update is
to stay as close as possible to the original Sub-Matrix technology elements, calibrated with
Geosequestration, to allow fair comparison while capturing the unique elements of the specific
technologies.
I identify the technology elements for Algae CCS as:
1) Site identification and characterisation
2) Capture
3) Transportation
4) Cultivation
5) Conversion
The Cultivation element substitutes the fourth technology element of Geosequestration
(Injection and Storage). The growing and harvesting of sufficient algae biomass is an essential
technology element for the Algae CCS carbon mitigation option. Likewise, the fifth technology
element of Geosequestration, Measurement, Monitoring and Verification (MMV), has been
replaced by Conversion of the algae biomass into renewable biofuels or bioenergy. This last
element is not assessed in detail for specific products (bioenergy, biodiesel, ethanol, etc.) as
such an analysis is beyond the scope of this carbon capture and sequestration feasibility and risk
assessment.
4.2 INTRODUCTION
In their Stabilisation Wedge Model, Pacala and Socolow (2004) identify current technologies
which can be scaled up to achieve goals needed to reduce greenhouse gas (GHG) emissions.
One such technology is the decarbonisation of electricity and fuel through the substitution of
fossil fuels with biofuels. The Intergovernmental Panel on Climate Change [IPCC] Special
Reports (2011, 2012) on Renewable Energy Sources and Climate Change Mitigation (SRREN)
include the use of algal biomass as a potential bioenergy or biofuels option offering
opportunities for emissions reductions through GHG avoidance and CO2 sequestration.

Algae CCS
128
Algae produce complex organic compounds through photosynthesis or chemosynthesis
(inorganic chemical reactions), with the majority of algae having a photosynthetic mechanism
(US DOE, 2010). The mechanism of photosynthesis uses solar energy to convert CO2 and water
into carbohydrates and oxygen (O2). Algae produce 50% of the earth’s O2 but comprise only 1%
of the plant biomass, and are highly energy efficient. Algae reach a solar energy efficiency, the
ability to convert solar energy into chemical energy, of up to 5% (Fernández et al., 2012; Fon
Sing et al., 2013), compared to most plants at 1% solar energy efficiency (McKendry, 2001).
The photosynthetic process of converting inorganic carbon into organic compounds (lipids =
triglycerides and fatty acids, proteins and carbohydrates) is referred to as carbon fixation. The
lipids and carbohydrates are fuel precursors (biodiesel, jet fuel and gasoline, etc.) while the
proteins can be used for by-products like animal feed and fertiliser.
Algae can be divided into two classes, microalgae (e.g. single cell organisms) and
macroalgae (e.g. seaweed). The focus of my analysis will be on microalgae as they can achieve
a doubling of biomass per day (Sheehan et al., 1998), with a lipid yield for biodiesel production,
or a starch/polysaccharide yield for ethanol production up to ten times higher than for the best
performing terrestrial crops (US DOE, 2010). Of the ca. 30,000 known species of microalgae,
the global research focus has been on high oil producing species for fresh water which can
produce up to 70% of the biomass weight as lipids or vegetable oil, and saline water of ~10% of
biomass as lipids (Price, 2011). Fernández et al. (2012) state that typical oil content of algae
biomass is between 10% and 50% of weight, with the upper end of the range not currently
achievable in mass production.
Algae CCS incorporates the addition of anthropogenic CO2 to a microalgae system to
accelerate CO2 uptake and the growth cycle (Zeiler et al., 1995). Dependent upon the algae
strain and conditions of cultivation, ~1.8 to 2 tonnes (t) of CO2 will be utilised per tonne of
dehydrated algal biomass produced (Global CCS Institute, 2011). The biomass can be converted
into liquid biofuels and bioenergy, substituting fossil fuels and representing a temporary form of
storage, as well as by-products like chemicals and biochar, representing a more long term form
of storage. The combustion of algae biomass to produce energy or fuels releases the stored CO2,
but as the process recycles atmospheric CO2, it still represents a decrease in CO2 through
displacement of the burning of fossil fuels (Zeiler et al., 1995; Price, 2011). An overview on the
derivative products of microalgae biomass is given in Figure 4.1. Some discussion of the
derivative products is presented, but the main focus of this analysis is on the temporary storage
in the form of biofuel. Algae-based biodiesel or ethanol is considered a third-generation biofuel,
with first-generation biofuels based on agricultural commodities (e.g. wheat or corn), and
second-generation biofuels on processing of lignocellulosic biomass (e.g. straw or wood).
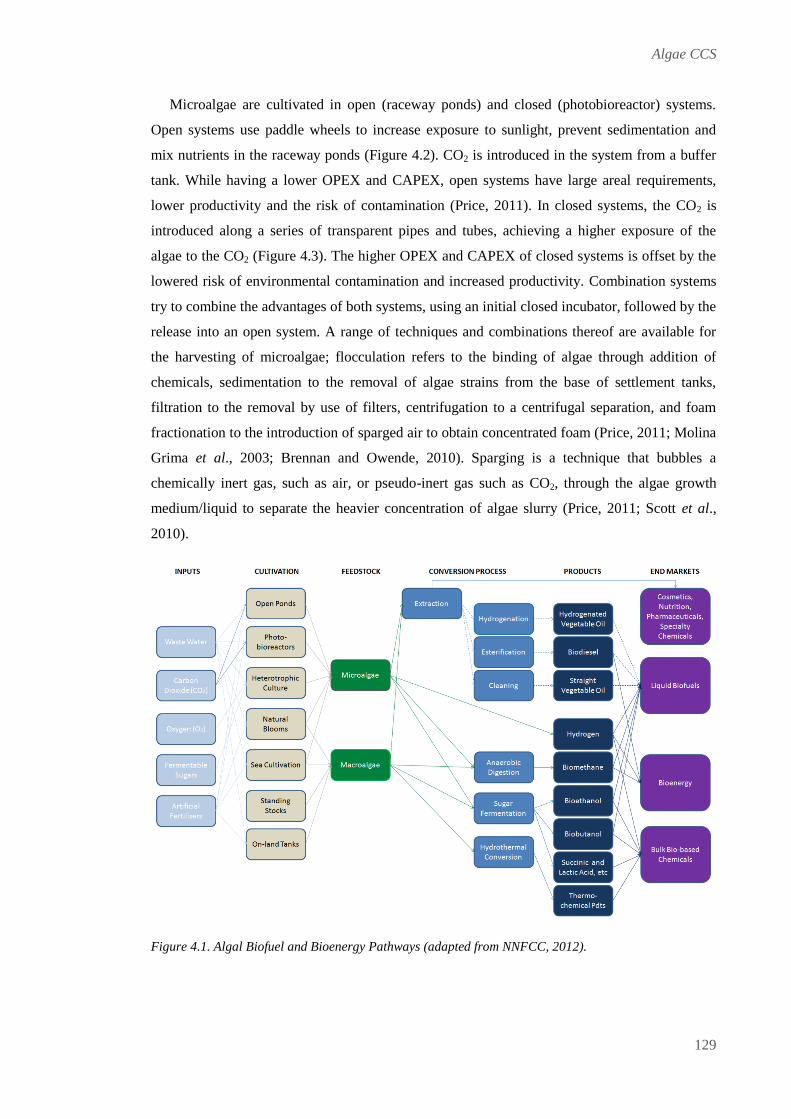
Algae CCS
129
Microalgae are cultivated in open (raceway ponds) and closed (photobioreactor) systems.
Open systems use paddle wheels to increase exposure to sunlight, prevent sedimentation and
mix nutrients in the raceway ponds (Figure 4.2). CO2 is introduced in the system from a buffer
tank. While having a lower OPEX and CAPEX, open systems have large areal requirements,
lower productivity and the risk of contamination (Price, 2011). In closed systems, the CO2 is
introduced along a series of transparent pipes and tubes, achieving a higher exposure of the
algae to the CO2 (Figure 4.3). The higher OPEX and CAPEX of closed systems is offset by the
lowered risk of environmental contamination and increased productivity. Combination systems
try to combine the advantages of both systems, using an initial closed incubator, followed by the
release into an open system. A range of techniques and combinations thereof are available for
the harvesting of microalgae; flocculation refers to the binding of algae through addition of
chemicals, sedimentation to the removal of algae strains from the base of settlement tanks,
filtration to the removal by use of filters, centrifugation to a centrifugal separation, and foam
fractionation to the introduction of sparged air to obtain concentrated foam (Price, 2011; Molina
Grima et al., 2003; Brennan and Owende, 2010). Sparging is a technique that bubbles a
chemically inert gas, such as air, or pseudo-inert gas such as CO2, through the algae growth
medium/liquid to separate the heavier concentration of algae slurry (Price, 2011; Scott et al.,
2010).
Figure 4.1. Algal Biofuel and Bioenergy Pathways (adapted from NNFCC, 2012).

Algae CCS
130
Figure 4.2. Example of an open raceway pond in Israel for the cultivation of microalgae for biofuel
(Image source: Seambiotic, 2013).
Figure 4.3. Example of a closed column tubular photobioreactor for cultivation of microalgae in China
(Image source: Energy Algae Group, 2013).

Algae CCS
131
The concentrated algae biomass can be used for a range of applications including (Figure 4.1):
1) Generation of bioethanol through a fermentation process,
2) Aid in wastewater treatment by removing nutrients with biofilms, encouraging the
anaerobic digestion of microbes, and preventing eutrophication (NNFCC, 2012).
Eutrophication describes the oxygen depletion of water as a consequence of excess
algae growth and decay because of an overabundance of nutrients such as
phosphates and nitrates.
3) Providing feedstock for biodiesel production through extraction of the oil in
physical and chemical processes or the addition of chemicals, and
4) Useful by-products (nutriceuticals such as carotenoids and omega oils,
pharmaceuticals, health food, animal feed, chemicals, fertiliser, and biochar).
The commercial cultivation and processing of high-value by-products, such as nutraceuticals
and health food, is already in operation. There are currently no Algae CCS projects to sequester
CO2 at commercial scales or for biofuel or bioenergy production (Campbell et al., 2011).
However, the Green Crude Farm facility is under development in Columbus, New Mexico,
USA by Sapphire Energy, the US Department of Energy [US DOE] and the US Department of
Agriculture. The first phase of 100 acres was completed in August 2012 (Sapphire Energy,
2012). By 2018, the integrated algae biorefinery will be the world’s first commercial-scale algae
to energy production facility, consuming ~56Mt CO2 per day on ~300 cultivated acres using
non-potable groundwater resources to produce ~1.5 million gallons pa of crude oil for jet fuel
and biodiesel (Sapphire Energy, 2013; Lane, 2012). The CO2 will either be sourced by tapping
the national pipeline network (Cortez pipeline) or from co-location with an industrial CO2
emitter (Lane, 2012). Research into algae farming, or “algaculture,” and the use of algae for
bioenergy and biofuels has evolved since the 1970’s (Sheehan et al., 1998). China and Chile are
the leaders in algae cultivation and research activities are proceeding in Australia, North
America, Norway and the UK. The huge potential of algae as a renewable source of carbon-
neutral liquid biofuel and bioenergy is recognised by governments, academia and industry, e.g.
in 2009, Exxon Mobil and BP invested $600 million and $10 million respectively into research
about the economic sustainability of algae-based biofuels and energy production (NNFCC,
2012).

Algae CCS
132

Algae CCS
133
4.3 RESULTS
Public Acceptance
How does Algae CCS affect me?
The CCS benefits of renewable biofuels are used in the assessment of Algae CCS as I have
not located literature regarding Public Acceptance specifically for this method. The benefits of
renewable energy sources are generally accepted by the majority of the wider public, but there is
some not in my backyard (NIMBY) attitude because the required infrastructure leads to a
perceived loss in property values due to noise pollution and changes to the visual landscape
(Upreti and van der Horst, 2004; Savvanidou et al., 2010; van der Horst, 2007; European
Commission, Directorate General for Research [EU DGR], 2003). As a third generation biofuel,
microalgae do not compete for agricultural land, unlike a food crop-based biomass feedstock.
The use of marginal land, unsuitable for agriculture, such as remote inland deserts with access
to saline groundwater, or located next to emission sources, will limit the exposure of the public
to the associated infrastructure. Nevertheless, the scale of commercial-scale production could
result in some conflicts, with estimates to cover ~10% of Australia’s oil demand suggesting 650
hectares (ha) of ponds and 4 giga-litre per annum (pa) of water as a requirement (Fon Sing et
al., 2013). This lowers the how does it affect me sub-criterion to a neutral (2) score, despite the
reduced competition for agricultural land.
How natural is Algae CCS?
Algae CCS is an acceleration of a natural photosynthetic process, and its by-products
(bioenergy and biofuel) are considered renewable energy, and it therefore receives the
associated positive public attitude towards “green” energy (Itaoka et al., 2012; Savvinidou,
2010; Ek, 2005: EU DGR, 2003). This yields a score of 3 for the how natural is it sub-criterion.
Science and technology comprehension
The positive rating is further enhanced as the public has a basic understanding of the
scientific concepts behind photosynthesis (Itaoka et al., 2012) through basic science education,
and its presence in the context of reforestation and “save the rainforest” campaigns. This earns a
science and technology comprehension score of 3.
An overall rating of 2.7 for Public Acceptance suggests that a “public positive” attitude prevails
towards Algae CCS.

Algae CCS
134
Regulatory Frameworks
Enabling body of rules and regulations
Algae CCS is regulated under renewable biomass legislation in the EU and USA that
encourages the use of renewable energy sources. A number of incentives are offered, such as the
EU Renewable Energy Strategy (RES) Directive, mandating each member state to obtain 20%
of its energy from renewable sources by 2020. The United States’ Department of Energy [US
DOE] announced under the American Recovery and Reinvestment Act (ARRA) that funds were
available for algae and advanced biofuel research ($85 million in 2009) and for biofuel research
and fuel infrastructure development ($78 million in 2010) (US DOE, 2010). Therefore the
enabling regulation sub-criterion scores a 3.
Restrictive/Negative legislation?
There is no direct restrictive/negative legislation specific to Algae CCS. However,
restrictive/negative legislation does occur in the indirect form of restrictions on CO2 onshore
transport infrastructure, namely pipelines, as in the UK (WA Energy Research Alliance [WA
ERA], 2010). This affects Algae CCS projects due to the continuous and large volume supply of
CO2 which is required, especially if remote sites for the cultivation infrastructure are
considered. This leads to a neutral (2) score for restrictive/negative legislation.
Regulatory certainty?
By making it a cost of doing business, regulatory compliance can significantly speed
up the adoption process. The mandated use of biodiesel in some US states, the UK
Government proposal to introduce Feed-in Tariff with Contracts for Difference (CfD)
and the German Renewable Energy Sources Act, mandating the addition of biofuel to
gasoline, and electricity feed-in tariffs (EEG, 2012) are all such examples. Because of
the certainty for economic planning which these regulations provide, regulatory
certainty scores a 3.
The overall rating of Regulatory Frameworks is a “supportive” 2.6.
Algae CCS
135
Economics
Viable business case?
The CAPEX and OPEX for Algae CCS investments is significant (US DOE, 2010; Fon Sing
et al., 2013), particularly for cultivation and conversion systems. The US DOE’s National Algal
Biofuels Roadmap (2010) does state however that a combination of improved productivity and
fully integrated production systems could lower the price of biofuels to compete with petroleum
at ~US$100 per barrel. The absence of commercial scale projects makes it difficult to
financially model and estimate the required investment level. Algae CCS is specifically omitted
in a number of governmental reports on renewable energy assessments, while the available
economics literature estimates have large uncertainties and vary widely in both technical and
economic assumptions (US DOE, 2010). Amongst others, the conversion rate of algae biomass
to oil is highly variable depending on climatic conditions and algae species, resulting in a highly
variable income stream (Campbell et al., 2009). Although Algae CCS has the potential to bring
in multiple income-streams, such as small volume – high value commodity chemicals (e.g.
omega oils), the focus in this analysis is on biomass to liquid biofuels and bioenergy. The price
of crude oil determines the production of microalgae at commercial scales (Borowitzka et al.,
2012). The viable business case sub-criterion scores a 2 rating, with cost uncertainties
downgrading the score while the multiple revenue streams from co-production have a positive
impact.
Government funding/incentives?
While no commercial scale Algae CCS production exists, a comparison with other
renewables shows a high dependency on government financial incentives like R&D grants,
feed-in-tariffs and tax credits or exemptions (EEG, 2012; Department of Energy and Climate
Change [DECC], 2011), therefore government funding/incentives earns a score of 1.
Carbon market?
It is unclear under current CCS regulatory frameworks whether Algae CCS qualifies as a
carbon-credit generating activity because it represents a carbon absorption and re-use
technology rather than permanent sequestration. It is argued that carbon credits could be
generated from the displacement of fossil fuels through alternative fuels and energy (Campbell
et al., 2011), but specific carbon policies will need to be developed to establish regulatory
Algae CCS
136
certainty (US DOE, 2010). This, together with the low carbon price and immature carbon
market yield a rating of 1 for the carbon market sub-criterion.
The overall assessment for Economics is “unaffordable” with an averaged score of 1.3.
Storage Quality
Capacity?
Algae CCS has the potential to absorb large volumes of CO2 in both offshore and onshore
locations throughout the world. According to Fernández et al. (2012), the production of 1t of
algae biomass requires a minimum of 1.8 t CO2, indicating significant technical capacity if up-
scaling is performed. However, the large areal space and water requirements for cultivation
systems and logistical challenges of matching emissions source and sink result in a
differentiation between technical and economic storage capacity. Current algae biomass
producers supply markets with prices of 10 – 300 EUR/kg for specialty products, while a
significant up-scaling of production to utilise the technical capacity will require the entering of
bulk commodity markets as feedstock for bioenergy or biofuels, with an anticipated price of
0.01 – 0.50 EUR/kg (Fernández et al., 2012). The large technical storage volumes, although not
currently translating into economic capacity, still earn Algae CCS a capacity rating of 2.
Rate?
The CO2 absorption rate is site specific and dependent on a large range of environmental and
resource parameters (CO2 source, sunlight hours, humidity, climate, water source, pond area,
algae strain, land area nutrients). An example calculation by the Commonwealth Scientific and
Industrial Research Organisation [CSIRO] (Campbell et al., 2009) for a Algae farm in Australia
assumes an annual CO2 utilisation of 185t CO2 per hectare, suggesting that the rate of storage is
mainly a question of scalability to reach commercial scale capacity of >1Mtpa. At the same
time, they observed significant economical and space limitations for the sites in Australia which
they considered.
Suitable Australian locations of a single algae farm have been identified in [2] as being
Mackay, Rockhampton, Gladstone (all in Queensland), Dry Creek, Port Augusta, Whyalla
(all in South Australia), Port Hedland, Broome and Kununurra (all in Western Australia).

Algae CCS
137
None of the above sites have sufficient land nearby to build enough algae farms to utilise all
of the carbon dioxide outputs of the power stations in question without increasing the piping
distance to 50km or more.
CSIRO (Campbell et al., 2009)
Due to the large number of variables impacting the algae growth rate as well as the limitations
imposed from the land usage side, rate earns a score of 2.
Duration?
Storage of CO2 in algae is a temporary form of storage until the end product, such as energy
or fuels, is combusted, and thus not considered as sequestration (US DOE, 2010), although the
displacement of fossil fuels represents a decrease in GHG concentrations. A proposed scenario
life cycle assessment by Brune et al. (2009) compares a gas-fired power plant with microalgae
as feedstock for power generation, suggesting a GHG avoidance potential of 22.3% – 29.7%.
Some algae by-products like charcoal or biochar may qualify as more permanent storage, but
the principal utilisation of algae as a biofuel/energy feedstock earns the duration sub-criterion a
1.
Verification?
Due to the temporary nature of the storage in form of biofuels, verification is not applicable.
Verification of stored CO2 is only applicable to pyrolitic by-products like biochar or charcoal
and therefore earns a rating of 1.5.
Storage Quality scores a “medium” (1.6) rating, mainly based on the large potential volumes
and achievable growth rate and potential of Algae CCS to displace of fossil fuels as a carbon
neutral renewable energy resource.
Environmental Impact
Potential impact on eco- and water systems?
Algae CCS provides a range of environmental benefits ranging from the recycling of CO2
and production of O2, the decrease in reliance on fossil fuels by providing a renewable energy
source, to the manufacture of other useful products such as biochar. The cultivation of some
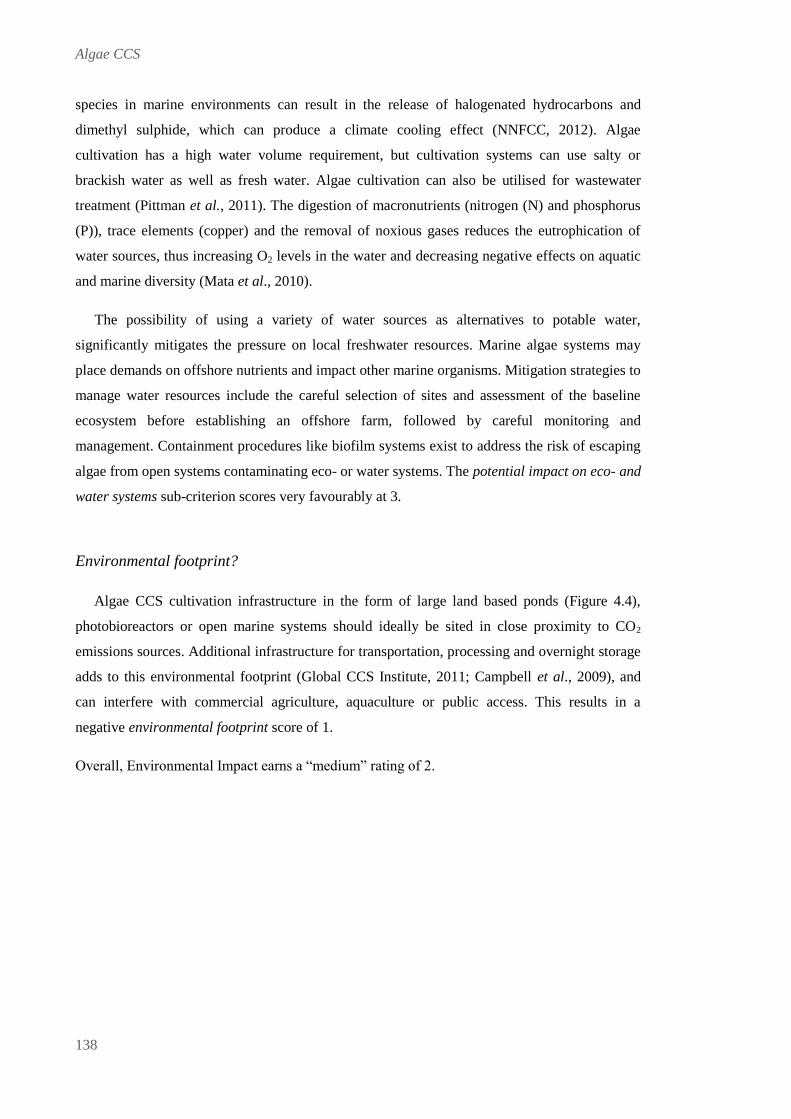
Algae CCS
138
species in marine environments can result in the release of halogenated hydrocarbons and
dimethyl sulphide, which can produce a climate cooling effect (NNFCC, 2012). Algae
cultivation has a high water volume requirement, but cultivation systems can use salty or
brackish water as well as fresh water. Algae cultivation can also be utilised for wastewater
treatment (Pittman et al., 2011). The digestion of macronutrients (nitrogen (N) and phosphorus
(P)), trace elements (copper) and the removal of noxious gases reduces the eutrophication of
water sources, thus increasing O2 levels in the water and decreasing negative effects on aquatic
and marine diversity (Mata et al., 2010).
The possibility of using a variety of water sources as alternatives to potable water,
significantly mitigates the pressure on local freshwater resources. Marine algae systems may
place demands on offshore nutrients and impact other marine organisms. Mitigation strategies to
manage water resources include the careful selection of sites and assessment of the baseline
ecosystem before establishing an offshore farm, followed by careful monitoring and
management. Containment procedures like biofilm systems exist to address the risk of escaping
algae from open systems contaminating eco- or water systems. The potential impact on eco- and
water systems sub-criterion scores very favourably at 3.
Environmental footprint?
Algae CCS cultivation infrastructure in the form of large land based ponds (Figure 4.4),
photobioreactors or open marine systems should ideally be sited in close proximity to CO2
emissions sources. Additional infrastructure for transportation, processing and overnight storage
adds to this environmental footprint (Global CCS Institute, 2011; Campbell et al., 2009), and
can interfere with commercial agriculture, aquaculture or public access. This results in a
negative environmental footprint score of 1.
Overall, Environmental Impact earns a “medium” rating of 2.

Algae CCS
139
Figure 4.4 Aerial view of Cyanotech microalgae farm and facilities in Keahole Point, Hawaii, USA which
produces high-value nutraceutical and food products, such as spirulina, from microalgae (Image source:
Cyanotech Corporation, 2013).
4.3.1 Science and Technology: Sub-Matrix Assessment
Technology Element 1: Site Identification and Characterisation
Site identification and characterisation for Algae CCS determines the economic and
technical feasibility of onshore or offshore locations to provide sufficient carrying capacity to
cultivate algae biomass at sufficient volumes. Factors to be assessed include the nutrient
availability for offshore marine locations to avoid excessive stripping of nutrients from the
water column and impacting marine life, access to water sources (fresh, saline or waste),
location of CO2 emissions sources, and climactic conditions and their impact on growth rates
(NNFCC, 2012; Borowitzka et al., 2012).
The site identification and characterisation process involves little public interaction and
awareness of the activities undertaken to assess offshore or terrestrial sites, until the later stages
when the public should be engaged/consulted, e.g. public hearings for offshore cultivation and
fishing industry concerns. These factors balance out to a Public Acceptance neutral (2) score.
The absence of consistent regulation regarding Algae CCS site specifications and standards for
cultivation and conversion activities (how and where they should be set up, environmental
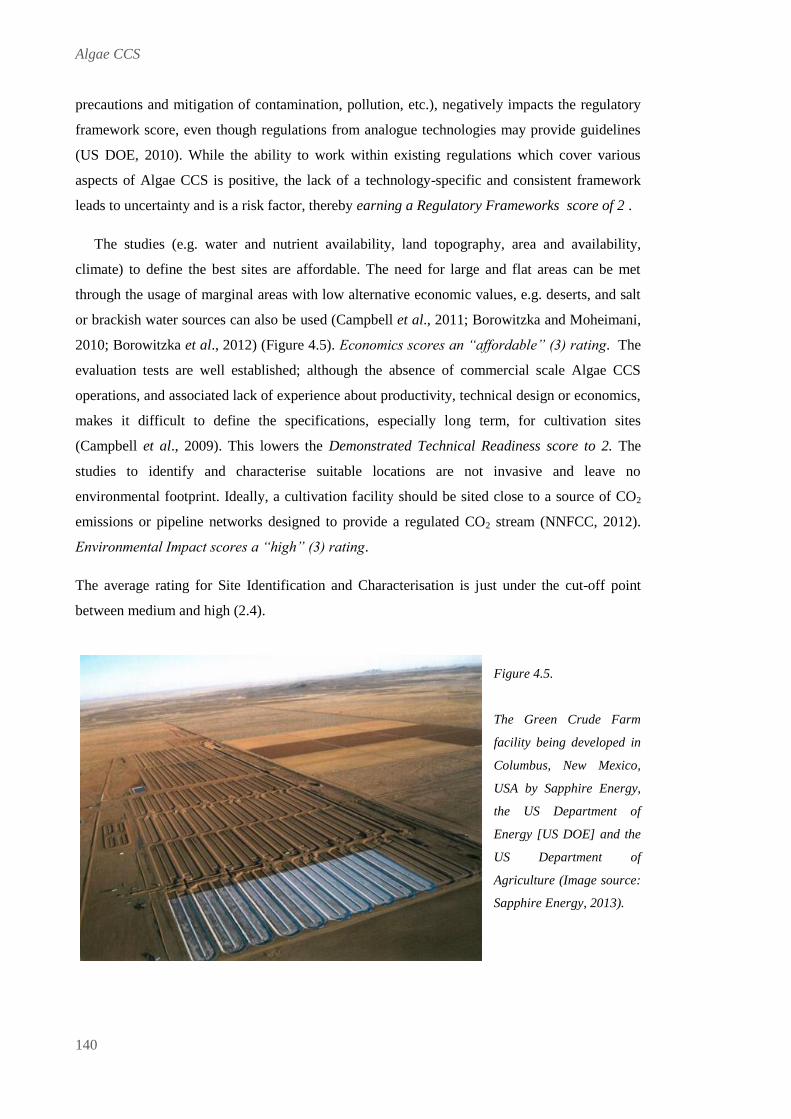
Algae CCS
140
precautions and mitigation of contamination, pollution, etc.), negatively impacts the regulatory
framework score, even though regulations from analogue technologies may provide guidelines
(US DOE, 2010). While the ability to work within existing regulations which cover various
aspects of Algae CCS is positive, the lack of a technology-specific and consistent framework
leads to uncertainty and is a risk factor, thereby earning a Regulatory Frameworks score of 2 .
The studies (e.g. water and nutrient availability, land topography, area and availability,
climate) to define the best sites are affordable. The need for large and flat areas can be met
through the usage of marginal areas with low alternative economic values, e.g. deserts, and salt
or brackish water sources can also be used (Campbell et al., 2011; Borowitzka and Moheimani,
2010; Borowitzka et al., 2012) (Figure 4.5). Economics scores an “affordable” (3) rating. The
evaluation tests are well established; although the absence of commercial scale Algae CCS
operations, and associated lack of experience about productivity, technical design or economics,
makes it difficult to define the specifications, especially long term, for cultivation sites
(Campbell et al., 2009). This lowers the Demonstrated Technical Readiness score to 2. The
studies to identify and characterise suitable locations are not invasive and leave no
environmental footprint. Ideally, a cultivation facility should be sited close to a source of CO2
emissions or pipeline networks designed to provide a regulated CO2 stream (NNFCC, 2012).
Environmental Impact scores a “high” (3) rating.
The average rating for Site Identification and Characterisation is just under the cut-off point
between medium and high (2.4).
Figure 4.5.
The Green Crude Farm
facility being developed in
Columbus, New Mexico,
USA by Sapphire Energy,
the US Department of
Energy [US DOE] and the
US Department of
Agriculture (Image source:
Sapphire Energy, 2013).

Algae CCS
141
Technology Element 2: Capture
Capture for Algae CCS refers to the process of separating and removing CO2, and scrubbing
of gases like hydrogen (H2) and sulphur oxides (SOx) from the air stream at large emitter sites
(power plants, fertilizer plants, etc). This element receives a favourable (3) Public Acceptance
rating as there is no perceived risk and the benefits to the environment are widely
acknowledged. With a few exceptions (e.g. UK and EU), the absence of legislated industry
compliance for the utilisation of capture technologies has a strongly negative impact and earns a
Regulatory Framework score of 1.
In general, Capture represents the most expensive part of a CCS project as the majority of
CO2 emission sources, such as coal fired power plants or other industrial emitters, have a CO2
content of less than 15% in the flue gas (IPCC, 2005). As typical gas stream properties of
natural gas include CO2 concentrations ranging from 2–65% (IPCC, 2005), the cost of
separating the CO2 before conversion to liquid natural gas (LNG) is an inherent cost of normal
production operations for LNG operators, so additional CAPEX for capture is limited. To
address low concentrations of CO2, complex and expensive technical solutions for separation
have to be employed. This earns Economics an unfavourable rating (1). On the technical side,
mature technology solutions for the capture process exist, such as post-combustion capture. This
solution captures approximately 90% of CO2 from industrial operations with a system
dependent energy penalty between 16% and 30% (SBC Energy Institute, 2012). A
Demonstrated Technical Readiness score of 3 indicates capture is ready and/or available in the
short term. The prevention of CO2 release and the availability of mitigation strategies to manage
negative by-products like amine solvents (Shao and Stangeland, 2009) yield an Environmental
Impact score of 3.
Capture scores an overall score of 2.2, as unfavourable economics and an absence of legislated
compliance negatively impact the score.
Technology Element 3: Transportation
Transportation for Algae CCS encompasses the safe and secure transport of the CO2 from
emissions points to the cultivation facility, as well as transport of the biomass for processing
and distribution of the end products. The impact of CO2 pipeline infrastructure and increased
vehicle traffic to transport biomass and end products in densely populated or environmentally
sensitive areas could negatively affect public opinion. Appropriate transport solutions, e.g.

Algae CCS
142
trains, may mitigate some of the impact if feasible. Public Acceptance scores a neutral (2)
rating. The transport of biomass and other by-products is already covered by existing pipeline
and haulage legislation. The same is valid for the road and rail transportation of CO2, however
conveyance of CO2 by pipeline may require amendments to existing pipeline legislation. This
earns the Regulatory Framework a score of 3.
Pipelines represent the most effective and economic onshore transport solution for the CO2
(SBC Energy Institute, 2012) and existing road and rail infrastructure can be utilised for
biomass and end products. However, it is unknown if existing pipeline and tanker designs and
algal lipid intermediates are compatible (US DOE, 2010). This balances out in a neutral (2)
rating for Economics, as the potential upgrade of components of the infrastructure may be
necessary. Pipeline and truck technology for the transport of biofuels and volatile gases is
already mature (IPCC, 2005). Compatibility of existing technologies with the stability,
prevention of auto-oxidation, temperature, and materials needs of algal bio-crude transportation
are unknown. Currently, they are assumed to be similar to plant lipids (US DOE, 2010). This
earns Demonstrated Technical Readiness a neutral (2) score. There are logistical challenges
because of the distances involved between widely distributed emissions sources, cultivation
ponds and conversion facilities. Some environmental footprint exists from pipeline networks,
possible increased road and rail infrastructure, and higher utilisation of the infrastructure. The
latter is especially critical if the preferred transport solution is truck haulage for biomass to
conversion facility and distribution of end products. Therefore Environmental Impact rates a
“high negative impact” score (1).
The overall score for the Transportation element is a medium (2) rating.
Technology Element 4: Cultivation
Cultivation refers to the growth, production and harvesting of microalgae at commercial
scales using either open raceway ponds, closed systems (series of transparent pipes, tubes and
hoses) or a combination of both with the first being the most commonly used since the 1960’s.
Most products require the removal of water and extraction of oil. Worldwide research efforts
and pilot studies in Australia, the UK, USA (California), EU (Germany, Netherlands) and
Norway have focused on establishing the best strains of microalgae for high lipid productivity,
high density, rapid growth rates, harvestability and survivability (Hannon et al., 2010; Hu et al.,
2008; Borowitzka et al., 2012).

Algae CCS
143
One challenge is to produce sufficient biomass feedstock that is sustainable and provides
reliable productivity across seasons and in different types of environments. Research by Dr. Jian
Qin from Flinders University, Queensland, Australia found that for Botryococcus braunii, the
maximum biomass for optimum hydrocarbon production is achieved with 23°C, 30-60 W/m2
irradiance light intensity, a 12hr light – 12hr dark photo period and a salinity of 8.8%, i.e.
confirming that this strain is tolerant of brackish water (Davidson, 2005). High concentrated
CO2 must be supplied to the microalgae cultivation systems, with some challenges such as the
rise in pH and salinity of the algal culture, the large volumes of gas that must be processed, and
vast quantities of water are required to keep the CO2 at low solubility. Algae consume CO2
during the daytime and they respire and release CO2 in the night, therefore storage facilities are
needed for CO2 piped from emissions sources such as power plants. Technologies from existing
algae applications can be applied to the algae biofuels production process, for example,
ultrasonic cavitation for harvesting from the nutraceuticals industry, which uses ultrasound
waves to break down algae cell walls (Cravotto et al., 2008).
Renewable sources of energy are favoured by the public and algae can absorb atmospheric
and anthropogenic CO2 during the photosynthetic process. Some NIMBY attitude prevails with
respect to the large land and water requirements, although siting in remote locations can
mitigate this. The same balance can be found with competition for land where the large
environmental footprint for ponds or aquatic farms restricts land usage (e.g. agricultural) or
marine access. Balancing these factors, Public Acceptance earns a “neutral” (2) rating. The
cultivation and conversion of algae biomass to biofuel, bioenergy or specialty products are
regulated and enabled under existing agricultural and renewables legislation so Regulatory
Frameworks earns a “supportive” (3) rating.
The high CAPEX and OPEX (dewatering and separation of products, high energy needs) of
cultivation systems and the difficulties with scaling up integrated extraction systems to
commercial levels affects the economics very unfavourably at the current stage (Fon Sing et al.,
2013). As salt or brackish water sources can be used, the reliance on expensive treated or fresh
water can be minimised, and has the additional benefit of minimising bacteria in the algae
strains. But overall the Economics of Cultivation scores an “unaffordable” (1) rating. The
technical readiness of cultivation systems has not been demonstrated at industrial scale.
Increased productivity research is estimated to take between three to fifteen years to identify the
best algae strains and cultivation systems to ensure sufficient volumes of biomass (US DOE,
2010; Global CCS Institute, 2011; NNFCC, 2012). Demonstrated Technical Readiness scores a
“long-term” (1). Algae CCS benefits the environment by recycling anthropogenic CO2 and
Algae CCS
144
providing a renewable energy source for liquid fuels and power generation, but is offset by the
environmental footprint of cultivation infrastructure. The utilisation of available water
resources, even if not immediately of use (brackish water), still represents a significant
intervention in an ecosystem. A regulated CO2 stream, and the overnight storage facilities for
CO2 because of fluctuating production rates, adds to the infrastructure footprint. These factors
balance out to an Environmental Impact score of 2.
The overall assessment of Cultivation is “mid - long term” readiness (1.8).
Technology Element 5: Conversion
Conversion refers to the various industrial processes used to convert or refine the microalgae
biomass into liquid biofuels, bioenergy or other by-products. The processes involved depend on
the algae strain and desired end product, and include: extraction (pressing and separation),
dehydration, using mechanical (expression, ultrasonic, membranes), chemical, thermochemical
or biochemical means, or a combination of methods (Molina Grima et al., 2003). The
biotechnical process is similar to that used in conventional biodiesel production, i.e.
transesterification (Demirbas and Demirbas, 2011). More advanced conversion techniques such
as direct gasification and biomass to liquid have a longer lead time for R&D (European Biofuels
Technology Platform/Zero Emission Fossil Fuel Power Plants [EBTP/ZEP], 2012; SBC Energy
Institute, 2012; Jonker and Faaij, 2013). Figure 4.6 illustrates the biorefinery research facility at
Wageningen University and Research Centre, Netherlands.
Public Acceptance is based on the analogy of fuels and energy generated from renewable
biomass sources being preferred to refinery/power plants which combust fossil fuels (Itaoka et
al., 2012; EU DGR, 2003). However, concerns about infrastructure siting (Upreti and van der
Horst, 2004; Savvanidou et al., 2010; van der Horst, 2007) lower the Public Acceptance score
to 2. Regulatory Frameworks favour the use of renewables and incentivise them, e.g. supporting
the CAPEX and OPEX of conversion plants, and through feed-in tariffs (EEG, 2012; DECC,
2011). Existing regulation for refineries and pollution controls can be applied or modified,
therefore Regulatory Frameworks earns a favourable (3) rating.
The economics of conversion to biofuel depend on the end product, e.g. biodiesel, and are
defined by the bulk commodity character of high volume but low margin products. Some
conversion methods like thermal have a high CAPEX (NNFCC, 2012; US DOE, 2010). Studies
differ in their estimates of algal oil production costs and range from $8.52 per gallon for open
ponds to $18.10 for photobioreactors (Davis et al., 2011; Sun et al., 2011). The biomass could

Algae CCS
145
however be used to generate power through anaerobic digestion if an electricity plant has
biomass capabilities. All these factors, together with the high OPEX related to their high energy
requirements yield an “unaffordable” Economics score (1). Current conversion technologies
are proving difficult to scale up and lack commercial scale demonstration (SBC Energy
Institute, 2012; Davis et al., 2011), thus Demonstrated Technical Readiness rates a low score
(1). The end products of algae biomass conversion to biofuel or bioenergy are carbon
neutral/negative, but the infrastructure footprint and the energy intensity of current conversion
process technologies lower the Environmental Impact score to a medium (2).
The overall rating for Conversion is “mid-long” term (1.8).
Figure 4.6 Horizontal tubular photobioreactor microalgae cultivation system and biorefinery at
AlgaePARC Research Facility, Wageningen University and Research Centre, Netherlands (Image source:
AlgaePARC, Wageningen UR, 2013).
Summary of Science and Technology Sub-Matrix Assessment
With the exception of Site Identification and Characterisation, the technology elements
specific to Algae CCS score around the medium range (Table 4.1). The evaluation criteria of
Economics and Demonstrated Technical Readiness have the lowest scores. This is because of
the significant amount of further R&D needed (algae strains, cultivation systems and conversion

Algae CCS
146
technologies) to maximise production efficiencies and reliability for sustainable volumes, and to
lower the costs of Capture, Cultivation and Conversion (US DOE, 2010).
The Science and Technology Sub-Matrix receives a “mid-long term” (2.04) assessment rating
(Table 4.1) which is rounded down to 2 and entered into the Science and Technology column of
the Master Matrix (Table 4.2).
Table 4.1. Science and Technology Sub-Matrix Scorecard: Results of Application of Methodology to
Algae CCS.
4.3.2 Summary of Results: Overall Technology Rating
The overall assessment rating for Algae CCS at 2.0 (Table 4.2) suggests a medium
probability of success as a commercial-scale CO2 sequestration option. Certain evaluation
criteria assessed in this analysis of Algae CCS do not have public domain data available that
address this specific carbon mitigation technology. The lack of case studies and data about pilot,
demonstration, commercial or operational projects, means that some of the ratings are based on
my analysis which is an extrapolation of literature from closely related subjects, such as
renewables and bioenergy.
Table 4.2. Master Matrix Scorecard: Results of Application of Methodology to Algae CCS.

Algae CCS
147
4.4 DISCUSSION
My assessment of Algae CCS yielded a number of observations which should be taken into
account when planning a carbon management portfolio or project. My initial expectation of an
unfavourable (1) Science and Technology rating for Algae CCS due to the absence of large
scale demonstration projects, and the significant R&D efforts still required to identify the most
suitable microalgae strains and integrated conversion processes for high volume production of
biofuel, energy and biomass, was not upheld (IPCC, 2011; Global CCS Institute, 2011;
Borowitzka and Moheimani, 2010). The main contributing factors to a more favourable rating
are the generally high levels of public and political acceptance of renewable energy, and the
ability to refer to existing supportive regulatory frameworks and associated incentives for nearly
all of the sub-criteria. The lack of literature, data, case studies and demonstration projects means
some of my analysis is limited to extrapolation from literature from the related topics of
bioenergy and renewables.
Suggestions to Improve Uptake
I suggest the following as areas of priority to improve and accelerate the wide-spread
commercial deployment of Algae CCS:
An initial focus on demonstrating the combination of Algae CCS with municipal
waste water treatment as the first phase/application where CO2 from power plant
flue gas is fed into cultivation ponds using municipal waste water as both water and
fertiliser source. The microalgae utilise the CO2, nitrogen and phosphorus from the
nutrient-rich waste water to increase production of biomass and aid in anaerobic
digestion of microbes to form biogas (methane), both of which can be used to
generate electricity (Mitchell, 2008; Mata et al., 2010). A side benefit is the
mitigation of waterway eutrophication. A large-scale pilot project demonstrating this
combination of techniques would provide valuable learning and experience. It is a
simpler and faster means of up-scaling production which is solely reliant on
maximisation of biomass feedstock production, rather than having to wait for the
projected three to fifteen years worth of R&D activities to optimise biofuel lipids
and genetics of microalgae strains. (Pittman et al., 2011)
The development of biorefineries similar to traditional petroleum refineries. These
integrated biomass conversion facilities would co-produce a range of sustainable
fuels, power, heat and value added chemicals (low volume – high value products,
Algae CCS
148
e.g. beta-carotene), for multiple revenue streams, while maximising the utilisation
and improving the economics of biomass conversion processes (Brennan and
Owende, 2010; International Energy Agency Bioenergy [IEA Bioenergy], 2009; US
DOE, 2010).
An integrated technology that offers potential efficiencies is the engineered capture
of CO2 by photosynthesis, or algae (biologic) fixation. This process aims to convert
the algae directly into liquid fuels by feeding it a pure stream of CO2, i.e. CO2
capture with biofuel production. Investment in this biofuel technology could
improve efficiencies, but it is an early stage technology (demonstration phase) with
significant challenges to achieve technical maturity as the process is proving difficult
to industrialise and upscale, with logistical challenges, high biomass production
costs and heavy energy penalty (SBC Energy Institute, 2012; Davis et al., 2011;
Jonker and Faaij, 2013; Borowitzka et al., 2012).
4.5 CONCLUSIONS
Algae CCS is a third generation biofuel technology that not only lowers atmospheric and
anthropogenic levels of CO2, but also has the potential to provide renewable liquid biofuels and
bioenergy. As such, it has high levels of Public Acceptance and supportive Regulatory
Frameworks because it is a carbon neutral/negative renewable energy source. The most
important evaluation criterion affecting the commercial adoption of Algae CCS as a carbon
mitigation option is Science and Technology, which in turn affects Economics. The low (1.6)
score for Storage Quality, because of its temporary duration rather than permanent
sequestration, affects the Economics carbon market sub-criterion, but is offset by the ability to
offset GHG as a renewable energy for both liquid fuel and power generation.
Algae CCS represents significant potential, with multiple income streams and a number of
associated environmental benefits. At this point, all the commercialisation pathways (biofuels,
bioenergy and commodity chemicals) still need to prove their potential for sustainability, up-
scalability and industrialisation (SBC Energy Institute, 2012; Davis et al., 2011; Jonker and
Faaij, 2013; Fon Sing et al., 2013). Some technology elements have been demonstrated but are
not yet commercial because of financial viability or up-scaling issues. R&D efforts focus on the
identification of suitable microalgae strains, improvements in productivity, yield and the
development of integrated cultivation systems and energy-efficient conversion techniques, with

Algae CCS
149
reports estimating technical and commercial maturity timeframes between a wide ranging three
to fifteen years (SBC Energy Institute, 2012; US DOE, 2010; Global CCS Institute, 2011;
NNFCC, 2012). In time, Algae CCS promises to be an effective carbon mitigation solution
because of: fast microalgae growth rates, high yields of lipids and biomass for renewable liquid
biofuels and bioenergy, global applicability in both terrestrial and marine environments, little/no
competition with agricultural land, high quality and flexibility of by-products, and fast uptake of
and efficiency in utilising CO2.

Algae CCS
150

Algae CCS
151
REFERENCES
Borowitzka, M.A., and Moheimani, N.R. (2010), Sustainable Biofuels from Algae: Mitigation and
Adaptation Strategies for Global Change, 1-13.
Borowitzka, M.A., Boruff, B. J., Moheimani, N. R., Pauli, N., Cao, Y., and Smith, H. (2012),
Identification of the optimum sites for industrial-scale microalgae biofuelpProduction in WA using a
GIS model: Final Report prepared for The Centre for Research into Energy for Sustainable Transport
(CREST).
Brennan, L., and Owende, P. (2010), Biofuels from microalgae—a review of technologies for
production, processing, and extractions of biofuels and co-products: Renewable and Sustainable
Energy Reviews, 14, 2, 557-577.
Brune, D.E., Lundquist, T.J., and Benemann, J.R. (2009), Microalgal Biomass for Greenhouse Gas
Reductions; Potential for Replacement of Fossil Fuels and Animal Feeds; Journal of Environmental
Engineering, 135, 11, 1136-1144.
Campbell, P.K., Beer, T. and Batten, D. (2009). Greenhouse gas sequestration by algae – energy and
greenhouse gas life cycle studies: Presented at the 6th Australian Conference on Life Cycle
Assessment, Australian Life Cycle Assessment Society (ALCAS).
Campbell, P.K., Beer, T. and Batten, D. (2011), Life cycle assessment of biodiesel production from
microalgae in ponds: Bioresource Technology, 102, 2, 50-56.
Cravotto, G., Boffa, L., Mantegna, S., Perego, P., Avogadro, M., and Cintas, P. (2008), Improved
extraction of vegetable oils under high-intensity ultrasound and/or microwaves: Ultrasonics
Sonochemistry, 15, 5, 898-902.
Davidson, S. (2005), Growing fuel from algae: Ecos, 124, 34-34.
http://www.ecosmagazine.com/?act=view_file&file_id=EC124p34.pdf (accessed 10 December 2012 )
Davis, R., Aden, A., and Pienkos, P.T. (2011), Techno-economic analysis of autotrophic microalgae for
fuel production: Applied Energy, 88, 10, 3524–3531.
Demirbas, A., and Demirbas, M.F. (2011), Importance of algae oil as a source of biodiesel: Energy
Conversion and Management, 52, 1, 163-170.
Department of Energy and Climate Change [DECC] (2011), Planning our electric future: a White
Paper for secure, affordable and low-carbon electricity: Presented to Parliament by the Secretary of
Algae CCS
152
State for Energy and Climate Change by Command of Her Majesty, July 2011.
https://www.gov.uk/government/uploads/system/uploads/attachment_data/file/48129/2176-emr-
white-paper.pdf (accessed 28 July 2012).
EEG (2012), Gesetz für den Vorrang Erneuerbarer Energien, 25 October 2008 (BGBl. I S. 2074),
amended on 17 August 2012 (BGBl. I S. 1754).
Ek, K. (2005), Public and private attitudes towards ‘‘green’’ electricity: the case of Swedish wind power:
Energy Policy, 33, 1677–1689.
European Biofuels Technology Platform/Zero Emission Fossil Fuel Power Plants [EBTP/ZEP]
(2012), Biomass with CO2 capture and storage (Bio-CCS): The way forward for Europe: The
Advisory Council of the European Technology Platform for Zero Emission Fossil Fuel Power Plants
(ZEP) and the Steering Committee of the European Biofuels Technology Platform (EBTP).
http://www.biofuelstp.eu/bio-ccs.html (accessed 2 July 2012).
European Commission. Directorate General for Research [EU DGR] (2003), Energy: issues, options
and technologies, science and society, 20624 [European Opinion Research Group (Ed.)]: European
Commission.
European Parliament and the Council of the European Union [EP CEU] (2009). Directive
2009/28/EC of the European Parliament and of the Council, on the Promotion of the Use of Energy
From Renewable Sources and Amending and Subsequently Repealing Directives, 2001/77/EC and
2003/30/EC, 23 April 2009.
Fernández, F.G.A., González-López, C.V., Sevilla, J.F., and Grima, E.M. (2012), Conversion of CO2
into biomass by microalgae: how realistic a contribution may it be to significant CO2 removal?:
Applied microbiology and biotechnology, 96, 3, 577-586.
Fon Sing, S., Isdepsky, A., Borowitzka, M.A., and Moheimani, N.R. (2013), Production of biofuels from
microalgae: Mitigation and Adaptation Strategies for Global Change, 18, 1, 47–72.
Global CCS Institute (2011), Accelerating the uptake of CCS: Industrial use of captured carbon dioxide,
[Parsons Brinckerhoff], Canberra, Australia.
Hannon, M., Gimpel, J., Tran, M., Rasala, B. and Mayfield, S. (2010), Biofuels from algae: challenges
and potential: Biofuels, 1, 5, 763–784.

Algae CCS
153
Hu, Q., Sommerfeld, M., Jarvis, E., Ghirardi, M., Posewitz, M., Seibert, M., and Darzins, A. (2008),
Microalgal triacylglycerols as feedstocks for biofuel production: perspectives and advances: The Plant
Journal, 54, 4, 621-639.
International Energy Agency Bioenergy [IEA Bioenergy] (2009), IEA Bioenergy Task 42 Biorefinery.
[de Jong, E., Langeveld, H. and van Ree, R. (eds.)]: Wageningen University and Research Centre, The
Netherlands.
Intergovernmental Panel on Climate Change [IPCC] (2005), Intergovernmental Panel on Climate
Change Special Report on Carbon Dioxide Capture and Storage. Prepared by Working Group III of
the Intergovernmental Panel on Climate Change [Metz, B.O., Davidson, H., de Coninck, C., Loos, M.
and Meyer, L.A. (eds.)]: Cambridge University Press, Cambridge, United Kingdom and New York,
NY, USA.
Intergovernmental Panel on Climate Change [IPCC] (2011), Summary for policymakers. In: IPCC
Special Report on Renewable Energy Sources and Climate Change Mitigation (SRREN) [Edenhofer,
O., Pichs‐Madruga, R., Sokona, Y., Seyboth, K., Matschoss, P., Kadner, S., Zwickel, T., Eickemeier,
P., Hansen, G., Schlömer, S., von Stechow, C. (eds)]: Cambridge University Press, Cambridge, United
Kingdom and New York, NY, USA.
Intergovernmental Panel on Climate Change [IPCC] (2012), Intergovernmental Panel on Climate
Change Special Report on Renewable Energy Sources and Climate Change Mitigation (SRREN) [O.
Edenhofer, R. Pichs‐Madruga, Y. Sokona, K. Seyboth, P. Matschoss, S. Kadner, T. Zwickel, P.
Eickemeier, G. Hansen, S. Schlömer, C. von Stechow (eds)], Cambridge University Press, New York,
NY, USA.
Itaoka, K., Saito, A., Paukovic, M., de Best-Waldhober, M., Dowd, A-M., Jeanneret, T., Ashworth, P.
and James, M. (2012), Understanding how individuals perceive carbon dioxide: Implications for
acceptance of carbon dioxide capture and storage: CSIRO Report EP 118160, Australia.
Jonker, J.G.G., and Faaij, A.P.C. (2013), Techno-economic assessment of micro-algae as feedstock for
renewable bio-energy production. Applied Energy, 102, 461–475.
Lane, J. (2012), Change the world: Sapphire Energy’s Green Crude Farm, illustrated: Biofuels Digest, 2
October 2012. http://www.biofuelsdigest.com/bdigest/2012/10/02/change-the-world-sapphire-
energys-green-crude-farm-illustrated/ (accessed 24 April 2013).
Mata, T.M., Martins, A.A., and Caetano, N.S. (2010), Microalgae for biodiesel production and other
applications: A review: Renewable and Sustainable Energy Reviews, 14, 1, 217-232.

Algae CCS
154
McKendry, P. (2002), Energy production from biomass (part 1): Overview of biomass: Bioresource
Technology, 83, 37-46.
Mitchell, B. G., (2008), UCSD Consortium to Develop Biofuels from Microalgae: A concept; progress
one project at a time: Presented at the Algal Biotechnology Seminar Series.
http://www.spg.ucsd.edu/algae/pdf/080129_SDCMA_biofuel_symp_bgm.pdf (accessed 5 December
2012)
Molina Grima, E., Belarbi, E.H., Acien Fernandez, F.G., Robles Medina, A., and Chisti, Y. (2003),
Recovery of microalgal biomass and metabolites: process options and economics: Biotechnology
Advances, 20, 7, 491-515.
NNFCC (2012), Research Needs in Ecosystem Services to Support Algal Biofuels,Bioenergy and
Commodity Chemicals Production in the UK: A project for the Algal Bioenergy Special Interest
Group [Smith, N. and Higson, A.]: NNFCC Project Number: 12-008.
Pacala, S., and Socolow, R. (2004), Stabilization Wedges: Solving the climate problem for the next 50
years with current technologies: Science, 305, 5686, 968-972.
Pittman, J. K., Dean, A. P., & Osundeko, O. (2011), The potential of sustainable algal biofuel production
using wastewater resources: Bioresource technology, 102,1, 17-25.
Price, A. (2011), Sequestration of carbon dioxide using microalgae: Investigating Climate Change:
Parsons Brinkley (PB) Network, 72, 22-24.
Sapphire Energy (2012), Sapphire Energy’s commercial demonstration algae-to-energy facility now
operational: Initial phase of world’s first green crude farm completed on time and on budget: [press
release], 27 August 2012: Sapphire Energy, Columbus, NM, USA.
Sapphire Energy (2013), Green Crude Farm. http://www.sapphireenergy.com/locations/green-crude-
farm.html (accessed 24 April 2013).
Savvanidou, E., Zervas, E., Tsagarakis, K.P. (2010), Public acceptance of biofuels: Energy Policy, 38,
3482-3488.
SBC Energy Institute (2012), Leading the Energy Transition: Bringing Carbon Capture and Storage to
Market, [Soupa, O., Lajoie, B., Long, A., and Alvarez, H.]: Schlumberger Business Consulting [SBC]
Energy Institute.
Scott, S.A., Davey, M.P., Dennis, J.S., Horst, I., Howe, C.J., Lea-Smith, D.J. and Smith, A.G. (2010),
Biodiesel from algae: challenges and prospects: Current Opinion in Biotechnology, 21, 3, 277-286.

Algae CCS
155
Shao, R. and Stangeland, A. (2009), Amines Used in CO2 Capture- Health and Environmental Impacts:
Bellona Report 2009: The Bellona Foundation, Oslo, Norway.
Sheehan, J., Dunahay, T., Benemann, J. and Roessler, P. (1998), A Look Back at the U.S. Department of
Energy’s Aquatic Species Program: Biodiesel from Algae, 328, Golden: National Renewable Energy
Laboratory.
Sun, A., Davis, R., Starbuck, M., Ben-Amotz, A., Pate, R. and Pienkos, P. T. (2011). Comparative cost
analysis of algal oil production for biofuels: Energy, 36, 8, 5169-5179.
Upreti, B. and van der Horst, D. (2004), National renewable energy policy and local opposition in the
UK; the failed development of a biomass electricity plant: Biomass and Bioenergy, 26, 60-69.
US Department of Energy [US DOE] (2010), National Algal Biofuels Roadmap: US Department of
Energy, Office of Energy Efficiency and Renewable Energy, Biomass Program.
van der Horst, D. (2007), NIMBYor not? Exploring the relevance of location and the politics of voiced
opinions in renewable energy siting controversies: Energy Policy, 35, 2705-2714.
WA Energy Research Alliance [WA ERA] (2010), Geosequestration R&D: A Report to Australian
National Low Emission Coal R&D Program, March 2010.
Zeiler, K.G., Heacox, D.A., Toon, S.T., Kadam, K.L., and Brown, L. M. (1995), The use of microalgae
for assimilation and utilization of carbon dioxide from fossil fuel-fired power plant flue gas: Energy
Conversion and Management, 36, 6, 707-712.

Biochar CCS
157
CHAPTER 5
APPLICATION OF METHODOLOGY:
BIOCHAR CCS
OVERVIEW
The new assessment methodology and rating system are applied to Biochar CCS. Biochar
CCS involves the capture of CO2 through photosynthesis and sequestration occurs when the
biomass is converted into solid carbon. After an initial review of the applicability of the
methodology, I provide an initial introduction to Biochar CCS. This is followed by the
application of the methodology. The results of the analysis will be discussed and some
recommendations to accelerate the uptake made. It proved necessary to extrapolate some
evaluation criteria from analogues such as renewables and bioenergy due to a lack of
published literature or case studies in the public domain. The overall evaluation of Biochar
CCS predicts a high probability of success due to its immediate availability at different scales,
as well as a large range of economic, environmental and agricultural benefits.

Biochar CCS
158
Biochar CCS
159
5.1 APPLICATION OF METHODOLOGY: BIOCHAR CCS
Firstly, I check that all evaluation criteria of the methodology as derived from the
calibration with Geosequestration are applicable, and recalibrate and update the Science and
Technology Sub-Matrix to define the technology-specific elements of Biochar CCS,
mimicking the technology elements of Geosequestration as closely as possible.
I identify the technology elements of Biochar CCS as:
1) Site identification and characterisation
2) Feedstock
3) Transportation
4) Conversion (pyrolysis/gasification) to carbon products
5) MMV
The second technology element of Feedstock replaces the Capture element of
Geosequestration, as it is at this stage that CO2 is naturally “captured” from the atmosphere
during photosynthesis. Similarly to Algae CCS, the fourth element is substituted with
Conversion, albeit using different types of engineering and processes from those used in
Algae CCS. Biochar CCS includes the application of biochar to soil, however the end
applications of biochar, carbon materials, carbon products or energy are not assessed in detail
as such an analysis would go beyond the scope of this CCS feasibility and risk assessment.
5.2 INTRODUCTION
The management of forest and agricultural soils, under the category of natural carbon
sinks, is included by Pacala and Socolow (2004) in their Stabilisation Wedge Model as a
current technology which can be scaled up to achieve the goals needed to reduce greenhouse
gas (GHG) emissions. The use of biochar for sequestration purposes or as a potential
bioenergy or biofuel option offers opportunities for both emissions reductions and CO2
sequestration, and is included in the Intergovernmental Panel on Climate Change [IPCC]
Special Reports (2011, 2012) on Renewable Energy Sources and Climate Change Mitigation
(SRREN). A range of authors have discussed Biochar CCS, or pyrolysis of biomass with the
biochar returned to the soil, as one method of lowering GHG levels (Lehman et al., 2006;
Glaser et al., 2001; Laird, 2008; Lal, 2011; Roberts et al., 2009). The IPCC’s Special Report

Biochar CCS
160
on Land Use, Land Use Change, and Forestry (2000) including Biochar CCS as a key
technology to reach CO2 atmospheric concentration targets.
Biochar is one of three carbon-rich materials produced by pyrolysis, the thermo-chemical
decomposition of biomass (organic materials) in the absence of (or limited) oxygen (Demirbas
and Arin, 2010); the other two carbon products are tars or oils, and syngas. The definition of
biochar for the purposes of this thesis, follows that of the International Biochar Initiative [IBI]
(IBI, 2012), and incorporates the terms black carbon, char, charcoal, agrichar, and activated
carbon. The 2010 study by Lehmann and his research team at Cornell University estimates a
potential offset of 12% GHG emissions (CO2, methane (CH4) and nitrous oxide (N2O)). This
equates to 1.8 Gtpa CO2-equivalent (CO2-e) net emissions, with biochar produced from
sustainable biomass, and yields a larger GHG offset benefit than combustion of the same
biomass for bioenergy at 10% GHG emissions (Woolf et al., 2010). In its Special Report of
2000, the IPCC states that over 80% of organic carbon in terrestrial ecosystems is held in soil
rather than biomass. Plant matter absorbs CO2 through photosynthesis, trapping it in solid
stable carbon state when pyrolised (Figure 5.1).
Figure 5.1. Example of biochar (Image source: Australia and New Zealand Biochar Researchers
Network, 2013).
When added to soil at 0.5 m to 1 m depth, the biochar becomes sequestered through
humification, a state of physical and chemical stability for organic matter without further
break down of the constituents. Biochar is highly recalcitrant, i.e. stable and not easily

Biochar CCS
161
released into soluble form, thus slowing the rate at which carbon fixed by photosynthesis is
returned to the atmosphere. Biochar materials have a large surface area which are highly
porous (Figure 5.2), thereby supporting biochemical (micro organisms = microbiota,
aromaticity) and physiochemical reactions, facilitating nutrient uptake through increased
water retention and cation exchange capacity (CEC) (Sombroek et al., 2003; Liang et al.,
2006).
Biochar also supports surface sorption to adsorb nutrients and agricultural chemicals
(phosphates, nitrates), reducing leaching to soil and ground water. Many biochars have a
neutral to alkaline pH value and can act as a liming agent to neutralise acidic soils, adsorbing
ammonia (NH3) and decreasing its volitisation (Fowles, 2007; Waters et al., 2011; Lehmann
et al., 2006). It significantly reduces the release of CH4 and N2O from soil (Rondon et al.,
2005). The microbiota catalyse processes to increase carbon to nitrogen ratios, reducing
nitrogen loss and NO2 emissions by preventing/limiting anaerobic production of NO2 and
increasing nitrogen availability/efficiency for plant growth (Glaser et al., 2001). As a
fertiliser, the effects of biochar on soils, crop yield and soil carbon are determined by the
biochar quality (nutrient composition), as well as the properties of soil and ecosystem where
the biochar is applied (Amonette and Joseph, 2009; Lehmann et al., 2006).
Figure 5.2. Electron microscopic image of biochar showing micropore structure (Image source:
Biochar Project (Jocelyn), 2013).
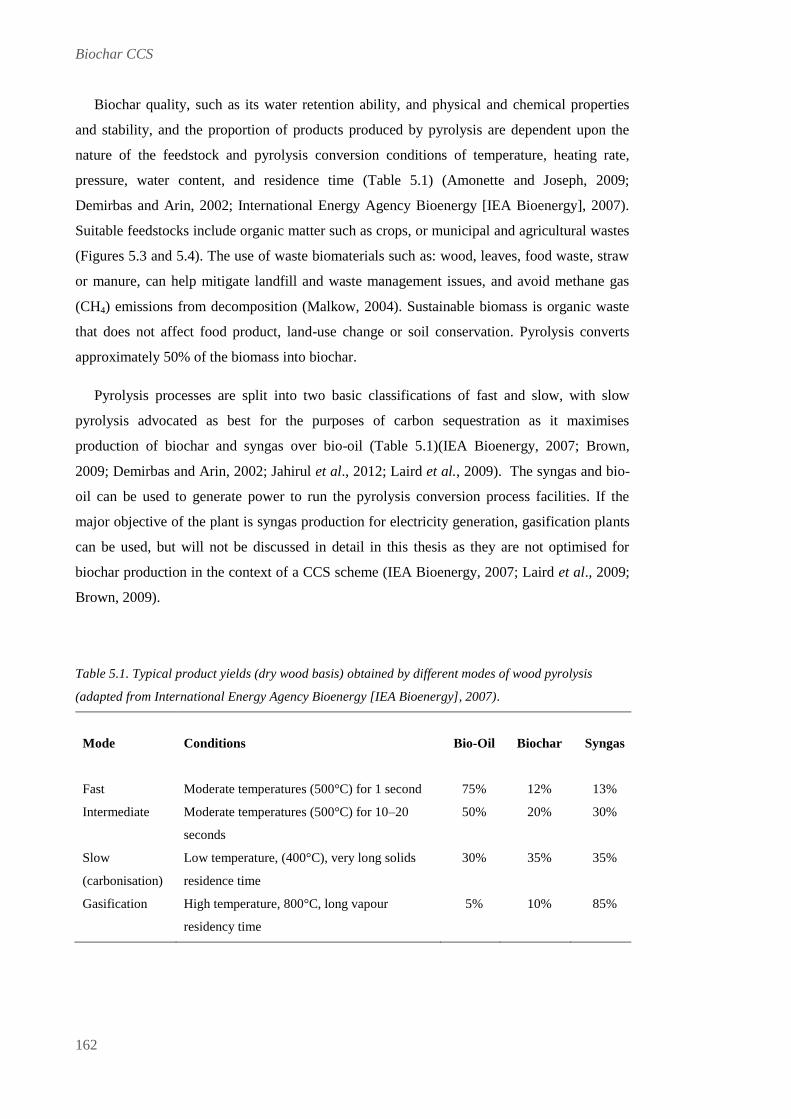
Biochar CCS
162
Biochar quality, such as its water retention ability, and physical and chemical properties
and stability, and the proportion of products produced by pyrolysis are dependent upon the
nature of the feedstock and pyrolysis conversion conditions of temperature, heating rate,
pressure, water content, and residence time (Table 5.1) (Amonette and Joseph, 2009;
Demirbas and Arin, 2002; International Energy Agency Bioenergy [IEA Bioenergy], 2007).
Suitable feedstocks include organic matter such as crops, or municipal and agricultural wastes
(Figures 5.3 and 5.4). The use of waste biomaterials such as: wood, leaves, food waste, straw
or manure, can help mitigate landfill and waste management issues, and avoid methane gas
(CH4) emissions from decomposition (Malkow, 2004). Sustainable biomass is organic waste
that does not affect food product, land-use change or soil conservation. Pyrolysis converts
approximately 50% of the biomass into biochar.
Pyrolysis processes are split into two basic classifications of fast and slow, with slow
pyrolysis advocated as best for the purposes of carbon sequestration as it maximises
production of biochar and syngas over bio-oil (Table 5.1)(IEA Bioenergy, 2007; Brown,
2009; Demirbas and Arin, 2002; Jahirul et al., 2012; Laird et al., 2009). The syngas and bio-
oil can be used to generate power to run the pyrolysis conversion process facilities. If the
major objective of the plant is syngas production for electricity generation, gasification plants
can be used, but will not be discussed in detail in this thesis as they are not optimised for
biochar production in the context of a CCS scheme (IEA Bioenergy, 2007; Laird et al., 2009;
Brown, 2009).
Table 5.1. Typical product yields (dry wood basis) obtained by different modes of wood pyrolysis
(adapted from International Energy Agency Bioenergy [IEA Bioenergy], 2007).
Mode
Conditions
Bio-Oil
Biochar
Syngas
Fast Moderate temperatures (500°C) for 1 second 75% 12% 13%
Intermediate Moderate temperatures (500°C) for 10–20
seconds
50% 20% 30%
Slow
(carbonisation)
Low temperature, (400°C), very long solids
residence time
30% 35% 35%
Gasification
High temperature, 800°C, long vapour
residency time
5% 10% 85%

Biochar CCS
163
Figure 5.3. Potential ecosystem benefits from biochar production and application systems (Figure
adapted from Waters et al., 2011).
Figure 5.4. Overview of the sustainable biochar concept (Image Source: Woolf et al., 2010).

Biochar CCS
164
Pyrolysis systems are already in operation around the world at a range of scales; from
household stoves and kilns to industrial facilities producing products for specialty markets,
such as bio-oil derived acetic acid, resins, food flavourings, agrichemicals, fertilisers, and
emission-control agents (URS Australia, 2010; Winsley, 2007). Pyrolysis can involve a wide
range of reactor types, e.g. fixed and circulating fluid beds, bubbling fluidised bed, rotating
cone, ablative, and mechanical or centrifugal ablative processes (Winsley, 2007; Demirbas
and Arin, 2002; Jahirul et al., 2012; IEA Bioenergy, 2007). Global research activities (e.g.
New Zealand, Australia, Japan, Scandanavia, Europe, United Kingdom, Northern Africa,
North America and Brazil) are focused on more affordable, environmentally-friendly and
production-efficient pyrolysis systems, as well as on the agricultural and environmental
benefits of biochar (Jahirul et al., 2012; Winsley, 2007).
To date, there are no commercially operating biochar production systems for the primary
purpose of carbon sequestration on which to base an assessment of possible combinations of
feedstocks, conversion technologies, and application systems (National Resources Defense
Council [NRDC], 2010). Since 2006, Pacific Pyrolysis has operated and scaled up a pilot
demonstration facility in Somersby, north of Sydney, New South Wales, Australia, and is
constructing two additional slow pyrolysis plants. The Ballina plant project in NSW, owned
and operated by the Ballina Shire Council, will operate from a waste management centre, and
has the capacity to divert 29,000 t of organic waste from landfills, remove ~50,000 tpa of
carbon, and generate 6000 MWh of carbon negative renewable energy. The Carbon Negative
Electricity Project in Melbourne, owned and operated by Pacific Pyrolysis, will process solid
organic waste at the rate of 2 t/hr to generate 1MW of electricity and up to 5,000 t pa of high
grade biochar (Pacific Pyrolysis, 2013; BEN 2011, 2012; Ballina Information, 2012).
Biochar provides a number of complementary environmental, economic and societal
benefits that can be simultaneously achieved, and covers the mitigation of climate change by
sequestering CO2 in solid carbon state, waste and land management, renewable energy
production, and soil and water improvement (Lehmann and Joseph, 2009a; Laird et al., 2009).
Figure 5.4 provides an overview of the sustainable biochar concept proposed by Woolf et al.
(2010) illustrating the inputs, process, outputs, applications and impacts on the global climate,
with the relative proportions of the components under each category. De Gryze et al. (2010)
provide examples from different slow pyrolysis technology studies, examining the GHG
emissions avoided with different organic inputs, for example, corn stover ranging from 1.1 –
10.7 t CO2-e per t of dry feedstock, and yard waste ranging from 3.0 – 12.5 t CO2-e.

Biochar CCS
165
The potential benefits of Biochar CCS to plant-soil systems are shown in Figure 5.5. The
dark earth Terra Preta de Indio soils of the Amazon region are characterised by high content
of pyrogenic carbon (similar to biochar) and demonstrate the ability to maintain high fertility,
retain nutrients (reduce leaching), promote liming (overcome soil acidity) and increased
fertiliser efficiency and increased plant yield. Biochar CCS can address the growing problem
of food security, by producing more crop yield on less land (Glaser et al., 2001; Neves et al.,
2003; Lal, 2004). Radiocarbon dating of the Terra Preta soils measured the mean residence
time (MRT) as ranging from 500-7000 years illustrating that this is a long term sequestration
option (Neves et al., 2003). Whitman et al. (2010) suggest that for the purposes of carbon
accounting, although the MRT of biochars is >1000 years, more effective accounting could be
achieved by using a recalicitrant fraction, which is highly stable, and a labile fraction, which
describes the portion which is more quickly decomposed. The MRT and soil benefits depend
on the type of feedstock, conversion method and soil where the biochar is applied, and length
of time the soil is left undisturbed to minimise decay and potential release of CO2 back into
the atmosphere.
Figure 5.5. Potential impacts of Biochar application to plant-soil systems (Figure adapted from Waters
et al., 2011)

Biochar CCS
166

Biochar CCS
167
5.3 RESULTS
Public Acceptance
How does Biochar CCS affect me?
Application of Biochar CCS could require land-use changes to grow biomass and cause
potential conflicts and concern about agricultural land use switch to produce crops for
biomass and/or using food crops for biofuels (Ipsos-MORI, 2010; Müller et al., 2008). On the
other hand, there are multiple benefits to communities through improved soil health, water
retention, agricultural yield, lower fertiliser requirement, recycling of waste biomass and
reduction of landfill requirements, etc. Offsetting these against each other means the how does
it affect me sub-criterion scores a 2.
How natural is Biochar CCS?
In the Ipsos-MORI Experiment Earth Report (2010), the perceived naturalness of a
technique was a powerful stimulus for producing support, with Biochar CCS being perceived
as a more natural approach and more feasible in comparison to stratospheric aerosols, solar
radiation management or ocean fertilisation techniques. Biochar CCS enhances the natural
carbon cycle that presents a low/no risk. The other by-products of pyrolysis are renewable
“green” energies, and have an associated positive public attitude (Savvinidou, 2010; Ek,
2005). This yields a score of 3 for the how natural is it sub-criterion.
Science and technology comprehension
The benefits to the environment are easily understood by the public which has a basic
understanding of the scientific concepts behind photosynthesis (Itaoka et al., 2012; Ipsos-
MORI, 2010). Biochar CCS sequesters the CO2 captured through natural photosynthetic
processes into a stable form before decay and release of the CO2 or CH4 into the atmosphere
(Brown, 2009; Harris, 1999). The general public is also familiar with the basic concepts about
the technology used to produce charcoal as it has been utilised globally for thousands of years
(Food and Agriculture Organisation [FAO], 1983; Moscowitz, 1978). This earns a science and
technology comprehension score of 3.
An overall rating of 2.7 suggests that a “public positive” attitude prevails towards Biochar
CCS and this is entered into the Public Acceptance column of the Master Matrix.

Biochar CCS
168
Regulatory Frameworks
Enabling body of law and regulations?
The activities to implement Biochar CCS are implicitly or directly covered under a diverse
range of existing global regulation from a myriad of regulators including the United Nations
[UN], local, state, federal and regional governments as well as authorities (Cowie et al., 2012;
Driver and Gaunt, 2010). This includes Article 3.3 of the UN Framework for Climate Change
[UNFCC] (UNFCC, 1992), the Kyoto Protocol (UNFCCC, 1998a), and legislation for
renewable biofuels, sustainable feedstocks, production and environmental compliance policy
for industrial processors, etc. (Read, 2009; Cowie et al., 2012; Downie et al., 2012). Therefore
the enabling regulation sub-criterion scores a 3.
Restrictive/negative regulation?
Restrictive regulations that apply to Biochar CCS relate to land-use change, and the
production, use and conversion of sustainable biomass feedstocks. Suitable locations include
remote or under-utilised areas, or those which can benefit from soil amendment while
continuing with the existing land-use. Sufficient stocks of sustainable biomass exist in the
form of municipal, agricultural and forestry waste. The restrictive/negative regulation that
does exist is not a large barrier to technology uptake, therefore the score for
restrictive/negative regulation balances out to a neutral (2) score.
Regulatory certainty?
Industrial standards for pollution limits (e.g. emissions from contaminated waste streams,
dioxins, heavy metal and particulate emissions, air quality standards) depend on local
jurisdictions. Some regulatory bodies aim to develop a formal position on biochar regulation
and sustainable practice guidelines, e.g. the Scottish Environment Protection Agency (SEPA)
is the first regulatory agency in the UK, to authorise the manufacture and use of biochar from
waste (untreated wood waste from agriculture, horticulture and forestry) (SEPA, 2010). The
Council of Standards Australia has published an updated Standard, or quality framework,
defining processing requirements and chemical, biological and physical properties of
composts, soil conditioners and mulches to protect environment and public health (Standards
Australia, 2012). The positive moves by various regulatory bodies to provide more certainty
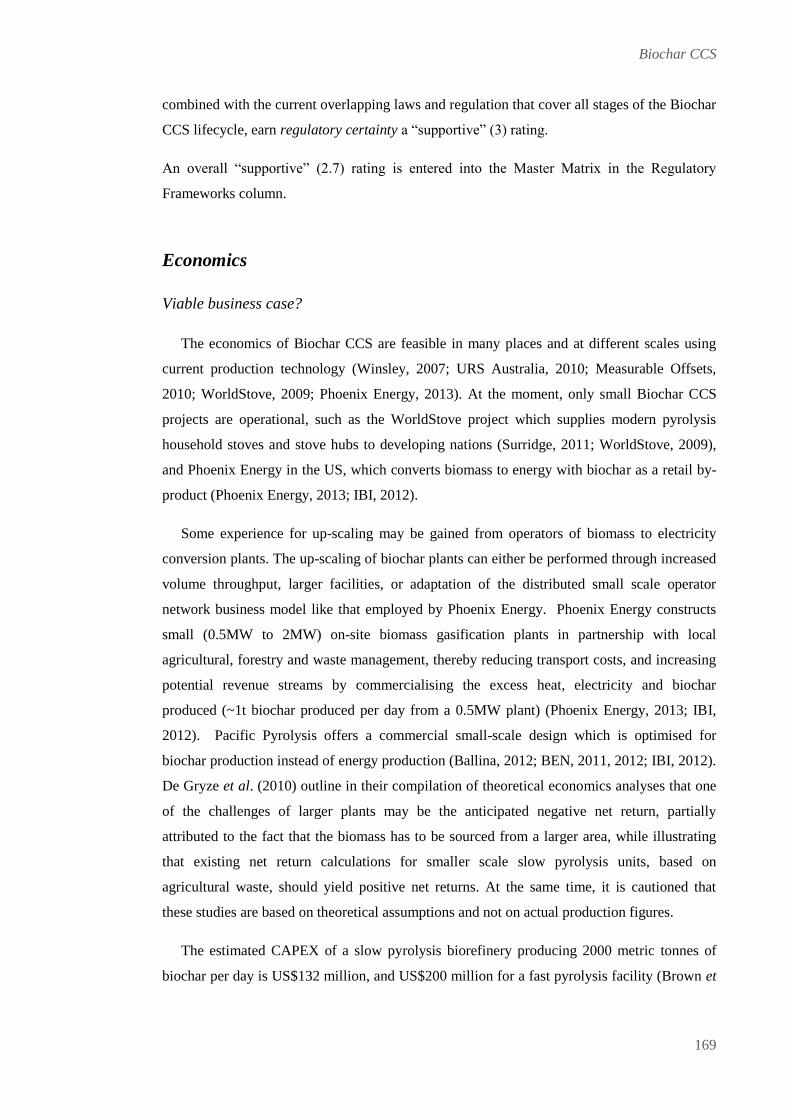
Biochar CCS
169
combined with the current overlapping laws and regulation that cover all stages of the Biochar
CCS lifecycle, earn regulatory certainty a “supportive” (3) rating.
An overall “supportive” (2.7) rating is entered into the Master Matrix in the Regulatory
Frameworks column.
Economics
Viable business case?
The economics of Biochar CCS are feasible in many places and at different scales using
current production technology (Winsley, 2007; URS Australia, 2010; Measurable Offsets,
2010; WorldStove, 2009; Phoenix Energy, 2013). At the moment, only small Biochar CCS
projects are operational, such as the WorldStove project which supplies modern pyrolysis
household stoves and stove hubs to developing nations (Surridge, 2011; WorldStove, 2009),
and Phoenix Energy in the US, which converts biomass to energy with biochar as a retail by-
product (Phoenix Energy, 2013; IBI, 2012).
Some experience for up-scaling may be gained from operators of biomass to electricity
conversion plants. The up-scaling of biochar plants can either be performed through increased
volume throughput, larger facilities, or adaptation of the distributed small scale operator
network business model like that employed by Phoenix Energy. Phoenix Energy constructs
small (0.5MW to 2MW) on-site biomass gasification plants in partnership with local
agricultural, forestry and waste management, thereby reducing transport costs, and increasing
potential revenue streams by commercialising the excess heat, electricity and biochar
produced (~1t biochar produced per day from a 0.5MW plant) (Phoenix Energy, 2013; IBI,
2012). Pacific Pyrolysis offers a commercial small-scale design which is optimised for
biochar production instead of energy production (Ballina, 2012; BEN, 2011, 2012; IBI, 2012).
De Gryze et al. (2010) outline in their compilation of theoretical economics analyses that one
of the challenges of larger plants may be the anticipated negative net return, partially
attributed to the fact that the biomass has to be sourced from a larger area, while illustrating
that existing net return calculations for smaller scale slow pyrolysis units, based on
agricultural waste, should yield positive net returns. At the same time, it is cautioned that
these studies are based on theoretical assumptions and not on actual production figures.
The estimated CAPEX of a slow pyrolysis biorefinery producing 2000 metric tonnes of
biochar per day is US$132 million, and US$200 million for a fast pyrolysis facility (Brown et

Biochar CCS
170
al., 2011), while de Gryze et al. estimate the establishment costs for a plant consuming 50kpa
to 70kpa short tons of feedstock at US$20 million to US$45 million, with an annual OPEX of
3% - 5% of the initial investment cost and biomass sourced from within a 60km radius. One of
the limitations to upscaling a project may not be the size of the conversion unit, but the ability
to source the necessary sustainable feedstocks efficiently. A distributed network of smaller
scale units may be a more efficient and profitable solution (de Gryze et al., 2010).
The average production cost of one short ton of biochar is estimated to be between US$150
and US$350 (de Gryze et al., 2010). This would place the production price within the range of
market prices which can be obtained. Biochar for specialty application like research purposes
and niche horticultural products (Sohi, 2012) has sold for US$200/ton (Miles, 2009) to
US$500 per metric tonne (The Climate Trust, 2010). Additional revenue streams through the
sale of bio oils and energy and cost savings through the use of excess heat may be achievable
(de Gryze et al., 2010). Baum and Weitner (2006) state that the production and application
costs of Biochar CCS may be fully recoverable based on increased agricultural production
yield and nitrogen fertiliser savings, making biochar affordable.
Roberts et al. (2009) state that the main costs are feedstock and pyrolysis, with the volume
and cost of delivered biomass feedstock and market prices for biochar and energy products the
most important economic constraints. Most cost savings and revenue can come through the
use of low cost waste streams as feedstock, i.e. wood, leaves, food waste, straw or manure
(Roberts et al., 2009). Agricultural residues such as corn stover (husks, stalks, leaves and cob
left after harvesting) (Figure 5.6) have high yields of energy generation and GHG reductions,
and have moderate potential to be profitable, whereas waste biomass streams such as
municipal yard waste have the greatest potential to be economically viable while still being
net energy positive and reducing GHG emissions. Other financial benefits such as tax credits
and renewable energy certificates are also available for renewable energy projects. In 2009,
The Royal Society estimated the negative emissions of bioenergy combined with CCS in
geological formations (BECCS) as an estimated 50 – 150 ppm decrease in CO2-e. A
combination of BECCS and Biochar CCS could generate numerous value streams (Read,
2009; Lehmann et al., 2006; Brown et al., 2011; Read and Lermit, 2005). The introduction of
further economic and environmental benefits could be extended into developing nations
through pyrolysis stove technology (Driver and Gaunt, 2010). For all these reasons, viable
business case earns a 3.
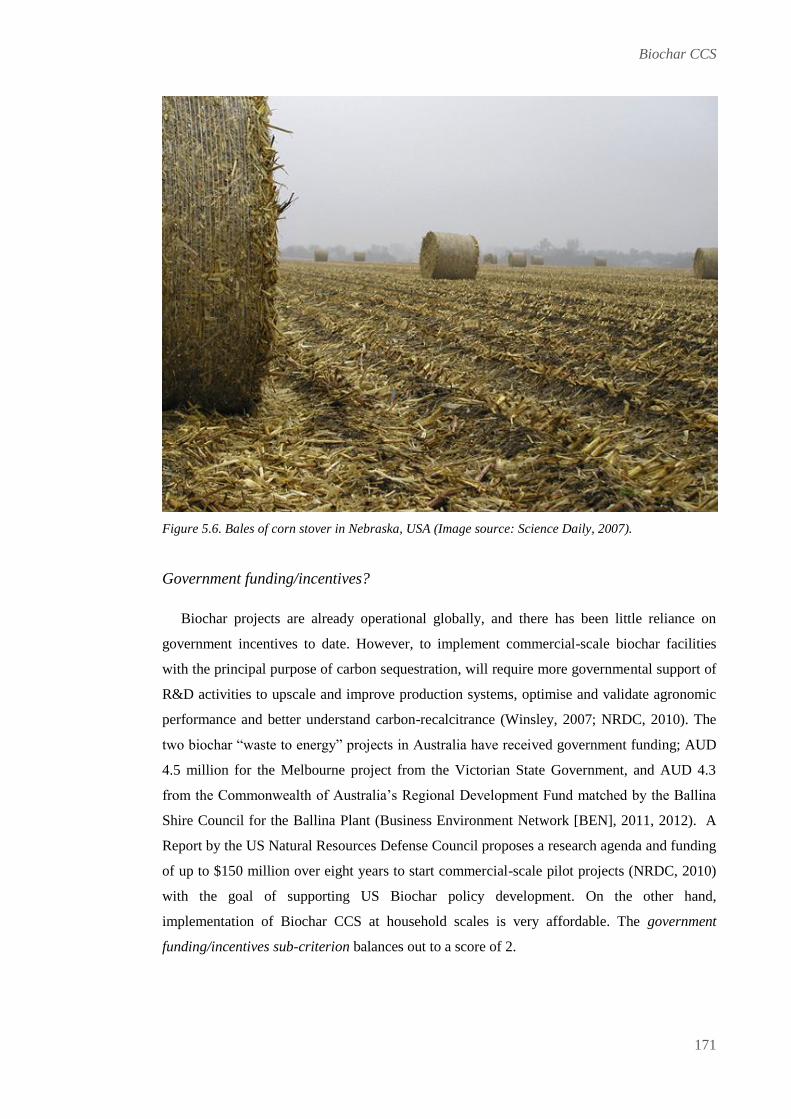
Biochar CCS
171
Figure 5.6. Bales of corn stover in Nebraska, USA (Image source: Science Daily, 2007).
Government funding/incentives?
Biochar projects are already operational globally, and there has been little reliance on
government incentives to date. However, to implement commercial-scale biochar facilities
with the principal purpose of carbon sequestration, will require more governmental support of
R&D activities to upscale and improve production systems, optimise and validate agronomic
performance and better understand carbon-recalcitrance (Winsley, 2007; NRDC, 2010). The
two biochar “waste to energy” projects in Australia have received government funding; AUD
4.5 million for the Melbourne project from the Victorian State Government, and AUD 4.3
from the Commonwealth of Australia’s Regional Development Fund matched by the Ballina
Shire Council for the Ballina Plant (Business Environment Network [BEN], 2011, 2012). A
Report by the US Natural Resources Defense Council proposes a research agenda and funding
of up to $150 million over eight years to start commercial-scale pilot projects (NRDC, 2010)
with the goal of supporting US Biochar policy development. On the other hand,
implementation of Biochar CCS at household scales is very affordable. The government
funding/incentives sub-criterion balances out to a score of 2.

Biochar CCS
172
Carbon market?
Articles 3.3 and 3.4 of the Kyoto Protocol, and Article 3.3 of the UNFCCC specifically
refer to carbon stock change in soil and biomass. The recognition of enhanced soil carbon
sequestration suggests that Biochar CCS projects should be considered eligible to generate
carbon offset credits. The additionality criteria, a measure of whether a carbon mitigation
project is additional/ incremental to a business as usual case, could be based on the type of
feedstock, location, or regulatory environment (The Climate Trust, 2010). Biochar projects
could also participate under alternative carbon credit programmes (URS Australia, 2010). For
example, the Verified Carbon Standard (VCS) (formerly known as the Voluntary Carbon
Standard), a voluntary reserve that accepts global projects and is a quality standard for the
voluntary carbon offset industry. VCS establishes auditing and MMV criteria based on Kyoto
Protocol’s Clean Development Mechanism (CDM) and ISO standards. The carbon price is
low and the market immature, but as there is currently no dependency on it, the carbon market
sub-criterion merits a rating of 3.
The overall assessment of Biochar CCS is a very positive “profitable” with an average score
of 2.7, which is entered into the Economics column of the Master Matrix.
Storage Quality
Capacity?
There are varying estimates of the potential technical global storage capacity of Biochar
CCS: e.g. 0.7 to 2.6Gtpa (Laird et al., 2009), 1.8 Gtpa CO2-e (Woolf et al., 2010); and 1.2 -
3.1Gtpa (Lal, 2011). 2.35 mt CO2-e is sequestered per metric tonne of biochar, or ~2.18mt
CO2-e after subtracting emissions from the energy penalty to produce the biochar (The
Climate Trust, 2010). McCarl et al., (2009) estimate the net balance of GHG offsets per tonne
of feedstock for fast pyrolysis at 0.823CO2-e and 1.113 CO2-e for slow pyrolysis. While
technical potential does not equate to relative utility (Levitan, 2010) with logistics and
feedstock sustainability issues, the ability to utilise feedstocks from a wide range of sources
and locations globally, including purpose-grown, landfill, and under-utilised waste biomass
(Winsley, 2007), earns a capacity rating of 3.

Biochar CCS
173
Rate?
The rate at which CO2 can be captured during photosynthetic processes depends upon
individual plant growth rates, climate, rainfall, sunlight hours, location, soil, etc. The time
required to sequester the biomass through pyrolysis ranges from one second to hours
depending on the feedstock and desired ratio of C-products (Table 4.3) (IEA Bioenergy,
2007). If sustainable waste feedstocks are used, then there is no direct dependency on the
photosynthetic cycle, and the rate for this does not have to be taken into account. Therefore, in
considering the pyrolysis rate, Biochar CCS earns a score of 3 for rate.
Duration?
Under the Kyoto Protocol, projects for Land Use, Land Use Change and Forestry
(LULUCF) must demonstrate “long-term” changes to terrestrial carbon storage and
atmospheric GHG concentrations (UNFCCC, 1998a). However, there is no consistent
definition of long-term or consensus about time frames for LULUCF projects. The 100 year
approach requires that the GHG benefits of a project, that is, the carbon stored, must be
maintained for a period of 100 years to be consistent with the Kyoto Protocol’s 100 year
reference time frame (Addendum to the Protocol, Decision 2/CP.3, paragraph 3), and its
adoption of the IPCC’s Global Warming Potentials (GWPs) (Article 5.3) for calculation of the
Absolute Global Warming Potential (AGWP) of CO2 (UNFCCC, 1998b, 2000).
Stability of the biochar depends on the pyrolysis procedure utilised, but biochar is
relatively inert, highly stable and resistant to biochemical breakdown (Lehmann et al., 2006;
Sombroek et al., 2003). It is estimated that the MRT of the stable fraction of biochar ranges
from several hundreds to a few thousand years (Lehmann et al., 2006; 2009c; The Climate
Trust, 2010; Roberts et al., 2009; de Gryze et al., 2010). The average age of black carbon
buried in deep sea sediments was found to be up to 13,900 years greater than the age of other
organic carbon (Masiello and Druffel, 1998). Further research is needed to validate and
optimise stabilisation and decomposition mechanisms of biochar in soil, but does not impact
the Duration sub-criterion which earns a 3 rating.
Biochar CCS
174
Verification?
Lehmann et al. (2006) state that the sequestered carbon amounts can be easily accounted
for and verified. Comparisons can be made between baseline measurements of water, soil and
air (NO4, CO2, CH4) with repeated measurements over time. In 2012, the IBI released the first
international Biochar Standards and Testing Guidelines. These guidelines include three test
categories; utility, toxicity, and advanced analysis and soil enrichment. The utility tests assess
the physical properties (particle size and moisture) and chemical properties of elemental
proportions. Lower values of the molar ratio of hydrogen to organic carbon indicate greater
carbon stability (IBI, 2012). The IBI is also developing a certification programme for
sustainable biochar as having met the requirements of the Biochar Standards. Verification
earns a 3.
The overall rating of Storage Quality is “high” (3) and this is entered into the Master Matrix.
Environmental Impact
Potential impact on ecosystems and/or water systems?
Biochar CCS can reduce both fertiliser manufacture and use. The microbial processes of
nitrification and denitrification in the soil are significant sources of N2O, a GHG with 298
times greater global warming potential than the equivalent mass of CO2 in the atmosphere
(IPCC, 2007; Forster et al, 2007). The manufacture of nitrogen fertiliser releases >3t CO2-e
per ton of nitrogen fertiliser produced (West and Marland, 2002). The application of biochar
to soils provides GHG mitigation benefits to N2O and CH4 as well as long-term stable soil
carbon sequestration value (Van Zweiten et al., 2009; Rondon et al., 2005). In 2008, Lehmann
et al. suggest that the carbon-cycle feedback could be reduced by the application of biochar to
soils.
Contaminants may occur from contaminated feedstocks (polychlorinated biphenyls (PCBs)
and heavy metals) or form during the pyrolysis process (dioxins and polycyclic aromatic
hydrocarbons (PAHs); however, strict sorting and control of feedstock and temperatures of
<500 °C can minimise the risk of potential soil contamination or contaminant formation
(Verheijen et al., 2009; IBI, 2012). Dioxin concentrations found in biochars have been very
low, are strongly bound and are not readily bio-available (Wilson and Reed, 2012). The
reduction of GHG emissions together with the multiple benefits of increased net primary
production from soil amendment, fertility and resilience, water retention, decreased runoff,
Biochar CCS
175
decreased fertiliser and lime use, the displacement of fossil fuels, etc. all positively impact
ecosystems and water systems, therefore the potential impact on eco- and water systems
earns a very favourable (3) rating.
Environmental footprint?
Some infrastructure for commercial scale
pyrolysis plants and storage facilities for the biomass
and biochar will be necessary at centralised
locations, such as municipal landfills. The
transportation systems and road, rail and shipping
infrastructure already exist, and mobile pyrolysis
units can be utilised for remote forestry activity for
uncommercial biomass or seasonal harvesting of
sustainable biomass on agricultural land (Winsley,
2007). The environmental footprint of one operator’s
gasification facilities converting biomass to energy
plants capable of generating 0.5MW to 2 MW is just
1250 square feet (ft2) (Phoenix Energy, 2013). One
study suggests that four typical households using 5kg
of fuel per day could sequester 1t CO2 pa by using
modern pyrolysis stoves (Figure 5.7), with the
implications of potential scale up hugely significant
as an estimated two billion people still use primitive
stoves or open fires for cooking and heating (Figure 5.8) (Anderson et al., 2010). In addition,
if municipal bio-wastes are utilised as feedstock, landfill requirements will decrease, therefore
the environmental footprint for Biochar CCS balances out to score of 2.
The overall rating for Environmental Impact is on the cut-off point between “medium” and
“high” (2.5).
.
Figure 5.7.
Example of a modern pyrolysis stove
for household use in developing non-
OECD nations (Image source:
SHALIN Finland in collaboration
with Aalto University, link).

Biochar CCS
176
Figure 5.8. Typical three-stone stove used in Kenya (Image source: SHALIN Finland in collaboration
with Aalto University, link)
5.3.1 Science and Technology: Sub-Matrix Assessment
Technology Element 1: Site Identification and Characterisation
Site identification and characterisation for Biochar CCS encompasses the logistical, socio-
economic and technical feasibility of sites for pyrolysis processing plants and to a lesser
extent the application of biochar. Ideal locations to site pyrolysis facilities would be low-value
land or co-sited with collective points with existing infrastructure of municipal or forestry and
agricultural waste products, and near to electricity lines to distribute power generated from
bioenergy. In general, public acceptance of renewable energy technologies coexists with
resistance to specific development projects in the siting of infrastructure (Owens and Driffill,
2008; van der Horst, 2007; EU DGR, 2003). Identification of suitable sites for Biochar CCS
require the identification of locations such as urban or rural collection points (e.g. municipal
landfills), or low-value land suitable for dedicated feedstock cultivation with nutrient poor
soils (Winsley, 2007). The general public, with the exception of farmers and foresters who
grant land access, will not be aware of the activities to test soils, air or water. As these groups
are the main beneficiaries of Biochar CCS through waste management of crop and forestry
residues, electricity generation and application of the biochar to enrich local soils and increase
productivity yield, limited resistance is expected. Therefore Public Acceptance earns a 3.

Biochar CCS
177
Biochar CCS activities, such as land surveying, environmental protection and baseline
testing of soil, air and water, are covered under existing rules and legislation from local
authorities, state, federal and even international bodies, therefore Regulatory Frameworks gets
a high (3) rating. The minimisation of transport costs of both the biomass as well as the end
products is desired. Land with nutrition-poor soils can be utilised so both the pyrolysis process
and end-use application of the biochar for soil amendment are in close proximity. For the
distribution and sale of excess electricity generated from the pyrolysis plant, access to nearby
power grids is required. All the tests and evaluations for these factors are very affordable and
can to a certain extent be based on public domain information, therefore Economics earns a 3
rating. The tests to measure air, water, and soil to determine suitable locations for pyrolysis
processing, and/or application of the biochar and surveys to identify suitable locations are
well-established and non-invasive (Coomes et al., 2002; Post et al., 2000; MacDicken, 1997),
therefore both Demonstrated Technical Readiness and Environmental Impact earn high (3)
scores.
The overall score of Site Identification and Characterisation is a very positive 3.
Technology Element 2: Feedstock
There are two basic types of feedstock, primary and waste. Primary feedstock refers to
purpose/dedicated crops specifically produced for conversion to biochar, and can utilise
marginal or degraded land. Waste feedstock refers to unutilised biomass, or organic matter
which would have been burnt, dumped in a landfill or left to decompose, e.g. agricultural/crop
residues, animal manures, organic municipal solid waste, forestry leavings, yard and other
urban wood waste. Waste feedstocks must be sorted to remove potential biochar
contaminants, e.g. metal, glass, sewage sludge or tyres. Sustainable feedstocks that do not
endanger food security, habitat or soil conservation are preferred (Woolf et al., 2010). There
may be competition for feedstocks as some of the wastes may have been used for other
purposes.
Waste feedstocks are preferred to primary by both the public and governments because
they do not incur emissions from land use change or energy penalty from production (NRDC,
2010). The concerns about changes in land use (e.g. pastoral to forest), and/or food crops
being replaced or cultivated as biomass for fuel, balance out to a Public Acceptance rating of
2. The cultivation of feedstocks is covered under current legislation. It is proposed that
existing schemes, such as the sustainability standards under Article 17 (6) of the EU
Biochar CCS
178
Renewable Energy Directive that recognises biofuels certified under a range of schemes,
could be utilised for sustainable biochar certification of agricultural practices to produce food
and fuel (European Parliament and the Council of the European Union [EP CEU], 2009;
Cowie et al., 2012; O’Connell et al., 2009). A sustainability framework and certification
programme, adapted from existing frameworks for bioenergy, has been proposed as one
solution to provide stakeholder confidence about sustainability practices, calculation and
verification of abatement and enable claims of legitimate offset for emissions trading schemes
(Cowie et al., 2012). Regulatory Frameworks merits a “3” score.
Costs are dependent on feedstock source and volumes, but the use of waste biomass can
keep these expenses low (Brown et al., 2011). It is proposed that only biochar projects that
use feedstocks that are unlikely to cause land-use change and are not purpose-grown should
qualify for carbon market offset credits. Urban waste aggregation at centralised collection
points offer potential revenue from tipping or disposal fees, therefore Economics scores a 3.
Feedstock source is the most important factor determining recovery rates of the initial carbon
from the biomass, ranging from 39% to 64% with the typical carbon-recovery around 50%
(Lehmann et al., 2006). The moisture content of the feedstock should be kept below 10% for
production efficiencies (Lehmann and Joseph, 2009b). Current agricultural practices and
technology are well established but further R&D efforts have to be made to optimise
feedstock production, harvesting, drying and grinding (Winsley 2007; Woolf et al., 2010). A
variety of feedstocks from different locations and climates have already been the subject of
pyrolysis production (Lehmann et al., 2006); for these reasons Demonstrated Readiness earns
a 3. Some infrastructure will be necessary for storage and handling of feedstock and biochar
storage and handling. If a centralised collection point is used, e.g. municipal landfill, these
buildings will likely be within the same facility. The landfill requirements and decomposition
of bio matter causing CH4 will decrease, therefore Environmental Impact earns a 3.
The overall score for Feedstock is a “high” 2.8.
Technology Element 3: Transportation
Transportation for Biochar CCS encompasses the collection and transfer of biomass
feedstock from various dispersed points to pyrolysis plants as well as of the carbon products
for further processing, application to soil, or distribution and sale. Biochar production
facilities are unlikely to be in close proximity to residential or environmentally sensitive areas.
Existing road and rail networks and transportation systems will be utilised, but increased

Biochar CCS
179
infrastructure usage is likely. Public Acceptance of transportation scores a “3” rating. The
transport of biomass as well as the carbon-products is already covered by existing haulage
legislation, including safe handling regulations. In Australia, charcoal is classified as
spontaneously combustible (United Nations Hazardous Goods Class 4 Division 4.2) and a
minor danger (packing group III), therefore safe handling and transportation practices are
regulated to avoid potential fire hazards (UN, 2009; Lehmann and Joseph, 2009b). This earns
the Regulatory Framework a high (3) rating.
Transportation distance differs between biochar systems, affecting cost and energy
consumption Roberts et al., 2009). Aggregation of feedstocks from multiple collection points
in urban environments can take advantage of energy sources and existing local government or
private services that aggregate, sort and pre-process the biomass. Pyrolysis plants could be
located next to waste processing plant sites, e.g. landfill/municipal dumps, to minimise
logistics and transportation costs. Aggregation of distant or widely dispersed/distributed
sources, e.g. rural farms, forest, will be more expensive. If the bioenergy is not to be sold to an
energy carrier, and only used to power the pyrolysis system, siting near power lines is not
important. The pyrolisers can be scaled with size to match locally distributed sources of
biomass and minimising transport costs, i.e. on a local scale for rural/distant locations with
processing on site or use of mobile units that rotate between sites (Badger and Fransham,
2006). Lowering the moisture content of the biomass lowers the cost of transportation per unit
of biochar and energy produced (Lehmann and Joseph, 2009b). These factors balance out in a
(2) rating for Economics.
The technology for truck transportation of biofuels, hazardous materials, and more volatile
gases is already mature. This earns Demonstrated Technical Readiness a (3) score. Very fine,
light black carbon (sub micron) dust fraction can occur during transportation or utilisation
causing biochar loss and pollution, but can be minimised or managed with storage or
application practices (NRDC, 2010; Lehmann and Joseph, 2009b). There is little or no
increased environmental footprint for transportation infrastructure but possible higher
utilisation of truck haulage and road infrastructure, therefore Environmental Impact rates a
neutral (2).
The overall score for Transportation is 2.6.

Biochar CCS
180
Technology Element 4: Conversion
Conversion refers to the transformation of biomass through pyrolysis or gasification into
biochar, synfuel or liquid biofuel. The ratio between the three depends on whether fast (high
temps >500⁰C) or slow pyrolysis (300-400 ⁰C) is used, as well as pressure, water content, and
residence time (Table 5.1). In some systems, the syngas and oil can be used as a fuel to run the
pyrolysis reaction, meaning no external energy source is required beyond the organic waste
itself. Public Acceptance is based on the analogy of biofuels as renewable energies which are
preferred by both the public and government. The pyrolysis plants can be sited at existing
collection points or in remote locations away from built up areas, thereby minimising the
NIMBY affect. In addition, the making of charcoal is familiar and one of mankind’s earliest
industrial processes (Brown, 2009; Harris, 1999), therefore, Public Acceptance earns a high
(3) score. Regulatory Frameworks scores a 3 as existing regulation covers the production of
biochar and carbon-materials through pyrolysis or gasification technologies and pollution. The
Economics of conversion scores a 3 as the current technologies are affordable and range in
scale from simple ovens/kilns to dedicated production facilities to produce specialised carbon-
products for sale or use (Brown et al., 2011; Sohi, 2012; Miles, 2009; The Climate Trust,
2010).
Conversion technologies are well-established (IEA Bioenergy, 2007) but the equipment
and processes could be optimised for low-emissions and high-yield quality biochar to
maximise soil benefits (Winsley, 2007; Brown, 2009; Demirbas and Arin, 2002; Jahirul et al.,
2012). Biochar CCS R&D efforts are based on slow pyrolysis reactor technology to optimise
production of biochar and syngas rather than bio-oils. Slow pyrolysis controlled continuous
kilns designed for the purpose of Biochar CCS are now commercially available and a pilot
demonstration has been in operation since 2006 in Sydney, New South Wales, Australia (BEN
2011, 2012; Pacific Pyrolysis, 2013). Phoenix Energy assembles its 0.5MW to 2MW biomass
gasification power plants using proven technology from well-known equipment suppliers
(Phoenix Energy, 2013)(Figure 5.9). According to de Gryze et al. (2010), the largest
pyrolysers in North America are capable of processing between 200 – 250 dry short tons of
biomass per day, with several companies developing and marketing industrial-scale
pyrolysers. Modular pyrolysis plants are designed for mobility and flexibility. They not only
convert biomass into biochar, syngas and liquid bio-oils, but also use the energy from the
syngas to power the pyrolysis reaction process (Badger and Fransham, 2006). The bio-oil can
also be used as process heat or for electricity generation. Demonstrated Readiness earns a
rating of 3.

Biochar CCS
181
Figure 5.9. 500kW biomass gasification plant in Merced, California, USA (Image source: IBI, courtesy
of Phoenix Energy, 2012).
The use of temporary mobile units reduces the environmental footprint from permanent
infrastructure and can be used in widely dispersed forest or agricultural locations with no
energy provider requirement (Badge and Fransham, 2006). Conversion of the biomass using
pyrolysis does include the potential release of GHG emissions or air pollutants, with potential
harmful emissions, e.g. dioxins causing air quality/pollutant issues if contaminated waste
feedstocks are used. This can be minimised through good management practices and is
covered under existing regulations. The balancing of these factors gives a score of 2 for
Environmental Impact.
The overall score for Conversion is “ready/short-term” (2.8).
Technology Element 5: MMV
MMV refers to the use of tools and tests to measure and monitor carbon in soils, biomass
and air, to obtain data/geochemical data (inSAR, fluid, mineralisation, air, soil sampling, etc.)
to build an accurate accounting of the stored volume of carbon and its permanence for GHG
accounting and economic purposes. Key methods to monitor carbon in soils include
biomarker analysis, chemo-thermal oxidation, chemical oxidation, thermal/optical
transmittance and reflectance, UV oxidation, thermal analysis, and infrared spectroscopy
(Manning and Lopez-Capel, 2009; de Gryze et al., 2010). Reversal of carbon sequestration
could occur through decomposition, erosion, burning, tilling, soil removal or land

Biochar CCS
182
development. If carbon offsets are claimed or sold, it is proposed that project developers must
demonstrate the carbon is still present 100 years after biochar application, as is the case for
forestry projects under the Climate Action Reserve (The Climate Trust, 2010). Two
challenges for MMV are that soil types could vary over small distances and feedstocks change
(NRDC, 2010). De Gryze et al. (2010) suggest repeat measurements at years 1, 5, 10, 20, and
50 years after the biochar is incorporated with the soil to quantify the amount of biochar
remaining in the soil. The monitoring systems could be based on the Biochar CCS life-cycle
(suitable for CDM) or more narrow definitions. The monitoring systems will be tailored for
projects based on the product boundaries and baselines: as projects will differ widely in terms
of biochar production, end-use, and impact on agricultural emissions (Gaunt and Cowie,
2009).
Public acceptance of MMV is rated a 3, as stakeholders want confidence that the carbon
remains sequestered by comparing repeated measurements of soil properties with baseline
measurements. In addition, the public wants confirmation of the associated environmental and
agricultural benefits, such as better nutrient and H2O holding capacity, less use of fertilisers,
increased crop yield, and avoided emissions of CH4, NO2, and CO2. Current legislation covers
the application and testing of biochar (NETL DOE, 2010), so Regulatory Frameworks scores
a 3. The project scale influences logistical and economic support of MMV activities. Large
projects (lifetime reductions - minimum 50,000Mt CO2-e, market-preferred >200,000Mt CO2-
e) require economies of scale to justify verification costs (The Climate Trust, 2010). Vertical
integration, where the biochar producer is also the user, is the most economically feasible
solution to account for, track and monitor where it is incorporated into soils. Smaller projects
are challenging (NRDC, 2010) but could achieve economies of scale through aggregation
(Driver and Gaunt, 2010). Economics scores an “affordable” (2) rating. The remote sensing,
laboratory and field work tools to measure and monitor carbon in biomass, atmosphere, and
soil are well established and commercially available (Coomes et al., 2002; Post et al., 2000;
MacDicken, 1997; NETL DOE, 2010), thereby Demonstrated Readiness earns as 3.
Environmental Impact scores a 3 as the tests do not create a permanent footprint.
MMV scores a “ready” (2.8) rating.

Biochar CCS
183
Summary of Science and Technology Sub-Matrix Assessment
All of the technology elements specific to Biochar CCS rate either medium (2) or high (3)
(Table 5.2) because the basic scientific and technical foundations for biochar and bioenergy
co-production have been demonstrated or are in operation in locations worldwide. R&D
activities focus on verification of the economic and agronomic benefits. The first is the
scientific validation and maximisation of the environmental and agricultural productivity
benefits and evaluation of the risks of the Biochar CCS life cycle. The second is the
optimisation of pyrolysis systems for low energy requirements, and improved efficiencies for
high yield of quality biochar, with gaseous output limited to H2O and CO2.
Table 5.2. Science and Technology Sub-Matrix Scorecard: Results of Application of Methodology to
Biochar CCS.
5.3.2 Summary of Results: Overall Technology Rating
The overall rating for Biochar CCS at 2.7 (Table 5.3) predicts a high probability of success
as a CO2 sequestration option. A significant benefit of this carbon mitigation option is the
immediate availability to apply it at scales ranging from the individual household to industrial
scale, in urban and rural regions, and in all countries.
Table 5.3. Master Matrix Scorecard: Results of Application of Methodology to Biochar CCS showing
overall technology rating.

Biochar CCS
184
Biochar CCS
185
5.4 DISCUSSION
My initial expectation of a favourable rating for Biochar CCS was upheld. The main
contributing factors to such a favourable rating are the generally high acceptance of
renewables, the multiple environmental and agricultural benefits, the relatively modest
CAPEX and OPEX, multiple income streams, the ability to be applied immediately at
different scales, and in urban and rural locations all over the world. A capacity goal of
1.8GtC-e (Woolf et al., 2010) could be achieved by not relying solely on large commercial-
scale projects, but by simultaneous deployment of projects at different scales. For example,
volumetric economies of scale by replacing inefficient traditional stoves in developing nations
with modern pyrolysis stoves (WorldStove, 2009; Surridge, 2011; Measurable Offsets, 2010),
biochar production facilities tied with energy generation (Phoenix Energy, 2013), as well as
commercial-scale operations tied with waste and landfill management (Ballina Information,
2012; BEN 2011, 2012; Pacific Pyrolysis, 2013; de Gryze et al., 2010). This score is bolstered
by the ability to refer to existing regulatory frameworks for nearly all of the sub-criteria.
Suggestions to improve uptake:
A multi-scale deployment approach:
Implementation on a household-scale for developing nations, i.e. cooking stoves
and community kilns (Ewing and Msangi, 2009; Bailis, 2009) could aid with faster
uptake while providing multiple environmental and soil amendment benefits, e.g.
increased agricultural productivity yields and soil water retention. Biochar CCS
projects utilising household stoves and stove hubs are operational in developing
nations such as Haiti, Kenya, and Indonesia. The goals of the WorldStove Five-
Step Program are not only to sequester CO2, but also to offer health, soil
conservation, and agricultural and socio-economic benefits, such as the setting up
of businesses, job creation, and certified and measurable carbon offsets (Surridge,
2011; WorldStove, 2009). There could be MMV logistics issues with such an
implementation if carbon credits are desired.
In areas where access to affordable feedstock is an issue, such as locations with
competition for biomass, an initial focus on the deployment of biomass to energy
conversion can enable more robust economic scenarios while still capturing some
of the Biochar CCS benefits. Once a predictable carbon credit market with the

Biochar CCS
186
carbon credit accountability for Biochar CCS exists and allows for improved
economic predictions, the re-tooling of the conversion facilities to optimise biochar
production could be considered.
Large-scale deployment for urban waste management using existing municipal
transportation, contractors, and landfills as centralised collection points where
infrastructure can be co-located. Additional revenues can be generated from
householder tipping fees.
The use of mobile units for more rural, forest, and seasonal feed stocks, with a
focus on undervalued biomass and waste. If more permanent facilities are
preferred, economies of scale can be achieved by sharing the CAPEX and OPEX
between a collective of district/regional growers/forestry and will also minimise
transportation costs.
Focus on the food security of developing nations. In 2011, Lal suggests that adoption
of Biochar CCS and other soil conservation and agricultural practices in developing
countries could increase the carbon pool in the root zone by 1 tpa, thereby increasing
crop yield by 24 - 32 million tpa for food grains and 6-10 million tpa for roots and
tubers. Further research is needed to verify the different plant responses to different
biochars under varying soil conditions (Waters et al., 2011; Winsley, 2007). The
application of biochar to nutrient-poor soil, produced by individual household
cooking stoves using the latest pyrolysis techniques, will help with food security
through soil enrichment/amendment, as well as offsetting atmospheric GHG.
Regulation and logistics of power grids must be supportive of electricity generation from
dispersed sites.
Economic values need to be assigned to the environmental benefits of Biochar CCS to
encourage the technology’s uptake, i.e. soil carbon sequestration, reduced GHG
emissions, and reduced nitrate leaching into waterways, etc. (Winsley, 2007).
More governmental and international body funding to support:
R&D efforts to validate and optimise the environmental and agricultural benefits
of Biochar CCS.
Demonstration projects of the Biochar CCS life cycle at different scales,
especially commercial-scale.
Biochar CCS
187
5.5 CONCLUSIONS
As a renewable carbon neutral/negative mitigation solution, Biochar CCS represents
significant potential to sequester CO2 at the volumes needed to achieve atmospheric GHG
targets through deployment at both household and commercial-scales. Using sustainable
feedstocks, Biochar CCS has the potential to offset 12% current anthropogenic CO2
emissions, or 1.8Gt CO2-e pa of the 15.4 Gtpa emitted annually in comparison to 10% for
bioenergy (Woolf et al., 2010). Simultaneously, it can provide multiple economic and
environmental benefits: food security, soil enrichment, waste and environmental
management, etc. The technology is proven, affordable and can be applied immediately
worldwide in a variety of locations at scales ranging from the individual household to
industrial scale. Commercial-scale demonstration projects (>500 Mtpa) would assist in
technology uptake. There are revenue streams from the biochar, energy products and
specialised high value commodities. R&D efforts focus on validating the environmental and
agricultural benefits, as well as optimising pyrolysis systems. More field and industrial trials
are needed to establish long-term effects. The main issue is the sustainability of feedstocks,
but lessons have been learned from first-generation biofuels to ensure the technology
elements of the Biochar CCS life cycle are applied properly with sustainability protocols and
certification. Biochar CCS is one of the few technologies to address climate change that
creates net economic as well as environmental benefits with low risk.

Biochar CCS
188

Biochar CCS
189
REFERENCES
Amonette, J.E. and Joseph, S. (2009), Characteristics of Biochar: Microchemical Properties: In
Biochar for Environmental Management: Science and Technology, [Lehmann, J., and Joseph, S.
(Eds.)], Earthscan, London, United Kingdom, 3, 33-52.
Anderson, P., Taylor, P., and Wever, P. (2010), CHAB Micro‐Gasification for 1GtCO2/yr
Mitigation‐Sequestration: Presented at IBI 2010, September 12 –15, 2010, Rio de Janeiro, Brazil.
Badger, P.C.and Fransham, P. (2006), Use of mobile fast pyrolysis plants to densify biomass and
reduce biomass handling costs – A preliminary assessment: Biomass Bioenergy, 30, 4, 321-325.
Bailis, R. (2009), Modelling climate change mitigation from alternative methods of charcoal production
in Kenya: Biomass Bioenergy , 33, 1491-1502.
Ballina Information (2012), Ballina gets $8.5 biochar venture: Ballina Information, 14 June 2012.
http://www.ballina.info/blog/2012/06/13/ballina-gets-8-5m-biochar-venture/ (accessed 9 February
2013).
Baum, E., and Weitner, S. (2006), Biochar application on soils and cellolosic ethanol production:
Clean Air Task Force, Washington.
Business Environment Network [BEN] (2011), Pac Pyro bring WtE to Melbourne: Business
Environment Network, 6 September 2011. http://ben-
global.com/storyview.asp?storyID=9586427§ion=Advanced+Technologies§ionsource=s14
50114#.UWTt4Mqre3M (accessed 9 February 2013).
Business Environment Network [BEN] (2012), $4.3m brings second Pac Pyro plant closer: Business
Environment Network, 12 June 2012. http://www.ben-
global.com/storyview.asp?storyID=9588438§ion=Advanced+Technologies§ionsource=s14
50114#.UWTsxcqre3M (accessed 9 February 2013).
Brown, R. (2009), Biochar Production Technology: In Biochar for Environmental Management:
Science and Technology, [Lehmann, J., and Joseph, S. (Eds.)], Earthscan, London, United Kingdom,
8, 127-146.
Brown, T.R., Wright, M.M., and Brown, R.C. (2011), Estimating profitability of two biochar
production scenarios: slow pyrolysis vs fast pyrolysis: Biofuels, Bioproducts and Biorefining, 5, 1,
54-68.

Biochar CCS
190
Coomes, D.A., Allen, R.B., Scott, N.A., Goulding, C., and Beets, P. (2002), Designing systems to
monitor carbon stocks in forests and shrublands: Forest Ecology and Management, 164, 1, 89-108.
Cowie, A.L., Downie, A.E., George, B.H., Singh, B.P., Van Zwieten, L., and O'Connell, D. (2012), Is
sustainability certification for biochar the answer to environmental risks?: Pesquisa Agropecuária
Brasileira, 47, 5, 637-648.
De Gryze, S., Cullen, M., Durschinger, L., Lehmann, J., Bluhm, D., Six, J. and Suddick, E. (2010),
Evaluation of the Opportunities for Generating Carbon Offsets from Soil Sequestration of Biochar:
An issues paper commissioned by the Climate Action Reserve.
http://www.climateactionreserve.org/wp-
content/uploads/2009/03/Soil_Sequestration_Biochar_Issue_Paper1.pdf (accessed 23 February
2013).
Demirbas, A., and Arin, G. (2002), An overview of biomass pyrolysis: Energy Sources, 24, 5, 471-
482.
Downie, A., Munroe, P., Cowie, A., Van Zwieten, L., and Lau, D. (2012), Biochar as a geoengineering
climate solution: Hazard identification and risk management: Critical reviews in environmental
science and technology 42, 3, 225-250.
Driver, K., and Gaunt, J. (2010), Bringing Biochar Projects into the Carbon Marketplace: An
introduction to carbon policy and markets, project design, and implications for biochar protocols.
http://www.biocharprotocol.com/sg_userfiles/policy_primer.pdf (accessed 24 January 2013).
Ewing, M., and Msangi, S. (2009), Biofuels production in developing countries: assessing tradeoffs in
welfare and food security: Environmental Science and Policy, 12, 520-528.
European Commission. Directorate General for Research [EU DGR] (2003), Energy: issues,
options and technologies, science and society, 20624 [European Opinion Research Group (Ed.)]:
European Commission.
Food and Agriculture Organisation [FAO] (1983), Simple technologies for charcoal Making: FAO
Forestry Paper 41: Food and Agriculture Organisation of the United Nations, Rome, Italy.
Forster, P., Ramaswamy, V., Artaxo, P., Berstsen, T., Betts, R., Fahey, D.W., Haywood, J., Lean, J.,
Lowe, D.C., Myhre, G., Nganga, J., Prinn, R., Raga, G.M.S., and Van Dorland, R. (2007), Changes
in atmospheric constitutents and in radiative forcing: In Climate change 2007: The physical science
basis, [Solomon S., Qin, D., Manning M., et al (eds.)], Contribution of working group I to the fourth
assessment report of the Intergovernmental Panel on Climate Change: Cambridge University Press,
Cambridge, United Kingdom, 129-234.
Biochar CCS
191
Fowles, M. (2007), Black carbon sequestration as an alternative to bioenergy: Biomass and Bioenergy,
31, 426–432.
Gaunt, J. and Cowie, A. (2009), Biochar, greenhouse gas accounting and emissions trading: In
Biochar for Environmental Management: Science and Technology, [Lehmann, J., and Joseph, S.
(Eds.)], Earthscan, London, United Kingdom, 11, 317-340.
Glaser, B., Haumaier, L., Guggenberger, G. and Zech, W. (2001), The “Terra Preta” phenomenon: A
model for sustainable agriculture in the humid tropics: Naturwissenschaften, 88, 37-41.
Harris, P. (1999), On charcoal: Interdisciplinary Science Reviews, 24, 4, 301-316.
International Biochar Initiative [IBI] (2012), Standardized Product Definition and Product Testing
Guidelines for Biochar That Is Used in Soil. http://www.biochar-
international.org/sites/default/files/Guidelines_for_Biochar_That_Is_Used_in_Soil_Final.pdf
(accessed 23 January 2013).
International Biochar Initiative [IBI] (2012), Phoenix Energy’s business model: Building small
profitable plants: [in September 2012 newsletter]. http://www.biochar-
international.org/profile/Phoenix_Energy (accessed 24 April 2013).
International Energy Agency Bioenergy [IEA Bioenergy] (2007), Biomass Pyrolysis: IEA
Bioenergy [Bridgwater, T]: Aston University, United Kingdom, T34:2007:01.
Intergovernmental Panel on Climate Change [IPCC] (2000), Land Use, Land Use Change, and
Forestry,: A Special Report: Intergovernmental Panel on Climate Change, Cambridge University
Press, Cambridge and New York.
Intergovernmental Panel of Climate Change [IPCC] (2007), Climate Change 2007: The Physical
Science Basis: Contribution of Working Group I to the Fourth Assessment Report of the
Intergovernmental Panel on Climate Change, [Solomon, S., Qin, D., Manning, M., Marquis, M.,
Averyt, K., Tignor, M. M. B., Miller Jr., H.L., and Chen, Z.], Cambridge University Press,
Cambridge, UK and New York, NY, USA.
Ipsos-MORI (2010), Experiment Earth: Report on a Public Dialogue on Geoengineering: Natural
Environment Research Council, Swindon, United Kingdom.
www.nerc.ac.uk/about/consult/geoengineering-dialogue-final-report.pdf (accessed 21 February
2013).
Biochar CCS
192
Itaoka, K., Saito, A., Paukovic, M., de Best-Waldhober, M., Dowd, A-M., Jeanneret, T., Ashworth, P.
and James, M. (2012), Understanding how Individuals Perceive Carbon Dioxide: Implications for
Acceptance of Carbon Dioxide Capture and Storage: CSIRO, Report EP 118160, Australia.
Jahirul, M. I., Rasul, M. G., Chowdhury, A. A., and Ashwath, N. (2012), Biofuels production through
biomass pyrolysis—A technological review: Energies, 5, 12, 4952-5001.
Laird, D.A. (2008), The charcoal vision: A win-win-win scenario for simultaneously producing
bioenergy, permanently sequestering carbon, while improving soil and water quality: Agronomy
Journal, 100, (1) 178 - 181.
Laird, D.A., Brown, R.C., Amonette, J.E., Lehmann, J. (2009), Review of the pyrolysis platform for
coproducing bio-oil and biochar: Biofuels, Bioproducts and Biorefining, 3, 547-562.
Lal, R. (2004), Soil carbon sequestration impacts on global climate change and food security: Science,
304, 5677, 1623-1627.
Lal, R. (2011), Sequestering carbon in soils of agro-ecosystems: Food Policy, 36, S33-S39.
Lehmann, J., Gaunt, J. and Rondon, M. (2006), Biochar sequestration in terrestrial ecosystems – a
review: Mitigation and Adaptation Strategies for Global Change, 11, 403-427.
Lehmann, J., Skjemstad, J., Sohi, S., Carter, J., Barson, M., Falloon, P.,Coleman, K.,Woodbury, P. and
Krull, E. (2008), Australian climate–carbon cycle feedback reduced by soil black carbon: Nature
Geoscience, 1, 832 – 835.
Lehmann, J., and Joseph, S., (2009a), Biochar for Environmental Management: An Introduction: In
Biochar for Environmental Management: Science and Technology, [Lehmann, J., and Joseph, S.
(Eds.)], Earthscan, London, United Kingdom, 1, 1-12.
Lehmann, J., and Joseph, S., (2009b), Biochar Systems: In Biochar for Environmental Management:
Science and Technology, [Lehmann, J., and Joseph, S. (Eds.)], Earthscan, London, United Kingdom,
9, 147-168.
Lehmann, J., Czimczik, C., Laird, D., and Sohi, S. (2009c), Stability of Biochar in the Soil: In Biochar
for Environmental Management: Science and Technology, [Lehmann, J., and Joseph, S. (Eds.)],
Earthscan, London, United Kingdom, 11, 183-205.
Levitan, D. (2010), Refilling the carbon sink: Biochar’s potential and pitfalls: Yale Environment 360.
http://e360.yale.edu/feature/refilling_the_carbon_sink_biochars_potential_and_pitfalls/2349/
(accessed 25 January 2013).

Biochar CCS
193
Liang, B., Lehmann, J., Soloman, D., Kinyangi, J., Grossman, J., O’Neill, B., Skjemstad, J.O., Thies,
J., Luizão, F.J., Petersen, J., and Neves, E.G. (2006), Black carbon increases cation exchange
capacity in soils: Soil Science Society of America Journal, 17, 69-74.
MacDicken, K. G. (1997), A Guide to Monitoring Carbon Storage in Forestry and Agroforestry
Projects: Winrock International Institute for Agricultural Development, Arlington, VA, USA.
Malkow, T. (2004), Novel and innovative pyrolysis and gasification technologies for energy efficient
and environmentally sound MSW disposal: Waste Management, 24, 53–79.
Manning, D.A.C. and Lopez-Capel, E. (2009), Test Procedures for Determining the Quantity of
Biochar within Soils: In Biochar for Environmental Management: Science and Technology,
[Lehmann, J., and Joseph, S. (Eds.)], Earthscan, London, United Kingdom, 17, 301-315.
Marland, G., Fruit, K., and Sedjo, R. (2001), Accounting for sequestered carbon: the question of
permanence: Environmental Science & Policy, 4, 6, 259-268.
McCarl, B.A., Peacocke, C., Chrisman, R., Kung. C.C. and Sands, R.D. (2009), Economics of Biochar
Production, Utilization and Greenhouse Gas Offsets: In Biochar for Environmental Management:
Science and Technology, [Lehmann, J., and Joseph, S. (Eds.)], Earthscan, London, UK, 19, 341-
357.
Measurable Offsets (2010), WorldStove certified as carbon offset: WorldStove’s five-step program
and the LuciaStove are now a fully certified carbon sequestration method: Measureable Offsets.
http://measurableoffsets.com/certified.html (accessed 24 April 2013).
Miles, T. (2009), The Economics of Biochar Production: Presentation to the Pacific Northwest Biochar
Association, Richland, Washington, USA.
http://trmiles.com/Presentations/Biochar/TRMiles%2005%2020%2009%20PNWBiochar.pdf
(accessed 25 January 2013).
Moscowitz, C.M. (1978), Source Assessment: Charcoal Manufacturing - State of the Art: EPA-600/2–
78-004z: US Environmental Protection Agency, Cincinnati, OH, USA.
Müller, A., Schmidhuber, J., Hoogeveen, J., and Steduto, P. (2008), Some insights in the effect of
growing bio-energy demand on global food security and natural resources: Water Policy, 10, 83-84.
Natural Resources Defense Council [NRDC] (2010), Biochar: Assessing the Promise and Risks to
Guide U.S. Policy, NRDC Issue Paper November 2010, New York, NY, USA.
Biochar CCS
194
National Energy Technology Laboratory, Department of Energy [NETL DOE] (2010), Terrestrial
Sequestration of Carbon Dioxide: National Energy Technology Laboratory (NETL), Department of
Energy (DOE). http://www.netl.doe.gov/technologies/carbon_seq/refshelf/BPM_Terrestrial.pdf
(accessed 25 April 2013).
Neves, E.G., Petersen, J.B., Bartone, R.N. and Silva, C.A.D. (2003), Historical and socio-cultural
origins of Amazonian Dark Earths: In Amazonian Dark Earths: Origin, Properties, Management,
[Lehmann, J., Kern, D.C., Glaser, B, and Woods, W.I. (Eds.)]: Kluwer Academic Publishers,
Dordrecht, The Netherlands, 29-50.
O’Connell, D., Braid, A., Raison, J., Handberg, K., Cowie, A., Rodriguez, L. and George, B. (2009),
Sustainable Production of Bioenergy: A review of global bioenergy sustainability frameworks and
assessment systems: Rural Industries Research and Development Corporation, Barton, Australia.
Owens, S., and Driffill, L. (2008), How to change attitudes and behaviours in the context of energy:
Energy Policy, 36, 4412–4418.
Pacific Pyrolysis (2013), Technology. http://pacificpyrolysis.com/technology.html (accessed 1 March
2013).
Phoenix Energy (2013), Onsite biomass gasification plants. http://www.phoenixenergy.net/powerplan
(accessed 24 April 2013).
Post, W. M., Izaurralde, R. C., Mann, L. K., and Bliss, N. (2000), Monitoring and verifying changes of
organic carbon in soil: Climatic Change, 51, 1, 73-99.
Read, P. and Lermit, J. (2005), Bio-energy with carbon storage (BECS): A sequential decision
approach to the threat of abrupt climate change: Energy, 30, 2654–2671.
Read, P. (2009), Policy to Address the Threat of Dangerous climate Change: A Leading Role for
Biochar: In Biochar for Environmental Management: Science and Technology, [Lehmann, J., and
Joseph, S. (Eds.)], Earthscan, London, United Kingdom, 8, 127-146.
Roberts, K.G., Gloy, B.A., Joseph, S., Scott, N.R., and Lehmann, J. (2009), Life cycle assessment of
biochar systems: Estimating the energetic, economic, and climate change potential: Environmental
Science and Technology, 44, 2, 827-833.
Rondon, M., Ramirez, J. A., and Lehmann, J. (2005), Charcoal additions reduce net emissions of
greenhouse gases to the atmosphere: in Proceedings of the 3rd USDA Symposium on Greenhouse
Gases and Carbon Sequestration in Agriculture and Forestry, 21-24.

Biochar CCS
195
Scottish Environmental Protection Agency [SEPA] (2012), Position Statement – Manufacture and
Use of Biochar from Waste.
http://search.sepa.org.uk/sepa/C=eJwdy9kNgDAMBNEthgKgImSSFURKHGMDonyOz3nS7FhKT
5s4KqhQBE1gW1ceJWFEZWuCCWLm*X4hUoPyomO4LeYqusa3*kWVpTLj8JOfzC65nPFuD!9
MIeY_?action=previewandq=biocharandpreviewindex=0andurl=http%3a%2f%2fwww.sepa.org.uk
%2fwaste%2fwaste_regulation%2fguidance__position_statements.aspx (accessed 21 February
2013).
Sohi, S.P. (2012), Carbon storage with benefits: Science, 338, 6110, 1034-1035.
Sombroek, W., Ruivo, M.L., Fearnside, P.M., Glaser, B., and Lehman, J. (2003), Amazonian Dark
Earths as carbon stores and sinks: In Amazonian Dark Earths: Origin, Properties,Management,
[Lehmann, J., Kern, D.C., Glaser, B. and Woods W.I. (Eds)], Kluwer Academic Publishers,
Dordrecht, Netherlands, 7, 125-139.
Standards Australia (2012), Australian Standard AS-4454 (2012) Composts, Soil Conditioners and
Mulches: Standards Australia Limited, Sydney, NSW, Australia.
Surridge, T.M. (2011), The WorldStove’s Five-Step Program’s Social Value Creation: Copenhagen
Business School. http://worldstove.com/wp-content/uploads/download/research_paper.pdf
(accessed 25 April 2013).
The Climate Trust (2010), Carbon Market Investment Criteria for Biochar Projects: Final Report
prepared for the California Energy Commission, [Weisberg, P., Delaney. M. , and Hawkes, J. (main
authors)]: CEC-500-02-004, CA, USA.
The Royal Society (2009), Geoengineering the Climate: Science, Governance and Uncertainty: The
Royal Society, [Chairman: Shepherd, J. G.], RS Policy document 10/09, London, UK.
United Nations Framework Convention on Climate Change [UNFCCC] (1992), United Nations
Framework Convention on Climate Change.
http://unfccc.int/files/essential_background/background_publications_htmlpdf/application/pdf/conv
eng.pdf (accessed 21 February 2013).
United Nations Framework Convention on Climate Change [UNFCCC] (1998a), Kyoto Protocol to
the United Nations Framework Convention on Climate Change.
http://unfccc.int/resource/docs/convkp/kpeng.pdf (accessed 31 August 2011).

Biochar CCS
196
United Nations Framework Convention on Climate Change [UNFCCC] (1998b), Report of the
Conference of the Parties on its Third Session, held at Kyoto from 1 to 11 December 1997:
Addendum: Part Two: Action Taken by the Conference of the Parties at its Third Session.
http://unfccc.int/resource/docs/cop3/07a01.pdf#page=31 (accessed 26 April 2013).
United Nations Framework Convention on Climate Change [UNFCCC] (2000), 5.3.4 Project
Duration: In IPCC Special Report on Land Use, Land Use Change and Forestry.
http://www.grida.no/publications/other/ipcc_sr/?src=/climate/ipcc/land_use/267.htm (accessed 26
April 2013).
United Nations [UN] (2009), Transport of Dangerous Goods: Model Regulations Volume 1.
http://www.unece.org/fileadmin/DAM/trans/danger/publi/unrec/rev16/English/Volume1.pdf
(accessed 26 February 2013).
URS Australia (2010), Pre-Feasibility Assessment of a Thermal Conversion Facility for the Australian
Capital Territory: Final Report prepared for the Department of the Environment, Climate Change,
Energy and Water.
http://www.environment.act.gov.au/__data/assets/pdf_file/0012/210504/URS_thermal-conversion-
technologies_Final.pdf (accessed 10 February 2013).
Verheijen, F.G.A., Jeffery, S., Bastos, A.C., van der Velde, M., and Diafas, I. (2009), Biochar
Application to Soils - A Critical Scientific Review of Effects on Soil Properties, Processes and
Functions: EUR 24099 EN, Office for the Official Publications of the European Communities,
Luxembourg.
Waters, D., Zwieten, L., Singh, B. P., Downie, A., Cowie, A. L., and Lehmann, J. (2011), Biochar in
soil for climate change mitigation and adaptation: In Soil Health and Climate Change: Springer
Berlin Heidelberg, 15, 345-368.
West, T.O. and Marland, G. (2002), A synthesis of carbon sequestration, carbon emissions, and net
carbon flux in agriculture: comparing tillage practices in the United States, Agriculture Ecosystems
and Environment, 91, 217-232.
Whitman, T. Scholz, S.M. and Lehmann, J. (2010), Biochar projects for mitigating climate change: An
investigation of critical methodology issues of carbon accounting: Carbon Management , 1, 1, 89 -
107.
Wilson, K., and Reed, D. (2012), Implications and Risks of Potential Dioxin Presence in Biochar:
White Paper for the International Biochar Institute. http://www.biochar-
international.org/sites/default/files/IBI_White_Paper-
Implications_of_Potential_%20Dioxin_in_Biochar.pdf (accessed 13 March 2013).

Biochar CCS
197
Winsley, P. (2007), Biochar and bioenergy production for climate change mitigation: New Zealand
Science Review, 64, 1, 5-10.
Woolf, D., Amonette, J.E., Street-Perrott, F.A., Lehmann, J., and Joseph, S. (2010), Sustainable
biochar to mitigate global climate change: Nature Communications: 1, 56, 1-9.
WorldStove (2009), WorldStove Five-Step Program: A Five-Step Program to Reduce GHG Emissions,
Conserve Fuelwood, and bring Industry to Developing Nations: WorldStove.
http://worldstove.com/wp-content/uploads/download/five_step.pdf (accessed 24 April 2013).

Discussion and Conclusions
198
Discussion and Conclusions
199
CHAPTER 6
DISCUSSION AND CONCLUSIONS
OVERVIEW
This chapter reviews the applicability and challenges in developing the methodology,
potential modifications for specific scenarios and general improvements which could be made.
I discuss the outcome of the analysis of Geosequestration, Algae CCS and Biochar CCS, the
three carbon capture and sequestration (CCS) technologies to which the methodology is
applied, and the impact for a portfolio management approach. I finish the chapter with my
conclusions.
6.1 DISCUSSION
Methodology
The methodology provides a standardised format for decision makers to assess CCS
technologies from different business, legal, social, scientific and engineering disciplines. It is
intended as a first pass risk assessment and big picture comparison of the current status of
alternative carbon sequestration options for the purpose of a carbon management
strategy/portfolio. CCS technologies to suit corporate strategy, situations or regions can be
identified that represent the lowest risk, and an understanding of the main challenges which
the various technologies may face can be gained. While the methodology was applied in this
thesis to a global comparison of various available technologies, it can also be applied to a
portfolio of projects within a given carbon sequestration technology class.
The first pass evaluation of a portfolio by utilising this methodology will highlight the
strengths of a CCS technology, and also single out areas with the need for further
improvements or a more in-depth analysis. At the current stage, with the methodology applied
to three CCS technologies, the outcome of the assessment is in line with the evaluation by
published sources (ZEP, 2012; US DOE, 2010; SBC Energy Institute, 2012, 2013; NNFCC,
Discussion and Conclusions
200
2012; IEA, 2011; IPCC, 2011; Waters et al., 2011; NRDC, 2010; Downie et al., 2012; Global
CCS Institute, 2012). The overall methodology framework has been designed for a high level of
flexibility to allow for easy modification to account for technology progress, increased amount
of public domain reference data, and the impact of recent events.
Currently, the methodology ranking system is based on a qualitative assessment of sub-
criteria to establish a quantitative score for each of the evaluation criterion. This approach was
used to allow for the assessment of both quantitative and qualitative data under one rating
system. An additional challenge was the diversity of influence factors which ranged from the
purely technical to socio-economical. This complicated the definition of cut-off points in the
form of numerical values. Even though purely technical sub-criteria like Storage Capacity
suggest that a hard cut-off point could be established, the influence of economic parameters and
social constraints to establish the actual available capacity, as well as the immature state of
some technologies with wide ranging estimates, complicate this significantly. To address this
issue, I broke down each of the evaluation criteria into sub-criteria, defined by assessing a very
narrow topic. Besides reducing the user bias to some extent by providing a guideline and
framework for the assessment, it also allows for introduction of hard cut-off limits at a low-
level, thereby providing flexibility in the adaptation.
This approach was calibrated and tested with Geosequestration and proved to be a workable
solution. A challenge for the end-user which may arise from this approach is the risk of double-
dipping, as factors like Regulatory Framework or Economics are assessed at two different
levels. They represent at one level the global view for the given Geosequestration technology in
the form of an evaluation criterion, but are also assessed at a lower level, specifically for a given
element in the Technology Sub-Matrix. To prevent double-dipping, assigning the same score on
both levels, will require some discipline from the end user. For this reason, it is suggested to
justify assigned scores with case studies where available.
While I aim to provide a global view of the analysed technologies, a bias towards
experiences in certain geographical areas exists due to the majority of projects being located
there. Therefore offshore Geosequestration reviews as an option with very limited public
opposition, but the technology is at the current time only deployed in one country, Norway, and
at an advanced stage of implementation in just another one, Australia. Similar region-specific
bias can be found for other regions due to their character of being a research hub. I attempt to
reflect this in my analysis by analysing overall worldwide trends. A separate approach if
sufficient case studies are available may be the use of an average of the technology score for
each geographic region, thereby to some extent suppressing the extreme project density bias.

Discussion and Conclusions
201
In assessing Algae CCS and Biochar CCS, very limited public domain information is
available for certain evaluation criteria and no case studies at commercial scale could be
identified. For these technologies, I was required to develop expectation scenarios for the
calibration stage of the methodology to assess the applicability of the same and iterate for model
updates when necessary. This can have introduced a positive or negative bias towards the
technology due to the limited number of references on which the expectation scenario was
based. As more information and demonstration projects are published, the relevance of the
evaluation criteria in their current form should be reviewed. For the technology analysis, I use
analogues in cases where no public domain information is available to evaluate the sub-criteria.
If in-house experience or confidential data is available to the end user, a review of the score may
be appropriate. As the framework and rating system are designed for easy update and revision,
this can be achieved without a significant resource demand.
Future improvements to the methodology could be introduced through a larger dynamic
range of the rating scale. While this may not be relevant for the current global overview, the
application to a portfolio of projects within the same technology class may require a more
detailed rating to highlight the benefits of one project over the other. A further suggestion would
be to introduce weights to account for region specific or corporate strategy specific emphasis.
At the current stage, all the evaluation criteria are equally weighted. For example, a heavier
weighting can be applied to the evaluation criterion of Public Acceptance when assessing
Geosequestration projects in tightly populated areas where policy makers are very receptive to
public opinion. This would be the case in countries, such as the Netherlands, where a strong
negative perception of onshore storage of carbon dioxide (CO2) in geological formations exists
and has led to delays or cancellation of projects (Kuijper, 2011; Reuters, 2011). This risk would
be more accurately reflected by a higher Public Acceptance weight for a project in the
Netherlands in comparison to more accepting jurisdictions where industrial development may
trump public concerns. Similarly, a low Environmental Impact score from infrastructure
footprint should have a much higher weight in environmentally or culturally sensitive areas
where planning permissions are more difficult to obtain than in a location where such issues will
not be encountered.
If it is the case that some of the criteria become obsolete or of minor global importance, the
methodology framework should be reviewed. On a global scale, this may happen if a unified
global Regulatory Framework is introduced under which project operators can plan and operate.
This may already be the case when assessing a project portfolio within the same jurisdiction. In
this situation, a differentiation of projects by the Regulatory Framework evaluation criteria may
not be relevant. On a global scale, a fully-fledged review of the methodology would be

Discussion and Conclusions
202
recommended, whereas for the more local scenario, the weighting scheme may provide a more
suitable alternative to modifying the methodology with the respective evaluation criteria being
zero-weighted.
Further validation of the methodology should be performed by applying it to a larger number
of CCS options to ensure that no bias towards positive or neutral outcomes was introduced, and
that true negative outcomes exist as the three analysed technologies yielded only neutral and
positive outcomes. Another improvement could be to analyse available projects with statistical
measures to provide harder cut-off criteria for some or all of the evaluation criteria, thereby
addressing some of the issues of potential user bias in the outcome which currently exists.
While statistical metrics were originally intended as part of the rating system, the dispersed
information available for the best documented technology, Geosequestration, and the limited
documentation and lack of case studies for all other technologies in the public domain, made
this approach unfeasible at the current time.
CCS Technology Comparisons
In the following, I discuss the outcome of the comparative analysis of the three CCS
technologies to which the methodology was applied. The technologies were selected, based on a
review of a diverse range of proposed CCS technologies, and it was decided to limit the analysis
to technologies at a relatively advanced stage to ensure at least a minimum amount of public
documentation exists. The overall technology ratings, based on the current status quo as
documented, range from a medium probability of success (2) for Algae CCS, medium-high
(2.3) for Geosequestration, to Biochar CCS with a high probability of success (2.7) as detailed
in Table 6.1. The reason for the difference in rating between Biochar CCS and
Geosequestration, a technology with significant worldwide effort and existing case studies,
becomes more apparent when I contrast the technologies across the evaluation criteria. This will
also highlight why Algae CCS is scoring significantly lower than the other two technologies.
All three analysed technologies share a NIMBY attitude towards the associated infrastructure
developments which are needed, but the association of Geosequestration with the extraction
industry, the additional concerns regarding health and environmental risks, and the potential risk
of lowered property values and damage due to active physical activities like drilling and
injection, negatively impact the attitude about this technology. Biochar CCS and Algae CCS
benefit from their perception as more natural processes with the same biological basis as the
positively-perceived forestation option, while the scientific concepts behind Geosequestration

Discussion and Conclusions
203
are generally not widely known by the public. In addition, the public and political attitude
towards carbon neutral/negative bio energy from renewable biomass is generally more positive.
This all results in a markedly lower Public Acceptance score for Geosequestration when
compared to the other two technologies and makes this one of the major barriers of adoption for
Geosequestration.
For all three technologies, a consistent regulatory framework is lacking, resulting in the
Regulatory Framework score being determined by how well existing regulations can be applied
or amended for these technologies. To a large extent, Algae CCS and Biochar CCS benefit from
coverage of their activities under various other regulations. This is not the case for
Geosequestration, especially when it comes to issues like cross-border transportation and
liability transfer which strongly impact the risk profile of a project. Additional negative
regulations, restricting access to onshore storage sites, further exacerbate this issue. While
government incentives are available for all of the CCS technologies, Biochar and Algae CCS
already benefit from mandates with regards to biofuel and bioenergy usage, while
Geosequestration has currently no consistent mandatory requirement. This has significant
impact on the long term economics of such a project. While a more unified regulatory
framework would benefit all the CCS technologies, Geosequestration is most likely to gain the
most benefit due to the limited versatility of existing regulations. In addition, a carbon price,
mandatory requirement for CO2 emissions reduction, and contract for difference for power
generation would improve economic planning certainty.
The Economics of Algae CCS as well as Geosequestration are strongly impacted by the costs
of the capture process which is not present for the Biochar CCS option as it relies on a natural
process. Algae CCS and Biochar CCS benefit from the ability to offset the costs by multiple
revenue streams, while the only current additional revenue stream for Geosequestration stems
from enhanced hydrocarbon recovery. This makes Geosequestration, especially for industries
other than the petroleum industry, very dependent on government support or a carbon price,
either in the form of direct contributions, or in the form of mandated CO2 capture. The main
challenge for Algae CCS at the current stage is the unpredictability of the revenue stream due to
insufficient research and development (R&D) into the range of factors which impact the
biomass yield and conversion, therefore there are many uncertainties in making any economic
forecasts for a project. Economics is one of the highlights of Biochar CCS, with relatively
modest capital expenditure and operational running costs as well as the availability of a range of
revenue streams, while this represents a significant barrier for the two other technologies.
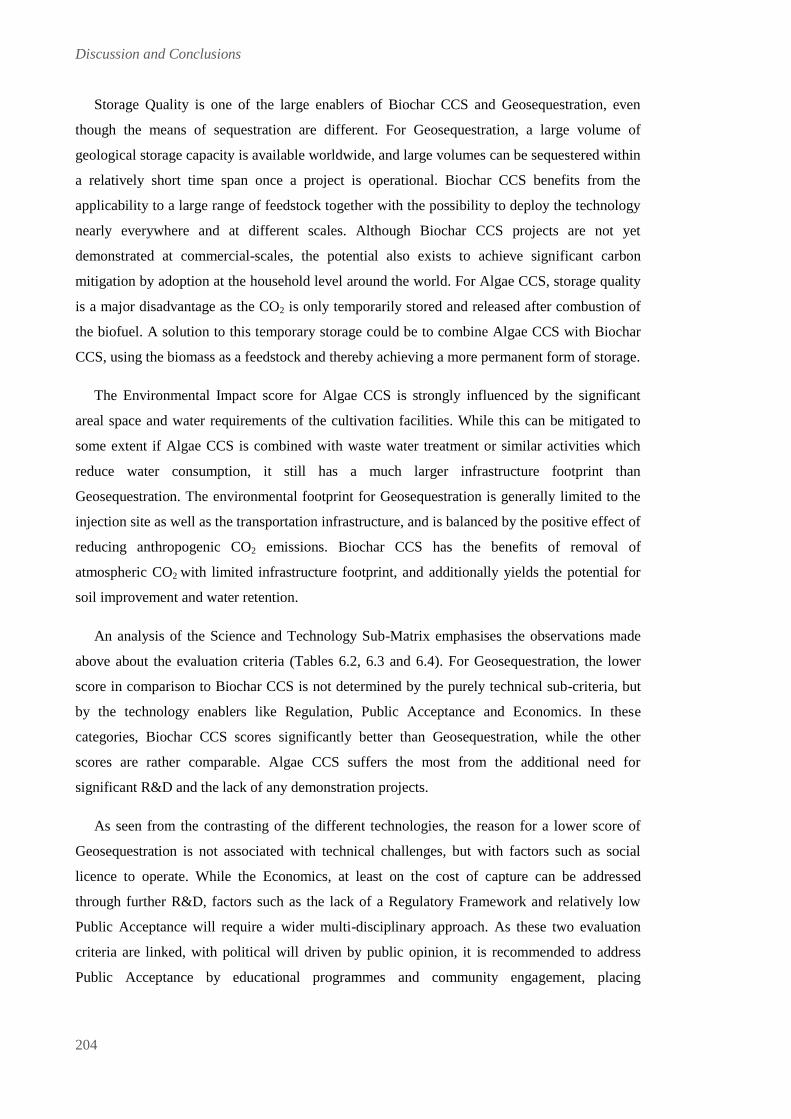
Discussion and Conclusions
204
Storage Quality is one of the large enablers of Biochar CCS and Geosequestration, even
though the means of sequestration are different. For Geosequestration, a large volume of
geological storage capacity is available worldwide, and large volumes can be sequestered within
a relatively short time span once a project is operational. Biochar CCS benefits from the
applicability to a large range of feedstock together with the possibility to deploy the technology
nearly everywhere and at different scales. Although Biochar CCS projects are not yet
demonstrated at commercial-scales, the potential also exists to achieve significant carbon
mitigation by adoption at the household level around the world. For Algae CCS, storage quality
is a major disadvantage as the CO2 is only temporarily stored and released after combustion of
the biofuel. A solution to this temporary storage could be to combine Algae CCS with Biochar
CCS, using the biomass as a feedstock and thereby achieving a more permanent form of storage.
The Environmental Impact score for Algae CCS is strongly influenced by the significant
areal space and water requirements of the cultivation facilities. While this can be mitigated to
some extent if Algae CCS is combined with waste water treatment or similar activities which
reduce water consumption, it still has a much larger infrastructure footprint than
Geosequestration. The environmental footprint for Geosequestration is generally limited to the
injection site as well as the transportation infrastructure, and is balanced by the positive effect of
reducing anthropogenic CO2 emissions. Biochar CCS has the benefits of removal of
atmospheric CO2 with limited infrastructure footprint, and additionally yields the potential for
soil improvement and water retention.
An analysis of the Science and Technology Sub-Matrix emphasises the observations made
above about the evaluation criteria (Tables 6.2, 6.3 and 6.4). For Geosequestration, the lower
score in comparison to Biochar CCS is not determined by the purely technical sub-criteria, but
by the technology enablers like Regulation, Public Acceptance and Economics. In these
categories, Biochar CCS scores significantly better than Geosequestration, while the other
scores are rather comparable. Algae CCS suffers the most from the additional need for
significant R&D and the lack of any demonstration projects.
As seen from the contrasting of the different technologies, the reason for a lower score of
Geosequestration is not associated with technical challenges, but with factors such as social
licence to operate. While the Economics, at least on the cost of capture can be addressed
through further R&D, factors such as the lack of a Regulatory Framework and relatively low
Public Acceptance will require a wider multi-disciplinary approach. As these two evaluation
criteria are linked, with political will driven by public opinion, it is recommended to address
Public Acceptance by educational programmes and community engagement, placing
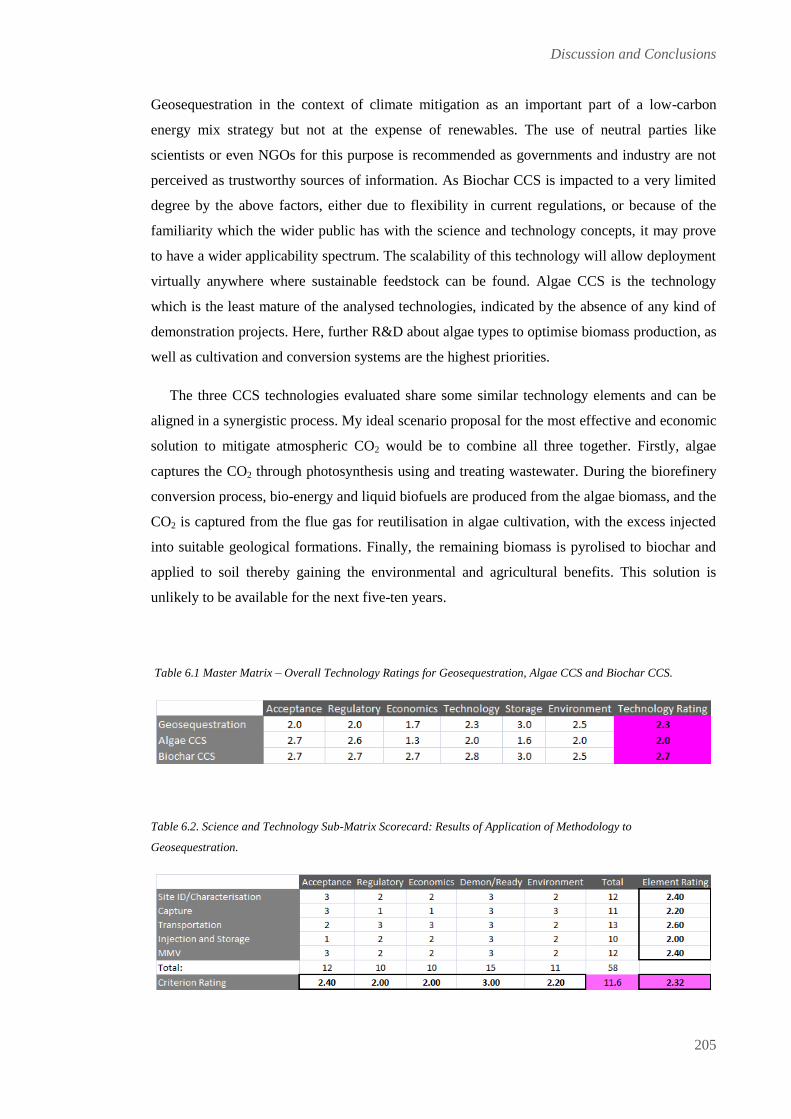
Discussion and Conclusions
205
Geosequestration in the context of climate mitigation as an important part of a low-carbon
energy mix strategy but not at the expense of renewables. The use of neutral parties like
scientists or even NGOs for this purpose is recommended as governments and industry are not
perceived as trustworthy sources of information. As Biochar CCS is impacted to a very limited
degree by the above factors, either due to flexibility in current regulations, or because of the
familiarity which the wider public has with the science and technology concepts, it may prove
to have a wider applicability spectrum. The scalability of this technology will allow deployment
virtually anywhere where sustainable feedstock can be found. Algae CCS is the technology
which is the least mature of the analysed technologies, indicated by the absence of any kind of
demonstration projects. Here, further R&D about algae types to optimise biomass production, as
well as cultivation and conversion systems are the highest priorities.
The three CCS technologies evaluated share some similar technology elements and can be
aligned in a synergistic process. My ideal scenario proposal for the most effective and economic
solution to mitigate atmospheric CO2 would be to combine all three together. Firstly, algae
captures the CO2 through photosynthesis using and treating wastewater. During the biorefinery
conversion process, bio-energy and liquid biofuels are produced from the algae biomass, and the
CO2 is captured from the flue gas for reutilisation in algae cultivation, with the excess injected
into suitable geological formations. Finally, the remaining biomass is pyrolised to biochar and
applied to soil thereby gaining the environmental and agricultural benefits. This solution is
unlikely to be available for the next five-ten years.
Table 6.1 Master Matrix – Overall Technology Ratings for Geosequestration, Algae CCS and Biochar CCS.
Table 6.2. Science and Technology Sub-Matrix Scorecard: Results of Application of Methodology to
Geosequestration.

Discussion and Conclusions
206
Table 6.3. Science and Technology Sub-Matrix Scorecard: Results of Application of Methodology to Algae CCS.
Table 6.4. Science and Technology Sub-Matrix Scorecard: Results of Application of Methodology to Biochar CCS.
Example of Carbon Management Portfolio
Based on the application of my methodology to the three CCS options as described in this
and previous chapters, I give some recommendations for an example portfolio for a specific
industry group, LNG operators on the North West Shelf of Australia. Geosequestration would
be the first technology of choice to dispose of the CO2 produced from offshore gas reservoirs
and generated from processing. This industry group has the knowledge and experience in-house
to deploy the technology with all the expertise required for storage characterisation, separation
technologies, injection, and reservoir monitoring. Source and sink matching are not an issue as
the storage space is in the immediate vicinity of the processing facilities, also reducing the costs
for additional transportation infrastructure. With a number of aging oil fields nearby, the
potential to utilise the CO2 for enhanced hydrocarbon recovery exists as well. Recent R&D
highlights new opportunities in using CO2 for unconventional hydrocarbon production. While
this may require additional infrastructure due to the potentially large distances, the possibility to
mitigate the tremendous water requirements for the production of unconventional resources,
with water being a rare resource in North-Western and Northern Australia, could improve the
economics as well as the public acceptance of such a business model.

Discussion and Conclusions
207
Biochar CCS could provide a potential supplemental technology for a carbon management
portfolio. The benefits of this technology are its scalability, affordability and the multiple
revenue streams, including the aligned industry of biofuels. This option may represent a low
risk alternative or backup plan in case challenges occur with the primary storage method of
Geosequestration. Having an alternative to rely upon would allow the LNG plant to maintain
full production if a similar scenario arises to that experienced by Statoil with the Snøhvit
project, where the injectivity for the storage formation was overestimated. I would suggest
operators could implement this technology initially at more modest scales to gain experience,
such as projects in non Organisation for Economic Cooperation and Development (OECD)
nations providing modern pyrolysis stoves and kilns for households to help with food security
through soil amendment. This can generate certified emission reductions (CER) carbon credits
to offset carbon debt, and mitigate GHG based on accumulated volumes. If a more commercial-
scale project (>.500 Mtpa CO2) is desired, a waste to energy plant sited and/or joint venture with
municipal councils could be a good option. The suggested examples could align with an
operator’s “corporate responsibility” or “green” corporate strategy. If the economic benefits are
in line with those predicted in published literature, Biochar CCS may even provide a standalone
business model while at the same time significantly reducing the risk for the LNG operators.
At the current stage, it is not recommended to include Algae CCS in a carbon management
portfolio. Significant R&D is still required and there is no benefit for carbon management in the
short term. For integrated oil companies with refinery and fuel distribution networks, it is
nevertheless recommended to follow up with biofuels research derived from this technology
application, as there may be the potential to supplement current fossil fuels or to address
mandatory biofuel additions.

Discussion and Conclusions
208

Discussion and Conclusions
209
6.2 CONCLUSIONS
I develop a new semi-quantitative methodology for the feasibility assessment of CCS
technologies and their likelihood for wide-scale commercial adoption. The methodology
analyses a wide range of factors from socio-economic to technical, allowing the ranking of
competing or complementary technologies. It is possible to apply this methodology to either a
portfolio of technologies or a portfolio of projects, either on a regional or global scale. The
methodology was applied to three different CCS technologies, Geosequestration, Biochar CCS
and Algae CCS to analyse their current status.
My analysis suggests that Geosequestration has a medium to high probability of success as a
commercial-scale CO2 sequestration option. This technology allows for the fast storage of large
volumes of CO2 in a large range of locations worldwide and this is one of its the main benefits.
For universal commercial scale adoption, regulatory hurdles, as well as the rather negative
public perception of Geosequestration, have still to be overcome. These need to be combined
with an improvement of the cost profile of the capture process, sufficient government funding,
and a mandatory compliance regime to address the current limited commercial revenue streams
for a Geosequestration project. Nevertheless, Geosequestration is one of the technically most
advanced carbon sequestration options as reflected by its technical scores as well as its existing
industrial deployment.
As a third generation biofuel, Algae CCS benefits from supportive regulatory frameworks.
While it offers the potential for a range of possible revenue streams, its capture potential is
determined by the rate of photosynthesis and climate of the region it is implemented in. The
environmental benefits of this technology are mainly linked to the substitution of fossil fuels as
a carbon neutral alternative as the duration of storage is only temporary. A more permanent
solution of storage will require the combination with Biochar CCS which converts the biomass
into a stable form for storage. The significant R&D needed to maximise production efficiencies
and reliability for sustainable volumes, and to lower the capital and operating expenditure of
capture, cultivation and conversion, together with the large land/offshore acreage requirements
for cultivation ponds, result in a longer term but medium probability of success as a
commercial-scale CO2 sequestration option.
Biochar CCS offers the highest probability of success of the three analysed CO2
sequestration options. As with Algae CCS, it benefits from the ability to refer to an existing
regulatory framework, even though it was not specifically designed for this CCS option. The
technical readiness of the technology is comparable to Geosequestration, but the public
Discussion and Conclusions
210
acceptance level is significantly higher. This, and the scalable nature of pyrolysis technology
itself, makes it ready for immediate application at different scales worldwide, as long as
sustainability of the biomass feedstock is kept a priority. Significant global R&D has been
undertaken in this area as governments, scientists and industry recognise its multiple
environmental, agricultural and economic benefits. Further R&D is only needed to improve
conversion efficiencies and optimise agronomical productivity. The demonstration of large scale
projects (>500 Mtpa) would assist in technology uptake. This CO2 mitigation option offers low
risk and is one of the few technologies capable of creating net economic as well as
environmental benefits.
The application of my methodology to these three technologies and the consistency of results
with published literature suggest that the methodology can provide a valuable contribution to
the ranking and prioritisation of CCS projects. The methodology framework is designed to be
flexible to allow for review and modification to allow for technology progress and increased
volumes of, or access to data. The assessment of further technologies can contribute to the
evaluation of the robustness of the methodology and may yield further insight into the various
approaches which can be taken to increase the probability of success for specific CCS
technologies, but also CCS technologies as a whole.

Discussion and Conclusions
211
REFERENCES
Downie, A., Munroe, P., Cowie, A., Van Zwieten, L., and Lau, D. (2012), Biochar as a geoengineering
climate solution: Hazard identification and risk management: Critical reviews in environmental
science and technology 42, 3, 225-250.
European Biofuels Technology Platform/Zero Emission Fossil Fuel Power Plants [EBTP/ZEP]
(2012), Biomass with CO2 capture and storage (Bio-CCS): The way forward for Europe: The
Advisory Council of the European Technology Platform for Zero Emission Fossil Fuel Power Plants
(ZEP) and the Steering Committee of the European Biofuels Technology Platform (EBTP).
http://www.biofuelstp.eu/bio-ccs.html (accessed 2 July 2012).
Global CCS Institute (2012), The Global status of CCS: 2012: Global CCS Institute, Canberra, ACT,
Australia.
International Energy Agency [IEA] (2011), Carbon Capture and Storage Legal and Regulatory
Review: Edition 2: International Energy Agency, OECD [Garrett, J., Beck, B., Lipponen, J.,
McCoy, S., Houssin, D., Volk, D., Yoshimura, T., Finkenrath, M. and Gaghen, R.]: Paris, France.
Intergovernmental Panel on Climate Change [IPCC] (2012), Intergovernmental Panel on Climate
Change Special Report on Renewable Energy Sources and Climate Change Mitigation (SRREN) [O.
Edenhofer, R. Pichs‐Madruga, Y. Sokona, K. Seyboth, P. Matschoss, S. Kadner, T. Zwickel, P.
Eickemeier, G. Hansen, S. Schlömer, C. von Stechow (eds)], Cambridge University Press, New
York, NY, USA.
Kuijper, M. (2011), Public acceptance challenges for onshore CO2 storage in Barendrecht: Energy
Procedia, 4, 6226-6233.
Natural Resources Defense Council [NRDC] (2010), Biochar: Assessing the Promise and Risks to
Guide U.S. Policy, NRDC Issue Paper November 2010, New York, NY, USA.
NNFCC (2012), Research Needs in Ecosystem Services to Support Algal Biofuels,Bioenergy and
Commodity Chemicals Production in the UK: A project for the Algal Bioenergy Special Interest
Group [Smith, N. and Higson, A.]: NNFCC Project Number: 12-008.
Reuters (2011), Update 2 – Vattenfall drops carbon capture project in Germany: Reuters, 5 December
2011. http://www.reuters.com/article/2011/12/05/vattenfall-carbon-idUSL5E7N53PG20111205
(accessed 7 June 2012).

Discussion and Conclusions
212
Schlumberger Business Consulting Energy Institute [SBC Energy Institute] (2012), Leading the
Energy Transition: Bringing Carbon Capture and Storage to Market, [Soupa, O., Lajoie, B., Long,
A., and Alvarez, H.]: Schlumberger Business Consulting Energy Institute.
Schlumberger Business Consulting Energy Institute [SBC Energy Institute] (2013), Leading the
Energy Transition: Carbon Capture and Storage: Bringing Carbon Capture and Storage to Market:
Factbook Edition, January 2013 Update: Schlumberger Business Consulting Energy Institute.
United States Department of Energy [US DOE] (2010), National Algal Biofuels Roadmap: U.S.
Department of Energy, Office of Energy Efficiency and Renewable Energy, Biomass Program.
Waters, D., Zwieten, L., Singh, B. P., Downie, A., Cowie, A. L., and Lehmann, J. (2011), Biochar in
soil for climate change mitigation and adaptation. In Soil Health and Climate Change: Springer
Berlin Heidelberg, 15, 345-368.


![[XLS] · Web viewNyaga Benta Grace - Magna Cum Laude Bett Brian Kipkemoi - Magna Cum Laude Charles Isaack Bira - Magna Cum Laude Saajan Kirti Hariya - Magna Cum Laude Njoroge Evans](https://img.pdfslide.us/doc/110x75/5aa1ebb77f8b9aa0108c8232/xls-viewnyaga-benta-grace-magna-cum-laude-bett-brian-kipkemoi-magna-cum-laude.jpg)