Embed Size (px)
Citation preview
PORTFOLIO ADDITIONAL ESTIMATES STATEMENTS 2012-13 FOREIGN AFFAIRS AND TRADE PORTFOLIO EXPLANATIONS OF ADDITIONAL ESTIMATES 2012-13

© Commonwealth of Australia 2013
ISBN 978-1-74322-078-8
With the exception of the Commonwealth Coat of Arms and where otherwise noted all
material presented in this document is provided under a Creative Commons
Attribution 3.0 Australia (http://creativecommons.org/licenses/by/3.0/au/) licence.
The details of the relevant licence conditions are available on the Creative Commons
website (accessible using the links provided) as is the full legal code for the CC BY 3.0
AU licence (http://creativecommons.org/licenses/by/3.0/au/legalcode).
The document must be attributed as the Portfolio Additional Estimates Statements 2012-13
– Foreign Affairs and Trade Portfolio.
Printed by CanPrint Communications Pty Ltd

iii
PARLIAMENT HOUSE
CANBERRA 2600
President of the Senate
Australian Senate
Parliament House
CANBERRA ACT 2600
Speaker
House of Representatives
Parliament House
CANBERRA ACT 2600
Dear Mr President
Dear Madam Speaker
We hereby submit Portfolio Additional Estimates Statements in support of the
2012-13 Additional Estimates for the Foreign Affairs and Trade Portfolio.
These statements have been developed, and are submitted to the Parliament, as a
statement on the funding requirements being sought for the Portfolio.
We present these statements by virtue of our ministerial responsibility for
accountability to the Parliament and, through it, the public.
Yours sincerely
Bob Carr Craig Emerson
Minister for Foreign Affairs Minister for Trade and Competitiveness
Minister Assisting the Prime Minister on
Asian Century Policy

iv
Abbreviations and conventions
The following notations may be used:
NEC/nec not elsewhere classified
- nil
.. not zero, but rounded to zero
na not applicable (unless otherwise specified)
nfp not for publication
$m $ million
Figures in tables and in the text may be rounded. Figures in text are generally rounded
to one decimal place, whereas figures in tables are generally rounded to the nearest
thousand. Discrepancies in tables between totals and sums of components are due to
rounding.
ENQUIRIES
Should you have any enquiries regarding this publication please contact Ann Thorpe,
Chief Finance Officer in the Department of Foreign Affairs and Trade on (02) 6261
1240.
A copy of this document can be located on the Australian Government Budget website
at: http://www.budget.gov.au.

USER GUIDE TO THE
PORTFOLIO ADDITIONAL ESTIMATE STATEMENTS


vii
USER GUIDE
The purpose of the Portfolio Additional Estimates Statements (PAES), like that of the
Portfolio Budget Statements (PB Statements), is to inform Senators and Members of
Parliament of the proposed allocation of resources to Government outcomes by
agencies within the portfolio. The focus of the PAES differs from the PB Statements in
one important aspect. While the PAES include an Agency Resource Statement to
inform Parliament of the revised estimate of the total resources available to an agency,
the focus of the PAES is on explaining the changes in resourcing by outcome(s) since
the Budget. As such, the PAES provides information on new measures and their
impact on the financial and/or non-financial planned performance of programs
supporting those outcomes.
The PAES facilitate understanding of the proposed appropriations in Appropriation
Bills (No. 3 and No. 4) 2012-13. In this sense the PAES is declared by the Additional
Estimates Appropriation Bills to be a ‘relevant document’ to the interpretation of the
Bills according to section 15AB of the Acts Interpretation Act 1901.
Whereas the Mid-Year Economic and Fiscal Outlook 2012-13 is a mid-year budget report
which provides updated information to allow the assessment of the Government’s
fiscal performance against its fiscal strategy, the PAES update the most recent budget
appropriations for agencies within the portfolio.
User Guide
viii
Structure of the Portfolio Additional Estimates Statements
The PAES are presented in three parts with subsections.
User guide
Provides a brief introduction explaining the purpose of the PAES.
Portfolio overview
Provides an overview of the portfolio, including a chart that outlines the outcomes for agencies
in the portfolio.
Agency additional estimates statements
A statement (under the name of the agency) for each agency affected by Additional
Estimates.
Section 1: Agency
overview and resources
This section details the total resources available to an agency,
the impact of any measures since Budget, and impact on
Appropriation Bills No. 3 and No. 4.
Section 2: Revisions to
outcomes and planned
performance
This section details changes to Government outcomes and/or
changes to the planned performance of agency programs.
Section 3: Explanatory
tables and budgeted
financial statements
This section contains updated explanatory tables on special
account flows and staffing levels and revisions to the budgeted
financial statements.
Glossary Explains key terms relevant to the Portfolio.

ix
CONTENTS
Portfolio Overview......................................................................................................... 3
Agency Additional Estimates Statements .................................................................. 7
Department of Foreign Affairs and Trade (DFAT) ........................................................... 9
Australian Trade Commission (Austrade) ..................................................................... 51
Australian Agency for International Development (AusAID) ......................................... 77
Glossary ..................................................................................................................... 107


PORTFOLIO OVERVIEW


3
PORTFOLIO OVERVIEW
A full outline of the Foreign Affairs and Trade Portfolio Overview can be found in the
Portfolio Budget Statements 2012-13.
The Minister for Foreign Affairs and the Minister for Trade and Competitiveness,
Minister Assisting the Prime Minister on Asian Century Policy remain the two
portfolio Ministers. A Parliamentary Secretary for Trade and a Parliamentary
Secretary for Pacific Island Affairs, Parliamentary Secretary for Foreign Affairs
continue to support the portfolio Ministers.
ADDITIONAL ESTIMATES AND VARIATIONS – PORTFOLIO LEVEL
The portfolio is seeking a net increase of $23.0 million in Bill No. 3, Bill No. 4 and
special appropriations for 2012-13.
Department of Foreign Affairs and Trade (DFAT) $15.8 million
Departmental Items
$8.591m to support Australia’s non-permanent membership of the United
Nations Security Council for the two calendar year 2013-2014 term;
($0.258m) for Fire Service Levy – reduction announced in the 2012-13 Budget;
($5.091m) in Targeted savings – public service efficiencies announced during
the Mid-Year Economic and Fiscal Outlook;
$5.101m adjustment for overseas inflation;
($4.358m) adjustment for foreign exchange movements;
($0.181m) adjustment for property savings;
$5.587m adjustment for passport funding due to higher than expected passport
issues in 2011-12;
($5.802m) adjustment for passport funding due to lower than expected
passport issues in 2012-13;
$3.550m adjustment for security capital funding for Australia's civilian
engagement in Afghanistan; and
$8.441m supplementation for fringe benefits tax changes to the living-away-
from-home allowance.
Administered Items
The Auschwitz-Birkenau Foundation measure was funded through available
2011-12 administered appropriation; and
$0.150m adjustment for passport refunds from Special Appropriation FMA Act,
s.28.
Portfolio Overview
4
Australian Trade Commission (Austrade) $2.8 million
Departmental Items
$0.500m for the Asian Century Business Engagement Plan;
($0.671m) in Targeted savings – public service efficiencies announced during the Mid-Year Economic and Fiscal Outlook; and
$2.924m supplementation for fringe benefits tax changes to the living-away-from-home allowance.
Australian Agency for International Development (AusAID) $4.5 million
Departmental Items
($0.021m) for Fire Service Levy – reduction announced in the 2012-13 Budget;
($2.097m) in Targeted savings – public service efficiencies announced during the Mid-Year Economic and Fiscal Outlook;
$2.226m for adjustment for parameters;
$3.740m supplementation for fringe benefits tax changes to the living-away-from-home allowance; and
$0.668m for Australia in the Asian Century – Asian Century Awards.
Australian Centre for International Agricultural Research (ACIAR)
There are no additional measures or variations for ACIAR.
Australian Secret Intelligence Service (ASIS)
There are no additional measures or variations for ASIS.

Portfolio Overview
5
Figure 1: Foreign Affairs and Trade portfolio structure and outcomes
Minister for Foreign Affairs Ministerfor Trade and Competitiv_ Senator the Hon. Bob Carr Minister Assisting the Prime Minister
on Asian Century Policy Parl iamef1tary Secretary for Pacific Island The Hon. Dr Craig Emerson MP
r- Affa irs I-Parliamef1tary Secretaryfor Foreign Affairs Parl iamef1tary Secretary for Trade
The Hon. Richard Maries MP The Hon. Kelvin Thomson MP
I I I
Department of Foreign Affairs and Trade Secretary, Mr Peter Varghese
Outcome \ : The advancement of Australia's international strategic , security and economic interests including through bilateral , reg ional and multilateral engagement on Australian Govemmef1t foreign and trade policy priorities
Outcome 2: The protection and welfare of Australians abfoad and access to secure international tra~ documef1tation through timely and responsive tra~
advice and consula r and passport services in Australia and overseas
Outcome 3: A secure Australian Govemmef1t presence overseas through the provision of security services and information and communications technology infrastructure , and the management of the Commonwealth's overseas owned
estate
Australian Agency for International Australian Trade Commission Development Chief Executive Officer,
Director General, Mr Peter Bnter Mr Bruce Gosper
I- Outcome 1 To assist developing countries to Outcome t: Advance Australia's trade, -reduce poverty and achieve susta inable investment and education promotion
development, in line with Australia's national interests through information, advice, and interest services to business, the education sector
and govemmef1ts Outcome 2: Australia's national interest
advanced by implemef1ting a partnership Outcome 2: The protection and welfare of between Australia and Indonesia for Australians abfoad through timely and
reconstruction and development responsive consula r and passport services in specific locations overseas
Australian Centre for International Agricultural Research
- Chief Executive Officer, Dr Nick Austin
Outcome 1 To achieve more productive and susta inable agricu ~ural systerns forthe benefit of developing countries and Australia through international agricu~ural research and training
partnersh ips
Australian Secret Intelligence Service Director-General , Mr Nick Warner
'- Outcome \ : Enhanced understanding for the Govemmef1t of the overseas ef1vironmef1t affecting Australia's interests through the
provision of covertinte1ligeoce services about the capabi lities, intef1bons or actMties of people or organisations outside Australia

Portfolio Overview
6
Portfolio resources
Table 1 shows for those agencies reporting in the Portfolio Additional Estimates
Statements the additional resources provided to the portfolio in the 2012-13 budget
year, by agency.
Table 1: Portfolio resources 2012-13
Receipts Total
Bill No. 3 Bill No. 4 Special
$m $m $m $m $m
Department of Foreign
and Trade
Administered appropriations - - 0.2 - 0.2
Departmental appropriations 10.3 5.3 - - 15.6
Total: 15.8
Australian Trade
Commission
Administered appropriations - - - - -
Departmental appropriations 2.8 - - - 2.8
Total: 2.8
Australian Agency for
International
Development
Administered appropriations - - - - -
Departmental appropriations 4.5 - - - 4.5
Total: 4.5
Portfolio total 23.0
Less amounts transferred
w ithin portfolio -
Resources available w ithin portfolio: 23.0
Appropriation

7
AGENCY ADDITIONAL ESTIMATES
STATEMENTS
Department of Foreign Affairs and Trade (DFAT) ...................................................... 9
Australian Trade Commission (Austrade) ................................................................ 51
Australian Agency for International Development (AusAID) .................................. 77


9
DEPARTMENT OF FOREIGN AFFAIRS AND
TRADE
Section 1: Agency overview and resources ............................................................. 11
1.1 Strategic Direction .................................................................................................. 11
1.2 Agency Resource Statement ................................................................................. 12
1.3 Agency Measures table .......................................................................................... 15
1.4 Additional Estimates and variations ....................................................................... 16
1.5 Breakdown of Additional Estimates by appropriation bill ....................................... 20
Section 2: Revisions to agency outcomes and planned performance .................. 23
2.1 Resources and performance information ............................................................... 23
Section 3: Explanatory tables and budgeted financial statements ....................... 35
3.1 Explanatory tables .................................................................................................. 35
3.2 Budgeted financial statements ............................................................................... 37


DFAT Additional Estimates Statements
11
DEPARTMENT OF FOREIGN AFFAIRS AND TRADE
(DFAT)
Section 1: Agency overview and resources
1.1 STRATEGIC DIRECTION
To further progress the foreign and trade policy priorities outlined in the Portfolio
Budget Statements 2012-13, the Government has agreed to fund three additional foreign
and trade policy initiatives, which will be delivered by the Department.
The Government has agreed to provide funding to support Australia’s non-permanent
membership of the United Nations Security Council for the two calendar year 2013-
2014 term. Australia was elected as a non-permanent member of the Council on
18 October 2012 and took up its term on 1 January 2013. The funding will contribute to
costs associated with additional staffing resources in New York, three of our African
missions and in Canberra. Serving on the UNSC will provide Australia with an
opportunity to directly influence solutions to the world’s most pressing security
challenges, as well as Council decisions that directly affect Australian personnel
deployed under UNSC mandates.
The Government has decided to appoint a Jakarta-based Ambassador to ASEAN,
announced as an outcome of the Australia in the Asian Century White Paper. The
Government has agreed to provide funding for the operational costs associated with
this position, which will commence in 2013-14. A resident Ambassador to ASEAN will
enhance Australia’s ability to work with ASEAN and its members on priority regional
political, security and economic issues.
The Government has agreed to make a contribution to the Auschwitz-Birkenau
Foundation’s international fundraising efforts to assist with the preservation of the
Auschwitz-Birkenau Memorial Site in Poland. The memorial is an important public
awareness and education tool to avoid atrocities like the Holocaust occurring again.
As a result of the Mid-Year Economic and Fiscal Outlook review, the Department is
required to implement annual, targeted savings of $5.1 million in 2012-13 and $5.2
million from 2013-14 onwards.
A full outline of DFAT’s Strategic Direction can be found in the Portfolio Budget
Statements 2012-13.

DFAT Additional Estimates Statements
12
1.2 AGENCY RESOURCE STATEMENT
The Agency Resource Statement details the resourcing for the Department of Foreign
Affairs and Trade at Additional Estimates. Table 1.1 outlines the total resourcing
available from all sources for the 2012-13 Budget year, including variations through
Appropriation Bills No.3 and No.4, special appropriations and special accounts.

DFAT Additional Estimates Statements
13
Table 1.1: DFAT resource statement — Additional estimates for 2012-13 as at Additional Estimates February 2013
Estimate as Proposed Total Total
at Budget+
Additional=
estimate available
Estimate at Additional appropriation
Estimates
2012- 13 2012- 13 2012- 13 2011- 12
$'000 $'000 $'000 $'000
Ordina ry a nnua l se rvic e s1
De pa rtme nta l a ppropria tion
Prior year departmental appropriation2 322,297 - 322,297 325,579
Departmental appropriation3 943,043 10,293 953,336 929,940
s.31 Relevant agency receipts4 81,599 - 81,599 123,480
Tota l 1,3 4 6 ,9 3 9 10 ,2 9 3 1,3 5 7 ,2 3 2 1,3 7 8 ,9 9 9
Administe re d e xpe nse s
Outcome 1 269,453 - 269,453 243,869
Outcome 2 750 - 750 248
Outcome 3 - - - -
Payments to CAC Act bodies 4,926 - 4,926 4,257
Tota l 2 7 5 ,12 9 - 2 7 5 ,12 9 2 4 8 ,3 7 4
Tota l ordina ry a nnua l se rvic e s A 1,6 2 2 ,0 6 8 10 ,2 9 3 1,6 3 2 ,3 6 1 1,6 2 7 ,3 7 3
Othe r se rvic e s
De pa rtme nta l non- ope ra ting
Equity injections 5
56,814 5,287 62,101 72,005
Tota l 5 6 ,8 14 5 ,2 8 7 6 2 ,10 1 7 2 ,0 0 5
Tota l othe r se rvic e s B 5 6 ,8 14 5 ,2 8 7 6 2 ,10 1 7 2 ,0 0 5
Tota l a va ila ble a nnua l
a ppropria tions 1,6 7 8 ,8 8 2 15 ,5 8 0 1,6 9 4 ,4 6 2 1,6 9 9 ,3 7 8
Spe c ia l a ppropria tions
Spe c ia l a ppropria tions limite d
by a mount
Special Appropriation FMA Act, s.28 860 150 1,010 953
Tota l spe c ia l a ppropria tions C 8 6 0 15 0 1,0 10 9 5 3
Tota l a ppropria tions e xc luding
Spe c ia l Ac c ounts 1,6 7 9 ,7 4 2 15 ,7 3 0 1,6 9 5 ,4 7 2 1,7 0 0 ,3 3 1
Table continued on following page.

DFAT Additional Estimates Statements
14
Table 1.1: DFAT resource statement — Additional estimates for 2012-13 as at Additional Estimates February 2013 (continued)
Estimate as Proposed Total Total
at Budget+
Additional=
estimate available
Estimate at Additional appropriation
Estimates
2012- 13 2012- 13 2012- 13 2011- 12
$'000 $'000 $'000 $'000
Spe c ia l Ac c ounts
Opening balance6
338,667 - 338,667 400,642
Adjustment to opening balance7 - 102,672 102,672
Appropriation receipts8
59,456 348 59,804 84,592
Appropriation receipts
- other agencies9
27,928 (1,729) 26,199 27,289
Non- appropriation receipts to
Special Accounts 7,841 (159) 7,682 7,021
Tota l Spe c ia l Ac c ount D 4 3 3 ,8 9 2 10 1,13 2 5 3 5 ,0 2 4 5 19 ,5 4 4
Tota l re sourc ing
A+B+C+D 2,113,634 116,862 2,230,496 2,219,875
Less appropriations drawn from
annual or special appropriations (59,456) (348) (59,804) (84,592)
above and credited to special
accounts and/or CAC Act bodies
through annual appropriations (4,926) - (4,926) (4,257)
Tota l ne t re sourc ing for DFAT 2 ,0 4 9 ,2 5 2 116 ,5 14 2 ,16 5 ,7 6 6 2 ,13 1,0 2 6
1 Appropriation Act (No. 1) 2012- 13 & Appropriation Bill (No. 3) 2012- 13
2 Estimated adjusted balance carried from previous year for annual appropriations
3 Includes an amount of $63.256m in 2012- 13 for the Departmental Capital Budget (refer to table 3.2.5 for
further details). For accounting purposes this amount has been designated as 'contributions by owners'4 s.31 Relevant Agency receipts - estimate
5 Appropriation Act (No. 2) 2012- 13 & Appropriation Bill (No. 4) 2012- 13
6 Estimated opening balance for special accounts (less ‘Special Public Money’ held in the following
accounts: Other Trust Monies (OTM), Services for other Government and Non- agency Bodies (SOG),
Services for Other Entities and Trust Moneys Special (SOETM), and Consular Special Services Account
(CSSA)). For further information on special accounts see Table 3.1.1.
8 Appropriation receipts from DFAT annual and special appropriations for 2012- 13 included above
9 Appropriation receipts from other agencies credited to DFAT's special accounts
Reader note: All figures are GST exclusive.
Third Pa rty Pa yme nts from a nd on be ha lf of othe r a ge nc ie s
Estimate at Estimate at
Budget Additional
Estimates
2012- 13 2012- 13
$'000 $'000
Receipts received from other agencies for the provision of services
(disclosed above within Departmental section 31) 81,599 81,599
Payments made to CAC Act bodies within the Portfolio
Export Finance Insurance Corporation Appropriation Act 1 4,926 3,987
7 Opening balance adjustment is due to rephasing of the capital works program and land purchase

DFAT Additional Estimates Statements
15
1.3 AGENCY MEASURES TABLE
Table 1.2 summarises new Government measures taken since the 2012-13 Budget. The
table is split into revenue, expense and capital measures, with the affected program
identified.
Table 1.2: Agency 2012-13 Measures since Budget
Program 2012-13 2013-14 2014-15 2015-16
$'000 $'000 $'000 $'000
Expense measures
Auschw itz-Birkenau Foundation 1.3
Administered expenses 1 - - - -
Total - - - -
United Nations Security Council Term 1.1
Departmental expenses 6,854 11,408 7,501 -
Australia in the Asian Century -
Ambassador to ASEAN 1.1
Departmental expenses - 2,025 1,713 1,767
Fire Service Levy – reduction 1.1, 2.1,
2.2, 3.1
Departmental expenses 2 (258) (269) (282) (282)
Targeted savings – public service
efficiencies
1.1, 2.1,
2.2, 3.1
Departmental expenses (5,091) (5,207) (5,207) (5,207)
Total 1,505 7,957 3,725 (3,722)
Total expense measures
Administered - - - -
Departmental 1,505 7,957 3,725 (3,722)
Total 1,505 7,957 3,725 (3,722)
Capital measures
United Nations Security Council Term 1.1
Departmental capital 1,737 - - -
Total 1,737 - - -
Total capital measures
Departmental 1,737 - - -
Total 1,737 - - -
Prepared on a Government Financial Statistics (fiscal) basis
1 The Government provided $0.5m in 2011-12 to the Auschw itz-Birkenau Foundation.
This measure w as funded through available 2011-12 administered appropriation.
2 Fire Service Levy – reduction is a measure announced in the 2012-13 Budget but not
previously reported in a portfolio statement.

DFAT Additional Estimates Statements
16
1.4 ADDITIONAL ESTIMATES AND VARIATIONS
The following tables detail the changes to the resourcing for DFAT at Additional
Estimates, by outcome. Table 1.3 details the Additional Estimates and variations
resulting from new measures since the 2012-13 Budget in Appropriation Bills No.3 and
No.4. Table 1.4 details Additional Estimates or variations through other factors, such
parameter adjustments.

DFAT Additional Estimates Statements
17
Table 1.3: Additional estimates and variations to outcomes from measures since 2012-13 Budget
Program 2012-13 2013-14 2014-15 2015-16
impacted $'000 $'000 $'000 $'000
Outcome 1
Increase in estimates (administered)
Auschw itz-Birkenau Foundation 1 1.3 - - - -
Net impact on estimates
for Outcome 1 (administered) - - - -
Increase in estimates (departmental)
United Nations Security Council Term 1.1 6,854 11,408 7,501 -
Australia in the Asian Century -
Ambassador to ASEAN 1.1 - 2,025 1,713 1,767
Decrease in estimates (departmental)
Fire Service Levy – reduction 2 1.1 (118) (121) (133) (131)
Targeted savings – public service
efficiencies1.1 (2,350) (2,356) (2,441) (2,408)
Net impact on estimates
for Outcome 1 (departmental) 4,386 10,956 6,640 (772)
Outcome 2
Decrease in estimates (departmental)
Fire Service Levy – reduction 2 2.1, 2.2 (88) (94) (108) (111)
Targeted savings – public service
efficiencies2.1, 2.2 (1,724) (1,814) (2,011) (2,054)
Net impact on estimates
for Outcome 2 (departmental) (1,812) (1,908) (2,119) (2,165)
Outcome 3
Decrease in estimates (departmental)
Fire Service Levy – reduction 2 3.1 (52) (54) (41) (40)
Targeted savings – public service
efficiencies3.1 (1,017) (1,037) (755) (745)
Net impact on estimates
for Outcome 3 (departmental) (1,069) (1,091) (796) (785)
1 The Government provided $0.5m in 2011-12 to the Auschw itz-Birkenau Foundation.
This measure w as funded through available 2011-12 administered appropriation.2 Fire Service Levy – reduction is a measure announced in the 2012-13 Budget but not
previously reported in a portfolio statement.

DFAT Additional Estimates Statements
18
Table 1.4: Additional estimates and variations to outcomes from other variations Program 2012-13 2013-14 2014-15 2015-16
impacted $'000 $'000 $'000 $'000
Outcome 1
Increase in estimates (administered)
Adjustment for foreign exchange
rebasing1.1, 1.2 5,037 6,165 6,232 6,298
Adjustment for domestic inflation 1.1 1 - - -
Decrease in estimates (administered)
Adjustment for foreign exchange
rebasing1.1 - (3) (2) -
Adjustment for domestic inflation 1.3 (80) (102) (210) (321)
Adjustment for EFIC National
Interest Account Expenses 1.1 (939) (718) (483) (425)
Adjustment for United Nations
Peacekeeping Operation 1.2 (9,020) - - -
Contributions
Net impact on estimates
for Outcome 1 (administered) (5,001) 5,342 5,537 5,552
Increase in estimates (departmental)
Adjustment for overseas inflation 1.1 2,789 2,768 2,996 2,996
Supplementation for fringe benefits
tax changes to the living-aw ay-
from-home-allow ance
1.1 7,801 28,398 70,460 74,265
Decrease in estimates (departmental)
Adjustment for domestic inflation 1.1 - (1,018) (1,423) (1,674)
Adjustment for foreign exchange
rebasing1.1 (2,383) (2,365) (2,559) (2,559)
Adjustment for Property Savings 1.1 (83) (86) (414) (729)
Adjustment for devolution of
Chancery utilities and cleaning
funding to other Government
Agencies
1.1 - (2,991) (2,991) (2,991)
Net impact on estimates
for Outcome 1 (departmental) 8,124 24,706 66,069 69,308
Table continued on following page.

DFAT Additional Estimates Statements
19
Table 1.4: Additional estimates and variations to outcomes from other variations (continued)
Outcome 2
Increase in estimates (departmental)
Adjustment for overseas inflation 2.1, 2.2 1,105 1,114 1,179 1,178
Supplementation for fringe benefits
tax changes to the living-aw ay-
from-home-allow ance
2.1 640 2,336 6,422 6,722
Adjustment for Passport funding
due to higher than expected
passport issues in 2011-12
2.2 5,587 - - -
Decrease in estimates (departmental)
Adjustment for domestic inflation 2.1, 2.2 - (785) (1,172) (1,430)
Adjustment for foreign exchange
rebasing2.1, 2.2 (944) (952) (1,008) (1,007)
Adjustment for Property Savings 2.1, 2.2 (62) (66) (341) (622)
Adjustment for Passport funding
due to low er than expected
passport issues in 2012-13
2.2 (5,802) (5,392) (6,235) (7,198)
Net impact on estimates
for Outcome 2 (departmental) 524 (3,745) (1,155) (2,357)
Outcome 3
Increase in estimates (departmental)
Adjustment for overseas inflation 3.1 1,207 1,219 926 927
Decrease in estimates (departmental)
Adjustment for domestic inflation 3.1 - (448) (440) (518)
Adjustment for foreign exchange
rebasing3.1 (1,031) (1,041) (791) (792)
Adjustment for Property Savings 3.1 (36) (38) (128) (225)
Net impact on estimates
for Outcome 3 (departmental) 140 (308) (433) (608)
Program 2012-13 2013-14 2014-15 2015-16
impacted $'000 $'000 $'000 $'000

DFAT Additional Estimates Statements
20
1.5 BREAKDOWN OF ADDITIONAL ESTIMATES BY APPROPRIATION
BILL
The following tables detail the Additional Estimates sought for DFAT through
Appropriation Bills No.3 and No.4.
Table 1.5: Appropriation Bill (No. 3) 2012-13
2011-12 2012-13 2012-13 Additional Reduced
Available Budget Revised Estimates Estimates
$'000 $'000 $'000 $'000 $'000
ADMINISTERED ITEMS
Outcome 1 1
The advancement of Australia's international strategic, security and economic interests including through bilateral, regional and multilateral engagement on Australian Government foreign and trade policy priorities
248,126 274,379 274,379 - -
Outcome 2
The protection and welfare of Australians abroad and access to secure international travel documentation through timely and responsive travel advice and consular and passport services in Australia and overseas
248 750 750 - -
Total 248,374 275,129 275,129 - -
Table continued on following page.

DFAT Additional Estimates Statements
21
Table 1.5: Appropriation Bill (No. 3) 2012-13 (continued)
2011-12 2012-13 2012-13 Additional Reduced
Available Budget Revised Estimates Estimates
$'000 $'000 $'000 $'000 $'000 DEPARTMENTAL PROGRAMS
Outcome 1
The advancement of Australia's international strategic, security and economic interests including through bilateral, regional and multilateral engagement on Australian Government foreign and trade policy priorities
487,689 470,089 482,599 12,510 -
Outcome 2
The protection and welfare of Australians abroad and access to secure international travel documentation through timely and responsive travel advice and consular and passport services in Australia and overseas
271,759 297,533 296,245 - (1,288)
Outcome 3
A secure Australian Government presence overseas through the provision of security services and information and communications technology infrastructure, and the management of the Commonwealth’s overseas owned estate
170,492 175,421 174,492 - (929)
Total 929,940 943,043 953,336 12,510 (2,217)
Total administered and
departmental 1,178,314 1,218,172 1,228,465 12,510 (2,217)
1 Only net additional appropriations are disclosed in the Appropriation Bills. The net reduction in
estimates for Administered Outcome 1 disclosed in Table 1.4 ($5.0m) is therefore not included.

DFAT Additional Estimates Statements
22
Table 1.6: Appropriation Bill (No. 4) 2012-13
2011-12 2012-13 2012-13 Additional Reduced
Available Budget Revised Estimates Estimates
$'000 $'000 $'000 $'000 $'000
Non-operating
Equity injections 1 72,005 56,814 62,101 5,287 -
Total non-operating
Department of Foreign Affairs and
Trade72,005 56,814 62,101 5,287 -
Total 72,005 56,814 62,101 5,287 -
1 Additional estimates include $3.550m security funding for Australia's civilian engagement in
Afghanistan

DFAT Additional Estimates Statements
23
Section 2: Revisions to agency resources and planned performance
2.1 RESOURCES AND PERFORMANCE INFORMATION
OUTCOME 1: THE ADVANCEMENT OF AUSTRALIA’S INTERNATIONAL
STRATEGIC, SECURITY AND ECONOMIC INTERESTS INCLUDING
THROUGH BILATERAL, REGIONAL AND MULTILATERAL ENGAGEMENT ON
AUSTRALIAN GOVERNMENT FOREIGN AND TRADE POLICY PRIORITIES
Outcome 1 strategy
There is no change to the Department’s Outcome Strategy as expressed in the Portfolio
Budget Statements 2012-13. Measures being funded through Additional Estimates
reflect the Government’s foreign, trade and security policy priorities through
Australia’s bilateral, regional and multilateral relationships.
The Government has agreed to provide funding to support Australia’s non-permanent
membership of the United Nations Security Council for the two calendar year
2013-2014 term.
The Government has agreed to provide funding for the operational costs associated
with a Jakarta-based Ambassador to ASEAN.

DFAT Additional Estimates Statements
24
Table 2.1 Budgeted Expenses and Resources for Outcome 1
2011-12 2012-13
Actual Revised
expenses estimated
expenses
$'000 $'000
Program 1.1: Foreign Affairs and Trade Operations
Administered expenses
Ordinary annual services (Appropriation Act No. 1 & Bill No. 3) 11,424 6,525
Departmental expenses
Departmental appropriation 1 & 2 466,879 499,695
Expenses not requiring appropriation in the Budget year 3 & 4 44,879 46,549
Total for Program 1.1 523,182 552,769
Program 1.2: Payments to International Organisations
Administered expenses
Ordinary annual services (Appropriation Act No. 1 & Bill No. 3) 222,861 235,975
Total for Program 1.2 222,861 235,975
Program 1.3: Public Information and Public Dipomacy
Administered expenses
Ordinary annual services (Appropriation Act No. 1 & Bill No. 3) 28,843 26,878
Expenses not requiring appropriation in the Budget year 5 7,365 -
Total for Program 1.3 36,208 26,878
Outcome 1 Totals by appropriation type
Administered Expenses
Ordinary annual services (Appropriation Act No. 1 & Bill No. 3) 263,128 269,378
Departmental expenses
Departmental appropriation 1 & 2 466,879 499,695
Expenses not requiring appropriation in the Budget year 3, 4 & 5 52,244 46,549
Total expenses for Outcome 1 782,251 815,622
2011-12 2012-13
Average Staffing Level (number) 6 2,145 2,116
6 ASL figures are estimates only. ASL allocated to Outcome 1 may also, at times, contribute to Outcome
2 and Outcome 3
1 Departmental Appropriation combines "Ordinary annual services (Appropriation Bill No. 1 & 3)" and
"Revenue from independent sources (s.31)".
Outcome 1: The advancement of Australia’s international
strategic, security and economic interests including
through bilateral, regional and multilateral engagement on
Australian Government foreign and trade policy priorities
2 These expenses include a portion of an intra- entity amount of $58.304 million (2011- 12: $68.216 million)
representing rent paid by DFAT to the DFAT Overseas Property Officer which is eliminated upon
consolidation in the Comprehensive Income Statement (Table 3.2.1).3 Expenses not requiring appropriation in the Budget year is made up of Depreciation Expense,
Amortisation Expense, Makegood Expense, and Audit Fees.
4 The Department received Debt Forgiveness appropriation of $75.0 million in Appropriation Act (No.4)
2009- 10 for Debt- to- Health Swap with Government of Indonesia. This appropriation is to be expensed
over a period of 6 years in accordance with the schedule loan repayments with EFIC.
5 Surplus funds from previous expositions attributed to Exposition expenses in 2011- 12.

DFAT Additional Estimates Statements
25
Program 1.1: Foreign Affairs and Trade Operations Program 1.1 Objective
There is no change to the objective for Program 1.1 as expressed in the Portfolio Budget
Statements 2012-13.
Program 1.1 Expenses
2011-12 2012-13 2013-14 2014-15 2015-16
Actual Revised Forw ard Forw ard Forw ard
budget year 1 year 2 year 3
$'000 $'000 $'000 $'000 $'000
Annual administered expenses:
Administered items
Export Finance and Insurance Corporation
(EFIC) - National Interest Account Expenses 3,272 3,987 3,399 2,786 1,891
Hosting of the 35th Antarctic Treaty
Consultative Meeting 1,248 - - - -
Personal Benefits - Locally Engaged Staff
pension schemes 4,589 2,044 2,055 2,154 2,172
Other Adminstered Items 2,315 494 504 512 521
Annual departmental expenses:
Foreign Affairs and Trade Operations 466,879 499,695 519,710 544,646 541,230
Expenses not requiring appropriation in
the Budget year
Overseas development assistance -
Debt-to-Health Sw ap w ith Government
of Indonesia1 8,085 8,000 8,640 9,500 10,520
Total program expenses 523,182 552,769 572,477 598,168 594,895
36,794 38,169 38,570 38,561
1 The Department w as appropriated $75.0m in Appropriation Act (No.4) 2009-10 for Debt-to-Health
Sw ap w ith Government of Indonesia. This appropriation is to be expensed over a period of 6 years
in accordance w ith the schedule loan repayments w ith EFIC.
38,549
Program 1.1 Deliverables
Program 1.1 deliverables are affected by the Additional Estimates measure which
provides for Australia’s non-permanent membership of the United Nations Security
Council in 2013 and 2014. In addition to the deliverables listed in the Portfolio Budget
Statements 2012-13, we include the following deliverable:
- effective contribution to the United Nations Security Council as a
non-permanent member for the two calendar year 2013-2014 term. Program 1.1 Key Performance Indicators
There is no change to the key performance indicators for Program 1.1 as expressed in
the Portfolio Budget Statements 2012-13.

DFAT Additional Estimates Statements
26
Program 1.2: Payments to International Organisations
Program 1.2 Objective
There is no change to the objective for Program 1.2 as expressed in the Portfolio Budget
Statements 2012-13.
Program 1.2 Expenses
2011-12 2012-13 2013-14 2014-15 2015-16
Actual Revised Forw ard Forw ard Forw ard
budget year 1 year 2 year 3
$'000 $'000 $'000 $'000 $'000
Annual administered expenses:
Administered item
Payments to International Organisations 222,861 235,975 246,116 248,295 250,507
Total program expenses 222,861 235,975 246,116 248,295 250,507
Program 1.2 Deliverables
There is no change to the deliverables for Program 1.2 as expressed in the Portfolio
Budget Statements 2012-13.
Program 1.2 Key Performance Indicators
There is no change to the key performance indicators for Program 1.2 as expressed in
the Portfolio Budget Statements 2012-13.

DFAT Additional Estimates Statements
27
Program 1.3: Public Information Services and Public Diplomacy Program 1.3 Objective
There is no change to the objective for Program 1.3 as expressed in the Portfolio Budget
Statements 2012-13.
Program 1.3 Expenses
2011-12 2012-13 2013-14 2014-15 2015-16
Actual Revised Forw ard Forw ard Forw ard
budget year 1 year 2 year 3
$'000 $'000 $'000 $'000 $'000
Annual administered expenses:
Administered items
International Relations Grants Program 4,557 4,594 4,594 4,594 4,594
Australia Netw ork 19,766 20,334 20,822 21,237 21,663
Bali Peace Park - 450 - - -
Australia and New Zealand School of
Government China Advance Leadership
Program 3,000 - - - -
Auschw itz-Birkenau Foundation 500 - - - -
Special Account expenses:
Expositions Special Account 1,020 1,500 - - -
Expenses not requiring appropriation in
the Budget year 1 7,365 - - - -
Total program expenses 36,208 26,878 25,416 25,831 26,257
1 Surplus funds from previous expositions attributed to Exposition expenses in 2011-12.
Program 1.3 Deliverables
There is no change to the deliverables for Program 1.3 as expressed in the Portfolio
Budget Statements 2012-13.
Program 1.3 Key Performance Indicators
There is no change to the key performance indicators for Program 1.3 as expressed in
the Portfolio Budget Statements 2012-13.
Complete details of the Department of Foreign Affairs and Trade resources and
performance information can be found in the Portfolio Budget Statements 2012-13.
DFAT Additional Estimates Statements
28
OUTCOME 2: THE PROTECTION AND WELFARE OF AUSTRALIANS
ABROAD AND ACCESS TO SECURE INTERNATIONAL TRAVEL
DOCUMENTATION THROUGH TIMELY AND RESPONSIVE TRAVEL ADVICE
AND CONSULAR AND PASSPORT SERVICES IN AUSTRALIA AND
OVERSEAS
Outcome 2 Strategy There is no change to the Department’s Outcome Strategy as expressed in the Portfolio Budget Statements 2012-13.

DFAT Additional Estimates Statements
29
Table 2.1.2 Budgeted Expenses and Resources for Outcome 2
2011-12 2012-13
Actual Revised
expenses estimated
expenses
$'000 $'000
Program 2.1: Consular Services
Administered expenses
Ordinary annual services (Appropriation Act No. 1 & Bill No. 3) 101 200
Traveller's Emergency Loans 1 4 -
Departmental expenses
Departmental appropriation 2 & 5 68,365 66,857
Expenses not requiring appropriation in the Budget year 3 5,322 5,513
Total for Program 2.1 73,792 72,570
Program 2.2: Passport Services
Administered expenses
Special Appropriations 867 1,010
Departmental expenses
Departmental appropriation 2 182,303 223,801
Expenses not requiring appropriation in the Budget year 3 14,194 16,034
Total for Program 2.2 197,364 240,845
Outcome 2 Totals by appropriation type
Administered Expenses
Ordinary annual services (Appropriation Act No. 1 & Bill No. 3) 105 200
Special Appropriations 867 1,010
Departmental expenses
Departmental appropriation 2 250,668 290,658
Expenses not requiring appropriation in the Budget year 3 19,516 21,547
Total expenses for Outcome 2 271,156 313,415
2011-12 2012-13
Average Staffing Level (number) 4 1,071 1,041
5 These expenses include a portion of an intra- entity amount of $58.304 million (2011- 12: $68.216 million)
representing rent paid by DFAT to the DFAT Overseas Property Officer which is eliminated upon
consolidation in the Comprehensive Income Statement (Table 3.2.1).
Outcome 2: The protection and welfare of Australians
abroad and access to secure international travel
documentation through timely and responsive travel advice
and consular and passport services in Australia and
overseas
1 Travellers Emergency Loans Issued are initially recorded as receivables to the Commonwealth. Program
expenses relate to non- cash expenses resulting from write down and impairment of assets (i.e.
impairment of Travellers' Emergency Loans Receivable).
2 Departmental Appropriation combines "Ordinary annual services (Appropriation Bill No. 1 & 3)" and
"Revenue from independent sources (s.31)".
3 Expenses not requiring appropriation in the Budget year is made up of Depreciation Expense,
Amortisation Expense, Makegood Expense and Audit Fees.
4 ASL figures are estimates only. ASL allocated to Outcome 1 may also, at times, contribute to
Outcome 2.

DFAT Additional Estimates Statements
30
Program 2.1: Consular Services
Program 2.1 Objective
There is no change to the objective for Program 2.1 as expressed in the Portfolio Budget
Statements 2012-13.
Program 2.1 Expenses
Program 2.1 Deliverables
There is no change to the deliverables for Program 2.1 as expressed in the Portfolio
Budget Statements 2012-13.
Program 2.1 Key Performance Indicators
There is no change to the key performance indicators for Program 2.1 as expressed in
the Portfolio Budget Statements 2012-13.
2011-12 2012-13 2013-14 2014-15 2015-16
Actual Revised Forw ard Forw ard Forw ard
budget year 1 year 2 year 3
$'000 $'000 $'000 $'000 $'000
Annual administered expenses:
Administered items
Consular Emergency Services 101 200 200 200 200
Travellers' Emergency Loans 1 4 - - - -
Annual departmental expenses:
Foreign Affairs and Trade Operations 68,365 66,857 69,658 75,094 75,253
Expenses not requiring appropriation in
the Budget year
Total program expenses 73,792 72,570 75,445 80,920 81,080
5,322 5,513 5,626
1 Travellers Emergency Loans Issued are initially recorded as receivables to the Commonw ealth.
Program expenses relate to non-cash expenses resulting from w rite dow n and impairment of
assets (i.e. impairment of Travellers' Emergency Loans Receivable).
5,587 5,627
DFAT Additional Estimates Statements
31
Program 2.2: Passport Services
Program 2.2 Objective
There is no change to the objective for Program 2.2 as expressed in the Portfolio Budget
Statements 2012-13.
Program 2.2 Expenses
Program 2.2 Deliverables
There is no change to the deliverables for Program 2.2 as expressed in the Portfolio
Budget Statements 2012-13.
Program 2.2 Key Performance Indicators
There is no change to the key performance indicators for Program 2.2 as expressed in
the Portfolio Budget Statements 2012-13.
2011-12 2012-13 2013-14 2014-15 2015-16
Actual Revised Forw ard Forw ard Forw ard
budget year 1 year 2 year 3
$'000 $'000 $'000 $'000 $'000
Annual administered expenses:
Special appropriations:
Special Appropriation FMA Act s.28 867 1,010 1,010 1,010 1,010
Annual departmental expenses:
Foreign Affairs and Trade Operations 182,303 223,801 234,603 243,153 254,082
Expenses not requiring appropriation in
the Budget year 14,194 16,034 16,196 15,672 15,674
Total program expenses 197,364 240,845 251,809 259,835 270,766

DFAT Additional Estimates Statements
32
OUTCOME 3: A SECURE AUSTRALIAN GOVERNMENT PRESENCE
OVERSEAS THROUGH THE PROVISION OF SECURITY SERVICES AND
INFORMATION AND COMMUNICATIONS TECHNOLOGY INFRASTRUCTURE, AND THE MANAGEMENT OF THE COMMONWEALTH'S OVERSEAS OWNED
ESTATE
Outcome 3 Strategy
There is no change to the Department’s Outcome Strategy as expressed in the Portfolio
Budget Statements 2012-13.

DFAT Additional Estimates Statements
33
Table 2.1.3 Budgeted Expenses and Resources for Outcome 3
2011-12 2012-13
Actual Revised
expenses estimated
expenses
$'000 $'000
Program 3.1: Other (Departmental)
Departmental expenses
Departmental appropriation 1 & 4 169,904 174,493
Expenses not requiring appropriation in the Budget year 2 13,228 9,793
Total for Program 3.1 183,132 184,286
Program 3.2: Overseas Property
Departmental expenses
Special Accounts 71,350 72,710
Total for Program 3.2 71,350 72,710
Outcome 3 Totals by appropriation type
Departmental expenses
Departmental appropriation 1 169,904 174,493
Special Accounts 71,350 72,710
Expenses not requiring appropriation in the Budget year 2 13,228 9,793
Total expenses for Outcome 3 254,482 256,996
2011-12 2012-13
Average Staffing Level (number) 3 670 712
Outcome 3: A secure Australian Government presence
overseas through the provision of security services and
information and communications technology
infrastructure, and the management of the
Commonwealth's overseas owned estate
4 These expenses include a portion of an intra- entity amount of $58.304 million (2011- 12: $68.216 million)
representing rent paid by DFAT to the DFAT Overseas Property Officer which is eliminated upon
consolidation in the Comprehensive Income Statement (Table 3.2.1).
3 ASL figures are estimates only. ASL allocated to Outcome 1 may also, at times, contribute to
Outcome 3.
1 Departmental Appropriation combines "Ordinary annual services (Appropriation Bill No. 1 & 3)" and
"Revenue from independent sources (s.31)".
2 Expenses not requiring appropriation in the Budget year is made up of Depreciation Expense,
Amortisation Expense, Makegood Expense and Audit Fees.

DFAT Additional Estimates Statements
34
Program 3.1: Foreign Affairs and Trade Operations
Program 3.1 Objective
There is no change to the objective for Program 3.1 as expressed in the Portfolio Budget
Statements 2012-13.
Program 3.1 Expenses 2011-12 2012-13 2013-14 2014-15 2015-16
Actual Revised Forw ard Forw ard Forw ard
budget year 1 year 2 year 3
$'000 $'000 $'000 $'000 $'000
Annual departmental expenses:
Foreign Affairs and Trade Operations 169,904 174,493 175,801 119,490 119,662
Expenses not requiring appropriation in
the Budget year
Total program expenses 183,132 184,286 185,738 129,513 129,688
13,228 9,793 9,937 10,023 10,026
Program 3.1 Deliverables
There is no change to the deliverables for Program 3.1 as expressed in the Portfolio
Budget Statements 2012-13.
Program 3.1 Key Performance Indicators
There is no change to the key performance indicators for Program 3.1 as expressed in
the Portfolio Budget Statements 2012-13.
Program 3.2: Overseas Property
Program 3.2 Objective
There is no change to the objective for Program 3.2 as expressed in the Portfolio Budget
Statements 2012-13.
Program 3.2 Expenses 2011-12 2012-13 2013-14 2014-15 2015-16
Actual Revised Forw ard Forw ard Forw ard
budget year 1 year 2 year 3
$'000 $'000 $'000 $'000 $'000
Special Account Expenses:
Overseas Property Special Account -
Finance Determination 2002-01 (D) 71,350 72,710 72,756 75,688 80,604
Total program expenses 71,350 72,710 72,756 75,688 80,604
Program 3.2 Deliverables
There is no change to the deliverables for Program 3.2 as expressed in the Portfolio
Budget Statements 2012-13.
Program 3.2 Key Performance Indicators
There is no change to the key performance indicators for Program 3.2 as expressed in
the Portfolio Budget Statements 2012-13.

DFAT Additional Estimates Statements
35
Section 3: Explanatory tables and budgeted financial statements
3.1 EXPLANATORY TABLES
Estimates of special account flows
Special accounts provide a means to set aside and record amounts used for specified
purposes. Table 3.1.1 shows the expected additions (receipts) and reductions
(payments) for each account used by DFAT. The corresponding table in the Portfolio
Budget Statements 2012-13 is Table 3.1.2.

DFAT Additional Estimates Statements
36
Table 3.1.1: Estimates of special account flows
Opening Closing
balance Receipts Payments Adjustments balance
2012-13 2012-13 2012-13 2012-13 2012-13
2011-12 2011-12 2011-12 2011-12 2011-12
Outcome $'000 $'000 $'000 $'000 $'000
Administered Payments and
Receipts for Other Entities
Special Account - FMA Act
1997 s20 (A)
1 5,000 200,000 (200,000) - 5,000
5,000 229,209 (229,209) - 5,000
Consular Services Special
Account - FMA Act 1997 s20
(A)
2 44 100 (100) - 44
44 82 (82) - 44
Expositions Special Accounts -
FMA Act 1997 s20 (A) 1 748 1,500 (1,500) - 748
7,391 1,343 (7,986) - 748
Services for Other Entities
and Trust Moneys - Foreign
Affairs and Trade Special
Account (A)
1 672 2,000 (2,000) - 672
3,070 2,195 (4,593) - 672
Overseas Property Special
Account - DFAT - s20 FMA
Act Det 2002/01 (D)
3 440,590 92,185 (168,223) - 364,552
393,250 117,559 (70,219) - 440,590
Total Special Accounts
2012-13 Budget estimate 447,054 295,785 (371,823) - 371,016
Total Special Accounts
2011-12 actual 408,755 350,388 (312,089) - 447,054
(A) = Administered
(D) = Departmental

DFAT Additional Estimates Statements
37
3.2 BUDGETED FINANCIAL STATEMENTS
3.2.1 Analysis of budgeted financial statements
Budget Departmental Income Statement
The Department will receive additional appropriation funding of $10.3 million
(excluding equity injections) in 2012-13. Of the $10.3 million, $5.6 million relates to a
prior year adjustment to passport funding due to a higher than expected number of
passports issued in 2011-12. Funding for new measures of $1.5 million is attributable to
United Nations Security Council and savings measures for fire service levy and public
service efficiencies. The remaining amount of $3.2 million is attributable to other
adjustments, primarily relating to fringe benefits tax, passports, foreign exchange and
overseas inflation.
The Income Statement shows a budgeted deficit in 2012-13 of $50.0 million, due to
removal of funding for depreciation and amortisation under the Net Cash funding
arrangements. Adjusting for the changed funding arrangements, the operating results
attributable to Departmental is a surplus of $19.4 million in 2012-13, all of which
relates to the Overseas Property Special Account (OPSA). Surpluses are necessary in
the OPSA to fund capital investment projects.
Budgeted Departmental Balance Sheet
The Department will receive an additional equity injection of $5.3 million in 2012-13
for the United Nations Security Council and for an increase in security funding for
Australia's civilian engagement in Afghanistan.
For 2012-13, the Department’s non-financial asset position is budgeted to be
$2,265.7 million at year-end. The major asset component is $1,797.3 million for Land
and Buildings which includes $1,592.8 million managed in the Overseas Property
Special Account.
Schedule of budgeted income and expenses administered on behalf of government
Administered income has been budgeted at $624.0 million in 2012-13. Total revenue is
estimated to decrease by $19.8 million since the Portfolio Budget Statements 2012-13. This
is primarily due to an expected decrease in passport revenue ($20.0 million) resulting
from an estimated decrease in passport demand.
Total expenses administered on behalf of government are budgeted at $278.59 million.
Total estimated expenses have decreased by $4.75 million since the Portfolio Budget
Statements 2012-13. This is primarily owing to a net decrease of $4.03 million in the
forecast Payments to International Organisations Program resulting from an estimated
decrease ($9.02 million) in United Nations Peacekeeping Operation contributions offset
by parameter adjustments for foreign exchange fluctuations ($4.99 million).

DFAT Additional Estimates Statements
38
Schedule of budgeted assets and liabilities administered on behalf of government
This statement has been revised since the publication of the Portfolio Budget Statements
2012-13 to reflect the final actual closing balances in 2011-12. Assets mainly represent
the investment in the government entity EFIC ($418.06 million). Liabilities comprise
primarily amounts relating to payables on the National Interest Account and Locally
Engaged Staff Pension Schemes.
Schedule of budgeted administered cash flows
Administered cash receipts generally move in line with administered revenue with a
$19.94 million decrease forecast since the Portfolio Budget Statements 2012-13. Total cash
payments are estimated to decrease by $4.94 million and relate primarily to the
$4.03 million net decrease in the forecast Payments to International Organisations
Program.

DFAT Additional Estimates Statements
39
3.2.2 Budgeted financial statements
Table 3.2.1 Comprehensive Income Statement (Showing Net Cost of Services)
Table continued on following page.
Actual Revised Forw ard Forw ard Forw ard
budget estimate estimate estimate
2011-12 2012-13 2013-14 2014-15 2015-16
$'000 $'000 $'000 $'000 $'000
EXPENSES
Employee benefits 443,703 433,251 439,885 431,701 434,913
Suppliers 477,800 515,830 545,739 534,919 537,601
Grants 3,221 5,000 5,000 5,000 5,000
Depreciation and amortisation 91,588 93,414 94,593 96,491 99,941
Finance costs 2,620 - - - -
Write-dow n and impairment of assets 1,194 - - - -
Net foreign exchange losses 2,051 - - - -
Losses from asset sales 6,091 6 - - -
Other Expenses 70 103 103 103 103
Total expenses 1,028,338 1,047,604 1,085,320 1,068,214 1,077,558
LESS:
OWN-SOURCE INCOME
Own-source revenue
Sale of goods and rendering of services 80,547 73,299 73,299 73,299 73,299
Operating lease rental revenue 38,352 32,345 29,668 32,478 33,939
Other revenue 9,905 8,300 8,300 8,300 8,300
Total own-source revenue 128,804 113,944 111,267 114,077 115,538
Gains
Reversal of previous Asset w rite-
dow ns and impairments 16,691 - - - -
Other 6,409 411 411 411 411
Total gains 23,100 411 411 411 411
Total own-source income 151,904 114,355 111,678 114,488 115,949
Net cost of (contribution by)
services 876,434 933,249 973,642 953,726 961,609
Revenue from Government 821,534 883,247 918,173 900,784 908,628 * * * *
Surplus (Deficit) attributable to
the Australian Government (54,900) (50,002) (55,469) (52,942) (52,981)
OTHER COMPREHENSIVE INCOME
Changes in asset revaluation surplus 63,001 - - - - -
Total other comprehensive income 63,001 - - - -
Total comprehensive income (loss) 8,101 (50,002) (55,469) (52,942) (52,981)
Total comprehensive income (loss)
attributable to the Australian
Government 8,101 (50,002) (55,469) (52,942) (52,981)

DFAT Additional Estimates Statements
40
Table 3.2.1 Comprehensive Income Statement (Showing Net Cost of Services) (continued)
Note: Impact of Net Cash Apppropriation Arrangements
2011-12 2012-13 2013-14 2014-15 2015-16
$'000 $'000 $'000 $'000 $'000
Total Comprehensive Income
(loss) less depreciation/amortisation
expenses previously funded through
revenue appropriations. 77,228 19,476 14,009 16,538 16,496
plus depreciation/amortisation expenses
previously funded through revenue
appropriations1 (69,127) (69,478) (69,478) (69,480) (69,477)
Total Comprehensive Income
(loss) - as per the Statement of
Comprehensive Income 8,101 (50,002) (55,469) (52,942) (52,981)
Prepared on Australian Accounting Standards basis
1 From 2010-11, the Government introduced net cash appropriation arrangements w here Appropriation Act
No. 1 or Bill No. 3 revenue appropriations for the depreciation/amortisation expenses of FMA Act agencies
w ere replaced w ith a separate capital budget (the Departmental Capital Budget, or DCB) provided through
Appropriation Act No. 1 or Bill No. 3 equity appropriations. For information regarding DCBs, please refer to
Table 3.2.5 Departmental Capital Budget Statement.

DFAT Additional Estimates Statements
41
Table 3.2.2: Budgeted departmental balance sheet (as at 30 June) Actual Revised Forw ard Forw ard Forw ard
budget estimate estimate estimate
2011-12 2012-13 2013-14 2014-15 2015-16
$'000 $'000 $'000 $'000 $'000
ASSETS
Financial assets
Cash and cash equivalents 54,787 59,003 60,613 60,613 60,613
Trade and other receivables 943,798 831,229 660,529 545,173 459,445
Total financial assets 998,585 890,232 721,142 605,786 520,058
Non-financial assets
Land and buildings 1,783,950 1,797,377 1,885,241 1,960,177 2,237,344
Property, plant and equipment 122,057 187,722 245,081 277,635 316,443
Intangibles 20,889 20,123 17,827 19,404 22,852
Inventories 41,976 41,976 41,976 41,976 41,976
Other non-financial assets 124,683 218,512 341,995 412,380 236,144
Total non-financial assets 2,093,555 2,265,710 2,532,120 2,711,572 2,854,759
Assets held for sale 1,599 1,599 1,599 1,599 1,599
Total assets 3,093,739 3,157,541 3,254,861 3,318,957 3,376,416
LIABILITIES
Payables
Suppliers 76,099 76,099 76,099 76,099 76,099
Other payables 21,123 21,123 21,123 21,123 21,123
Total payables 97,222 97,222 97,222 97,222 97,222
Provisions
Employee provisions 146,217 146,217 146,217 146,217 146,217
Other 26,679 26,679 26,679 26,679 26,679
Total provisions 172,896 172,896 172,896 172,896 172,896
Total liabilities 270,118 270,118 270,118 270,118 270,118
Net assets 2,823,621 2,887,423 2,984,743 3,048,839 3,106,298
EQUITY
Parent entity interest
Contributed equity 1,841,632 1,966,989 2,130,760 2,230,892 2,300,188
Reserves 390,341 393,044 382,062 398,968 440,112
Retained surplus 591,648 527,390 471,921 418,979 365,998
Total parent entity interest 2,823,621 2,887,423 2,984,743 3,048,839 3,106,298
Total Equity 2,823,621 2,887,423 2,984,743 3,048,839 3,106,298
Prepared on Australian Accounting Standards basis

DFAT Additional Estimates Statements
42
Table 3.2.3: Departmental statement of changes in equity — summary of movement (Budget year 2012-13)
Retained Asset Other Contributed Total
earnings revaluation reserves equity/ equity
reserve capital
$'000 $'000 $'000 $'000 $'000
Opening balance as at 1 July 2012
Balance carried forw ard from 591,648 390,341 - 1,841,632 2,823,621
previous period
Adjusted opening balance 591,648 390,341 - 1,841,632 2,823,621
Comprehensive income
Other comprehensive income - 2,703 - - -
Surplus (deficit) for the period (50,002) - - - -
Total comprehensive income (50,002) 2,703 - - -
of w hich:
Attributable to the Australian
Government(50,002) 2,703 - - -
Transactions with owners
Distributions to owners
Returns of capital
Cash transfers to the OPA (14,256) - - - -
Contributions by owners
Equity Injection - - - 62,101 -
Departmental Capital Budget (DCBs) - - - 63,256 -
Sub-total transactions with owners (14,256) - - 125,357 -
Estimated closing balance
as at 30 June 2013527,390 393,044 - 1,966,989 2,887,423
Prepared on Australian Accounting Standards basis

DFAT Additional Estimates Statements
43
Table 3.2.4: Budgeted departmental statement of cash flows (as at 30 June) Actual Revised Forw ard Forw ard Forw ard
budget estimate estimate estimate
2011-12 2012-13 2013-14 2014-15 2015-16
$'000 $'000 $'000 $'000 $'000
OPERATING ACTIVITIES
Cash received
Appropriations 936,383 919,691 959,803 940,999 941,991
Sale of goods and rendering of services143,141 107,750 104,391 107,966 106,968
Net GST received 29,895 31,375 31,375 31,375 31,375
Other - 8,300 8,300 8,300 8,300
Total cash received 1,109,419 1,067,116 1,103,869 1,088,640 1,088,634
Cash used
Employees 429,590 431,164 437,779 429,578 434,287
Suppliers 517,326 557,170 586,511 576,609 569,184
Section 31 receipts transferred to
OPA159,224 14,164 - - -
Other 3,222 5,103 5,103 5,103 5,103
Total cash used 1,109,362 1,007,601 1,029,393 1,011,290 1,008,574
Net cash from (used by)
operating activities 57 59,515 74,476 77,350 80,060
INVESTING ACTIVITIES
Cash received
Proceeds from sales of property,
plant, equipment and intangibles 1,403 98 - - -
Total cash received 1,403 98 - - -
Cash used
Purchase of property, plant,
equipment and intangibles 111,287 262,464 370,499 258,611 201,984
Total cash used 111,287 262,464 370,499 258,611 201,984
Net cash from (used by)
investing activities (109,884) (262,366) (370,499) (258,611) (201,984)
FINANCING ACTIVITIES
Cash received
Contributed equity 110,019 207,100 297,633 181,261 121,654
Total cash received 110,019 207,100 297,633 181,261 121,654
Cash used
Repayments of contributed equity 1,514 92 - - -
Total cash used 1,514 92 - - -
Net cash from (used by)
financing activities 108,505 207,008 297,633 181,261 121,654
Net increase (decrease)
in cash held (1,322) 4,157 1,610 - (270)
Cash and cash equivalents at the
beginning of the reporting period 58,160 54,787 58,944 60,554 60,554
Effect of exchange rate movements
on cash and cash equivalents at
the beginning of reporting period (2,051)
Cash and cash equivalents at the
end of the reporting period 54,787 58,944 60,554 60,554 60,284
Prepared on Australian Accounting Standards basis

DFAT Additional Estimates Statements
44
Table 3.2.5: Capital Budget Statement — Departmental Actual Revised Forw ard Forw ard Forw ard
budget estimate estimate estimate
2011-12 2012-13 2013-14 2014-15 2015-16
$'000 $'000 $'000 $'000 $'000
NEW CAPITAL APPROPRIATIONS
Capital budget - Act No. 1 (DCB) 73,446 63,256 94,303 67,746 68,477
Equity injections - Act No. 2 72,005 62,101 69,468 32,386 819
Total new capital appropriations 145,451 125,357 163,771 100,132 69,296
Provided for:
Purchase of non-financial assets 145,451 125,357 163,771 100,132 69,296
Total Items 145,451 125,357 163,771 100,132 69,296
PURCHASE OF NON-FINANCIAL
ASSETS
Funded by capital appropriations 174,250 72,179 103,210 66,187 34,189
Funded by capital appropriation - DCB 278,437 68,200 94,303 67,746 68,477
Funded internally from 105,979 28,756 50,989 54,719 275,554
departmental resources 3
TOTAL AMOUNT SPENT 258,666 169,135 248,502 188,652 378,220
RECONCILIATION OF CASH
USED TO ACQUIRE ASSETS
TO ASSET MOVEMENT TABLE
Total accrual purchases 258,666 169,135 248,502 188,652 378,220
Total cash used to
acquire assets 258,666 169,135 248,502 188,652 378,220
1 Includes both current and prior Act 2 and Bills 4 appropriations and special capital appropriations
2 Does not include annual f inance lease costs. Include purchase from current and previous
years' Departmental Capital Budgets (DCBs).
3 Includes the follow ing sources of funding:
- current and prior year Act 1 and Bills 3 appropriations (excluding amounts from the DCB).
- donations and contributions
- gifts
- internally developed assets
- s31 relevant agency receipts (for FMA agencies only)
- proceeds from the sale of assets
Prepared on Australian Accounting Standards basis

DFAT Additional Estimates Statements
45
Table 3.2.6: Statement of Asset Movements (2012-13)
Land Buildings Other property, Computer L&B, IP&E Total
plant and software and held for sale
equipment intangibles
$'000 $'000 $'000 $'000 $'000 $'000
As a t 1 July 2 0 12
Gross book value 919,972 986,375 181,737 61,369 4,466 2,153,919
Accumulated depreciation/amortisation - (122,397) (59,680) (40,480) (2,867) (225,424)
and impairment
Ope ning ne t book ba la nc e 9 19 ,9 7 2 8 6 3 ,9 7 8 12 2 ,0 5 7 2 0 ,8 8 9 1,5 9 9 1,9 2 8 ,4 9 5
CAPITAL ASSET ADDITIONS
Estima te d e xpe nditure on
ne w or re pla c e me nt a sse ts
By purchase - appropriation equity 1
appropriation ordinary annual services 2
- 64,253 100,892 3,990 - 169,135
Tota l a dditions - 6 4 ,2 5 3 10 0 ,8 9 2 3 ,9 9 0 - 16 9 ,13 5
Othe r move me nts
Depreciation/amortisation expense - (30,264) (35,227) (4,756) - (70,247)
Disposals 3
(98) - - - - (98)
Other 3,143 (23,607) - - - (20,464)
Tota l a dditions 3 ,0 4 5 (5 3 ,8 7 1) (3 5 ,2 2 7 ) (4 ,7 5 6 ) - (9 0 ,8 0 9 )
As a t 3 0 June 2 0 13
Gross book value 923,017 1,027,021 282,629 65,359 4,466 2,302,492
Accumulated depreciation/amortisation - (152,661) (94,907) (45,236) (2,867) (295,671)
and impairment
Closing ne t book ba la nc e 9 2 3 ,0 17 8 7 4 ,3 6 0 18 7 ,7 2 2 2 0 ,12 3 1,5 9 9 2 ,0 0 6 ,8 2 1
1 "Appropriation equity" refers to equity injections appropriations provided through Appropriation Acts No. 2 and Bill No. 4 2012-13
2 "Appropriation ordinary annual services" refers to funding provided through Appropriation Act No. 1 and Bill No. 3 2012-13 for
depreciation / amortisation expenses, DCBs or other operational expenses.
3 Proceeds may be returned to the OPA.
Prepared on Australian Accounting Standards basis

DFAT Additional Estimates Statements
46
Schedule of administered activity
Table 3.2.7: Schedule of budgeted income and expenses administered on behalf of government (for the period ended 30 June)
Actual Revised Forw ard Forw ard Forw ard
budget estimate estimate estimate
2011-12 2012-13 2013-14 2014-15 2015-16
$'000 $'000 $'000 $'000 $'000
EXPENSES ADMINISTERED ON
BEHALF OF GOVERNMENT
Employee benefits 5,479 2,274 2,055 2,154 2,172
Suppliers 28,968 23,108 22,336 22,759 23,194
Grants and contributions 231,011 241,219 250,910 253,089 255,301
Write-dow n and impairment of assets 4 - - - -
Other expenses 12,242 11,987 12,039 12,286 12,411
Foreign Exchange Losses 1,846 - - - -
Total expenses administered
on behalf of Government 279,550 278,588 287,340 290,288 293,078
LESS:
OWN-SOURCE INCOME
Own-source revenue
Non-taxation revenue
Sale of goods and rendering
of services 357,126 370,543 404,741 439,536 477,735
Interest 4,678 3,928 3,098 2,141 1,048
Dividends 30,194 226,800 24,100 16,000 16,400
Other revenue 41,414 22,737 22,828 23,519 24,711
Total non-taxation revenue 433,412 624,008 454,767 481,196 519,894
Total own-source revenues
administered on behalf of
Government 433,412 624,008 454,767 481,196 519,894
Gains
Foreign Exchange - - - - -
Total gains administered
on behalf of Government - - - - -
Total own-sourced income
administered on behalf of
Government 433,412 624,008 454,767 481,196 519,894
Net Cost of (contribution by)
services 153,862 345,420 167,427 190,908 226,816
OTHER COMPREHENSIVE INCOME
Actuarial gains/losses on defined
benefit plans (6,155) - - - -
Movement in carrying amount of
investments 9,981 - - - -
Total other comprehensive income 3,826 - - - -
Prepared on Australian Accounting Standards basis

DFAT Additional Estimates Statements
47
Table 3.2.8: Schedule of budgeted assets and liabilities administered on behalf of government (as at 30 June)
Actual Revised Forw ard Forw ard Forw ard
budget estimate estimate estimate
2011-12 2012-13 2013-14 2014-15 2015-16
$'000 $'000 $'000 $'000 $'000
ASSETS ADMINISTERED ON
BEHALF OF GOVERNMENT
Financial assets
Cash and cash equivalents 191 191 191 191 191
Trade and other Receivables 31,863 2,219 2,769 3,319 3,869
Investments accounted for
using the equity method 418,063 418,063 418,063 418,063 418,063
Accrued Revenue 1,784 1,784 1,784 1,784 1,784
Total financial assets 451,901 422,257 422,807 423,357 423,907
Non-financial assets
Other non-financial assets 1,650 1,650 1,650 1,650 1,650
Total non-financial assets 1,650 1,650 1,650 1,650 1,650
Total assets administered
on behalf of Government 453,551 423,907 424,457 425,007 425,557
LIABILITIES ADMINISTERED ON
BEHALF OF GOVERNMENT
Payables
Suppliers 1,242 1,242 1,242 1,242 1,242
Other payables 19,438 13,016 13,016 13,016 13,016
Total payables 20,680 14,258 14,258 14,258 14,258
Provisions
Employee provisions 40,272 40,272 40,272 40,272 40,272
Total provisions 40,272 40,272 40,272 40,272 40,272
Total liabilities administered
on behalf of Government 60,952 54,530 54,530 54,530 54,530
Net assets/(liabilities) 392,599 369,377 369,927 370,477 371,027
Prepared on Australian Accounting Standards basis

DFAT Additional Estimates Statements
48
Table 3.2.9: Schedule of budgeted administered cash flows (for the period ended 30 June)
Actual Revised Forw ard Forw ard Forw ard
budget estimate estimate estimate
2011-12 2012-13 2013-14 2014-15 2015-16
$'000 $'000 $'000 $'000 $'000
OPERATING ACTIVITIES
Cash received
Sales of goods and rendering 354,398 370,543 404,741 439,536 477,735
of services
Interest 109 116 116 116 116
Dividends - 257,000 24,100 16,000 16,400
Net GST received 2,129 2,030 2,080 2,120 2,170
Other 23,179 21,678 20,969 22,665 24,981
Total cash received 379,815 651,367 452,006 480,437 521,402
Cash used
Grants and contributions 218,918 241,769 251,460 253,639 255,851
Employees 890 230 - - -
Personal benefits 1,737 2,044 2,055 2,154 2,172
Suppliers 28,580 23,108 22,336 22,759 23,194
Net GST paid 2,302 2,030 2,080 2,120 2,170
Borrow ing costs 5,765 3,127 2,342 1,566 672
Other 9,061 9,400 10,040 10,800 11,720
Total cash used 267,253 281,708 290,313 293,038 295,779
Net cash from (used by)
operating activities 112,562 369,659 161,693 187,399 225,623
Net increase (decrease) in
cash held
Cash and cash equivalents at
beginning of reporting period 2,528 191 191 191 191
Cash from Official Public Account for:
- Appropriations 256,737 279,326 287,974 289,412 293,609
Cash to Official Public Account for:
- Appropriations (371,636) (648,985) (449,667) (476,811) (519,232)
Cash and cash equivalents at end
of reporting period 191 191 191 191 191
Prepared on Australian Accounting Standards basis
DFAT Additional Estimates Statements
49
Notes to the financial statements Departmental Financial Statements and Schedule of Administered Activity
Under the Australian Government’s accrual-based budgeting framework, and
consistent with Australian Accounting Standards, transactions that agencies control
(Departmental transactions) are separately budgeted for and reported on from
transactions agencies do not have control over (Administered transactions). This
ensures that agencies are only held fully accountable for the transactions over which
they have control.
Departmental items are those assets, liabilities, revenues and expenses in
relation to an agency or authority that are controlled by the agency.
Departmental expenses include employee and supplier expenses and other
administrative costs, which are incurred by the agency in providing its goods
and services.
Administered items are revenues, expenses, assets and liabilities that are
managed by an agency or authority on behalf of the Government according to
set Government directions. Administered expenses include subsidies, grants
and personal benefit payments and Administered revenues include taxes, fees,
fines and excises.
Appropriations in the accrual budgeting framework
Under the Australian Government’s accrual budgeting framework, separate annual
appropriations are provided for:
Departmental price of outputs appropriations: representing the Government’s
funding for outputs from agencies;
Departmental capital appropriations: for investments by the Government for
either additional equity or loans to agencies;
Administered expense appropriations: for the estimated Administered
expenses relating to an existing outcome, a new outcome or a Specific Purpose
Payment to the states; and
Administered capital appropriations: for increases in Administered equity
through funding non-expense Administered payments.
Special appropriations fund the majority of payments from the Consolidated Revenue
Fund (especially those that are entitlement driven or involve transfers to State
governments).
Administered investments in controlled entities
The Department has one administered investment in the Export Finance and Insurance
Corporation with an estimated asset value of $418.1 million as at 30 June 2012.
Asset Valuation
In accordance with current Australian accounting standards and the Finance Minister’s
Orders the Department’s assets are carried at fair value.

50

51
AUSTRALIAN TRADE COMMISSION (AUSTRADE)
Section 1: Agency overview and resources ............................................................. 52
1.1 Strategic Direction .................................................................................................. 52
1.2 Agency Resource Statement ................................................................................. 55
1.3 Agency Measures table .......................................................................................... 56
1.4 Additional Estimates and variations ....................................................................... 57
1.5 Breakdown of Additional Estimates by appropriation bill ....................................... 58
Section 2: Revisions to agency Outcomes and Planned Performance ................. 59
2.1 Resources and performance information ............................................................... 59
Section 3: Explanatory tables and budgeted financial statements ....................... 63
3.1 Explanatory tables .................................................................................................. 63
3.2 Budgeted financial statements ............................................................................... 64

Austrade Additional Estimates Statements
52
AUSTRALIAN TRADE COMMISSION (AUSTRADE)
Section 1: Agency overview and resources
1.1 STRATEGIC DIRECTION
The Australian Trade Commission (Austrade) is the Australian Government’s
international trade, education and investment promotion agency and operates as a
statutory agency within the Foreign Affairs and Trade portfolio.
Austrade’s outcomes are:
• to advance Australia’s trade, investment and education promotion interests
through information, advice and services to business, the education sector and
governments, and
• the protection and welfare of Australians abroad through timely and
responsive consular and passport services in specific locations overseas.
A comprehensive review of Austrade was completed in 2010 with the results
announced by the Minister for Trade in May 2011. The resulting changes in Austrade’s
structure and operations have been progressively implemented, and 2012-13 will see
the full implementation of Austrade’s new operating model.
In 2012-13, Austrade’s international trade activities will be clearly directed towards
growth and emerging markets that offer commercial potential and provide
opportunities aligned with Australian capability (including education), and where
there is a clear role for government through Austrade. In established markets,
Austrade will focus predominantly on opportunities for inward investment and
education services. The additional budget savings to be delivered by Austrade in
2012-13, as part of whole of Government savings requirements, will be made within
this overall strategic context.
Austrade will deliver practical in-market support, advice and insights to Australian
businesses and institutions. These activities provide the most value in markets where
language and business culture can be a barrier; where there is less openness of
regulatory frameworks and transparency of business processes; where there are
difficulties accessing distribution channels and commercial connections; and where the
value of the ‘badge of government’ is highest.
Austrade’s network of offices across 49 markets is now weighted towards growth and
emerging markets that have high growth potential, including new Posts in Mongolia

Austrade Additional Estimates Statements
53
and Colombia. Austrade’s activities in these markets will have a strong focus on trade
development, as well as marketing of education services.
Through its international network, Austrade will draw on its relationships and
connections with international customers, investors and decision makers to identify
commercial opportunities of value and relevance to Australia.
In established markets such as North America and Europe, Austrade’s focus will be
predominantly on inward investment and education services, with greater use of
partners, referrals and online information and services to support Australia’s exporters
in these markets.
Austrade’s support for inward investment activity will include the proactive attraction
of foreign direct investment aligned to agreed government priorities, supported by the
promotion in target markets of Australia’s attractiveness as a destination for
investment. Where international businesses have indicated an interest in Australia as a
potential destination for investing, Austrade will work in partnership with state and
territory governments to facilitate such investments.
Austrade will continue to promote the growth and sustainable development of
Australia’s international education and training services, and support the international
standing of Australia’s education system as world class and globally connected.
Austrade will assist the sector in the repositioning of Australian education through the
Future Unlimited branding.
Austrade will lead the use and activation of the Australia Unlimited nation brand on
behalf of the Government. The broad objective of the Building Brand Australia
Program, expressed through the brand Australia Unlimited, is to enrich Australia’s
global reputation by enhancing awareness of contemporary Australian credentials in
business, science, education, technology, creativity and not-for-profit activity. As part
of this work, Austrade will develop and promote contemporary examples of
Australian capability. Throughout the fourth and final year of the current funding for
the Building Brand Australia Program, Austrade will work with industry to encourage
use of Australia Unlimited and support activities with the potential to showcase
Australia’s credentials to influential international audiences.
Within Australia, Austrade staff are in 12 locations and Austrade manages the
TradeStart network of export advisers across 30 locations in metropolitan and regional
Australia. TradeStart extends the international trade, investment and education
services provided to Australian firms and institutions through partnering with state,
territory and local governments and industry bodies in delivery of these services.
The Export Market Development Grants (EMDG) scheme, which assists small and
medium-sized Australian businesses to address the challenges associated with
undertaking promotion in export markets and achieve international business growth,
will continue to be delivered by Austrade. The Government has announced its

Austrade Additional Estimates Statements
54
intention to align the scheme with the Government’s emphasis on East Asian and
emerging and growth markets, while returning an on-going saving to the budget of
$25 million per annum. This closer alignment involves increasing the number of grants
available in East Asian and emerging and growth markets to eight and reducing the
number of grants available in certain developed markets to five.
Austrade will administer the Asian Century Business Engagement (ACBE) plan which
is a new program that will run from 1 July 2013. The plan has been established to assist
member-based business organisations strengthen linkages between Australia and Asia
and harness commercial opportunities in Asia for small to medium sized Australian
businesses.
Draft guidelines were announced in December 2012. The final guidelines will be
released at the same time as applications open for the ACBE plan in late February 2013.
Austrade will support Australians in specific locations overseas through the delivery
of timely consular and passport services.

Austrade Additional Estimates Statements
55
1.2 AGENCY RESOURCE STATEMENT
The Agency Resource Statement details the resourcing for Austrade at Additional
Estimates. Table 1.1 outlines the total resourcing available from all sources for the
2012-13 Budget year, including variations through Appropriation Bills No.3 and No.4,
special appropriations and special accounts.
Table 1.1: Austrade resource statement — Additional estimates for 2012-13 as at Additional Estimates February 2013
Estimate as Proposed Total Total
at Budget+
Additional=
estimate available
Estimate
at
Additional appropriation
Estimates
2012- 13 2012- 13 2012- 13 2011- 12
$'000 $'000 $'000 $'000
Ordina ry a nnua l se rvic e s1
De pa rtme nta l a ppropria tion
Prior year departmental appropriation2 38,618 - 38,618 41,826
Departmental appropriation3 176,537 2,755 179,292 183,048
s31 Relevant agency receipts4 23,842 - 23,842 23,842
Tota l 38,618 2,755 241,752 248,716
Administe re d e xpe nse s
Outcome 1 150,400 - 150,400 150,400
Tota l 150,400 - 150,400 150,400
Tota l ordina ry a nnua l se rvic e s A 189,018 2,755 392,152 399,116
Othe r se rvic e s
De pa rtme nta l non- ope ra ting
Equity injections 5,563 - 5,563 5,990
Tota l 5,563 - 5,563 5,990
Tota l othe r se rvic e s B 5,563 - 5,563 5,990
Tota l a va ila ble a nnua l
a ppropria tions 194,581 2,755 397,715 405,106
Tota l ne t re sourc ing for Austra de 194,581 2,755 397,715 405,106 1. Appropriation Act (No.1) 2012-13 & Appropriation Bill (No.3) 2012-13 2. Estimated adjusted balance carried from previous year for annual appropriations 3. Includes an amount of $18.492m in 2012-13 for the Departmental Capital Budget (refer to table 3.2.5 for
further details). For accounting purposes this amount has been designated as 'contributions by owners' 4. Section 31 Relevant Agency receipts — estimate Reader note: All figures are GST exclusive.

Austrade Additional Estimates Statements
56
1.3 AGENCY MEASURES TABLE
Table 1.2 summarises new Government measures taken since the 2012-13 Budget. The
table is split into revenue, expense and capital measures, with the affected program
identified.
Table 1.2: Agency 2012-13 Measures since Budget
Program 2012-13 2013-14 2014-15 2015-16
$'000 $'000 $'000 $'000
Expense measures
Fire Service Levy - reduction 1.1
Departmental expenses (15) (16) (16) (16)
Continuation of existing savings 1.1,2.1
Departmental expenses - - (2,200) (2,200)
Australia in the Asian Century 1.3
Administered expenses - 1,500 1,500 1,500
Departmental expenses 500 400 300 300
Targeted savings - public service eff iciencies 1.1,2.1
Departmental expenses (671) (622) (622) (622)
Export Market Development Grants - retargeting 1.2
Administered expenses (25,000) (25,000) (25,000) (25,000)
Total (25,186) (23,738) (26,038) (26,038)
Total expense measures
Administered (25,000) (23,500) (23,500) (23,500)
Departmental (186) (238) (2,538) (2,538)
Total (25,186) (23,738) (26,038) (26,038) Prepared on a Government Financial Statistics (fiscal) basis

Austrade Additional Estimates Statements
57
1.4 ADDITIONAL ESTIMATES AND VARIATIONS
The following tables detail the changes to the resourcing for Austrade at Additional
Estimates, by Outcome. Table 1.3 details Additional Estimates or variations through
other factors, such parameter adjustments.
Table 1.3: Additional estimates and variations to outcomes from other variations
Program 2012-13 2013-14 2014-15 2015-16
impacted $'000 $'000 $'000 $'000
Outcome 1
Increase in estimates (departmental)
Change in Foreign Exchange 1.1, 2.1 17 17 17 17
Change in Price and Wage Indicies 1.1, 2.1 - 27 25 84
1.1, 2.1 - 345 345 345
1.1, 2.1 2,924 3,840 5,224 6,341
Net impact on estimates
for Outcome 1 (departmental) 2,941 4,229 5,611 6,787
Transfer of utilities responsibility
from DFAT
Supplementation for fringe benefits
tax changes to the living-aw ay-
from-home-allow ance

Austrade Additional Estimates Statements
58
1.5 BREAKDOWN OF ADDITIONAL ESTIMATES BY APPROPRIATION
BILL
The following tables detail the Additional Estimates sought for Austrade through
Appropriation Bills No.3 and No.4.
Table 1.4: Appropriation Bill (No. 3) 2012-13
2011-12 2012-13 2012-13 Additional Reduced
Available Budget Revised Estimates Estimates
$'000 $'000 $'000 $'000 $'000
ADMINISTERED ITEMS
Outcome 1
- 150,400 150,400 - -
Total - 150,400 150,400 - -
DEPARTMENTAL PROGRAMS
Outcome 1
171,273 169,669 172,424 2,755 -
Total 171,273 169,669 172,424 2,755 -
Total administered and
departmental 171,273 320,069 322,824 2,755 -
Advance Australia's trade,
investment and education
promotion interests through
information, advice and services
to business, the education
sector and governments
Advance Australia's trade,
investment and education
promotion interests through
information, advice and services
to business, the education
sector and governments

Austrade Additional Estimates Statements
59
Section 2: Revisions to Outcomes and Planned Performance
2.1 RESOURCES AND PERFORMANCE INFORMATION
There is no change to Austrade’s Outcome strategy as expressed in the Portfolio Budget
Statements 2012-13.
OUTCOME 1: ADVANCE AUSTRALIA’S TRADE, INVESTMENT AND
EDUCATION PROMOTION INTERESTS THROUGH INFORMATION, ADVICE
AND SERVICES TO BUSINESS, THE EDUCATION SECTOR AND
GOVERNMENTS
Outcome 1 strategy
There is no change to Austrade’s Outcome strategy as expressed in the Portfolio Budget
Statements 2012-13.

Austrade Additional Estimates Statements
60
Table 2.1 Budgeted Expenses and Resources for Outcome 1
2011-12 2012-13
Actual Revised
expenses estimated
expenses
$'000 $'000
Program 1.1: Trade, education and investment
Departmental expenses
Departmental appropriation 1 171,273 172,424
Expenses not requiring appropriation in the Budget year 2 17,742 18,520
Total for Program 1.1 189,015 190,944
Program 1.2: Export Market Development Grants Scheme
Administered expenses
Ordinary annual services (Appropriation Act No. 1 & Bill No. 3) 135,068 125,400
Total for Program 1.2 135,068 125,400
Outcome 1 Totals by appropriation type
Administered Expenses
Ordinary annual services (Appropriation Act No. 1 & Bill No. 3) 135,068 125,400
Departmental expenses
Departmental appropriation 1 171,273 172,424
Expenses not requiring appropriation in the Budget year 2 17,742 18,520
Total expenses for Outcome 1 324,083 316,344
2011-12 2012-13
Average Staffing Level (number) 933 932
Outcome 1: Advance Australia's trade, investment and
education promotion interests through information, advice
and services to business, the education sector and
governments
1. Departmental Appropriation combines "Ordinary annual services (Appropriation Act No. 1 & Bill No. 3)"
and "Revenue from independent sources (s31)". 2. Expenses not requiring appropriation in the Budget year is made up of Depreciation Expense,
Amortisation Expense, Makegood Expense and Audit Fees.
Note: Departmental appropriation splits and totals are indicative estimates and may change in the course of
the budget year as government priorities change.
Program Expenses 1.1
2011-12 2012-13 2013-14 2014-15 2015-16
Actual Revised Forw ard Forw ard Forw ard
budget year 1 year 2 year 3
$'000 $'000 $'000 $'000 $'000
Annual departmental expenses:
Departmental item 171,273 172,424 170,268 172,961 173,414
Expenses not requiring appropriation in
the Budget year 1 17,742 18,520 18,944 18,050 17,328
Total program expenses 189,015 190,944 189,212 191,011 190,742 1. Expenses not requiring appropriation in the Budget year is made up of Depreciation Expense,
Amortisation Expense, Makegood Expense and Audit Fees.

Austrade Additional Estimates Statements
61
Program Expenses 1.2
2011-12 2012-13 2013-14 2014-15 2015-16
Actual Revised Forw ard Forw ard Forw ard
budget year 1 year 2 year 3
$'000 $'000 $'000 $'000 $'000
Annual administered expenses:
Administered item 135,068 125,400 125,400 125,400 125,400
Total program expenses 135,068 125,400 125,400 125,400 125,400
Program 1.3: Trade development schemes – Asian Century Business Engagement Plan (ACBE
Plan)
Program Objective 1.3
Provide member based business organisations with support to develop new initiatives to strengthen business linkages between Australia and Asia and harness commercial opportunities in Asia for small to medium sized Australian businesses.
Program Expenses 1.3
2011-12 2012-13 2013-14 2014-15 2015-16
Actual Revised Forw ard Forw ard Forw ard
budget year 1 year 2 year 3
$'000 $'000 $'000 $'000 $'000
Annual administered expenses:
Administered item - - 1,500 1,500 1,500
Total program expenses - - 1,500 1,500 1,500 Program 1.3 Deliverables
Administration of the Asian Century Business Engagement Plan, providing partial
reimbursement for expenditure on eligible business engagement activities.
The scheme will commence receiving applications in February 2013.

Austrade Additional Estimates Statements
62
OUTCOME 2: THE PROTECTION AND WELFARE OF AUSTRALIANS
ABROAD THROUGH TIMELY AND RESPONSIVE CONSULAR AND
PASSPORT SERVICES IN SPECIFIC LOCATIONS OVERSEAS
Outcome 2 strategy
There is no change to Austrade’s Outcome strategy as expressed in the Portfolio Budget
Statements 2012-13.
Table 2.1 Budgeted Expenses and Resources for Outcome 2
2011-12 2012-13
Actual Revised
expenses estimated
expenses
$'000 $'000
Program 2.1: Consular and passport services
Departmental expenses
Departmental appropriation 1 12,882 12,218
Total for Program 2.1 12,882 12,218
Outcome 2 Totals by appropriation type
Departmental expenses
Departmental appropriation 1 12,882 12,218
Total expenses for Outcome 2 12,882 12,218
2011-12 2012-13
Average Staffing Level (number) 47 43
Outcome 2: The protection and welfare of Australians
abroad through timely and responsive consular and
passport services in specific locations overseas
1. Departmental Appropriation combines "Ordinary annual services (Appropriation Act No. 1 & Bill No. 3)"
and "Revenue from independent sources (s31)".
Program Expenses 2.1
2011-12 2012-13 2013-14 2014-15 2015-16
Actual Revised Forw ard Forw ard Forw ard
budget year 1 year 2 year 3
$'000 $'000 $'000 $'000 $'000
Annual departmental expenses:
Departmental item 12,882 12,218 12,041 12,209 12,211
Total program expenses 12,882 12,218 12,041 12,209 12,211

Austrade Additional Estimates Statements
63
Section 3: Explanatory tables and budgeted financial statements
3.1 EXPLANATORY TABLES
Estimates of Special Account flows
Special Accounts provide a means to set aside and record amounts used for specified
purposes. Table 3.1.1 shows the expected additions (receipts) and reductions
(payments) for each account used by Austrade. The corresponding table in the 2012-13
PB Statements is Table 3.1.2.
Table 3.1.1: Estimates of Special Account flows
Opening Closing
balance Receipts Payments Adjustments balance
2012-13 2012-13 2012-13 2012-13 2012-13
2011-12 2011-12 2011-12 2011-12 2011-12
Outcome $'000 $'000 $'000 $'000 $'000
1 100 9,200 (9,200) - 100
100 9,200 (9,200) - 100
Total Special Accounts
2012-13 Budget estimate 100 9,200 (9,200) - 100
Total Special Accounts
2011-12 actual 100 9,200 (9,200) - 100
Admin Payments and Receipts for Other
Entities Special Account (A)
(A) = Administered

Austrade Additional Estimates Statements
64
3.2 BUDGETED FINANCIAL STATEMENTS
An analysis of Austrade’s budgeted financial statements, as reflected in the
departmental financial statements and administered schedules, is provided below.
Departmental financial statements
The Departmental financial statements represent the assets, liabilities, revenues and
expenses which are controlled by Austrade. Departmental expenses include employee
and supplier expenses and other administrative costs which are incurred by Austrade
in undertaking its operations.
Budgeted departmental comprehensive income statement
This statement provides actual financial results for 2011-12 and the estimated revenue
and expenses for 2012-13 and forward years.
Total income in 2012-13 is estimated to be $184.8 million, which represents an increase
of $2.8 million from Budget. The increase is due to:
supplementation for fringe benefits tax changes to the living-away-from-home-allowance – an increase of $2.9 million.
Australia in Asian Century – an increase of $0.5 million.
changes in foreign exchange and price and wages indices – a net increase of $0.1 million;
targeted savings – public service efficiencies – a decrease of $0.7 million
Austrade is receiving funding of $18.5 million to fund the Departmental Capital
Budget which is treated as an equity injection.
Budgeted departmental balance sheet
This statement discloses the estimated end of year financial position for Austrade.
Austrade’s budgeted net asset position at the end of 2012-13 of $52.3 million represents
an increase of $0.2 million from the 2011-12 estimated actual in table 3.2.2 due to the
variation between capital program funding ($18.5 million) and estimated depreciation
expense ($18.4 million).
Departmental statement of changes in equity — summary of movement
This statement shows changes in equity resulting from the net impact of movements in
accumulated results, assets revaluation and other reserves, and contributed equity.
Total equity at the end of 2012-13 is estimated to be $44.2 million, an increase of $0.1
million due to the variation between capital funding ($18.5 million) and depreciation
expense ($18.4 million).

Austrade Additional Estimates Statements
65
Budgeted departmental statement of cash flows
This statement shows the extent and nature of cash flows as a result of Austrade’s
operating, investing and financing activities. Austrade’s cash balance at the end of
2012-13 is estimated to be $5.5 million.
Departmental capital budget statement
This statement shows all planned departmental capital expenditure on non-financial
assets, whether funded through capital appropriations, additional equity, borrowings,
or funds from internal sources.
Departmental statement of asset movements
This statement shows budgeted acquisitions and disposals of non-financial assets
during the budget year.
Schedule of administered activity
Details of transactions administered by Austrade on behalf of the Government are
shown in the following schedules to the financial statements.
Schedule of budgeted income and expenses administered on behalf of
Government
This schedule discloses revenue and expenses administered on behalf of the
Government.
Administered expenses of $125.4 million for 2012-13 relate to the EMDG scheme. This
is comprised of $119.1 million in grant expenditure and $6.3 million in expenditure for
the costs of administering the EMDG scheme on behalf of the Government.

Austrade Additional Estimates Statements
66
Schedule of budgeted assets and liabilities administered on behalf of
Government
This schedule identifies the assets and liabilities administered on behalf of the
Government.
Total administered assets and liabilities for 2012-13 are estimated at $0.1 million and
$11.0 million respectively.
Schedule of budgeted administered cash flows
This schedule shows cash flows administered on behalf of the Government. All cash
received is expected to be expended on the EMDG scheme.

Austrade Additional Estimates Statements
67
Table 3.2.1: Budgeted departmental Comprehensive Income Statement (Showing Net Cost of Services)
Actual Revised Forw ard Forw ard Forw ard
budget estimate estimate estimate
2011-12 2012-13 2013-14 2014-15 2015-16
$'000 $'000 $'000 $'000 $'000
EXPENSES
Employee benefits 108,929 100,789 97,520 100,807 98,138
Suppliers 75,101 84,011 84,947 84,521 87,487
Depreciation and amortisation 17,582 18,362 18,786 17,892 17,328
Write-dow n and impariment of assets 13 - - - -
Other expenditure 272 - - - -
Total expenses 201,897 203,162 201,253 203,220 202,953
LESS:
OWN-SOURCE INCOME
Own-source revenue
Sale of goods and rendering of services 17,331 21,592 21,592 21,592 21,750
Rental income 103 500 500 500 500
Other 2,439 1,500 1,500 1,500 1,500
Total own-source revenue 19,873 23,592 23,592 23,592 23,750
Gains
Sale of assets - 250 250 250 250
Other 160 158 158 158 -
Total gains 160 408 408 408 250
Total own-source income 20,033 24,000 24,000 24,000 24,000
Net cost of (contribution by)
services 181,864 179,162 177,253 179,220 178,953
Revenue from Government 167,216 160,800 158,467 161,328 161,625 * * * *
Surplus (Deficit) attributable to
the Australian Government (14,648) (18,362) (18,786) (17,892) (17,328)
Total comprehensive income (loss) (14,648) (18,362) (18,786) (17,892) (17,328)
Total comprehensive income (loss)
attributable to the Australian
Government (14,648) (18,362) (18,786) (17,892) (17,328)
Note: Impact of Net Cash Apppropriation Arrangements
2011-12 2012-13 2013-14 2014-15 2015-16
$'000 $'000 $'000 $'000 $'000
Total Comprehensive Income
(loss) less depreciation/amortisation
expenses previously funded through
revenue appropriations. (14,648) (18,362) (18,786) (17,892) (17,328)
plus depreciation/amortisation expenses
previously funded through revenue
appropriations1 - - - - -
Total Comprehensive Income
(loss) - as per the Statement of
Comprehensive Income (14,648) (18,362) (18,786) (17,892) (17,328) 1. From 2010-11, the Government introduced net cash appropriation arrangements where Appropriation Act No. 1 or Bill No. 3 revenue appropriations for the depreciation/amortisation expenses of FMA Act agencies were replaced with a separate capital budget (the Departmental Capital Budget, or DCB) provided through

Austrade Additional Estimates Statements
68
Appropriation Act No. 1 or Bill No. 3 equity appropriations. For information regarding DCBs, please refer to Table 3.2.5 Departmental Capital Budget Statement. Prepared on Australian Accounting Standards basis.
Table 3.2.2: Budgeted departmental balance sheet (as at 30 June)
Actual Revised Forw ard Forw ard Forw ard
budget estimate estimate estimate
2011-12 2012-13 2013-14 2014-15 2015-16
$'000 $'000 $'000 $'000 $'000
ASSETS
Financial assets
Cash and cash equivalents 3,610 5,500 5,500 5,500 5,500
Trade and other receivables 53,795 53,405 54,905 54,905 54,905
Total financial assets 57,405 58,905 60,405 60,405 60,405
Non-financial assets
Land and buildings 10,208 12,254 11,798 10,364 10,391
Property, plant and equipment 18,212 14,976 10,392 9,206 5,777
Intangibles 15,712 17,032 14,521 13,850 14,638
Other non-financial assets 2,777 2,777 2,777 2,777 2,777
Total non-financial assets 46,909 47,039 39,488 36,197 33,583
Total assets 104,314 105,944 99,893 96,602 93,988
LIABILITIES
Payables
Suppliers 9,451 9,451 9,451 9,451 9,451
Other payables 4,202 4,202 4,202 4,202 4,202
Total payables 13,653 13,653 13,653 13,653 13,653
Provisions
Employee provisions 30,943 32,443 33,943 33,943 33,943
Other provisions 4,593 4,593 4,593 4,593 4,593
Total provisions 35,536 37,036 38,536 38,536 38,536
Total liabilities 49,189 50,689 52,189 52,189 52,189
Net assets 55,125 55,255 47,704 44,413 41,799
EQUITY*
Attributed to Non-Controlling Interest
Contributed equity 44,080 62,572 73,807 88,408 103,122
Reserves 57,814 57,814 57,814 57,814 57,814
Retained surplus (accumulated deficit) (46,769) (65,131) (83,917) (101,809) (119,137)
Total Equity 55,125 55,255 47,704 44,413 41,799 Prepared on Australian Accounting Standards basis.

Austrade Additional Estimates Statements
69
Table 3.2.3: Departmental statement of changes in equity — summary of movement (Budget year 2012-13)
Retained Asset Other Contributed Total
earnings revaluation reserves equity/ equity
reserve capital
$'000 $'000 $'000 $'000 $'000
Opening balance as at 1 July 2012
Balance carried forw ard from
previous period (46,769) 19,089 38,725 44,080 55,125
Adjusted opening balance (46,769) 19,089 38,725 44,080 55,125
Surplus (deficit) for the period (18,362) - - - (18,362)
Total comprehensive income (65,131) 19,089 38,725 44,080 36,763
Transactions with owners
Departmental Capital Budget (DCBs) - - - 18,492 18,492
Sub-total transactions with owners - - - 18,492 18,492
Estimated closing balance
as at 30 June 2013 (65,131) 19,089 38,725 62,572 55,255
Closing balance attributable to the
Australian Government (65,131) 19,089 38,725 62,572 55,255 Prepared on Australian Accounting Standards basis

Austrade Additional Estimates Statements
70
Table 3.2.4: Budgeted departmental statement of cash flows (as at 30 June)
Actual Revised Forw ard Forw ard Forw ard
budget estimate estimate estimate
2011-12 2012-13 2013-14 2014-15 2015-16
$'000 $'000 $'000 $'000 $'000
OPERATING ACTIVITIES
Cash received
Appropriations 161,477 161,190 156,967 161,328 161,625
Sale of goods and rendering of services 17,866 22,092 22,092 22,092 22,250
Net GST received 4,115 5,714 5,714 5,714 5,714
Other 2,542 1,500 1,500 1,500 1,500
Total cash received 186,000 190,496 186,273 190,634 191,089
Cash used
Employees 111,259 99,289 96,020 100,807 98,138
Suppliers 75,870 83,853 84,789 84,363 87,487
Net GST paid - 5,714 5,714 5,714 5,714
Total cash used 187,129 188,856 186,523 190,884 191,339
Net cash from (used by)
operating activities (1,129) 1,640 (250) (250) (250)
INVESTING ACTIVITIES
Cash received
Proceeds from sales of property,
plant and equipment 475 250 250 250 250
Total cash received 475 250 250 250 250
Cash used
Purchase of property, plant
and equipment 15,668 18,492 11,235 14,601 14,714
Total cash used 15,668 18,492 11,235 14,601 14,714
Net cash from (used by)
investing activities (15,193) (18,242) (10,985) (14,351) (14,464)
FINANCING ACTIVITIES
Cash received
Contributed equity 14,752 18,492 11,235 14,601 14,714
Total cash received 14,752 18,492 11,235 14,601 14,714
Net cash from (used by)
financing activities 14,752 18,492 11,235 14,601 14,714
Net increase (decrease)
in cash held (1,570) 1,890 - - -
Cash and cash equivalents at the
beginning of the reporting period 5,180 3,610 5,500 5,500 5,500
Cash and cash equivalents at the
end of the reporting period 3,610 5,500 5,500 5,500 5,500
Prepared on Australian Accounting Standards basis.

Austrade Additional Estimates Statements
71
Table 3.2.5: Capital Budget Statement — Departmental Actual Revised Forw ard Forw ard Forw ard
budget estimate estimate estimate
2011-12 2012-13 2013-14 2014-15 2015-16
$'000 $'000 $'000 $'000 $'000
NEW CAPITAL APPROPRIATIONS
Capital budget - Act No. 1 (DCB) 15,350 18,492 11,235 14,601 14,714
Total new capital appropriations 15,350 18,492 11,235 14,601 14,714
Provided for:
Purchase of non-financial assets 15,350 18,492 11,235 14,601 14,714
Total Items 15,350 18,492 11,235 14,601 14,714
PURCHASE OF NON-FINANCIAL
ASSETS
Funded by capital appropriations 1 588 - - - -
Funded by capital appropriation - DCB 2 15,080 18,492 11,235 14,601 14,714
TOTAL 15,668 18,492 11,235 14,601 14,714
RECONCILIATION OF CASH
USED TO ACQUIRE ASSETS
TO ASSET MOVEMENT TABLE
Total purchases 15,668 18,492 11,235 14,601 14,714
Total cash used to
acquire assets 15,668 18,492 11,235 14,601 14,714 1. Includes both current and prior Act 2 and Bills 4/6 appropriations and special capital appropriations 2. Does not include annual finance lease costs. Include purchase from current and previous years' Departmental Capital Budgets (DCBs). Consistent with information contained in the Statement of Asset Movements and the Budgeted Statement of Cash Flows.

Austrade Additional Estimates Statements
72
Ag
ency
Ad
dition
al Estim
ates Statem
ent —
Ag
ency
nam
e
Table 3.2.6: Statement of Asset Movements (2012-13) Buildings Other property, Computer Total
plant and software and
equipment intangibles
$'000 $'000 $'000 $'000
As a t 1 July 2 0 12
Gross book value 14,048 32,566 48,278 94,892
Accumulated depreciation/amortisation
and impairment (3,840) (14,354) (32,566) (50,760)
Ope ning ne t book ba la nc e 10,208 18,212 15,712 44,132
CAPITAL ASSET ADDITIONS
Estima te d e xpe nditure on
ne w or re pla c e me nt a sse ts
By purchase - appropriation ordinary
annual services 1 6,896 4,738 6,858 18,492
Tota l a dditions 6,896 4,738 6,858 18,492
Othe r move me nts
Depreciation/amortisation expense (4,850) (7,974) (5,538) (18,362)
As a t 3 0 June 2 0 13
Gross book value 20,944 37,304 55,136 113,384
Accumulated depreciation/amortisation
and impairment (8,690) (22,328) (38,104) (69,122)
Closing ne t book ba la nc e 12,254 14,976 17,032 44,262 1. "Appropriation ordinary annual services" refers to funding provided through Appropriation Act No. 1 and Bill No. 3 2012-13 for depreciation / amortisation expenses, DCBs or other operational expenses. Prepared on Australian Accounting Standards basis.

Austrade Additional Estimates Statements
73
Ag
ency
Ad
dition
al Estim
ates Statem
ent —
Ag
ency
nam
e
Schedule of administered activity
Details of transactions administered by Austrade on behalf of the Government are
shown in the following schedules to the financial statements.
Table 3.2.7: Schedule of budgeted income and expenses administered on behalf of government (for the period ended 30 June)
Actual Revised Forw ard Forw ard Forw ard
budget estimate estimate estimate
2011-12 2012-13 2013-14 2014-15 2015-16
$'000 $'000 $'000 $'000 $'000
EXPENSES ADMINISTERED ON
BEHALF OF GOVERNMENT
Employee benefits 6,296 4,600 4,600 4,600 4,600
Suppliers 1,564 1,670 1,670 1,670 1,670
Grants 127,208 119,130 120,630 120,630 120,630
Total expenses administered
on behalf of Government 135,068 125,400 126,900 126,900 126,900 Prepared on Australian Accounting Standards basis.
Table3.2.8: Schedule of budgeted assets and liabilities administered on behalf of government (as at 30 June)
Actual Revised Forw ard Forw ard Forw ard
budget estimate estimate estimate
2011-12 2012-13 2013-14 2014-15 2015-16
$'000 $'000 $'000 $'000 $'000
ASSETS
Financial assets
Cash and equivalent 1 - - - -
Other f inancial assets 51 52 52 52 52
Total financial assets 52 52 52 52 52
Total assets administered
on behalf of Government 52 52 52 52 52
LIABILITIES
Payables
Suppliers 73 73 73 73 73
Other payables 159 159 159 159 159
Total payables 232 232 232 232 232
Provisions
Employee provisions 2,378 2,378 2,378 2,378 2,378
Other provisions 8,370 8,370 8,370 8,370 8,370
Total provisions 10,748 10,748 10,748 10,748 10,748
Total liabilities administered
on behalf of Government 10,980 10,980 10,980 10,980 10,980
Net assets/(liabilities) (10,928) (10,928) (10,928) (10,928) (10,928) Prepared on Australian Accounting Standards basis.
Austrade Additional Estimates Statements
74
Table 3.2.9: Schedule of budgeted administered cash flows (for the period ended 30 June)
Actual Revised Forw ard Forw ard Forw ard
budget estimate estimate estimate
2011-12 2012-13 2013-14 2014-15 2015-16
$'000 $'000 $'000 $'000 $'000
OPERATING ACTIVITIES
Cash received
Net GST received 57 195 195 195 195
Total cash received 57 195 195 195 195
Cash used
Grant 125,580 119,130 120,630 120,630 120,630
Suppliers 1,473 2,170 2,170 2,170 1,670
Net GST paid - 195 195 195 195
Employees 6,269 4,100 4,100 4,100 4,600
Other 80 - - - -
Total cash used 133,402 125,595 127,095 127,095 127,095
Net cash from (used by)
operating activities - (1) - - -
Net increase (decrease) in
cash held
Cash and cash equivalents at
beginning of reporting period 1 1 - - -
Cash from Official Public Account for:
- Appropriations 133,338 125,399 126,900 126,900 126,900
Cash and cash equivalents at end
of reporting period 1 - - - - Prepared on Australian Accounting Standards basis. .

Austrade Additional Estimates Statements
75
Notes to the financial statements
Austrade’s budgeted statements are prepared on an Australian Equivalents to
International Financial Standards (AEIFRS) basis.
Under the Government’s budgeting framework, transactions that agencies control
(departmental transactions) are separately budgeted for and reported on from
transactions that agencies do not have control over (administered transactions). This
ensures that agencies are only held fully accountable for the transactions over which
they have control.
Departmental
Departmental assets, liabilities, revenues and expenses in relation to an agency or
authority are those which are controlled by the agency. Departmental expenses include
employee and supplier expenses and other administrative costs which are incurred by
the agency in providing its goods and services.
Administered
Administered items are revenues, expenses, assets and liabilities which are managed
by an agency or authority on behalf of the Government according to set Government
directions. Administered expenses include subsidies, grants and personal benefit
payments and administered revenues include taxes, fees, fines and excises.


77
AUSTRALIAN AGENCY FOR INTERNATIONAL DEVELOPMENT (AUSAID)
Section 1: Agency overview and resources ............................................................. 78
1.1 Strategic Direction .................................................................................................. 78
1.2 Agency Resource Statement ................................................................................. 79
1.3 Agency Measures table .......................................................................................... 81
1.4 Additional Estimates and variations ....................................................................... 82
1.5 Breakdown of Additional Estimates by appropriation bill ....................................... 84
Section 2: Revisions to agency outcomes and planned performance .................. 85
2.1 Resources and performance information ............................................................... 85
Section 3: Explanatory tables and budgeted financial statements ....................... 88
3.1 Explanatory tables .................................................................................................. 88
3.2 Budgeted financial statements ............................................................................... 89

AusAID Additional Estimates Statements
78
AUSTRALIAN AGENCY FOR INTERNATIONAL
DEVELOPMENT (AUSAID)
Section 1: Agency overview and resources
1.1 STRATEGIC DIRECTION
An outline of AusAID’s strategic direction can be found in the Portfolio Budget
Statements 2012-13. AusAID’s role and outcomes remain unchanged as a result of
Additional Estimates.
Through the 2012-13 Additional Estimates, AusAID will receive an additional
$4.5 million in 2012-13 to enable the Australian Government to implement the
measures detailed in Table 1.2.
Since the release of the 2012-13 Budget, the Government has decided to reprioritise
$375.1 million of Official Development Assistance to support the costs of asylum
seekers living in Australia. Included as explanatory tables to these statements are
tables showing the details of how the reprioritisation has occurred at a country and
global program level. The tables update those provided in the Ministerial Statement
Australia International Development Assistance Program, Helping the World’s Poor:
Implementing Effective AID published with the 2012-13 Budget.
1.2 AGENCY RESOURCE STATEMENT
The Agency Resource Statement details the resourcing for AusAID at Additional
Estimates. Table 1.1 outlines the total resourcing available from all sources for the
2012-13 Budget year, including variations through Appropriation Bills No.3 and No.4,
special appropriations and special accounts.

AusAID Additional Estimates Statements
79
Table 1.1: AusAID resource statement — Additional estimates for 2012-13 as at Additional Estimates February 2013
Estimate as Proposed Total Total
at Budget+
Additional=
estimate available
Estimate at Additional appropriation
Estimates
2012-13 2012-13 2012-13 2011-12
$'000 $'000 $'000 $'000
Ordinary annual services1
Departmental appropriation
Prior year departmental appropriation2
58,065 - 58,065 -
Departmental appropriation3 319,675 4,516 324,191 259,003
s31 Relevant agency receipts4 231 - 231 -
Total 377,971 4,516 382,487 259,003
Administered expenses
Prior year administered appropriation 674,046 - 674,046 -
Outcome15 4,207,198 - 4,207,198 3,667,265
Total 4,881,244 - 4,881,244 3,667,265
Total ordinary annual services A 5,259,215 4,516 5,263,731 3,926,268
Departmental non-operating
Equity injections 15,123 - 15,123 15,780
Total 15,123 - 15,123 15,780
Administered non-operating
Prior year administered assets 908,484 908,484 -
Administered assets and liabilities 507,384 - 507,384 47,902
Total 1,415,868 - 1,415,868 47,902
Total other services B 1,430,991 - 1,430,991 63,682
Total available annual
appropriations 6,690,206 4,516 6,694,722 3,989,950
Total special appropriations C - - - -
Total appropriations excluding
Special Accounts 6,690,206 4,516 6,694,722 3,989,950
Table continued on following page.
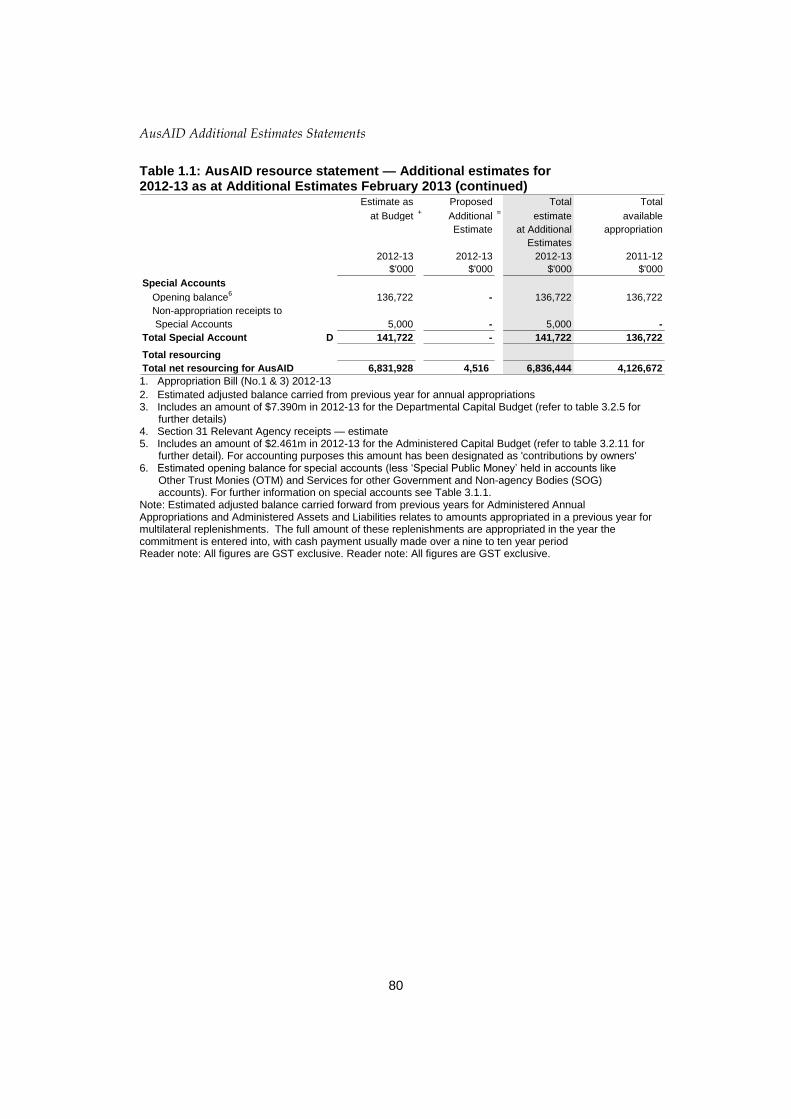
AusAID Additional Estimates Statements
80
Table 1.1: AusAID resource statement — Additional estimates for 2012-13 as at Additional Estimates February 2013 (continued)
Estimate as Proposed Total Total
at Budget+
Additional=
estimate available
Estimate at Additional appropriation
Estimates
2012-13 2012-13 2012-13 2011-12
$'000 $'000 $'000 $'000
Special Accounts
Opening balance6
136,722 - 136,722 136,722
Non-appropriation receipts to
Special Accounts 5,000 - 5,000 -
Total Special Account D 141,722 - 141,722 136,722
Total resourcing
Total net resourcing for AusAID 6,831,928 4,516 6,836,444 4,126,672
1. Appropriation Bill (No.1 & 3) 2012-13 2. Estimated adjusted balance carried from previous year for annual appropriations 3. Includes an amount of $7.390m in 2012-13 for the Departmental Capital Budget (refer to table 3.2.5 for
further details) 4. Section 31 Relevant Agency receipts — estimate 5. Includes an amount of $2.461m in 2012-13 for the Administered Capital Budget (refer to table 3.2.11 for
further detail). For accounting purposes this amount has been designated as 'contributions by owners' 6. Estimated opening balance for special accounts (less ‘Special Public Money’ held in accounts like
Other Trust Monies (OTM) and Services for other Government and Non-agency Bodies (SOG) accounts). For further information on special accounts see Table 3.1.1.
Note: Estimated adjusted balance carried forward from previous years for Administered Annual Appropriations and Administered Assets and Liabilities relates to amounts appropriated in a previous year for multilateral replenishments. The full amount of these replenishments are appropriated in the year the commitment is entered into, with cash payment usually made over a nine to ten year period Reader note: All figures are GST exclusive. Reader note: All figures are GST exclusive.

AusAID Additional Estimates Statements
81
1.3 AGENCY MEASURES TABLE
Table 1.2 summarises new Government measures taken since the 2012-13 Budget. The
table is split into revenue, expense and capital measures, with the affected program
identified.
Table 1.2: Agency 2012-13 Measures since Budget
Program 2012-13 2013-14 2014-15 2015-16
$'000 $'000 $'000 $'000
Expense measures
Australia's contribution to the Sustainment
of the Afghan National Security Forces1
1.3
Administered expenses - - 19,199 19,372
Total - - 19,199 19,372
Official Development Assistance - Australia
in the Asian Century - Asian Century
Awards2
Administered expenses 1.3 (668) (1,123) (3,345) (2,916)
Departmental expenses DS 668 1,123 3,345 2,916
Total - - - -
Official Development Assistance - Support
for low income countries through the
International Monetary Fund3
1.4
Administered (13,928) - - -
Total (13,928) - - -
Official Development Assistance -
Reporting of Asylum Seeker Costs4
1.1, 1.2,
1.3, 1.4,
1.6, 1.7
Administered (352,900)
Total (352,900)
Total measures
Administered (367,496) (1,123) 15,854 16,456
Departmental 668 1,123 3,345 2,916
Total (366,828) - 19,199 19,372 Prepared on a Government Financial Statistics (fiscal) basis 1. The details for this measure were published in the 2012-13 MYEFO. 2. This measure is $11.0 million absorbed from within existing resources over the forward estimates, but
involves a transfer of funding from Administered to Departmental expenses. The details for this measure will be published in the 2013-14 Budget Paper No. 2.
3. The details for this measure will be published in the 2013-14 Budget Paper No. 2. 4. The details for this measure will be published in the 2013-14 Budget Paper No. 2.

AusAID Additional Estimates Statements
82
1.4 ADDITIONAL ESTIMATES AND VARIATIONS
The following tables detail the changes to the resourcing for AusAID at Additional
Estimates, by outcome. Table 1.3 details the Additional Estimates and variations
resulting from new measures since the 2012-12 Budget in Appropriation Bills No.3 and
No.4. Table 1.4 details Additional Estimates or variations through other factors, such as
parameter adjustments.
Table 1.3: Additional estimates and variations to outcomes from measures since 2012-13 Budget
Program 2012-13 2013-14 2014-15 2015-16
impacted $'000 $'000 $'000 $'000
Outcome 1
Increase in estimates (administered)
Australia's contribution to the
Sustainment of the Afghan National
Security Forces 1.3 - - 19,199 19,372
Decrease in estimates (administered)
Official Development Assistance -
Australia in the Asian Century - Asian
Century Awards 1.3 (668) (1,123) (3,345) (2,916)
Official Development Assistance -
Support for low income countries
through the International Monetary Fund
1.4 (13,928) - - -
Official Development Assistance -
Reporting of Asylum Seeker Costs
1.1, 1.2,
1.3, 1.4,
1.6, 1.7
(352,900) - - -
Net impact on estimates
for Outcome 1 (administered) (367,496) - 15,854 16,456
Increase in estimates (departmental)
Official Development Assistance -
Australia in the Asian Century - Asian
Century Awards DS 668 1,123 3,345 2,916
Net impact on estimates
for Outcome 1 (departmental) 668 1,123 3,345 2,916

AusAID Additional Estimates Statements
83
TABLE 1.4: ADDITIONAL ESTIMATES AND VARIATIONS TO OUTCOMES
FROM OTHER VARIATIONS
Program 2012-13 2013-14 2014-15 2015-15
impacted $'000 $'000 $'000 $'000
Outcome 1
Increase in estimates (administered)
Application of parameters all 1,787 - - -
Net impact on estimates
for Outcome 1 (administered) 1,787 - - -
Increase in estimates (departmental)
Living Away from Home Allowance DS 3,740 10,100 15,837 16,313
Devolution of Utility and Cleaning
costsDS - 543 543 543
Application of Parameters DS 2,226 - - -
Decrease in estimates (departmental)
Fire Service Levy - reduction DS (21) (22) (23) (23)
Targeted savings - public service
efficienciesDS (2,097) (2,229) (2,229) (2,229)
Net impact on estimates
for Outcome 1 (departmental) 3,848 8,392 14,128 14,604

AusAID Additional Estimates Statements
84
1.5 BREAKDOWN OF ADDITIONAL ESTIMATES BY APPROPRIATION
BILL
The following tables detail the Additional Estimates sought for AusAID through
Appropriation Bills No.3 and No.4.
Table 1.5: Appropriation Bill (No. 3) 2012-13
Available Budget Revised Estimates Estimates
$'000 $'000 $'000 $'000 $'000
ADMINISTERED ITEMS
Outcome 1
To assist developing countries to
reduce poverty and achieve
sustainable development, in line
with Australia’s national interest3,818,175 4,207,198 4,572,239 - (365,041)
Total 3,818,175 4,207,198 4,572,239 - (365,041)
DEPARTMENTAL PROGRAMS
Outcome 1
To assist developing countries to
reduce poverty and achieve
sustainable development, in line
with Australia’s national interest278,475 319,675 324,191 4,516 -
Total 278,475 319,675 324,191 4,516 -
Total administered and
departmental 4,096,650 4,526,873 4,896,430 4,516 (365,041)
Table 1.6: Appropriation Bill (No. 4) 2012-13
AusAID is not receiving additional funding through Appropriation Bill 4 in 2012-13.

AusAID Additional Estimates Statements
85
Section 2: Revisions to agency resources and planned performance
2.1 RESOURCES AND PERFORMANCE INFORMATION
OUTCOME 1
Outcome 1 strategy
AusAID’s Outcome 1 strategy, key performance indicators and targets as reported in
the Portfolio Budget Statements 2012-13 remain unchanged as a result of Additional
Estimates.
Table 2.1 Budgeted Expenses and Resources for Outcome 1
2011-12 2012-13
Actual Revised
expenses estimated
expenses
$'000 $'000
Program 1.1: Official Development Assistance - PNG & Pacific
Administered expenses
Ordinary annual services (Appropriation Bill No. 1) 923,786 912,929
Other services (Appropriation Bill No. 2) 3,893 3,970
Total for Program 1.1 927,679 916,899
Program 1.2: Official Development Assistance - East Asia
Administered expenses
Ordinary annual services (Appropriation Bill No. 1) 870,695 924,915
Total for Program 1.2 870,695 924,915
Program 1.3: Official Development Assistance - Africa, South and
Central Asia, Middle East and Other
Administered expenses
Ordinary annual services (Appropriation Bill No. 1) 1,279,963 1,003,286
Expenses not requiring appropriation in the Budget year 1,703 2,413
Special Accounts 10,214 5,000
Total for Program 1.3 1,291,880 1,010,699
Program 1.4: Official Development Assistance - Emergency,
Humanitarian and Refugee Program
Administered expenses
Ordinary annual services (Appropriation Bill No. 1) 313,379 347,086
Total for Program 1.4 313,379 347,086
Outcome 1: To assist developing countries to reduce poverty and
achieve sustainable development, in line with Australia’s national
interest

AusAID Additional Estimates Statements
86
Table 2.1 Budgeted Expenses and Resources for Outcome 1 (continued)
2011-12 2012-13
Actual Revised
expenses estimated
expenses
$'000 $'000
Program 1.5: Official Development Assistance - Multilateral
Replenishments
Administered expenses
Ordinary annual services (Appropriation Bill No. 1) 9,260 125,854
Other services (Appropriation Bill No. 2) 44,010 443,415
Expenses not requiring appropriation in the Budget year - 503,414
Total for Program 1.5 53,270 1,072,683
Program 1.6: Official Development Assistance - UN Commonwealth
and Other International Organisations
Administered expenses
Ordinary annual services (Appropriation Bill No. 1) 408,148 344,020
Total for Program 1.6 408,148 344,020
Program 1.7: Official Development Assistance - NGO, Volunteer and
Community Programs
Administered expenses
Ordinary annual services (Appropriation Bill No. 1) 170,211 329,796
Total for Program 1.7 170,211 329,796
Departmental Support
Departmental expenses
Ordinary annual services (Appropriation Bill No. 1) 274,727 316,801
Revenues from independent sources (s31) 54 231
Expenses not requiring appropriation in the Budget year 11,900 13,404
Total for Departmental Support 286,681 330,436
Outcome 1 Totals by appropriation type
Administered Expenses
Ordinary annual services (Appropriation Bill No. 1) 3,975,442 3,987,886
Other services (Appropriation Bill No. 2) 47,903 447,385
Expenses not requiring appropriation in the Budget year 1,703 505,827
Special Accounts 10,214 5,000
Departmental expenses
Ordinary annual services (Appropriation Bill No. 1) 274,727 316,801
Revenues from independent sources (s31) 54 231
Expenses not requiring appropriation in the Budget year 11,900 13,404
Total expenses for Outcome 1 4,263,826 4,824,149
2011-12 2012-13
Average Staffing Level (number) 1,900 1,944
Outcome 1: To assist developing countries to reduce poverty and
achieve sustainable development, in line with Australia’s national
interest

AusAID Additional Estimates Statements
87
OUTCOME 2
Outcome 2 strategy
AusAID’s Outcome 2 strategy, key performance indicators and targets as reported in
the Portfolio Budget Statements 2012-13 remain unchanged as a result of Additional
Estimates.
Table 2.1 Budgeted Expenses and Resources for Outcome 2
2011-12 2012-13
Actual Revised
expenses estimated
expenses
$'000 $'000
Program 2.1: East Asia
AIPRD grant special account1 354 3,787
AIPRD loans special account1 48,183 30,000
Total for Program 2.1 48,537 33,787
Outcome 2 Totals by appropriation type
AIPRD grant special account1 354 3,787
AIPRD loans special account1 48,183 30,000
Total expenses for Outcome 2 48,537 33,787
Outcome 2: Australia’s national interest advanced by implementing a
partnership between Australia and Indonesia for reconstruction and
development
1. This reflects the amount of funding disbursed on a cash basis, not an expense basis.
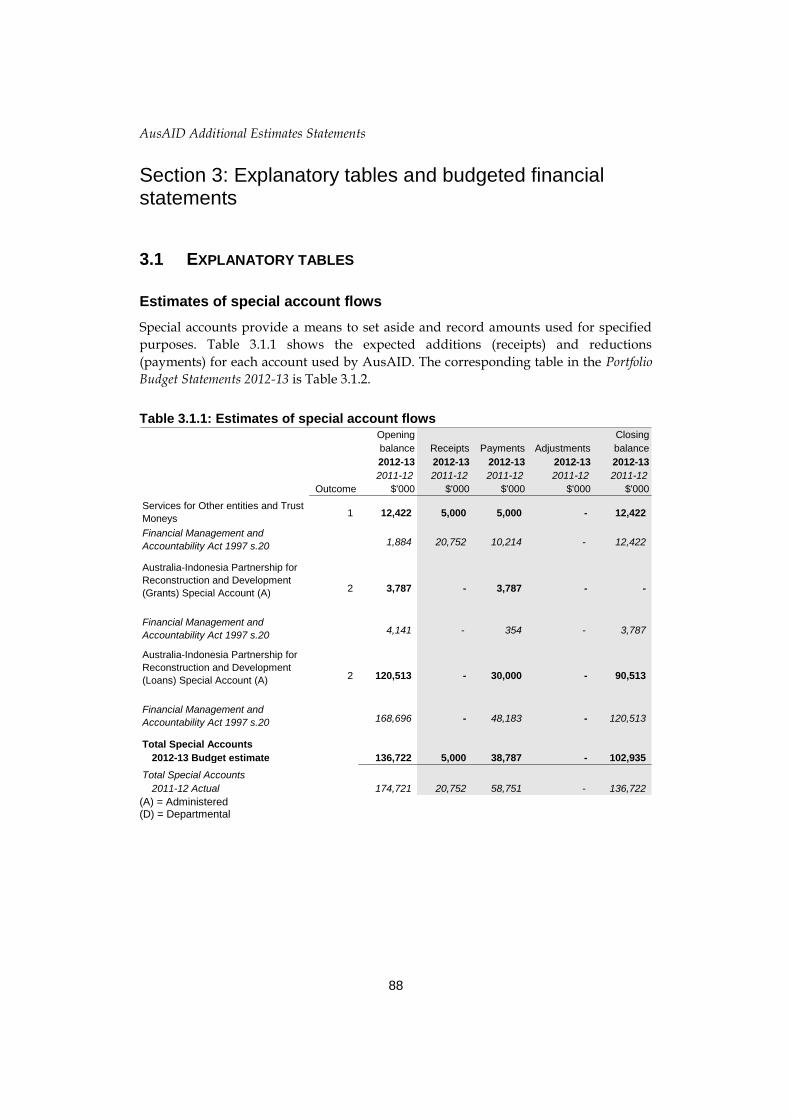
AusAID Additional Estimates Statements
88
Section 3: Explanatory tables and budgeted financial statements
3.1 EXPLANATORY TABLES
Estimates of special account flows
Special accounts provide a means to set aside and record amounts used for specified
purposes. Table 3.1.1 shows the expected additions (receipts) and reductions
(payments) for each account used by AusAID. The corresponding table in the Portfolio
Budget Statements 2012-13 is Table 3.1.2.
Table 3.1.1: Estimates of special account flows Opening Closing
balance Receipts Payments Adjustments balance
2012-13 2012-13 2012-13 2012-13 2012-13
2011-12 2011-12 2011-12 2011-12 2011-12
Outcome $'000 $'000 $'000 $'000 $'000
Services for Other entities and Trust
Moneys1 12,422 5,000 5,000 - 12,422
Financial Management and
Accountability Act 1997 s.20 1,884 20,752 10,214 - 12,422
Australia-Indonesia Partnership for
Reconstruction and Development
(Grants) Special Account (A) 2 3,787 - 3,787 - -
Financial Management and
Accountability Act 1997 s.204,141 - 354 - 3,787
Australia-Indonesia Partnership for
Reconstruction and Development
(Loans) Special Account (A) 2 120,513 - 30,000 - 90,513
Financial Management and
Accountability Act 1997 s.20 168,696 - 48,183 - 120,513
Total Special Accounts
2012-13 Budget estimate 136,722 5,000 38,787 - 102,935
Total Special Accounts
2011-12 Actual 174,721 20,752 58,751 - 136,722 (A) = Administered (D) = Departmental

AusAID Additional Estimates Statements
89
3.2 BUDGETED FINANCIAL STATEMENTS
3.2.1 Analysis of budgeted financial statements
3.2.1 Differences in agency resourcing and financial statements
In accordance with the Government Finance Statistics provided by the Australian
Bureau of Statistics, the budgeted financial statements do not recognise concessionality
and the associated discounting of concessional loans. Australian Accounting Standards
require concessional loans to reflect a market related rate of interest and be discounted
over the loan maturity period. AusAID has two programs that are affected by this
treatment:
• Asian Development Fund replenishments – investment component; and
• International Development Association replenishments – investment component.
The investment component does not impact on the fiscal or underlying cash balances,
as the provision of a loan only affects the composition of the Australian Government
investment in financial assets.
3.2.2 Analysis of budgeted financial statements
Analysis of budgeted financial statements
These statements provide actual results for 2011-12 and the revised Budget for 2012-13
and forward years.
Budgeted departmental income statement
This statement provides a picture of the expected financial results for AusAID by
identifying full accrual expenses and revenues.
Total income in 2012–13 is estimated to be $316.8 million, an increase of $4.5 million
from the 2012-13 Budget estimate.
Total expenses in 2012-13 are estimated to be $330.6 million.
Budgeted departmental balance sheet
This statement shows the expected financial position of AusAID. It enables decision
makers to track the management of AusAID’s assets and liabilities.
AusAID’s most significant liability continues to be accrued employee provisions, as a
result of accruing leave entitlements. In 2012-13 this is estimated at $47.3 million.
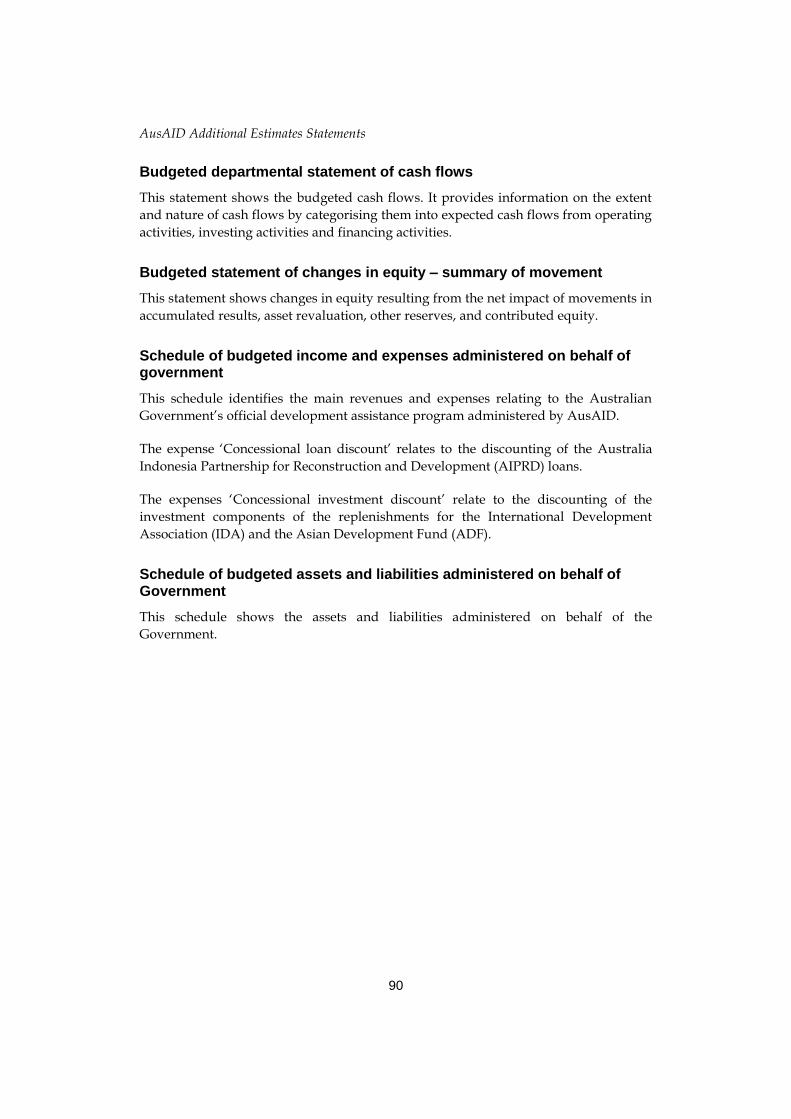
AusAID Additional Estimates Statements
90
Budgeted departmental statement of cash flows
This statement shows the budgeted cash flows. It provides information on the extent
and nature of cash flows by categorising them into expected cash flows from operating
activities, investing activities and financing activities.
Budgeted statement of changes in equity – summary of movement
This statement shows changes in equity resulting from the net impact of movements in
accumulated results, asset revaluation, other reserves, and contributed equity.
Schedule of budgeted income and expenses administered on behalf of government
This schedule identifies the main revenues and expenses relating to the Australian
Government’s official development assistance program administered by AusAID.
The expense ‘Concessional loan discount’ relates to the discounting of the Australia
Indonesia Partnership for Reconstruction and Development (AIPRD) loans.
The expenses ‘Concessional investment discount’ relate to the discounting of the
investment components of the replenishments for the International Development
Association (IDA) and the Asian Development Fund (ADF).
Schedule of budgeted assets and liabilities administered on behalf of Government
This schedule shows the assets and liabilities administered on behalf of the
Government.

AusAID Additional Estimates Statements
91
3.2.2 Budgeted financial statements
Table 3.2.1: Budgeted departmental Comprehensive Income Statement (Showing Net Cost of Services)
Actual Revised Forward Forward Forward
budget estimate estimate estimate
2011-12 2012-13 2013-14 2014-15 2015-16
$'000 $'000 $'000 $'000 $'000
EXPENSES
Employee benefits 171,555 191,873 211,981 204,810 208,961
Supplier expenses 103,494 125,152 134,270 124,550 126,779
Depreciation and amortisation 11,900 13,404 14,520 10,520 10,520
Finance costs 311 - - - -
Write-down and impairment of assets 136 136 138 140 140
Losses from asset sales 18 - - - -
Foreign exchange losses 57 - - - -
Total expenses 287,471 330,565 360,909 340,020 346,400
LESS:
OWN-SOURCE INCOME
Own-source revenue
Sale of goods and rendering of services 54 231 300 300 300
Total own-source revenue 54 231 300 300 300
Gains
Other 772 129 133 139 143
Total gains 772 129 133 139 143
Total own-source income 826 360 433 439 443
Net cost of
services 286,645 330,205 360,476 339,581 345,957
Revenue from Government 274,727 316,801 345,956 329,061 335,437 * * * *
Surplus (Deficit) (11,918) (13,404) (14,520) (10,520) (10,520)
Surplus (Deficit) attributable to
the Australian Government (11,918) (13,404) (14,520) (10,520) (10,520)
Total comprehensive income (11,918) (13,404) (14,520) (10,520) (10,520)
Total comprehensive income (loss)
attributable to the Australian
Government (11,918) (13,404) (14,520) (10,520) (10,520)
Note: Reconciliation of comprehensive income attributable to the agency
2011-12 2012-13 2013-14 2014-15 2015-16
$'000 $'000 $'000 $'000 $'000
Total Comprehensive Income
(loss) Attributable to the
Australian Government (11,918) (13,404) (14,520) (10,520) (10,520)
plus non-appropriated expenses
depreciation and amortisation expenses 11,918 13,404 14,520 10,520 10,520
Total Comprehensive Income
(loss) Attributable to the
agency - - - - - Prepared on Australian Accounting Standards basis.

AusAID Additional Estimates Statements
92
Table 3.2.2: Budgeted departmental balance sheet (as at 30 June) Actual Revised Forward Forward Forward
budget estimate estimate estimate
2011-12 2012-13 2013-14 2014-15 2015-16
$'000 $'000 $'000 $'000 $'000
ASSETS
Financial assets
Cash and cash equivalents 336 336 336 336 336
Trade and other receivables 60,437 62,001 62,761 63,453 63,453
Total financial assets 60,773 62,337 63,097 63,789 63,789
Non-financial assets
Leasehold improvements 28,399 28,261 32,769 35,766 38,803
Infrastructure, plant and equipment 27,557 35,668 32,642 28,718 23,790
Intangibles 6,199 7,199 8,319 9,399 10,479
Other 8,856 8,856 8,856 8,856 8,856
Total non-financial assets 71,011 79,984 82,586 82,739 81,928
Total assets 131,784 142,321 145,683 146,528 145,717
LIABILITIES
Payables
Suppliers 12,698 12,698 12,698 12,698 12,698
Other 4,075 4,075 4,075 4,075 4,075
Total payables 16,773 16,773 16,773 16,773 16,773
Provisions
Employee provisions 46,603 47,262 47,936 48,628 48,628
Other 6,148 6,148 6,148 6,148 6,148
Total provisions 52,751 53,410 54,084 54,776 54,776
Total liabilities 69,524 70,183 70,857 71,549 71,549
Net assets 62,260 72,138 74,826 74,979 74,168
EQUITY
Parent entity interest
Contributed equity 63,928 87,212 104,472 115,285 125,134
Reserves 626 626 626 626 626
Retained surplus
(accumulated deficit) (2,294) (15,700) (30,272) (40,932) (51,592)
Total parent entity interest 62,260 72,138 74,826 74,979 74,168
Total Equity 62,260 72,138 74,826 74,979 74,168 Prepared on Australian Accounting Standards basis.

AusAID Additional Estimates Statements
93
Table 3.2.3: Departmental statement of changes in equity — summary of movement (Budget year 2012-13)
Retained Asset Other Contributed Total
earnings revaluation reserves equity/ equity
reserve capital
$'000 $'000 $'000 $'000 $'000
Opening balance as at 1 July 2012
Balance carried forward from
previous period (3,065) 626 - 64,699 62,260
Adjustment for changes in
accounting policies - - - - -
Adjusted opening balance (3,065) 626 - 64,699 62,260
Comprehensive income
Other comprehensive income (12,635) - - - (12,635)
Surplus (deficit) for the period
Total comprehensive income (12,635) - - - (12,635)
Transactions with owners
Contributions by owners
Contribution/(Distribution) of Equity - - - - -
Appropriation (equity injection) 15,123 15,123
Departmental Capital Budget (DCBs) - - - 7,390 7,390
Other - - - - -
Sub-total transactions with owners - - - 22,513 22,513
Transfers between equity
components - - - - -
Estimated closing balance
as at 30 June 2013
Closing balance attributable to the
Australian Government (12,635) 626 - 87,212 72,138
Prepared on Australian Accounting Standards basis

AusAID Additional Estimates Statements
94
Table 3.2.4: Budgeted departmental statement of cash flows (as at 30 June) Actual Revised Forward Forward Forward
budget estimate estimate estimate
2011-12 2012-13 2013-14 2014-15 2015-16
$'000 $'000 $'000 $'000 $'000
OPERATING ACTIVITIES
Cash received
Goods and services 262 231 300 300 300
Appropriations 285,254 315,237 345,096 328,369 335,437
Net GST received 5,689 5,689 5,689 5,689 5,689
Total cash received 291,205 321,157 351,085 334,358 341,426
Cash used
Employees 158,658 191,214 211,207 204,118 208,961
Suppliers 113,751 129,943 139,878 130,240 132,465
Section 31 receipts transferred to OPA 16,961 - - - -
Total cash used 289,370 321,157 351,085 334,358 341,426
Net cash from (used by)
operating activities 1,835 - - - -
INVESTING ACTIVITIES
Cash received
Proceeds from sales of infrastructure,
plant and equipment 48 - - - -
Total cash received 48 - - - -
Cash used
Purchase of infrastructure, plant
and equipment 16,913 2,300 8,733 3,837 3,837
Purchase of leasehold improvements 11,057 16,013 7,407 5,896 4,932
Purchase of intangibles 3,575 4,200 1,120 1,080 1,080
Total cash used 31,545 22,513 17,260 10,813 9,849
Net cash from (used by)
investing activities (31,497) (22,513) (17,260) (10,813) (9,849)
Cash received
Contributed equity 25,667 15,123 5,018 1,090 40
Departmental Capital Budget 3,748 7,390 12,242 9,723 9,809
Total cash received 29,415 22,513 17,260 10,813 9,849
Net cash from (used by)
financing activities 29,415 22,513 17,260 10,813 9,849
Net increase (decrease)
in cash held (247) - - - -
Cash and cash equivalents at the
beginning of the reporting period 583 336 336 336 336
Cash and cash equivalents at the
end of the reporting period 336 336 336 336 336
Prepared on Australian Accounting Standards basis.

AusAID Additional Estimates Statements
95
Table 3.2.5: Capital Budget Statement — Departmental Actual Revised Forward Forward Forward
budget estimate estimate estimate
2011-12 2012-13 2013-14 2014-15 2015-16
$'000 $'000 $'000 $'000 $'000
CAPITAL APPROPRIATIONS
Capital budget - Bill 1 (DCB) 3,748 7,390 12,242 9,723 9,809
Equity injections - Bill 2 15,780 15,123 5,018 1,090 40
Total capital appropriations 19,528 22,513 17,260 10,813 9,849
Total new capital appropriations
Represented by:
Purchase of non-financial assets 19,528 22,513 17,260 10,813 9,849
Total Items 19,528 22,513 17,260 10,813 9,849
PURCHASE OF NON-FINANCIAL
ASSETS
Funded by capital appropriations 15,780 15,123 5,018 1,090 40
Funded by capital appropriation - DCB 3,748 7,390 12,242 9,723 9,809
TOTAL 19,528 22,513 17,260 10,813 9,849
RECONCILIATION OF CASH
USED TO ACQUIRE ASSETS
TO ASSET MOVEMENT TABLE
Total purchases 19,528 22,513 17,260 10,813 9,849
Total cash used to
acquire assets 19,528 22,513 17,260 10,813 9,849 Consistent with information contained in the Statement of Asset Movements and the Budgeted Statement of Cash Flows.

AusAID Additional Estimates Statements
96
Table 3.2.6: Statement of Asset Movements (2012-13) Buildings Other property, Other Total
plant and
equipment
$'000 $'000 $'000 $'000
As at 1 July 2012
Gross book value 35,971 40,455 16,270 92,696
Accumulated depreciation/amortisation
and impairment (7,572) (12,898) (10,071) (30,541)
Opening net book balance 28,399 27,557 6,199 62,155
CAPITAL ASSET ADDITIONS
Estimated expenditure on
new or replacement assets
By purchase - appropriation equity - 15,123 - 15,123
By purchase - appropriation ordinary
annual services 2,300 4,090 1,000 7,390
Total additions 2,300 19,213 1,000 22,513
Other movements
Depreciation/amortisation expense (2,438) (10,966) - (13,404)
Other - (136) - (136)
As at 30 June 2013
Gross book value 38,271 59,668 17,270 115,209
Accumulated depreciation/amortisation
and impairment (10,010) (24,000) (10,071) (44,081)
Closing net book balance 28,261 35,668 7,199 71,128
Prepared on Australian Accounting Standards basis.

AusAID Additional Estimates Statements
97
Schedule of administered activity
Table 3.2.7: Schedule of budgeted income and expenses administered on behalf of government (for the period ended 30 June)
Actual Revised Forward Forward Forward
budget estimate estimate estimate
2011-12 2012-13 2013-14 2014-15 2015-16
$'000 $'000 $'000 $'000 $'000
INCOME ADMINISTERED ON
BEHALF OF GOVERNMENT
Revenue
Non - Taxation revenue
Interest 6,287 6,846 7,229 7,612 8,385
Return of prior year administered
expenses 39,756 10,412 11,453 12,140 12,869
Total non-taxation revenue 46,043 17,258 18,682 19,752 21,254
Total revenues administered
on behalf of Government 46,043 17,258 18,682 19,752 21,254
Gains
Reversal of previous asset write-downs
and impairment 269,853 - - - -
Other 16,791 - - - -
Total gains administered
on behalf of Government 286,644 - - - -
Total own source income administered
on behalf of Government 332,687 17,258 18,682 19,752 21,254
EXPENSES ADMINISTERED ON
BEHALF OF GOVERNMENT
International Development assistance 3,262,346 3,364,953 4,091,994 5,018,281 5,571,134
Grants 543,181 344,020 661,064 500,224 456,835
IDA/ADF grants - 125,854 122,910 - -
Finance costs 68,245 - - - -
Concessional Loan discount 37,104 25,500 25,500 51,470 -
Concessional investment discount - 433,415 520,090 - -
Depreciation and amortisation 1,643 2,713 1,507 1,507 1,507
Write-down and impairment of assets 871 - - - -
Foreign exchange losses 5,461 - - - -
Other 132,502 - - - -
Total expenses administered
on behalf of Government 4,051,353 4,296,455 5,423,065 5,571,482 6,029,476
Prepared on Australian Accounting Standards basis.

AusAID Additional Estimates Statements
98
Table 3.2.8: Schedule of budgeted assets and liabilities administered on behalf of government (as at 30 June)
Actual Revised Forward Forward Forward
budget estimate estimate estimate
2011-12 2012-13 2013-14 2014-15 2015-16
$'000 $'000 $'000 $'000 $'000
ASSETS ADMINISTERED ON
BEHALF OF GOVERNMENT
Financial assets
Cash and cash equivalents 39,282 39,282 39,282 39,282 39,282
Loans and Receivables 80,447 84,947 89,447 98,531 98,531
Investments 1,270,513 1,340,513 1,420,513 1,420,513 1,420,513
Appropriation receivable - other - 2,109,527 2,774,964 2,578,585 2,201,169
Appropriation receivable
- special accounts - 90,554 60,554 - -
GST input credits receivable 13,428 13,428 13,428 13,428 13,428
Other receivables 890 890 890 890 890
Total financial assets 1,404,560 3,679,141 4,399,078 4,151,229 3,773,813
Non-financial assets
Leasehold improvements 2,961 2,540 3,386 4,197 5,018
Infrastructure, plant and equipment 23 236 407 400 415
Intangibles 6,455 6,411 6,393 6,375 6,357
Other 696 696 696 696 696
Total non-financial assets 10,135 9,883 10,882 11,668 12,486
Total assets administered
on behalf of Government 1,414,695 3,689,024 4,409,960 4,162,897 3,786,299
LIABILITIES ADMINISTERED ON
BEHALF OF GOVERNMENT
Payables
Trade creditors and contributions 209,715 286,037 324,046 407,900 473,147
IDA/ADF grant component 377,068 416,097 477,026 418,952 333,790
IDA/ADF concessional component 711,300 1,275,209 1,636,222 1,360,306 1,084,254
Aid program payable 100,748 144,595 350,082 403,837 322,389
Other payables 48,352 48,351 48,351 48,351 48,351
Total payables 1,447,183 2,170,289 2,835,727 2,639,346 2,261,931
Provisions
Other provisions 8,001 8,127 8,256 8,388 8,388
Total provisions 8,001 8,127 8,256 8,388 8,388
Total liabilities administered
on behalf of Government 1,455,184 2,178,416 2,843,983 2,647,734 2,270,319 Prepared on Australian Accounting Standards basis.

AusAID Additional Estimates Statements
99
Table 3.2.9: Schedule of budgeted administered cash flows (for the period ended 30 June)
Actual Revised Forward Forward Forward
budget estimate estimate estimate
2011-12 2012-13 2013-14 2014-15 2015-16
$'000 $'000 $'000 $'000 $'000
OPERATING ACTIVITIES
Cash received
Return of prior year
administered expenses 39,756 10,412 11,453 12,140 12,869
Net GST received 83,890 119,178 145,346 168,440 189,262
Other 1,185 - - - -
Total cash received 124,831 129,590 156,799 180,580 202,131
Cash used
International development
assistance 3,369,092 3,393,729 4,091,994 5,018,281 5,571,134
Grant Payments 635,601 95,576 715,579 682,047 899,497
Other - - - - -
Total cash used 4,004,693 3,489,305 4,807,573 5,700,328 6,470,631
Net cash from (used by)
operating activities (3,879,862) (3,359,715) (4,650,774) (5,519,748) (6,268,500)
INVESTING ACTIVITIES
Cash received
Proceeds from sale of
property, plant and equipment - - - - -
Total cash received - - - - -
Cash used
Purchase of property, plant
and equipment 2,213 2,641 2,505 2,293 2,325
Purchase of concessional
instruments 242,160 - - - -
Total cash used 244,373 2,641 2,505 2,293 2,325
Net cash from (used by)
investing activities (244,373) (2,641) (2,505) (2,293) (2,325)
Net increase (decrease) in
cash held (4,068,800) (3,711,807) (4,877,674) (5,812,110) (6,441,280)
Cash and cash equivalents at
beginning of reporting period 51,038 39,282 39,282 39,282 39,282
Cash from Official Public Account for:
- Appropriations 3,986,308 3,130,141 4,229,248 5,767,828 6,396,999
- Appropriations - ACB 1,856 2,641 2,505 2,293 2,325
- GST from OPA 87,124
- Capital Appropriations 128,096 507,384 604,144 - -
- Special Accounts 58,751 35,000 5,000 5,000 4,999
4,313,173 3,714,448 4,880,179 5,814,403 6,443,605
Cash to Official Public Account for:
- Appropriations (39,775) - - - -
- Special Accounts (20,752) - - - -
- GST to the OPA (89,129) 119,178 145,346 168,440 189,262
Cash and cash equivalents at end
of reporting period 39,282 39,282 39,282 39,282 39,282 Prepared on Australian Accounting Standards basis.

AusAID Additional Estimates Statements
100
Table 3.2.10: Schedule of Administered Capital Budget Actual Revised Forward Forward Forward
budget estimate estimate estimate
2011-12 2012-13 2013-14 2014-15 2015-16
$'000 $'000 $'000 $'000 $'000
CAPITAL APPROPRIATIONS
Capital budget - Bill 1 (ACB) 2,441 2,461 2,505 2,293 2,325
Administered assets and
liabilities - Bill 2 47,903 507,384 604,144 - -
Total capital appropriations 50,344 509,845 606,649 2,293 2,325
Total new capital appropriations
Represented by:
Purchase of non-financial assets 2,441 2,461 2,505 2,293 2,325
Other Items 47,903 507,384 604,144 - -
Total Items 50,344 509,845 606,649 2,293 2,325
PURCHASE OF NON-FINANCIAL
ASSETS
Funded by capital appropriation - ACB 2,441 2,461 2,505 2,293 2,325
TOTAL 2,441 2,461 2,505 2,293 2,325
RECONCILIATION OF CASH
USED TO ACQUIRE ASSETS
TO ASSET MOVEMENT TABLE
Total purchases 2,441 2,461 2,505 2,293 2,325
Total cash used to
acquire assets 2,441 2,461 2,505 2,293 2,325 Consistent with information contained in the Statement of Asset Movements and the Budgeted Statement of Cash Flows.

AusAID Additional Estimates Statements
101
Table 3.2.11: Statement of Administered Asset Movements (2012-13) Buildings Other Intangibles Total
property,
plant and
equipment
$'000 $'000 $'000 $'000
As at 1 July 2012
Gross book value 3,919 4,233 9,262 17,414
Accumulated depreciation/amortisation and
impairment (958) (4,210) (2,807) (7,975)
Opening net book balance 2,961 23 6,455 9,439
CAPITAL ASSET ADDITIONS
Estimated expenditure on
new or replacement assets
By purchase - appropriation equity - - - -
By purchase - appropriation ordinary
annual services 466 1,995 - 2,461
Total additions 466 1995 - 2461
Other movements
Assets held for sale or in a disposal
group held for sale - - - -
Depreciation/amortisation expense (887) (1,782) (44) (2,713)
Other - - - -
As at 30 June 2013
Gross book value 4,385 6,228 - 19,875
Accumulated depreciation/amortisation and
impairment (1,845) (5,992) (2,851) (10,688)
Closing net book balance 2,540 236 6,411 9,187 Prepared on Australian Accounting Standards basis.

AusAID Additional Estimates Statements
102
Explanatory Tables
Total Australian ODA by partner country and regionBudget Estimate
($m)
Revised Budget
Estimate ($m)
Country/Regional Program 2012- 13 2012- 13
Papua New Guinea 491.7 493.2
Solomon Islands 239.4 222.7
Vanuatu 72.9 59.8
Samoa 45.5 43.5
Fiji 55.6 53.8
Tonga 33.8 32.1
Nauru 31.6 31.8
Kiribati 30.4 26.9
Tuvalu 11.1 9.8
Cook Islands 3.7 4.0
Niue 4.5 3.8
North Pacific 9.6 9.3
Regional and Other Pacific 141.0 128.7
Pa c ific 1,17 0 .9 1,119 .4
Indonesia 578.4 540.1
Vietnam 150.4 134.4
Philippines 128.7 113.3
Timor- Leste 127.1 116.7
Cambodia 94.7 80.4
Myanmar 63.8 58.2
Laos 54.9 48.7
China 18.1 15.4
Mongolia 15.6 14.2
East Asia Regional 89.6 86.1
Ea st Asia 1,3 2 1.2 1,2 0 7 .5
Afghanistan 201.7 181.2
Pakistan 96.4 87.9
Bangladesh 100.5 93.4
Sri Lanka 47.1 42.5
India 18.3 17.1
Nepal 34.8 29.9
Bhutan 11.4 10.6
Maldives 7.1 6.2
South and West Asia Regional 7.9 6.3
South a nd We st Asia 5 2 5 .3 4 7 5 .2
Iraq 22.3 22.6
Palestinian Territories 56.7 55.2
Middle East and North Africa 31.4 41.1
Sub- Saharan Africa 354.6 319.7
Afric a a nd the Middle Ea st 4 6 5 .0 4 3 8 .5
Latin America 28.0 19.4
Caribbean 19.7 15.9
La tin Ame ric a a nd the Ca ribbe a n 4 7 .7 3 5 .3
Core contributions to multilateral
organisations and other ODA not attributed
to particular countries or regions 1,727.2 1,983.1
Adjustment 104.6- 104.6-
Funds approved but not yet allocated
Tota l Estima te d ODA 5 ,15 3 .0 5 ,15 4 .4
I

AusAID Additional Estimates Statements
103
AusAID country programs
Budget Estimate
($m)
Revised Budget
Estimate ($m)
Country/Region 2012-13 2012-13
Papua New Guinea 444.3 448.4 Solomon Islands 116.7 104.1 Vanuatu 55.5 41.8 Samoa 28.6 26.7 Fiji 27.0 27.4 Tonga 22.0 19.9 Nauru 23.7 23.7 Kiribati 25.5 21.7 Tuvalu 9.2 7.7 Cook Islands 2.2 2.4 Niue 3.7 2.8 North Pacific 6.4 5.6 Regional and Other Pacific 199.3 190.6
Total Pacific 964.1 922.9
Indonesia 510.1 476.6 Vietnam 116.1 102.9 Philippines 109.1 97.6 Timor-Leste 78.3 70.0 Cambodia 61.5 50.1 Myanmar 52.8 47.2 Laos 40.2 34.8 China 4.3 4.3 Mongolia 9.0 8.3 East Asia Regional 67.2 63.7
Total East Asia 1,048.6 955.6
Afghanistan 145.7 134.0 Pakistan 82.1 74.1 Bangladesh 77.1 73.1 Sri Lanka 35.1 31.8 India 3.1 3.1 Nepal 18.4 15.1 Bhutan 4.8 4.4 Maldives 4.0 3.6 South and West Asia Regional 24.5 19.2
Total South & West Asia 394.8 358.4
Iraq 21.0 19.2 Palestinian Territories 40.0 38.7 North Africa & the Middle East 20.8 30.6 Sub-Saharan Africa 242.2 209.6
Total Sub-Saharan Africa & the Middle East 324.0 298.1
Latin America 18.0 10.7 Caribbean 16.0 12.7
Total Latin America and the Caribbean 34.0 23.4
Cross Regional Programs 376.6 328.2
AusAID COUNTRY PROGRAMS 3,142.1 2,886.5

AusAID Additional Estimates Statements
104
AusAID Global ProgramsBudget Estimate
($m)
Revised Budget
Estimate ($m)
Global Program 2012- 13 2012- 13
Humanitarian and Emergency Response 278.5 208.2
International Committee of the Red Cross and Red Crescent 22.0 22.0
United Nations Humanitarian Agencies 105.0 98.0
UNOCHA 9.0 9.0
WFP 46.0 46.0
UNCERF 16.0 9.0
UNHCR 19.0 19.0
UNRWA 15.0 15.0
Huma nita ria n, Eme rge nc y a nd Re fuge e s 4 0 5 .5 3 2 8 .2
MPMF - -
ADF 629.3 629.3
IDA - -
HIPC - -
MDRI - -
GEF - -
Multila te ra l Re ple nishme nts 6 2 9 .3 6 2 9 .3
United Nations Development Agencies 124.7 115.3
UNDP 23.3 20.7
UNICEF 34.1 34.1
UNFPA 15.0 15.0
UNAIDS 9.0 7.2
WHO 23.0 20.0
UN Women 8.0 8.0
Other UN Development Agencies 12.3 10.2
Commonwealth Organisations 15.3 18.4
Contribution to Global Environment Programs 81.6 79.3
Contribution to Global Health Programs 110.5 100.2
Contribution to Global Education Programs 30.0 30.0
Contribution to Other Global Programs 6.0 6.0
UN, Commonwe a lth & Othe r Inte rna tiona l Orga nisa tions 3 6 8 .1 3 4 9 .2
Non- Government Organisations 112.4 108.1
Australian Vounteers Program 63.0 58.5
Community Engagement and Development Research 18.1 12.6
NGO a nd Community Enga ge me nt 19 3 .5 17 9 .3
Tota l AusAID Globa l Progra ms 1,5 9 6 .4 1,4 8 6 .0
Less: new multi- year commitments 629.3- 629.3-
Add: cash paid to multi- year liabilities 317.2 317.2
AusAID GLOBAL PROGRAMS 1,2 8 4 .3 1,17 3 .9 I I

AusAID Additional Estimates Statements
105
Aid delivered by Australian government agencies other than AusAIDBudget Estimate
($m)
Revised Budget
Estimate ($m)
2012-13 2012-13
Australian Federal Police 192.1 177.5
Australian Centre for International Agricultural Research (ACIAR) 100.0 92.4
Immigration and Citizenship 51.4 426.5
Foreign Affairs and Trade 33.8 33.8
Industry, Innovation, Science, Research and Tertiary Education 35.4 35.4
Treasury 26.3 40.2
Health and Ageing 17.3 17.3
Defence 11.7 11.7
Agriculture, Fisheries and Forestry 10.9 10.9
Attorney- General's 7.3 7.3
Education, Employment and Workplace Relations 6.1 6.1
Infrastructure and Transport 4.7 4.7
Australian Customs and Boarder Protection Service 1.0 1.0
Broadband, Communications and the Digital Economy 1.5 1.5
Finance and Deregulation 1.2 1.2
Regional Australia, Local Government, Arts and Sport 1.1 1.1
Sustainability, Environment, Water, Population and Communities 0.8 0.8
Climate Change and Energy Effic iency 0.1 0.1
Families, Housing, Community Services and Indigenous Affairs - -
Prime Minister and Cabinet - -
States and Territories 3.1 3.1
TOTAL 505.9 872.7
Department / Agency
I I


107
GLOSSARY
Term Meaning
Accrual accounting System of accounting where items are brought to account and
included in the financial statements as they are earned or
incurred, rather than as they are received or paid.
Accumulated
depreciation
The aggregate depreciation recorded for a particular
depreciating asset.
Additional
Estimates
Where amounts appropriated at Budget time are insufficient,
Parliament may appropriate more funds to portfolios through
the Additional Estimates Acts.
Administered Revenues, expenses, assets or liabilities managed by agencies
on behalf of the Commonwealth. Agencies do not control
administered items. Administered expenses include grants,
subsidies and benefits. In many cases, administered expenses
fund the delivery of third party outputs.
Annual
appropriation
Two appropriation Bills are introduced into Parliament in
May and comprise the Budget for the financial year beginning
1 July. Further Bills are introduced later in the financial year as
part of the additional estimates. Parliamentary departments
have their own appropriations.
Appropriation An authorisation by Parliament to spend moneys from the
Consolidated Revenue Fund for a particular purpose.
Capital
expenditure
Expenditure by an agency on capital projects, for example
purchasing a building.
Consolidated
Revenue Fund
Section 81 of the Constitution stipulates that all revenue raised
or money received by the Commonwealth forms the one
consolidated revenue fund (CRF).
Departmental Revenue, expenses, assets and liabilities that are controlled by
the agency in providing its outputs. Departmental items
would generally include computers, plant and equipment
assets used by agencies in providing goods and services and
most employee expenses, supplier costs and other
administrative expenses incurred.
Depreciation Apportionment of an asset’s capital value as an expense over
its estimated useful life to take account of normal usage,
obsolescence, or the passage of time.
Effectiveness
indicators
Measure the joint or independent contribution of programs to
the achievement of their specified outcome.
Efficiency Measure the adequacy of an agency’s management of its
programs. Includes price, quality and quantity indicators. The

108
indicators interrelationship between the three efficiency indicators of any
one program should be considered when judging efficiency.
Equity or net assets Residual interest in the assets of an entity after deduction of
its liabilities.
Expense Total value of all of the resources consumed in producing
goods and services or the loss of future economic benefits in
the form of reductions in assets or increases in liabilities of an
entity.
Fair value Valuation methodology: the amount for which an asset could
be exchanged, or a liability settled, between knowledgeable
and willing parties in an arm’s length transaction. The fair
value can be affected by the conditions of the sale, market
conditions and the intentions of the asset holder.
Operating result Equals revenue less expense.
Outcomes The Government’s objectives in each portfolio area. Outcomes
are desired results, impacts or consequences for the Australian
community as influenced by the actions of the Australian
Government. Actual outcomes are assessments of the end
results or impacts actually achieved.
Price One of the three key efficiency indicators. The amount the
government or the community pays for the delivery of
programs.
Program Activity that delivers benefits, services or transfer payments to
individuals, industry and/or the community as a whole, with
the aim of achieving the intended result specified in an
outcome statement.
Quality One of the three key efficiency indicators. Relates to the
characteristics by which customers or stakeholders judge an
organisation, product or service. Assessment of quality
involves use of information gathered from interested parties
to identify differences between the user’s expectations and
experiences.
Quantity One of the three key efficiency indicators. Examples include:
the size of a program; count or volume measures; how many
or how much.
Revenue Total value of resources earned or received to cover the
production of goods and services.
Special Account Balances existing within the Consolidated Revenue Fund
(CRF) that are supported by standing appropriations
(Financial Management and Accountability (FMA) Act 1997,
subsection 20 and 21). Special Accounts allow money in the
CRF to be acknowledged as set-aside (hypothecated) for a
particular purpose. Amounts credited to a Special Account

109
may only be spent for the purposes of the Special Account.
Special Accounts can only be established by a written
determination of the Finance Minister (section 20 FMA Act) or
through an Act of Parliament (referred to in section 21 of the
FMA Act).
Special
Appropriations
(including Standing
Appropriations)
An amount of money appropriated by a particular Act of
Parliament for a specific purpose and number of years. For
Special Appropriations the authority to withdraw funds from
the Consolidated Revenue Fund does not generally cease at
the end of the financial year. Standing Appropriations are a
sub-category consisting of ongoing Special Appropriations -
the amount appropriated will depend on circumstances
specified in the legislation.