Embed Size (px)
Citation preview

Portfolio Additional Estimates Statements 2014–15
Employment Portfolio
Explanations of Additional Estimates 2014–15

© Commonwealth of Australia 2015
ISSN 2203–2991 (print)
ISSN 2203–3009 (online)
This publication is available for your use under a Creative Commons BY Attribution
3.0 Australia licence, with the exception of the Commonwealth Coat of Arms, the
Department of Employment logo, photographs, images, signatures and where
otherwise stated. The full licence terms are available from http://creativecommons.org/licenses/by/3.0/au/legalcode.
Use of Department of Employment material under a Creative Commons BY
Attribution 3.0 Australia licence requires you to attribute the work (but not in any
way that suggests that the Department of Employment endorses you or your use of
the work).
Department of Employment material used 'as supplied'
Provided you have not modified or transformed Department of Employment
material in any way including, for example, by changing the Department of
Employment text; calculating percentage changes; graphing or charting data; or
deriving new statistics from published Department of Employment statistics – then
Department of Employment prefers the following attribution:
Source: The Australian Government Department of Employment
Derivative material
If you have modified or transformed Department of Employment material, or
derived new material from those of the Department of Employment in any way, then
Department of Employment prefers the following attribution:
Based on The Australian Government Department of Employment data
Use of the Coat of Arms
The terms under which the Coat of Arms can be used are set out on the It’s an
Honour website (see www.itsanhonour.gov.au).
Other Uses
Inquiries regarding this licence and any other use of this document are welcome at:
Department of Employment on 1300 488 064.

iii

iv
Abbreviations and conventions
The following notations may be used:
NEC/nec not elsewhere classified
- nil
.. not zero, but rounded to zero
na not applicable (unless otherwise specified)
nfp not for publication
$m $ million
Figures in tables and in the text may be rounded. Figures in text are generally
rounded to one decimal place, whereas figures in tables are generally rounded to the
nearest thousand. Discrepancies in tables between totals and sums of components
are due to rounding.
ENQUIRIES
Should you have any enquiries regarding this publication please contact
Glen Casson, Acting Chief Finance Officer in the Department of Employment on
1300 488 064.
A copy of this document can be located on the Australian Government Budget
website at: http://www.budget.gov.au.
USER GUIDE TO THE
PORTFOLIO ADDITIONAL ESTIMATES STATEMENTS

6
USER GUIDE
The purpose of the Portfolio Additional Estimates Statements (PAES), like that of the
Portfolio Budget Statements (PB Statements), is to inform Senators and Members of
Parliament of the proposed allocation of resources to government outcomes by
entities within the portfolio. The focus of the PAES differs from the PB Statements in
one important aspect. While the PAES include an Entity Resource Statement to
inform Parliament of the revised estimate of the total resources available to an entity,
the focus of the PAES is on explaining the changes in resourcing by outcome(s) since
the Budget. As such, the PAES provides information on new measures and their
impact on the financial and non-financial planned performance of programmes
supporting those outcomes.
The PAES facilitate understanding of the proposed appropriations in Appropriation
Bills (Nos. 3 and 4) 2014–15. In this sense the PAES is declared by the Additional
Estimates Appropriation Bills to be a ‘relevant document’ to the interpretation of the
Bills according to section 15AB of the Acts Interpretation Act 1901.
Whereas the Mid-Year Economic and Fiscal Outlook (MYEFO) 2014–15 is a mid-year
budget report which provides updated information to allow the assessment of the
government’s fiscal performance against its fiscal strategy, the PAES update the most
recent budget appropriations for entities within the portfolio.

7
Structure of the Portfolio Additional Estimates Statements
The PAES are presented in three parts with subsections.
User Guide
Provides a brief introduction explaining the purpose of the PAES.
Portfolio Overview
Provides an overview of the portfolio, including a chart that outlines the outcomes for entities
in the portfolio.
Entity Additional Estimates Statements
A statement (under the name of the entity) for each entity affected by Additional Estimates.
Section 1: Entity
Overview and Resources
This section details the total resources available to an entity, the
impact of any measures since Budget, and impact on
Appropriation Bills Nos. 3 and 4.
Section 2: Revisions to
Outcomes and Planned
Performance
This section details changes to government outcomes and/or
changes to the planned performance of entity programmes.
Section 3: Explanatory
Tables and Budgeted
Financial Statements
This section contains updated explanatory tables on special
account flows and staffing levels and revisions to the budgeted
financial statements.


9
CONTENTS
Portfolio Overview ....................................................................................................... 11
Department of Employment ........................................................................................ 17


Portfolio Overview
11
PORTFOLIO OVERVIEW
There have been no significant changes to the portfolio to that described in the 2014–15 Portfolio Budget Statements.
A full outline of the Employment portfolio can be found at Figure 1.

Portfolio Overview
12
Figure 1: Employment Portfolio Structure and Outcomes
Senator the Hon. Eric Abetz, Minister for Employment
The Hon. Luke Hartsuyker MP, Assistant Minister for Employment
Department of Employment
Renée Leon PSM—Secretary
Outcome 1
Foster a productive and competitive labour market through employment policies and programmes that assist job seekers into work, meet employer needs and increase Australia’s workforce participation.
Outcome 2
Facilitate jobs growth through policies that promote fair, productive and safe workplaces.
Asbestos Safety and Eradication Agency
Peter Tighe, Chief Executive Officer
Outcome
Assist in the prevention of exposure to asbestos fibres and the elimination of asbestos-related disease in Australia through implementing the National Strategic Plan for Asbestos Awareness and Management in Australia.
Comcare
Jennifer Taylor, Chief Executive Officer
Outcome 1
The protection of the health, safety and welfare at work of workers covered by the Comcare scheme through education, assurance and enforcement.
Outcome 2
An early and safe return to work and access to compensation for injured workers covered by the Comcare scheme through working in partnership with employers to create best practice in rehabilitation and quick and accurate management of workers’ compensation claims.
Outcome 3
Access to compensation for people with asbestos-related diseases where the Commonwealth has a liability.

Portfolio Overview
13
Fair Work Building and Construction Nigel Hadgkiss APM, Director
Outcome
Enforce workplace relations laws in the building and construction industry and ensure
compliance with those laws by all participants in the building and construction
industry through the provision of education, assistance and advice.
Fair Work Commission
Bernadette O’Neill, General Manager
Outcome
Simple, fair and flexible workplace relations for employees and employers through the
exercise of powers to set and vary minimum wages and modern staff awards, facilitate
collective bargaining, approve agreements and deal with disputes.
Office of the Fair Work Ombudsman
Natalie James, Ombudsman
Outcome
Compliance with workplace relations legislation by employees and employers through advice, education and, where necessary, enforcement.
Safe Work Australia
Michelle Baxter, Chief Executive Officer
Outcome
Healthier, safer and more productive workplaces through improvements to Australian work health and safety and workers’ compensation arrangements.
Workplace Gender Equality Agency
Helen Conway, Director
Outcome
Promote and improve gender equality in Australian workplaces including the provision of advice and assistance to employers and the assessment and measurement of workplace gender data.


15
ADDITIONAL ESTIMATES STATEMENTS
Department of Employment ........................................................................................ 17


Additional Estimates Statements—Department of Employment
17
DEPARTMENT OF EMPLOYMENT
Section 1: Overview and Resources ......................................................................... 18
1.1 Strategic Direction .................................................................................................. 18
1.2 Resource Statement ............................................................................................... 18
1.3 Measures Table ...................................................................................................... 22
1.4 Additional Estimates and Variations ....................................................................... 25
1.5 Breakdown of Additional Estimates by Appropriation Bill ....................................... 28
Section 2: Revisions to Entity Outcomes and Planned Performance.................... 30
2.1 Resources and Performance Information ............................................................... 30
Section 3: Explanatory Tables and Budgeted Financial Statements ..................... 37
3.1 Explanatory Tables ................................................................................................. 37
3.2 Budgeted Financial Statements ............................................................................. 37

Additional Estimates Statements—Department of Employment
18
DEPARTMENT OF EMPLOYMENT
Section 1: Entity Overview and Resources
1.1 STRATEGIC DIRECTION
The Department of Employment was created on 18 September 2013. The role of the
department is to provide policy advice and support, and implement programmes to
deliver the Australian Government’s agenda to create more jobs, increase
productivity and improve workplaces and safety through pursuing its two
outcomes:
Foster a productive and competitive labour market through employment
policies and programmes that assist job seekers into work, meet employer
needs and increase Australia’s workforce participation.
Facilitate jobs growth through policies that promote fair, productive and
safe workplaces.
A full outline of the Department of Employment’s strategic direction can be found in the 2014–15 Portfolio Budget Statements.
1.2 RESOURCE STATEMENT
The Resource Statement details the resourcing for the Department of Employment at
Additional Estimates. Table 1.1 outlines the total resourcing available from all
sources for the 2014–15 Budget year, including variations through Appropriation Bill
Nos. 3 and 4 and Special Appropriations.

Additional Estimates Statements—Department of Employment
19
Table 1.1: Department of Employment Resource Statement—Additional Estimates for 2014–15 as at Additional Estimates February 2015
Total Estimate as Proposed Total
available at Budget Additional estimate
appropriation Estimate at Additional
Estimates
2013–14 2014–15 2014–15 2014–15
$'000 $'000 $'000 $'000
Ordinary annual services1
Departmental appropriation
Prior year departmental appropriation2
- - - -
Departmental appropriation3
320,340 282,754 44,259 327,013
s74 Retained Revenue Receipts4
16,672 17,454 2,728 20,182
Total 337,012 300,208 46,987 347,195
Administered expenses
Outcome 1 1,438,841 1,453,525 70,792 1,524,317
Outcome 2 24,823 28,247 (287) 27,960
Payments to corporate entities5 1,433 7,563 - 7,563
Total 1,465,097 1,489,335 70,505 1,559,840
Total ordinary annual services A 1,802,109 1,789,543 117,492 1,907,035
Departmental non-operating
Equity injections 2,127 5,926 18,061 23,987
Total 2,127 5,926 18,061 23,987
Administered non-operating
Administered assets and liabilities 80 - - -
Total 80 - - -
Total other services B 2,207 5,926 18,061 23,987
Total available annual
appropriations 1,804,316 1,795,469 135,553 1,931,022
Special appropriations
Special appropriations limited
by criteria/entitlement
Coal Mining Industry (Long Service
Leave Funding) Act 1992 127,622 174,618 - 174,618
Safety, Rehabilitation and
Compensation Act 1988 31,766 39,503 (1,830) 37,673
Asbestos-related Claims
(Management of Commonwealth
Liabilities) Act 2005 17,968 26,356 (3,469) 22,887
Fair Entitlements Guarantee Act
2012 144,647 204,997 3,083 208,080
Total special appropriations C 322,003 445,474 (2,216) 443,258
Total appropriations excluding
Special Accounts 2,126,319 2,240,943 133,337 2,374,280

Additional Estimates Statements—Department of Employment
20
Table 1.1: Department of Employment Resource Statement—Additional Estimates for 2014–15 as at Additional Estimates February 2015 (continued)
Total Estimate as Proposed Total
available at Budget Additional estimate
appropriation Estimate at Additional
Estimates
2013–14 2014–15 2014–15 2014–15
$'000 $'000 $'000 $'000
Special Accounts
Opening balance6
- - - -
Total Special Account D - - - -
Total resourcing
(A+B+C+D) 2,126,319 2,240,943 133,337 2,374,280
Less appropriations drawn from
payments to corporate entities
through annual appropriations (1,433) (7,563) - (7,563)
Total net resourcing for Department
of Employment 2,124,886 2,233,380 133,337 2,366,717 1 Appropriation Act (No. 1) 2014–2015 and Appropriation Bill (No. 3) 2014-2015.
2 Estimated adjusted balance carried from previous year for annual appropriations.
3 Includes an amount of $31.0m in 2014–15 for the Departmental Capital Budget (refer to table 3.2.5 for
further details). For accounting purposes this amount has been designated as 'contributions by owners'.
4 Estimated retained revenue receipts under section 74 of the Public Governance, Performance and
Accountability (PGPA) Act 2013. 5 'Corporate Entities' are Corporate Commonwealth Entities and Commonwealth Companies as defined
under the PGPA Act 2013. 6 Estimated opening balance for Special Accounts (less ‘Special Public Money’ held in a Services for
Other Entities and Trust Moneys Special Accounts (SOETM)).
Reader note: All figures are GST exclusive.

Additional Estimates Statements—Department of Employment
21
Table 1.1: Department of Employment Resource Statement—Additional Estimates for 2014–15 as at Additional Estimates February 2015 (continued)
Third Party Payments from and on behalf of other entities
Estimate at Estimate at
Budget Additional
Estimates
2014–15 2014–15
$'000 $'000
Receipts received from other entities for the provision of services
(disclosed above in s74 Retained Revenue Receipts section) 17,454 20,182
Payments made to corporate entities within the Portfolio
Comcare
Annual Appropriation Bill 1 - Outcome 2 7,563 7,563

Additional Estimates Statements—Department of Employment
22
1.3 MEASURES TABLE
Table 1.2 summarises new government measures taken since the 2014–15 Budget.
The table is split into revenue, expense and capital measures, with the affected
programme identified.
Table 1.2: Department of Employment 2014–15 Measures since Budget
Programme 2014–15 2015–16 2016–17 2017–18
$'000 $'000 $'000 $'000
Expense measures
Communication and Public Affairs
Savings All
Administered expenses - - - -
Departmental expenses (120) (239) (238) (241)
Total (120) (239) (238) (241)
Employment Services 20151 1.1
Administered expenses - - - -
Departmental expenses - - - -
Total - - - -
Strengthening the Job Seeker
Compliance Framew ork 1.1
Administered expenses 2,273 58 - -
Departmental expenses 1,581 221 - -
Total 3,854 279 - -
New Enterprise Incentive Scheme
Allow ance - duration of maximum
payment period - reduction2 1.1
Administered expenses - - - -
Departmental expenses - - - -
Total - - - -
Reform of the Remote Jobs and
Communities Programme3 1.1
Administered expenses - - - -
Departmental expenses 160 - - -
Total 160 - - -
Disability Support Pension - revised
assessment process4 1.1
Administered expenses 74 106 287 346
Departmental expenses - 68 - -
Total 74 174 287 346

Additional Estimates Statements—Department of Employment
23
Table 1.2: Department of Employment 2014–15 Measures since Budget (continued)
Programme 2014–15 2015–16 2016–17 2017–18
$'000 $'000 $'000 $'000
Introduction of Temporary Protection
Visas and Safe Haven Enterprise Visas51.1
Administered expenses - 213 22 (645)
Departmental expenses - - - -
Total - 213 22 (645)
Smaller Government - Employment
Portfolio 2.2
Administered expenses - - - -
Departmental expenses - (33) (33) (34)
Total - (33) (33) (34)
Industry grants to peak bodies -
cessation 2.2
Administered expenses - - - -
Departmental expenses (937) (448) - -
Total (937) (448) - -
Total expense measures
Administered 2,347 377 309 (299)
Departmental 684 (431) (271) (275)
Total 3,031 (54) 38 (574)
Capital measures
Employment Services 20151 1.1
Administered capital - - - -
Departmental capital - - - -
Total - - - -
Strengthening the Job Seeker
Compliance Framew ork 1.1
Administered capital - - - -
Departmental capital 943 - - -
Total 943 - - -
Reform of the Remote Jobs and
Communities Programme3 1.1
Administered capital - - - -
Departmental capital 3,039 - - -
Total 3,039 - - -

Additional Estimates Statements—Department of Employment
24
Table 1.2: Department of Employment 2014–15 Measures since Budget (continued)
Programme 2014–15 2015–16 2016–17 2017–18
$'000 $'000 $'000 $'000Disability Support Pension - revised
assessment process4
1.1
Administered capital - - - -
Departmental capital - 1,297 - -
Total - 1,297 - -
Total capital measures
Administered - - - -
Departmental 3,982 1,297 - -
Total 3,982 1,297 - -
1 Provision for this measure was already included in the forward estimates at the 2014-15 Budget.
2 Provision for this measure was already included in the forward estimates at the 2014-15 Budget.
3 The lead entity for the measure is the Department of the Prime Minister and Cabinet. The full measure
description and package details appear in MYEFO under the Prime Minister and Cabinet portfolio. 4 The lead entity for the measure is the Department of Social Services. The full measure description and
package details appear in MYEFO under the Social Services portfolio. 5 The lead entity for the measure is the Department of Immigration and Border Protection. The full
measure description and package details appear in MYEFO under the Immigration and Border Protection portfolio.
Prepared on a Government Financial Statistics (fiscal) basis.

Additional Estimates Statements—Department of Employment
25
1.4 ADDITIONAL ESTIMATES AND VARIATIONS
The following tables detail the changes to the resourcing for the Department of
Employment at Additional Estimates, by outcome. Table 1.3 details the Additional
Estimates and variations resulting from new measures since the 2014–15 Budget in
Appropriation Bills Nos. 3 and 4. Table 1.4 details Additional Estimates or variations
through other factors, such as parameter adjustments.
Table 1.3: Additional Estimates and Variations to Outcomes from Measures since 2014–15 Budget
Programme 2014–15 2015–16 2016–17 2017–18
impacted $'000 $'000 $'000 $'000
All Outcomes
Decrease in estimates (departmental)
Communication and Public Affairs
Savings All (120) (239) (238) (241)
Net impact on estimates
for All Outcomes (departmental) (120) (239) (238) (241)
Outcome 1
Increase in estimates (administered)
Strengthening the Job Seeker
Compliance Framework1.1 2,273 58 - -
Disability Support Pension - revised
assessment process1.1 74 106 287 346
Introduction of Temporary Protection
Visas and Safe Haven Enterprise
Visas
1.1 - 213 22 -
Decrease in estimates (administered)
Introduction of Temporary Protection
Visas and Safe Haven Enterprise
Visas
1.1 - - - (645)
Net impact on estimates
for Outcome 1 (administered) 2,347 377 309 (299)
Increase in estimates (departmental)
Strengthening the Job Seeker
Compliance Framework1.1 1,581 221 - -
Reform of the Remote Jobs and
Communities Programme1.1 160 - - -
Disability Support Pension - revised
assessment process1.1 - 68 - -
Decrease in estimates (departmental)
Net impact on estimates
for Outcome 1 (departmental) 1,741 289 - -

Additional Estimates Statements—Department of Employment
26
Table 1.3: Additional Estimates and Variations to Outcomes from Measures since 2014–15 Budget (continued)
Programme 2014–15 2015–16 2016–17 2017–18
impacted $'000 $'000 $'000 $'000
Outcome 2
Decrease in estimates (departmental)
Smaller Government - Employment
Portfolio2.2 - (33) (33) (34)
Industry grants to peak bodies -
cessation2.2 (937) (448) - -
Net impact on estimates
for Outcome 2 (departmental) (937) (481) (33) (34)

Additional Estimates Statements—Department of Employment
27
Table 1.4: Additional Estimates and Variations to Outcomes from Other Variations
Programme 2014–15 2015–16 2016–17 2017–18
impacted $'000 $'000 $'000 $'000
Outcome 1
Increase in estimates (administered)
Changes in number of unemployment
beneficiaries1.1 2,166 - - -
Programme specific parameter 1.1 75,634 2,456 4,549 5,142
Decrease in estimates (administered)
Parameter Adjustments 1.1 - (5) (10) (10)
Programme specific parameter 1.1 - (242,823) (159,807) (253,434)
Other 1.1 (9,355) (27,368) (7,122) (5,529)
Net impact on estimates
for Outcome 1 (administered) 68,445 (267,740) (162,390) (253,831)
Increase in estimates (departmental)
Programme specific parameter 1 8,967 11,208 8,527 9,441
Self balancing transfers between
same year1 49,585 48,971 49,986 50,279
Decrease in estimates (departmental)
Parameter Adjustments 1 - (378) (373) (566)
Net impact on estimates
for Outcome 1 (departmental) 58,552 59,801 58,140 59,154
Outcome 2
Increase in estimates (administered)
Related entity 2.3 - 3,180 1,196 2,317
Programme specific parameter 2.2 261 258 - -
Other 2.1 3,083 - - -
Decrease in estimates (administered)
Parameter Adjustments 2.2, 2.3 (239) (476) (503) (593)
Programme specific parameter 2.2 - - (7) (8)
Related entity 2.3 (5,299) (557) (38) (38)
Other 2.2 (309) (313) - -
Net impact on estimates
for Outcome 2 (administered) (2,503) 2,092 648 1,678
Increase in estimates (departmental)
Self balancing transfers between
same year2 22,176 2,934 3,089 3,132
Decrease in estimates (departmental)
Parameter Adjustments 2 - (155) (154) (233)
Self balancing transfers between
same year2 (41,003) (40,168) (40,719) (40,883)
Net impact on estimates
for Outcome 2 (departmental) (18,827) (37,389) (37,784) (37,984)

Additional Estimates Statements—Department of Employment
28
1.5 BREAKDOWN OF ADDITIONAL ESTIMATES BY APPROPRIATION
BILL
The following tables detail the Additional Estimates sought for the Department of
Employment through Appropriation Bills Nos. 3 and 4.
Table 1.5: Appropriation Bill (No. 3) 2014–15
2013–14 2014–15 2014–15 Additional Reduced
Available Budget Revised Estimates Estimates
$'000 $'000 $'000 $'000 $'000
ADMINISTERED ITEMS
Outcome 1
Foster a productive and
competitive labour market
through employment policies
and programmes that assist job 1,438,841 1,453,525 1,524,317 70,792 -
seekers into work, meet
employer needs and increase
Australia's workforce
participation.
Outcome 2
Facilitate jobs growth through
policies that promote fair, 24,823 28,235 27,972 - 263
productive and safe workplaces.
Total 1,463,664 1,481,760 1,552,289 70,792 263
DEPARTMENTAL PROGRAMMES
Outcome 1
Foster a productive and
competitive labour market
through employment policies
and programmes that assist job 311,540 204,972 269,055 64,083 -
seekers into work, meet
employer needs and increase
Australia's workforce
participation.
Outcome 2
Facilitate jobs growth through
policies that promote fair, 8,800 77,782 57,958 - 19,824
productive and safe workplaces.
Total 320,340 282,754 327,013 64,083 19,824
Total administered and
departmental 1,784,004 1,764,514 1,879,302 134,875 20,087
Additional Estimates Statements—Department of Employment
29
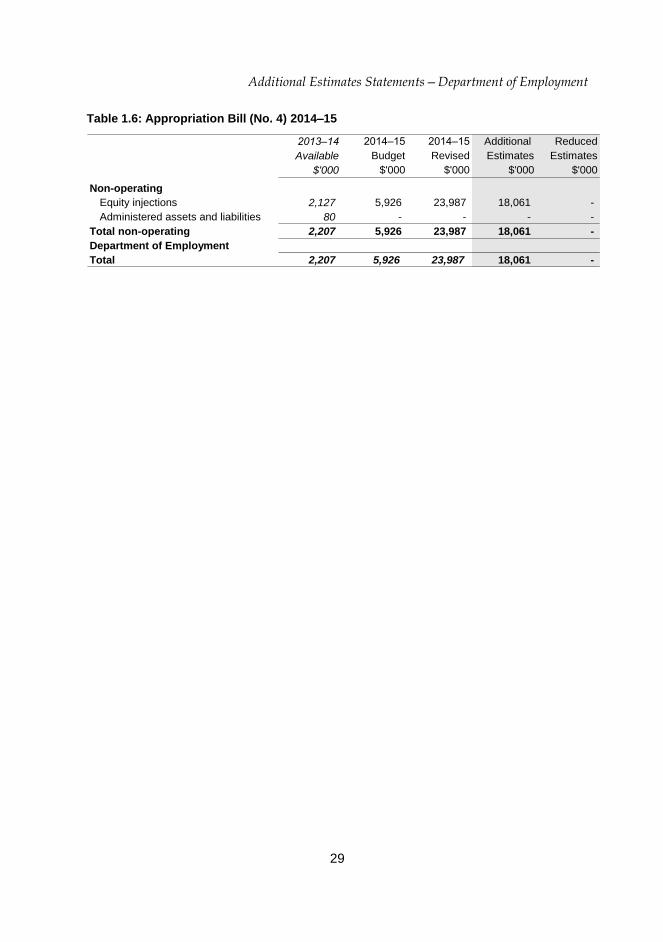
Table 1.6: Appropriation Bill (No. 4) 2014–15
2013–14 2014–15 2014–15 Additional Reduced
Available Budget Revised Estimates Estimates
$'000 $'000 $'000 $'000 $'000
Non-operating
Equity injections 2,127 5,926 23,987 18,061 -
Administered assets and liabilities 80 - - - -
Total non-operating 2,207 5,926 23,987 18,061 -
Department of Employment
Total 2,207 5,926 23,987 18,061 -

Additional Estimates Statements—Department of Employment
30
Section 2: Revisions to Entity Outcomes and Planned Performance
2.1 RESOURCES AND PERFORMANCE INFORMATION
No changes have been made to the Department of Employment’s outcome structure since the 2014–15 Portfolio Budget Statements. Complete details of the department’s outcomes and performance information can be found in the 2014–15 Portfolio Budget Statements.
OUTCOME 1
Outcome 1 Foster a productive and competitive labour market through employment policies and programmes that assist job seekers into work, meet employer needs and increase Australia’s workforce participation.
Outcome 1 Strategy
No changes have been made to this outcome strategy since the 2014–15 Portfolio Budget Statements.
Additional Estimates Statements—Department of Employment
31
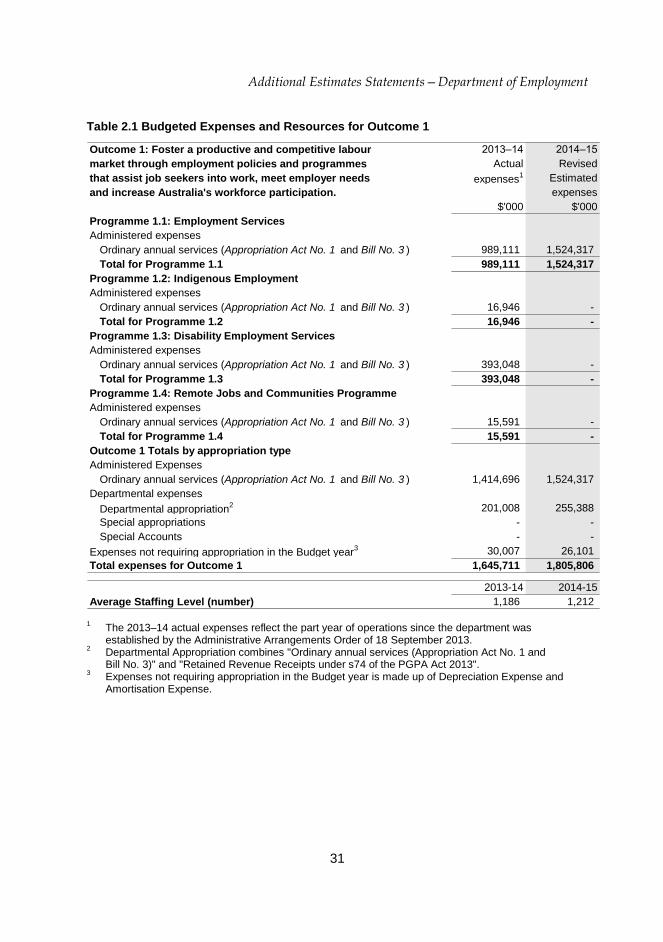
Table 2.1 Budgeted Expenses and Resources for Outcome 1
Outcome 1: Foster a productive and competitive labour 2013–14 2014–15
market through employment policies and programmes Actual Revised
that assist job seekers into work, meet employer needs expenses1 Estimated
and increase Australia's workforce participation. expenses
$'000 $'000
Programme 1.1: Employment Services
Administered expenses
Ordinary annual services (Appropriation Act No. 1 and Bill No. 3 ) 989,111 1,524,317
Total for Programme 1.1 989,111 1,524,317
Programme 1.2: Indigenous Employment
Administered expenses
Ordinary annual services (Appropriation Act No. 1 and Bill No. 3 ) 16,946 -
Total for Programme 1.2 16,946 -
Programme 1.3: Disability Employment Services
Administered expenses
Ordinary annual services (Appropriation Act No. 1 and Bill No. 3 ) 393,048 -
Total for Programme 1.3 393,048 -
Programme 1.4: Remote Jobs and Communities Programme
Administered expenses
Ordinary annual services (Appropriation Act No. 1 and Bill No. 3 ) 15,591 -
Total for Programme 1.4 15,591 -
Outcome 1 Totals by appropriation type
Administered Expenses
Ordinary annual services (Appropriation Act No. 1 and Bill No. 3 ) 1,414,696 1,524,317
Departmental expenses
Departmental appropriation2 201,008 255,388
Special appropriations - -
Special Accounts - -
Expenses not requiring appropriation in the Budget year3 30,007 26,101
Total expenses for Outcome 1 1,645,711 1,805,806
2013-14 2014-15
Average Staffing Level (number) 1,186 1,212
1 The 2013–14 actual expenses reflect the part year of operations since the department was
established by the Administrative Arrangements Order of 18 September 2013. 2 Departmental Appropriation combines "Ordinary annual services (Appropriation Act No. 1 and
Bill No. 3)" and "Retained Revenue Receipts under s74 of the PGPA Act 2013". 3 Expenses not requiring appropriation in the Budget year is made up of Depreciation Expense and
Amortisation Expense.

Additional Estimates Statements—Department of Employment
32
Programme 1.1 Employment Services
Performance information contained in the 2014–15 Portfolio Budget Statements has not changed.
Table 2.1.1 Programme Expenses
2013–14 2014–15 2015–16 2016–17 2017–18
Actual1 Revised Forward Forward Forward
budget year 1 year 2 year 3
('000) $'000 $'000 $'000 $'000 $'000
Annual administered expenses:
Employment Services 2015 - 6,756 1,497,370 1,697,057 1,671,509
Job Services Australia 984,227 1,512,472 - - -
Job Commitment Bonus - 10 31,832 59,384 60,095
Seasonal Worker Programme 118 1,259 1,681 1,710 1,740
Regional Education, Skills and Jobs Plans 398 - - - -
Mature Age Employment 2,827 3,820 3,279 3,345 3,405
Productive Ageing Package 1,029 - - - -
Ford Assistance Package 512 - - - -
Total programme expenses 989,111 1,524,317 1,534,162 1,761,496 1,736,749
1 The 2013–14 actual expenses reflect the part year of operations since the department was
established by the Administrative Arrangements Order of 18 September 2013. Linked to: Department of Human Services, Programme 1.1 Services to the Community – Social Security and Welfare and the Department of the Prime Minister and Cabinet, Programme 2.1 Indigenous Advancement - Jobs, Land and Economy.
Programme 1.2 Indigenous Employment
This programme records the part-year effect of those functions that transferred to the
Department of the Prime Minister and Cabinet as a result of the Administrative
Arrangements Order that took effect on 18 September 2013.
Table 2.1.2 Programme Expenses
2013–14 2014–15 2015–16 2016–17 2017–18
Actual Revised Forward Forward Forward
budget year 1 year 2 year 3
('000) $'000 $'000 $'000 $'000 $'000
Annual administered expenses:
Indigenous Employment Programme 16,946 - - - -
Total programme expenses 16,946 - - - - Linked to: Department of the Prime Minister and Cabinet, Programme 2.1 Indigenous Advancement - Jobs, Land and Economy.

Additional Estimates Statements—Department of Employment
33
Programme 1.3 Disability Employment Services
This programme records the part-year effect of those functions that transferred to the
Department of Social Services as a result of the Administrative Arrangements Order
that took effect on 18 September 2013.
Table 2.1.3 Programme Expenses
2013–14 2014–15 2015–16 2016–17 2017–18
Actual Revised Forward Forward Forward
budget year 1 year 2 year 3
('000) $'000 $'000 $'000 $'000 $'000
Annual administered expenses:
Disability Employment Services 377,983 - - - -
Employment Assistance and Other
Services 15,065 - - - -
Total programme expenses 393,048 - - - - Linked to: Department of Social Services, Programme 5.1 Disability Employment Services and Programme 5.2 National Disability Insurance Scheme.
Programme 1.4 Remote Jobs and Communities Programme
This programme records the part-year effect of those functions that transferred to the
Department of the Prime Minister and Cabinet as a result of the Administrative
Arrangements Order that took effect on 18 September 2013.
Table 2.1.4 Programme Expenses
2013–14 2014–15 2015–16 2016–17 2017–18
Actual Revised Forward Forward Forward
budget year 1 year 2 year 3
('000) $'000 $'000 $'000 $'000 $'000
Annual administered expenses:
Remote Participation and Employment
Services 14,873 - - - -
Remote Youth Leadership and
Development Corps 718 - - - -
Total programme expenses 15,591 - - - - Linked to: Department of the Prime Minister and Cabinet, Programme 2.1 Indigenous Advancement - Jobs, Land and Economy.

Additional Estimates Statements—Department of Employment
34
OUTCOME 2
Outcome 2 Facilitate jobs growth through policies that promote fair, productive and safe workplaces.
Outcome 2 Strategy
No changes have been made to this outcome strategy since the 2014–15 Portfolio Budget Statements.
Table 2.2 Budgeted Expenses and Resources for Outcome 2
Outcome 2: Facilitate jobs growth through policies that 2013–14 2014–15
promote fair, productive and safe workplaces. Actual Revised
expenses1 Estimated
expenses
$'000 $'000
Programme 2.1: Employee Assistance
Administered expenses
Ordinary annual services (Appropriation Act No. 1 and Bill No. 3 ) 9,217 13,317
Special appropriations 280,395 382,698
Total for Programme 2.1 289,612 396,015
Programme 2.2: Workplace Assistance
Administered expenses
Ordinary annual services (Appropriation Act No. 1 and Bill No. 3 ) 10,568 14,643
Total for Programme 2.2 10,568 14,643
Programme 2.3: Workers Compensation Payments
Administered expenses
Ordinary annual services (Appropriation Act No. 1 and Bill No. 3 ) (17,489) 7,563
Special appropriations 49,734 60,560
Total for Programme 2.3 32,245 68,123
Outcome 2 Totals by appropriation type
Administered Expenses
Ordinary annual services (Appropriation Act No. 1 and Bill No. 3 ) 2,296 35,523
Special appropriations 330,129 443,258
Departmental expenses
Departmental appropriation2 84,756 60,783
Special appropriations - -
Special Accounts - -
Expenses not requiring appropriation in the Budget year3 13,355 4,248
Total expenses for Outcome 2 430,536 543,812
2013-14 2014-15
Average Staffing Level (number) 474 483
1 The 2013–14 actual expenses reflect the part year of operations since the department was
established by the Administrative Arrangements Order of 18 September 2013. 2 Departmental Appropriation combines "Ordinary annual services (Appropriation Act No. 1 and
Bill No. 3)" and "Retained Revenue Receipts under s74 of the PGPA Act 2013". 3 Expenses not requiring appropriation in the Budget year is made up of Depreciation Expense and
Amortisation Expense.

Additional Estimates Statements—Department of Employment
35
Programme 2.1 Employee Assistance
Performance information contained in the 2014–15 Portfolio Budget Statements has not changed.
Table 2.2.1 Programme Expenses
2013–14 2014–15 2015–16 2016–17 2017–18
Actual1 Revised Forward Forward Forward
budget year 1 year 2 year 3
('000) $'000 $'000 $'000 $'000 $'000
Annual administered expenses:
General Employee Entitlements and
Redundancy Scheme 9,217 12,817 - - -
Fair Entitlements Guarantee - 500 1,050 1,750 1,750
Special Appropriations:
Coal Mining Industry (LSL) Funding Act
1992 133,578 174,618 174,618 174,618 174,618
Fair Entitlements Guarantee Act 2012 146,817 208,080 198,768 199,264 195,532
Total programme expenses 289,612 396,015 374,436 375,632 371,900 1 The 2013–14 actual expenses reflect the part year of operations since the department was
established by the Administrative Arrangements Order of 18 September 2013.
Programme 2.2 Workplace Assistance
Performance information contained in the 2014–15 Portfolio Budget Statements has not changed.
Table 2.2.2 Programme Expenses
2013–14 2014–15 2015–16 2016–17 2017–18
Actual1 Revised Forward Forward Forward
budget year 1 year 2 year 3
('000) $'000 $'000 $'000 $'000 $'000
Annual administered expenses:
International Labour Organization
Subscription 7,297 9,948 9,712 9,491 9,582
Protected Action Ballots Scheme 682 1,600 1,600 1,600 1,600
Centre for Workplace Leadership 1,620 3,095 3,133 - -
Award Modernisation 969 - - - -
Total programme expenses 10,568 14,643 14,445 11,091 11,182 1 The 2013–14 actual expenses reflect the part year of operations since the department was
established by the Administrative Arrangements Order of 18 September 2013.

Additional Estimates Statements—Department of Employment
36
Programme 2.3 Workers’ Compensation Payments
Performance information contained in the 2014–15 Portfolio Budget Statements has not changed.
Table 2.2.3 Programme Expenses
2013–14 2014–15 2015–16 2016–17 2017–18
Actual1 Revised Forward Forward Forward
budget year 1 year 2 year 3
('000) $'000 $'000 $'000 $'000 $'000
Annual administered expenses:
Comcare (17,489) 7,563 7,473 6,002 6,055
Special Appropriations:
Asbestos-related Claims Act 2005 17,968 22,887 33,211 32,574 34,472
Safety, Rehabilitation & Compensation
Act 1998 31,766 37,673 37,744 36,657 35,273
Total programme expenses 32,245 68,123 78,428 75,233 75,800 1 The 2013–14 actual expenses reflect the part year of operations since the department was
established by the Administrative Arrangements Order of 18 September 2013.

Additional Estimates Statements—Department of Employment
37
Section 3: Explanatory Tables and Budgeted Financial Statements
3.1 EXPLANATORY TABLES
Estimates of Special Account Flows
The Department of Employment has no special accounts. For this reason Table 3.1.1
is not presented.
3.2 BUDGETED FINANCIAL STATEMENTS
3.2.1 Analysis of Budgeted Financial Statements
The financial statements have been updated to reflect the changes resulting from the
new measures and variations as outlined in Table 1.1, Table 1.3, Table 1.4 and the
actual results for the 2013–14 financial year. The 2013–14 financial results reflect the
part year of operations since the department was established by the Administrative
Arrangements Order of 18 September 2013.

Additional Estimates Statements—Department of Employment
38
3.2.2 Budgeted Financial Statements
Table 3.2.1: Budgeted Departmental Comprehensive Income Statement (Showing Net Cost of Services)
Actual Revised Forward Forward Forward
budget estimate estimate estimate
2013–14 2014–15 2015–16 2016–17 2017–18
$'000 $'000 $'000 $'000 $'000
EXPENSES
Employee benefits 171,548 221,467 213,023 212,911 213,403
Suppliers 91,679 95,104 75,637 72,884 75,403
Grants 1,925 - - - -
Depreciation and amortisation 43,362 30,349 33,629 31,933 30,583
Finance costs 35 - - - -
Write-down and impairment of assets 19,046 - - - -
Losses from asset sales 1,576 - - - -
Total expenses 329,171 346,920 322,289 317,728 319,389
LESS:
OWN-SOURCE INCOME
Own-source revenue
Sale of goods and rendering of services 13,813 20,182 17,713 17,714 17,715
Other revenue 465 400 400 400 400
Total own-source revenue 14,278 20,582 18,113 18,114 18,115
Gains
Sale of assets 436 - - - -
Other gains 821 - - - -
Total gains 1,257 - - - -
Total own-source income 15,535 20,582 18,113 18,114 18,115
Net cost of (contribution by)
services 313,636 326,338 304,176 299,614 301,274
Revenue from Government 288,195 295,989 270,547 267,681 270,691
Surplus (Deficit) before income tax (25,441) (30,349) (33,629) (31,933) (30,583)
Income tax expense
Surplus (Deficit) after income tax (25,441) (30,349) (33,629) (31,933) (30,583)
OTHER COMPREHENSIVE INCOME
Items not subject to subsequent
reclassification to profit or loss
Changes in asset revaluation surplus 3,376 - - - -
Total other comprehensive income after
income tax 3,376 - - - -
Total comprehensive income (loss) (22,065) (30,349) (33,629) (31,933) (30,583)

Additional Estimates Statements—Department of Employment
39
Table 3.2.1: Budgeted Departmental Comprehensive Income Statement (Showing Net Cost of Services) (continued)
Note: Impact of Net Cash Apppropriation Arrangements
2013-14 2014-15 2015-16 2016-17 2017-18
$'000 $'000 $'000 $'000 $'000
Total Comprehensive Income
(loss) excluding depreciation/
amortisation expenses
previously funded through
revenue appropriations - - - - -
less depreciation/amortisation expenses
previously funded through revenue
appropriations1 22,065 30,349 33,629 31,933 30,583
Total Comprehensive Income
(loss) - as per the Statement of
Comprehensive Income (22,065) (30,349) (33,629) (31,933) (30,583)
1 From 2010–11, the government introduced net cash appropriation arrangements where Appropriation
Act No. 1 or Bill No. 3 revenue appropriations for the depreciation/amortisation expenses of Non-Corporate Commonwealth Entities were replaced with a separate capital budget (the Departmental Capital Budget, or DCB) provided through Appropriation Act No. 1 or Bill No. 3 equity appropriations. For information regarding DCBs, please refer to Table 3.2.5 Departmental Capital Budget Statement.
Prepared on Australian Accounting Standards basis.
Additional Estimates Statements—Department of Employment
40
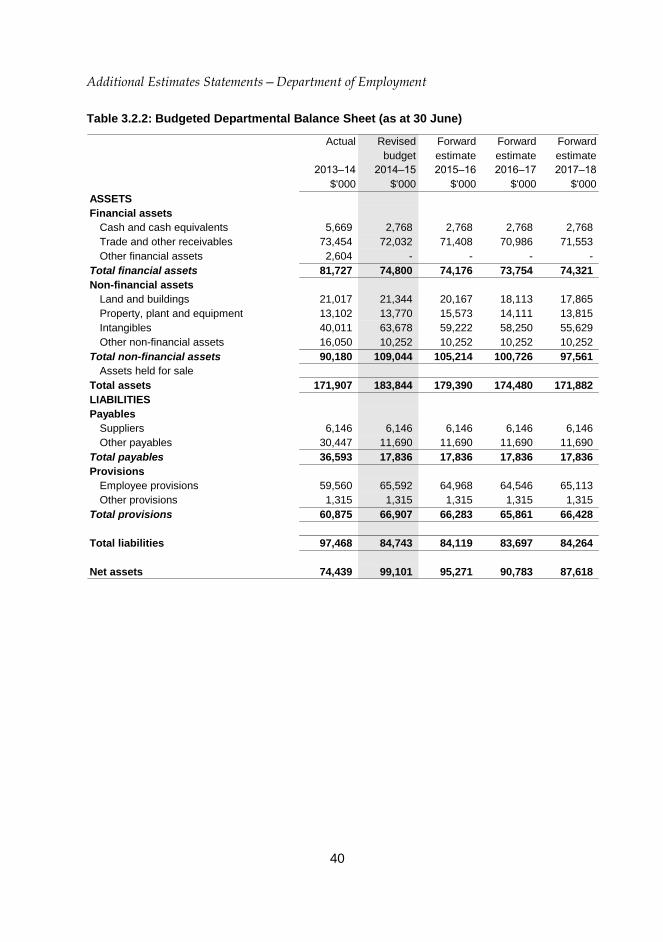
Table 3.2.2: Budgeted Departmental Balance Sheet (as at 30 June)
Actual Revised Forward Forward Forward
budget estimate estimate estimate
2013–14 2014–15 2015–16 2016–17 2017–18
$'000 $'000 $'000 $'000 $'000
ASSETS
Financial assets
Cash and cash equivalents 5,669 2,768 2,768 2,768 2,768
Trade and other receivables 73,454 72,032 71,408 70,986 71,553
Other financial assets 2,604 - - - -
Total financial assets 81,727 74,800 74,176 73,754 74,321
Non-financial assets
Land and buildings 21,017 21,344 20,167 18,113 17,865
Property, plant and equipment 13,102 13,770 15,573 14,111 13,815
Intangibles 40,011 63,678 59,222 58,250 55,629
Other non-financial assets 16,050 10,252 10,252 10,252 10,252
Total non-financial assets 90,180 109,044 105,214 100,726 97,561
Assets held for sale
Total assets 171,907 183,844 179,390 174,480 171,882
LIABILITIES
Payables
Suppliers 6,146 6,146 6,146 6,146 6,146
Other payables 30,447 11,690 11,690 11,690 11,690
Total payables 36,593 17,836 17,836 17,836 17,836
Provisions
Employee provisions 59,560 65,592 64,968 64,546 65,113
Other provisions 1,315 1,315 1,315 1,315 1,315
Total provisions 60,875 66,907 66,283 65,861 66,428
Total liabilities 97,468 84,743 84,119 83,697 84,264
Net assets 74,439 99,101 95,271 90,783 87,618
Additional Estimates Statements—Department of Employment
41
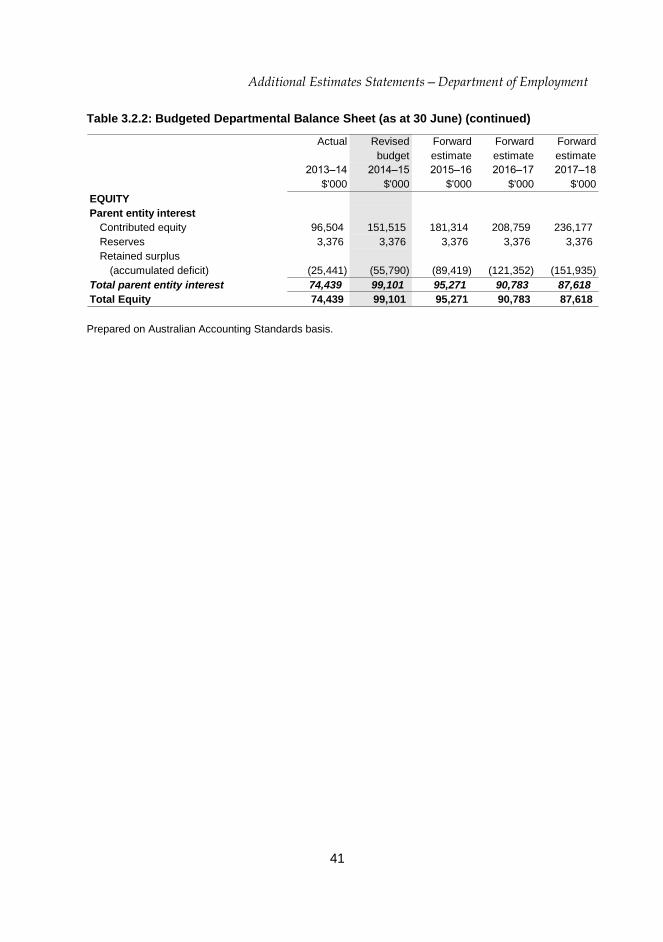
Table 3.2.2: Budgeted Departmental Balance Sheet (as at 30 June) (continued)
Actual Revised Forward Forward Forward
budget estimate estimate estimate
2013–14 2014–15 2015–16 2016–17 2017–18
$'000 $'000 $'000 $'000 $'000
EQUITY
Parent entity interest
Contributed equity 96,504 151,515 181,314 208,759 236,177
Reserves 3,376 3,376 3,376 3,376 3,376
Retained surplus
(accumulated deficit) (25,441) (55,790) (89,419) (121,352) (151,935)
Total parent entity interest 74,439 99,101 95,271 90,783 87,618
Total Equity 74,439 99,101 95,271 90,783 87,618
Prepared on Australian Accounting Standards basis.

Additional Estimates Statements—Department of Employment
42
Table 3.2.3: Departmental Statement of Changes in Equity—Summary of Movement (Budget Year 2014–15)
Retained Asset Contributed Total
earnings revaluation equity/ equity
reserve capital
$'000 $'000 $'000 $'000
Opening balance as at 1 July 2014
Balance carried forward from
previous period (25,441) 3,376 96,504 74,439
Adjustment for changes in
accounting policies - - - -
Adjusted opening balance (25,441) 3,376 96,504 74,439
Comprehensive income
Other comprehensive income - - - -
Surplus (deficit) for the period (30,349) - - (30,349)
Total comprehensive income (30,349) - - (30,349)
of which:
Attributable to the Australian Government - - - -
Attributable to non-controlling interest - - - -
Transactions with owners
Contributions by owners
Equity Injection - Appropriation - - 23,987 23,987
Departmental Capital Budget (DCBs) - - 31,024 31,024
Restructuring - - - -
Sub-total transactions with owners - - 55,011 55,011
Transfers between equity
components - - - -
Estimated closing balance
as at 30 June 2015 (55,790) 3,376 151,515 99,101
Less: non-controlling interests - - - -
Closing balance (55,790) 3,376 151,515 99,101
Prepared on Australian Accounting Standards basis.
Additional Estimates Statements—Department of Employment
43
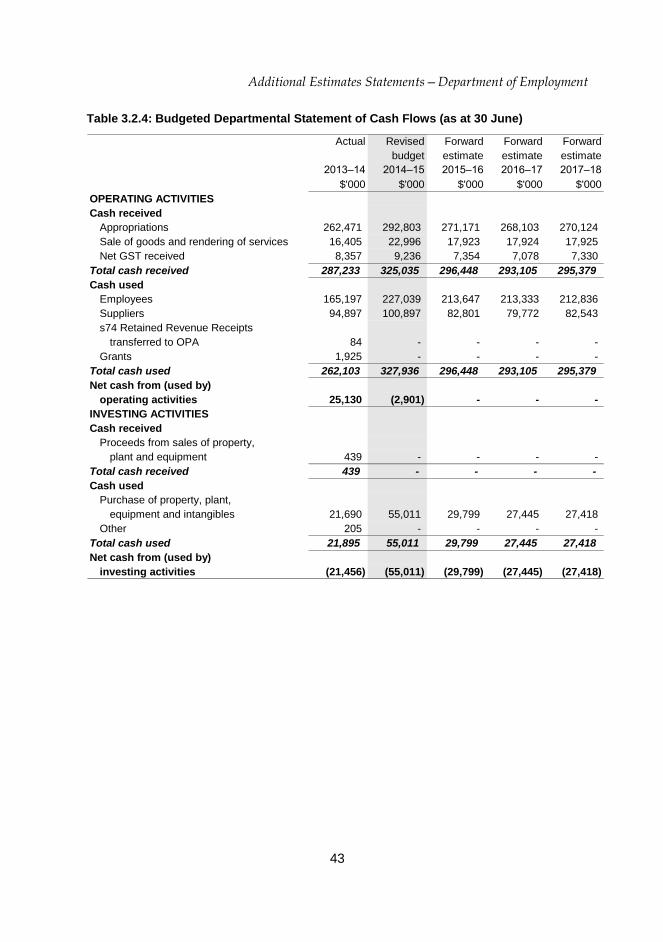
Table 3.2.4: Budgeted Departmental Statement of Cash Flows (as at 30 June)
Actual Revised Forward Forward Forward
budget estimate estimate estimate
2013–14 2014–15 2015–16 2016–17 2017–18
$'000 $'000 $'000 $'000 $'000
OPERATING ACTIVITIES
Cash received
Appropriations 262,471 292,803 271,171 268,103 270,124
Sale of goods and rendering of services 16,405 22,996 17,923 17,924 17,925
Net GST received 8,357 9,236 7,354 7,078 7,330
Total cash received 287,233 325,035 296,448 293,105 295,379
Cash used
Employees 165,197 227,039 213,647 213,333 212,836
Suppliers 94,897 100,897 82,801 79,772 82,543
s74 Retained Revenue Receipts
transferred to OPA 84 - - - -
Grants 1,925 - - - -
Total cash used 262,103 327,936 296,448 293,105 295,379
Net cash from (used by)
operating activities 25,130 (2,901) - - -
INVESTING ACTIVITIES
Cash received
Proceeds from sales of property,
plant and equipment 439 - - - -
Total cash received 439 - - - -
Cash used
Purchase of property, plant,
equipment and intangibles 21,690 55,011 29,799 27,445 27,418
Other 205 - - - -
Total cash used 21,895 55,011 29,799 27,445 27,418
Net cash from (used by)
investing activities (21,456) (55,011) (29,799) (27,445) (27,418)

Additional Estimates Statements—Department of Employment
44
Table 3.2.4: Budgeted Departmental Statement of Cash Flows (as at 30 June) (continued)
Actual Revised Forward Forward Forward
budget estimate estimate estimate
2013–14 2014–15 2015–16 2016–17 2017–18
$'000 $'000 $'000 $'000 $'000
FINANCING ACTIVITIES
Cash received
Contributed equity 1,995 55,011 29,799 27,445 27,418
Total cash received 1,995 55,011 29,799 27,445 27,418
Cash used
Other - - - - -
Total cash used - - - - -
Net cash used by
financing activities 1,995 55,011 29,799 27,445 27,418
Net increase (decrease)
in cash held 5,669 (2,901) - - -
Cash and cash equivalents at the
beginning of the reporting period - 5,669 2,768 2,768 2,768
Effect of exchange rate movements
on cash and cash equivalents at
the beginning of reporting period - - - - -
Cash and cash equivalents at the
end of the reporting period 5,669 2,768 2,768 2,768 2,768
Prepared on Australian Accounting Standards basis.

Additional Estimates Statements—Department of Employment
45
Table 3.2.5: Capital Budget Statement— Departmental
Actual Revised Forward Forward Forward
budget estimate estimate estimate
2013–14 2014–15 2015–16 2016–17 2017–18
$'000 $'000 $'000 $'000 $'000
NEW CAPITAL APPROPRIATIONS
Capital budget - Act No. 1 (DCB) 21,265 31,024 26,905 27,445 27,418
Equity injections - Act No. 2 2,127 23,987 2,894 - -
Total new capital appropriations 23,392 55,011 29,799 27,445 27,418
Provided for:
Purchase of non-financial assets 21,895 55,011 29,799 27,445 27,418
Total Items 21,895 55,011 29,799 27,445 27,418
PURCHASE OF NON-FINANCIAL
ASSETS
Funded by capital appropriations1
- 23,987 2,894 - -
Funded by capital appropriation - DCB2
21,895 31,024 26,905 27,445 27,418
TOTAL AMOUNT SPENT 21,895 55,011 29,799 27,445 27,418
RECONCILIATION OF CASH
USED TO ACQUIRE ASSETS
TO ASSET MOVEMENT TABLE
Total purchases 21,895 55,011 29,799 27,445 27,418
Total cash used to
acquire assets 21,895 55,011 29,799 27,445 27,418 1 Includes both current and prior Act 2 and Bills 4/6 appropriations and special capital appropriations
2 Does not include annual finance lease costs. Include purchase from current and previous years'
Departmental Capital Budgets (DCBs).

Additional Estimates Statements—Department of Employment
46
Ag
ency
Ad
dition
al Estim
ates Statem
ent —
Ag
ency
nam
e
Table 3.2.6: Statement of Asset Movements (2014–15)
Buildings Other property, Computer Total
plant and software and
equipment intangibles
$'000 $'000 $'000 $'000
As at 1 July 2014
Gross book value 21,599 21,582 86,896 130,077
Accumulated depreciation/amortisation
and impairment (582) (8,480) (46,885) (55,947)
Opening net book balance 21,017 13,102 40,011 74,130
CAPITAL ASSET ADDITIONS
Estimated expenditure on
new or replacement assets
By purchase - appropriation equity1
7,802 5,410 41,799 55,011Total additions 7,802 5,410 41,799 55,011
Other movements
Assets held for sale or in a disposal
group held for sale - - - -
Depreciation/amortisation expense (7,475) (4,742) (18,132) (30,349)
Total other movements (7,475) (4,742) (18,132) (30,349)
As at 30 June 2015
Gross book value 29,401 26,992 128,695 185,088
Accumulated depreciation/amortisation
and impairment (8,057) (13,222) (65,017) (86,296)
Closing net book balance 21,344 13,770 63,678 98,792
1 "Appropriation equity" refers to equity injections or Administered Assets and Liabilities appropriations
provided through Appropriation Acts No. 2 and Bill No. 4 2014-15, including CDABs. Prepared on Australian Accounting Standards basis.

Additional Estimates Statements—Department of Employment
47
Schedule of Administered Activity
Table 3.2.7: Schedule of Budgeted Income and Expenses Administered on Behalf of Government (for the period ended 30 June)
Actual Revised Forward Forward Forward
budget estimate estimate estimate
2013–14 2014–15 2015–16 2016–17 2017–18
$'000 $'000 $'000 $'000 $'000
EXPENSES ADMINISTERED ON
BEHALF OF GOVERNMENT
Suppliers 1,333,586 1,543,127 1,553,287 1,781,100 1,756,444
Subsidies 161,784 174,618 174,618 174,618 174,618
Personal benefits 212,836 214,135 192,005 192,501 188,769
Grants 37,279 63,655 74,088 69,231 69,745
Write-down and impairment of assets 203 - - - -
Payments to Corporate Entities 1,433 7,563 7,473 6,002 6,055
Total expenses administered
on behalf of Government 1,747,121 2,003,098 2,001,471 2,223,452 2,195,631
LESS:
OWN-SOURCE INCOME
Own-source revenue
Taxation revenue
Other taxes 133,578 174,618 174,618 174,618 174,618
Total taxation revenue 133,578 174,618 174,618 174,618 174,618
Non-taxation revenue
Other revenue 20,753 18,725 18,725 18,725 18,725
Total non-taxation revenue 20,753 18,725 18,725 18,725 18,725
Total own-source revenues
administered on behalf of
Government 154,331 193,343 193,343 193,343 193,343
Gains
Reversal of previous asset
write-downs and impairments 155 - - - -
Total gains administered
on behalf of Government 155 - - - -
Total own-sourced income
administered on behalf of
Government 154,486 193,343 193,343 193,343 193,343
Net Cost of (contribution by)
services 1,592,635 1,809,755 1,808,128 2,030,109 2,002,288
Surplus (Deficit) (1,592,635) (1,809,755) (1,808,128) (2,030,109) (2,002,288)
OTHER COMPREHENSIVE INCOME
Changes in asset revaluation surplus 28,752 - - - -
Total other comprehensive income 28,752 - - - -
Total comprehensive income (loss) (1,563,883) (1,809,755) (1,808,128) (2,030,109) (2,002,288) Prepared on Australian Accounting Standards basis.

Additional Estimates Statements—Department of Employment
48
Table 3.2.8: Schedule of Budgeted Assets and Liabilities Administered on Behalf of Government (as at 30 June)
Actual Revised Forward Forward Forward
budget estimate estimate estimate
2013–14 2014–15 2015–16 2016–17 2017–18
$'000 $'000 $'000 $'000 $'000
ASSETS ADMINISTERED ON
BEHALF OF GOVERNMENT
Financial assets
Taxation receivables 13,207 13,207 13,207 13,207 13,207
Trade and other receivables 10,133 10,129 10,129 10,129 10,129
Investments accounted for
using the equity method 145,477 145,477 145,477 145,477 145,477
Total financial assets 168,817 168,813 168,813 168,813 168,813
Non-financial assets
Other non-financial assets 4,968 4,980 4,732 4,759 4,824
Total non-financial assets 4,968 4,980 4,732 4,759 4,824
Assets held for sale - - - - -
Total assets administered
on behalf of Government 173,785 173,793 173,545 173,572 173,637
LIABILITIES ADMINISTERED ON
BEHALF OF GOVERNMENT
Payables
Suppliers 21,641 21,642 21,642 21,642 21,642
Subsidies 14,810 14,810 14,810 14,810 14,810
Personal benefits 9,441 9,441 9,441 9,441 9,441
Grants 459 459 459 459 459
Other payables 2,784,003 2,791,124 2,789,221 2,792,620 2,796,735
Total payables 2,830,354 2,837,476 2,835,573 2,838,972 2,843,087

Additional Estimates Statements—Department of Employment
49
Table 3.2.8: Schedule of Budgeted Assets and Liabilities Administered on Behalf of Government (as at 30 June) (continued)
Actual Revised Forward Forward Forward
budget estimate estimate estimate
2013–14 2014–15 2015–16 2016–17 2017–18
$'000 $'000 $'000 $'000 $'000
Provisions
Employee provisions - - - - -
Total provisions - - - - -
Liabilities included in disposal
groups held for sale - - - - -
Total liabilities administered
on behalf of Government 2,830,354 2,837,476 2,835,573 2,838,972 2,843,087
Net assets/(liabilities) (2,656,569) (2,663,683) (2,662,028) (2,665,400) (2,669,450) Prepared on Australian Accounting Standards basis.
Additional Estimates Statements—Department of Employment
50
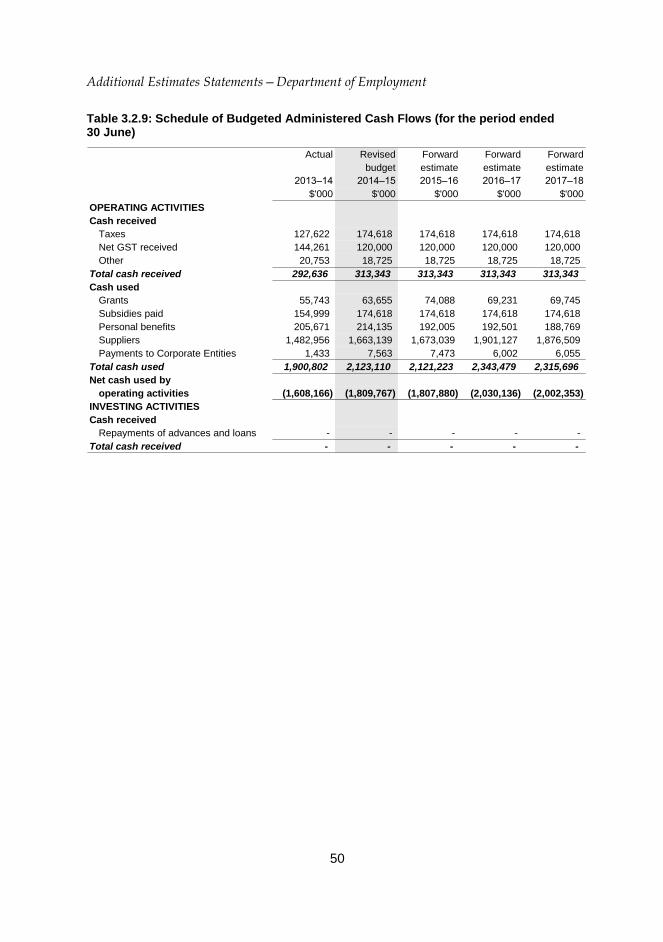
Table 3.2.9: Schedule of Budgeted Administered Cash Flows (for the period ended 30 June)
Actual Revised Forward Forward Forward
budget estimate estimate estimate
2013–14 2014–15 2015–16 2016–17 2017–18
$'000 $'000 $'000 $'000 $'000
OPERATING ACTIVITIES
Cash received
Taxes 127,622 174,618 174,618 174,618 174,618
Net GST received 144,261 120,000 120,000 120,000 120,000
Other 20,753 18,725 18,725 18,725 18,725
Total cash received 292,636 313,343 313,343 313,343 313,343
Cash used
Grants 55,743 63,655 74,088 69,231 69,745
Subsidies paid 154,999 174,618 174,618 174,618 174,618
Personal benefits 205,671 214,135 192,005 192,501 188,769
Suppliers 1,482,956 1,663,139 1,673,039 1,901,127 1,876,509
Payments to Corporate Entities 1,433 7,563 7,473 6,002 6,055
Total cash used 1,900,802 2,123,110 2,121,223 2,343,479 2,315,696
Net cash used by
operating activities (1,608,166) (1,809,767) (1,807,880) (2,030,136) (2,002,353)
INVESTING ACTIVITIES
Cash received
Repayments of advances and loans - - - - -
Total cash received - - - - -
Additional Estimates Statements—Department of Employment
51
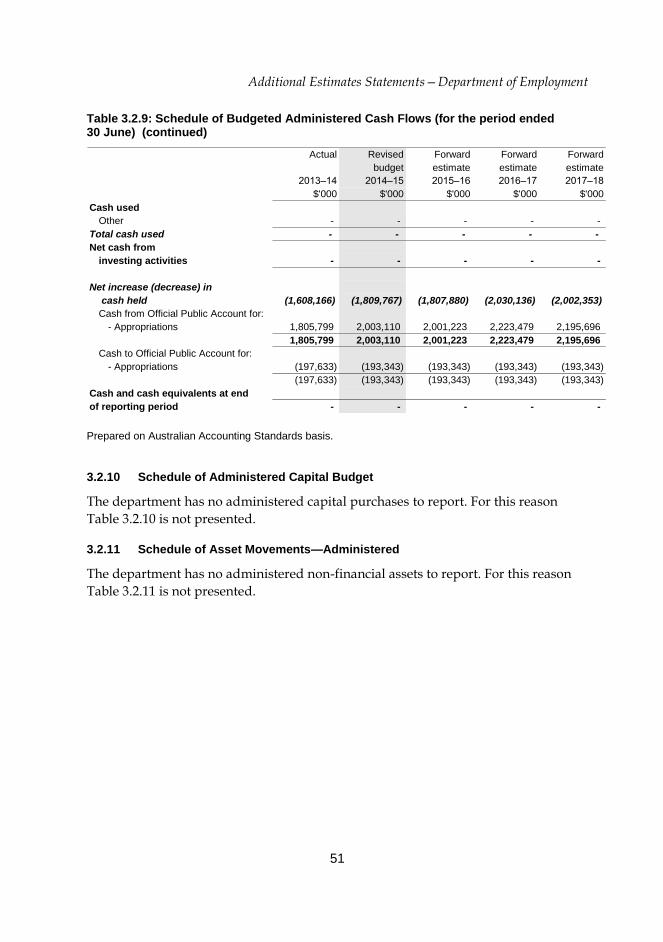
Table 3.2.9: Schedule of Budgeted Administered Cash Flows (for the period ended 30 June) (continued)
Actual Revised Forward Forward Forward
budget estimate estimate estimate
2013–14 2014–15 2015–16 2016–17 2017–18
$'000 $'000 $'000 $'000 $'000
Cash used
Other - - - - -
Total cash used - - - - -
Net cash from
investing activities - - - - -
Net increase (decrease) in
cash held (1,608,166) (1,809,767) (1,807,880) (2,030,136) (2,002,353)
Cash from Official Public Account for:
- Appropriations 1,805,799 2,003,110 2,001,223 2,223,479 2,195,696
1,805,799 2,003,110 2,001,223 2,223,479 2,195,696
Cash to Official Public Account for:
- Appropriations (197,633) (193,343) (193,343) (193,343) (193,343)
(197,633) (193,343) (193,343) (193,343) (193,343)
Cash and cash equivalents at end
of reporting period - - - - -
Prepared on Australian Accounting Standards basis.
3.2.10 Schedule of Administered Capital Budget
The department has no administered capital purchases to report. For this reason
Table 3.2.10 is not presented.
3.2.11 Schedule of Asset Movements—Administered
The department has no administered non-financial assets to report. For this reason
Table 3.2.11 is not presented.