Embed Size (px)
Citation preview
Port Waterways Water Quality Improvement Plan
Port Waterways Water Quality Improvement Plan
Port Waterways Water Quality Improvement Plan Author: Peter Pfennig
Acknowledgements:
Eco Management Services: Paul Manning EPA: Peter Christy, Sam Gaylard, Dr Clive Jenkins, Dr Shaun Thomas, Bettina Venner Flinders Ports: Greg Pearce, Terry Vickery Water Data Services: Bruce Nicholson SA Water: Tim Kildae Department of Water, Land and Biodiversity: Tim Bradford Department of Transport, Energy and Infrastructure: Roger Galbraith
Some of the materials in this report is drawn from a project by Arup Pty Ltd and Eco Management Services Pty Ltd.
Funding and resources for this project were provided by the Australian Government Coastal Catchment Initiative.
For further information please contact:
Information Officer Environment Protection Authority GPO Box 2607 Adelaide SA 5001
Telephone: (08) 8204 2004
Facsimile: (08) 8124 4670
Free call (country): 1800 623 445
Website: <www.epa.sa.gov.au>
E-mail: <[email protected]>
ISBN 978-1-921125-66-9
May 2008
Disclaimer The views and opinions expressed in this publication are those of the authors and do not necessarily reflect those of the Australian Government or the Minister for the Environment, Water, Heritage and the Arts.
While all reasonable efforts have been made to ensure that the contents of this publication are factually correct, the Commonwealth does not accept responsibility for the accuracy or completeness of the contents, and shall not be liable for any loss or damage that may be occasioned directly or indirectly through the use of, or reliance on, the contents of this publication.
© Environment Protection Authority This document may be reproduced in whole or part for the purpose of study or training, subject to the inclusion of an acknowledgment of the source and to its not being used for commercial purposes or sale. Reproduction for purposes other than those given above requires the prior written permission of the Environment Protection Authority.
Printed on recycled paper
TABLE OF CONTENTS
Summary 1
1 Introduction 9
1.1 The Port waterways and its catchment 9
1.2 Nutrients and the ecological condition of the Port waterways 9
1.3 The Water Quality Improvement Plan 9
1.4 Environmental values of the Port waterways 13
1.5 Nutrient reduction to date 13
1.6 Environmental flow management in the Port waterways 14 1.7 Consultation processes used in developing the plan 14
1.8 Ongoing involvement with the Adelaide and Mount Lofty Ranges NaturalResources Management Board 15
1.9 Ongoing involvement with the Adelaide Dolphin Sanctuary 15
2 Water quality—nutrient objectives and loads 17
2.1 Summary of key water quality issues 17
2.2 Environmental values of the Port waterways 21
2.3 General water quality status prior to the WQIP 25
2.4 Water quality objectives (nutrients) 25
2.5 Existing programs resulting in nitrogen and phosphorus load reduction improvements to date 29
2.6 Nutrient load reduction required to achieve the water quality objectives 31
2.7 Load reduction targets/load allocations 38
2.8 Margin of safety 39
3 Implementation and research—management measures and control actions 41
3.1 Current nutrient load reduction programs and actions 41
3.2 River flow objectives 59
3.3 Growth management and addressing impacts of climate change 59
3.4 Use of market-based instruments 61
3.5 Institutional and organisational reforms 61 3.6 Regulatory reforms to support improved water quality and environmental flows 62
3.7 Priority WQIP research and development activities 62
3.8 Adaptive management for the Port Waterways WQIP 63
4 Monitoring the WQIP implementation 69
4.1 Introduction 69
4.2 Water quality modelling strategy 69
4.3 Water quality monitoring programs 70
4.4 Monitoring implementation of the WQIP 70
5 Reporting and review 72
5.1 Introduction 72
5.2 WQIP reporting and review process 72
References 75
Glossary 76
Appendix A: Statutory capacity to implement the Port Waterways Water Quality Improvement Plan 80
Appendix B: Programs and funding for the implementation of the
Port Waterways Water Quality Improvement Plan 89
Appendix C: Reasonable assurance statement for the Port Waterways Water Quality Improvement Plan 96
Appendix D: WQIP for Port Adelaide’s waterway 102
Appendix E: Water flows 112
Appendix F: Model output of nutrient load reductions for the Port waterways 126
Appendix G: Nutrient Reduction Options Discussion Paper, November 2005 187
iv
LIST OF FIGURES
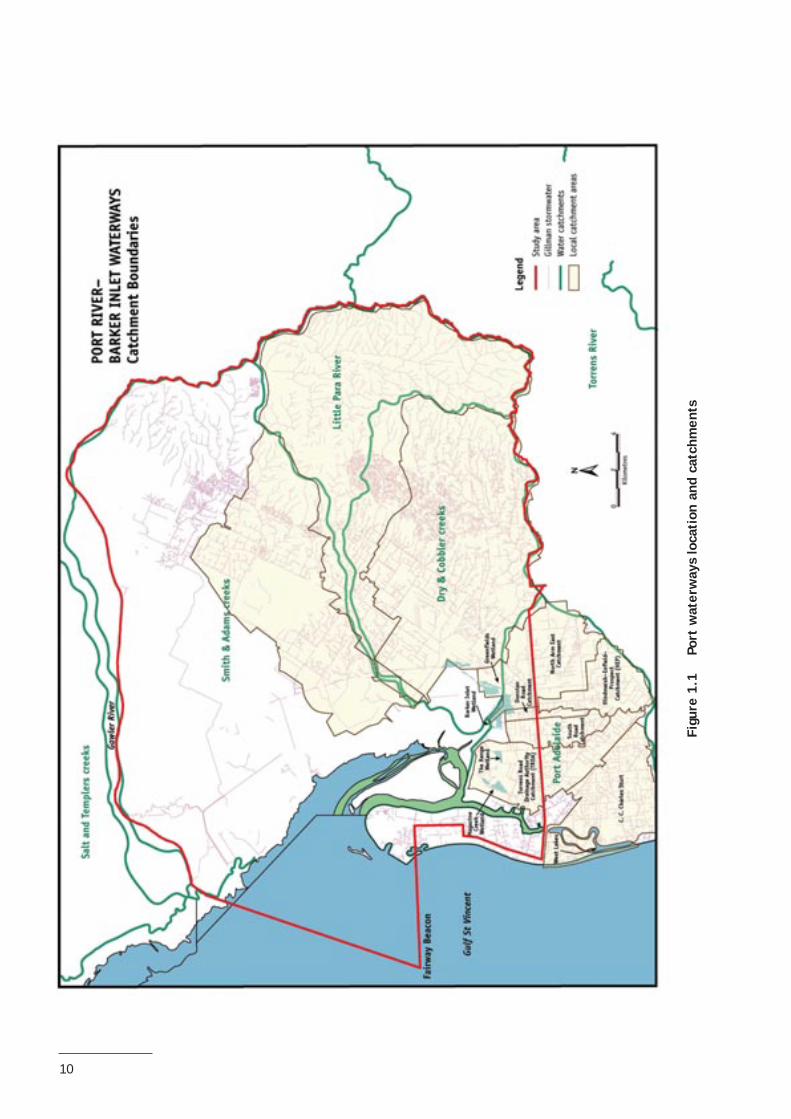
Figure 1.1 Port waterways location and catchments 10
Figure 1.2 Summary of the water quality management framework 11
Figure 2.1 Key water quality issues in the Port waterways study area 18
Figure 2.2 Main features and segments for protection of water quality 22
Figure 2.3 Water quality classification 24
Figure 2.4 Combined summer (Nov to Mar) Nutrient Loads from Port Adelaide & Bolivar WWTPs 30
Figure 2.5 Bolivar peak monthly nutrient marine loads 30
Figure 2.6 Modelled Port waterways chlorophyll a concentrations 1998 and 2004 34
Figure 2.7 Modelled Port waterways total nitrogen concentrations 1998 and 2004 35
Figure 2.8 Modelled Port waterways ammonia concentrations 1998 and 2004 36
Figure 2.9 Modelled winter chlorophyll a concentrations adjacent to Swan Alley as nutrients in the Port Waterways reduce 37
Figure 2.10 Modelled winter chlorophyll a concentrations at the North Arm as nutrients in the Port Waterways reduce 37
Figure 3.1 Comparison of annual TN and TP loads 1995–2015 57
Figure 3.2 Comparison of annual TN loads from major sources 1995–2015 57
Figure 3.3 Comparison of annual TN loads from small sources 1995–2010 58
Figure 3.4 Comparison of annual TP loads from major sources 1995–2015 58
Figure 3.5 Comparison of annual TP loads from small sources 2005–2010 59
Figure 3.6 Adaptive management framework as it applies to nutrients in the Port waterways 65
Figure 4.1 EPA ambient water quality monitoring program locations in the Port waterways 71
Figure E1 Watercress model layout 118
Figure E2 Present day non-urbanised flows (ML/year) 120
Figure E3 Pre-European flows (ML/year) 121
Figure E4 Estimated pre-European annual flows to Barker Inlet 124
Figure E5 % time exceedence for estimated pre-European daily flows to Barker Inlet 125
Figure F1 Differences in modelled total phosphorus at three sites along the Port River following reductions in nutrient discharges between 1998 and 2004 131
Figure F2 Differences in modelled total ammonium at three sites along the Port River following reductions in nutrient discharges between 1998 and 2004 132
Figure F3 Differences in modelled total nitrogen at three sites in central Barker inlet following reductions in nutrient discharges between 1998 and 2004 133
Figure F4 Differences in modelled total ammonium at three sites in central Barker inlet following reductions in nutrient discharges between 1998 and 2004 134
Figure F5 Differences in modelled total phosphorus at three sites in central Barker inlet following reductions in nutrient discharges between 1998 and 2004 135
Figure F6 Differences in modelled total phosphorus at three sites in the region of northern Barker inlet following reductions in nutrient discharges between 1998 and 2004 136
Figure F7 Differences in modelled total nitrogen at three sites in the region of northern Barker inlet following reductions in nutrient discharges between 1998 and 2004 137
v
Figure F8 Differences in modelled total ammonium at three sites in the region of northern Barker inlet following reductions in nutrient discharges between 1998 and 2004 138
Figure F9 Distribution of total phosphorus in the Port waterways during a spring high tide— normal 2004 discharges of nutrients from the Penrice facility and the Bolivar WWTP 139
Figure F10 Distribution of total phosphorus in the Port waterways during a spring low tide— normal 2004 discharges of nutrients from the Penrice facility and the Bolivar WWTP 140
Figure F11 Distribution of total phosphorus in the Port waterways during a neap ebbing tide— normal 2004 discharges of nutrients from the Penrice facility and the Bolivar WWTP 141
Figure F12 Distribution of total phosphorus in the Port waterways influenced by a north wind— normal 2004 discharges of nutrients from the Penrice facility and the Bolivar WWTP 142
Figure F13 Distribution of total nitrogen in the Port waterways during a neap ebbing tide—based on 1998 discharges of nutrients from the Penrice facility, and the Bolivar and Port Adelaide WWTPs 143
Figure F14 Distribution of total nitrogen in the Port waterways during a neap ebbing tide—normal 2004 discharges of nutrients from the Penrice facility and the Bolivar WWTP 144
Figure F15 Distribution of total ammonium in the Port waterways during a neap ebbing tide— based on 1998 discharges of nutrients from the Penrice facility, and the Bolivar and Port Adelaide WWTPs 145
Figure F16 Distribution of total ammonium in the Port waterways during a neap ebbing tide— normal 2004 discharges of nutrients from the Penrice facility and the Bolivar WWTP 146
Figure F17 Distribution of total phosphorus in the Port waterways during a neap ebbing tide— based on 1998 discharges of nutrients from the Penrice facility, and the Bolivar and Port Adelaide WWTPs 147
Figure F18 Distribution of chlorophyll a in the Port waterways during a neap ebbing tide—based on 1998 discharges of nutrients from the Penrice facility, and the Bolivar and Port Adelaide WWTPs 148
Figure F19 Distribution of chlorophyll a in the Port waterways during a neap ebbing tide—normal 2004 discharges of nutrients from the Penrice facility and the Bolivar WWTP 149
Figure F20 Response of total ammonia levels in the Port River at Birkenhead to progressive reductions in ammonia loads from the Penrice facility 150
Figure F21 Response of total ammonia levels in the Port River at Snowden Beach to progressive reductions in ammonia loads from the Penrice facility 150
Figure F22 Response of total ammonia levels in the Port River at Outer Harbour to progressive reductions in ammonia loads from the Penrice facility 151
Figure F23 Response of total ammonia levels in the Port River at the North Arm bridge to progressive reductions in ammonia loads from the Penrice facility 151
Figure F24 Response of total ammonia levels in Barker Inlet at Swan Alley creek to progressive reductions in ammonia loads from the Penrice facility 152
Figure F25 Distribution of total ammonium in the Port waterways during a neap ebbing tide— normal 2004 discharges of nutrients from the Bolivar WWTP and nitrogen discharges from the Penrice facility reduced to 200 tonnes per annum 153
Figure F26 Distribution of chlorophyll a in the Port waterways during a neap ebbing tide—normal 2004 discharges of nutrients from the Bolivar WWTP and nitrogen discharges from the Penrice facility reduced to 200 tonnes per annum 154
Figure F27 Distribution of total nitrogen in the Port waterways during a neap ebbing tide—normal 2004 discharges of nutrients from the Bolivar WWTP and nitrogen discharges from the Penrice facility reduced to 200 tonnes per annum 155
vi
Figure F28 Distribution of total phosphorus in the Port waterways during a neap ebbing tide— normal 2004 discharges of nutrients from the Bolivar WWTP and nitrogen discharges from the Penrice facility reduced to 200 tonnes per annum 156
Figure F29 Annual pattern of nutrient load discharge from Bolivar low–salinity WWTP 157
Figure F30 Response of chlorophyll a levels in Barker Inlet at Swan Alley creek to progressive reductions in nutrient loads from the Bolivar WWTP 158
Figure F31 Response of chlorophyll a levels in Barker Inlet at Swan Alley creek to progressive reductions in nutrient loads from the Bolivar WWTP 158
Figure F32 Response of chlorophyll a levels in the Port River at Birkenhead to progressive reductions in nutrient loads from the Bolivar WWTP 159
Figure F33 Response of chlorophyll a levels in the Port River at Outer Harbour to progressive reductions in nutrient loads from the Bolivar WWTP 159
Figure F34 Distribution of chlorophyll a in the Port waterways during a neap ebbing tide— discharges of nutrients from the Bolivar WWTP reduced from normal 2004 levels to— 100% of high salinity plant and only 25% of low salinity plant effluent—and nitrogen discharges from the Penrice facility reduced to 200 tonnes per annum 160
Figure F35 Distribution of chlorophyll a in the Port waterways during a neap ebbing tide—no discharges of nutrients from the Bolivar WWTP and nitrogen discharges from the Penrice facility reduced to 200 tonnes per annum 161
vii
LIST OF TABLES
Table S1 Implementation schedule for WQIP 7
Table 1.1 Port waterways CCI Steering Committee member list 15
Table 2.1 Environmental values, water quality issues and water quality objectives (nutrients) 19
Table 2.2 Default trigger values for nutrients and chlorophyll α 26
Table 2.3 EPA monitoring sites 1–9 Port River–Barker Inlet, general nutrient levels 27
Table 2.4 Main sources of nutrients to the Port waterways 28
Table 2.5 Load allocations 40
Table 3.1 Summary of pollutant management actions 66
Table 5.1 Reviewing and reporting schedule 74
Table B3 Ammonia Reduction Environmental Improvement Strategic Plan, 2006-10 93
Table D1 Statistical summary of weekly nutrient loads determined by flow proportional composite sampling at Barker Wetland 1 (A5041009) for the period 1 May 2004 to 4 August 2005 103
Table D2 Statistical summary of weekly nutrient loads determined by flow proportional composite sampling at Barker Wetland 2 (A5041017) for the period 8 October 2004 to 4 August 2005 104
Table D3 Statistical summary of weekly nutrient loads determined by flow proportional composite sampling at the West Lakes outlet (A5041008) for the period 12 May 2004 to 7 July 2005 105
Table D4 Statistical summary of weekly nutrient loads determined by flow proportional composite sampling at Dry Creek (A5041005) for the period 20 August 2004 to 11 August 2005 106
Table D5 Statistical summary of weekly nutrient loads determined by flow proportional composite sampling at Little Para River (A5041006) for the period 2 October 2004 to 5 August 2005 107
Table D6 Statistical summary of weekly nutrient loads determined by flow proportional composite sampling at Helps Road drain (A5041007) for the period 18 March to 4 August 2005 108
Table D7 Calculation of annual flows and nutrient loads into the Port River and Barker Inlet system from the surrounding catchment areas 109
Table D8 Calculation of catchment yields from three key catchments in the WQMP 110
Table E1 ‘Best fit’ mean runoff depth (mm/year) for three annual rainfall readings 115
Table E2 Estimation of present day flows in previous studies 116
Table E3 Assumed values of I, N, L, B in loss node calculations 119
Table E4 Rain gauges 120
Table E5 Comparison of flows to the Barker Inlet 121
Table F1 Summary data and water quality classification BOL1 162
Table F2 Summary data and water quality classification BOL2 163
Table F3 Summary data and water quality classification BOL3 164
viii
Table F5 Summary data and water quality classification BKR2 166
Table F6 Summary data and water quality classification BKR4 167
Table F7 Summary data and water quality classification NAR2 168
Table F8 Summary data and water quality classification PTR3 169
Table F9 Summary data and water quality classification PTR5 170
Table F10 Summary data and water quality classification PTR9 171
Table DW1 Nutrient sources, October 2005 177
Table DW2 Modelling issues/questions and workshop response 178
Table DW3 ANZECC 2000 default water quality guidelines 182
Table DW4 Integration of ACWS and WQIP 183
Table DW5 Priorities for future work 183
ix

SUMMARY
Background
The Port waterways consist of the Port River, North Arm, North Arm Creek, Angas Inlet and Barker Inlet (Figure 1.1). The waterways are areas of major ecological, commercial and recreational importance.
Development and subsequent pollution throughout the history of South Australia (SA) has resulted in a decline in the ecosystem health of the waterways. This is apparent to the community through the large-scale loss of intertidal and subtidal seagrasses and the occurrence of algal blooms including toxic species. Studies into the environmental status of the waterways consistently report this situation.
Despite efforts by a range of managers with a responsibility for water quality management, particularly since the early 1990s, the area is characterised by problems that stem from poor water quality and concerns remain for its future ability to support a sustainable ecosystem.
Water quality improvement plans
1 Water quality improvement plans (WQIPs) are documents that detail strategies for water quality improvement in a defined area. They consider the range of pollution inputs to an area and enable stakeholders to agree on outcomes and the processes for achieving them.
2 WQIPs prepared through the Natural Heritage Trust’s (NHT) Coastal Catchments Initiative (CCI) are environmental management plans that codify and implement Australia’s National Water Quality Management Strategy (NWQMS) and the National Principles for the Provision of Water for Ecosystems.
3 A WQIP will:
• identify the current status of pollutant loads
• identify the environmental values (EVs) of water bodies, and the water quality objectives (WQOs) that will protect the EVs
• identify and commit to a set of management actions to achieve and maintain those EVs and WQOs.
4 The Port Waterways WQIP has been developed to achieve the following:
• EVs and WQOs for the Port waterways
• estimates of recent and current loads of nutrients to the waterways from all identifiable sources
• computer model derived estimates of load reductions from major point sources that will allow the EVs and WQOs for the Port waterways to be achieved
• a set of overarching management actions that will take the first steps towards reducing the current nutrient loads, leading to achievement of long-term ecologically sustainable pollutant levels
• commitment by a major discharger to reduce nutrient loads to the waterways through a legally enforceable Environment Improvement Program under the Environment Protection Act 1993
• development of modelling and monitoring systems and adaptive implementation strategies.
5 The WQIP will be administered by the South Australian Environment Protection Authority (EPA), given that the major discharges to the waterways are point sources with discharge licences administered by the EPA.
6 As the major point source loadings reduce, the focus of a revised WQIP is likely to shift towards the effect that other sources of nutrients have on the waterways.
1
7 The WQIP presently relies on the monitoring of discharges to the waterways from catchment sources. It is important that the loads from these discharges do not increase over time with continued development of the Adelaide metropolitan area.
8 The Australian Government considers implementation of WQIPs a core deliverable of the regional natural resources management (NRM) program.
9 The WQIP forms part of an integrated approach to the development of sustainable management of the water quality of metropolitan Adelaide. It is anticipated that the Port Waterways WQIP will form part of the Adelaide Coastal WQIP in the future as the outcomes of the Adelaide Coastal Waters Study (ACWS) are implemented.
The Port Waterways WQIP was developed at the same time as a number of associated projects including:
• Code of Practice for Materials Handling on Wharves <www.epa.sa.gov.au/pdfs/cop_handling.pdf>
• Draft Code of Practice for Vessel and Facility Management: Marine and Inland Waters <www.epa.sa.gov.au/pdfs/cop_vessel.pdf>
• Pollution control load-based licensing (LBL) <www.epa.sa.gov.au/pdfs/lfs_discussion.pdf>
• Feasibility study and possible development of a tradeable rights instrument to reduced nutrient pollution in the Port waterways <www.epa.sa.gov.au/pdfs/pw_rights.pdf>
• Water Quality Monitoring for Execution and Review of the Water Quality Improvement Plan—a report of this work has been included as appendix D of this WQIP.
The CCI has also funded other projects, managed by local government, to improve the quality of water entering the Port waterways:
• Review and Amendment of Council Development Plans—Northern Adelaide and Barossa Catchment Management Board
• Urban Stormwater Master Plan—City of Port Adelaide Enfield
• Gross Pollutant Trap on Dry Creek—City of Salisbury
• Rising Main to South Terrace Reserve Wetland—City of Salisbury
• Burton West Wetlands Project—City of Salisbury.
Environmental values and water quality objectives
1 The Port waterways area is of considerable importance to the Adelaide community, as shown by strong support for local initiatives such as the recently established dolphin sanctuary. A number of studies over the last 10 years which also defined EVs were reviewed and compared with those identified at a recent public meeting held for the WQIP to confirm the EVs and WQOs for various segments of the Port waterways. These values and objectives recognise the altered nature of the waterways from their natural state and the existing use of the Port River itself for industry and transport, but clearly require that the Barker Inlet area be able to support a high quality ecosystem. There is also recognition of the altered nature of the ecosystem in the Port River shipping channel and the inner port area.
2 While excess nutrients in the waterways are considered by the EPA to be the greatest impediment to water in the waterways approaching the quality that the community expects, pollutants other than nutrients are a clear concern and should not be ignored. The management approach taken in the WQIP, that is encouragement of the reuse of wastewater, will also result in a reduction in the discharge load of other pollutants. Additional strategies are also in place to address other pollutants through work by local councils, the Adelaide and Mount Lofty Ranges Natural Resources Management (A&MLR NRM)
2
Board and the EPA. While it is not appropriate to focus on this issue in this WQIP, work on other pollutants will be progressively undertaken, with a review of their role of forming part of a revised WQIP.
3 The proliferation of nuisance algae, particulary Ulva, algal blooms and epiphytic growth on seagrass, is seen as a response to nutrient enrichment. In the absence of quantitative data on plant biomass, chlorophyll a is used as a general indicator of primary productivity. The role of macroalgae will be addressed in the further development of the decision support system (DSS).
4 Comparison of the WQOs with an ambient water quality monitoring program showed that water quality in the Port waterways often exceeds the default values listed in the ANZECC Water Quality Guidelines. However, the WQ Policy makes it clear that local information should be used to frame more appropriate values and provides a mechanism to have such values listed in the policy.
5 Work undertaken as part of the development of the WQIP has resulted in the nomination of values that are more appropriate for the Port waterways.
Pollutant loads
1 There are two main point sources that contribute to the 1538 t/year of nitrogen (N) and 258 t/year of phosphorus (P) loads to the waterways. These are Penrice Soda Products (820 t/year Nitrogen) and the Bolivar Wastewater Treatment Plant (WWTP) (477 t/year N and 232 t/year P). It should be noted that under certain hydrodynamic conditions, wind and tide drive pulses of the discharge from the Bolivar WWTP directly south to southern Barker Inlet, and a considerable portion of the discharge travels north after leaving the discharge point in the mangroves near Chapman Creek. The fate of the northward travelling discharge has not been subject to detailed investigation as part of the development of the WQIP.
2 The annual levels of catchment sources for Barker Inlet were initially estimated to be about 50 t N and 8 t P. Subsequent measurement of the 2005 discharges from the catchment (through the Port Waterways Water Quality Monitoring project) amended this to 39 t N and 3 t P. This may be further adjusted as more monitoring data is available.
3 A load of some importance to the inner Port River is the net discharge from West Lakes. This load of 41 t/year N appears to receive relatively little input from the associated urban catchments (8 t N), but includes measurable quantities that appear to emanate from the Adelaide metropolitan coastal waters.
4 Research undertaken for the ACWS indicates that the dominant nitrogen source in the coastal waters from Outer Harbour to Semaphore is the ammonia discharge from Penrice Soda Products.
5 Other estimated annual loads include the net flux from sediments in the area, particularly the inner Port River (where treated effluent discharged for many years) of 100 t N and atmospheric deposition of 32 t N.
6 A computer-based model has been used to examine the interaction between the major loads to the waterways. It has shown that the discharges from Penrice and Bolivar interact in the waterways even though they are over 10 km apart. The combined effect of the two discharges is likely to be the cause of the seagrass loss that has occurred in parts of Barker Inlet, although the Bolivar discharge is probably the dominant cause of the loss along the coast north of Barker Inlet.
7 Because of the high proportion of nitrogen in the waterways, any phosphorus input, even the pulsed amounts from Bolivar, supports the development of seasonal nuisance algae such as Ulva spp. and microalgal blooms.
3
8 The Penrice and former Port Adelaide WWTP discharges have possibly assisted the expansion of more long-lasting invasive algae such as taxifolia species to parts of the Port River, although this may well have occurred in any case but at a slower rate. The combined effect of the two discharges will enhance the spread of these species in Barker Inlet.
9 Indicative targets for the dischargers have been given as a reduction from 820 t N to 200 t N for Penrice, and 477 t N to 100 t N and 232 t P to 40 t P for Bolivar WWTP.
10 While any modelled target must be treated with some caution, the discharge targets are useful as they give the dischargers an indication of the order of reductions that must be aimed at. As reductions from both dischargers are long-term aims, an adaptive management approach to the assessment of nutrient reductions allows time to refine the targets as the WQIP is implemented and as new scientific information becomes available.
11 As detailed in Section 2, both major dischargers have responded positively to the challenge presented through improved understanding of the nutrient issues in the waterways. Although it will take time to resolve the harm suffered from elevated nutrients, a cooperative approach with clear information available to all stakeholders will result in a healthy Port waterways system in the future.
Environmental flows
1 While flow patterns to and throughout the waterways have been altered over the last 150 years, the effect has generally been one of increasing rather than restricting flow. Examination has established that flows to the waterways from the urban catchment are much increased on the pre-European regime. The WQIP assumes that flows throughout the waterways will not be further impeded and therefore includes no intention to manage this aspect of flows.
2 The trend in catchment management to hold and reuse flows from catchments is advantageous to the waterways and encouraged from the perspective of the WQIP.
3 One issue that may impact on the nutrient status of the waterways is sea level rise and climate change. As sea level rises, existing mangroves will spread toward the land, outcompeting intertidal samphire. Areas that would become intertidal samphire habitat are hemmed in through prior development and use of the land; therefore, samphire will disappear in places. This has clear implications for the biodiversity of many of South Australia’s coastal habitats. However, whether it will have a measurable effect on flows through the waterways is not established.
4 Future management of land use, particularly along the eastern shore of the Barker Inlet and northern Gulf St Vincent, should take these issues into account.
Pollutant management actions
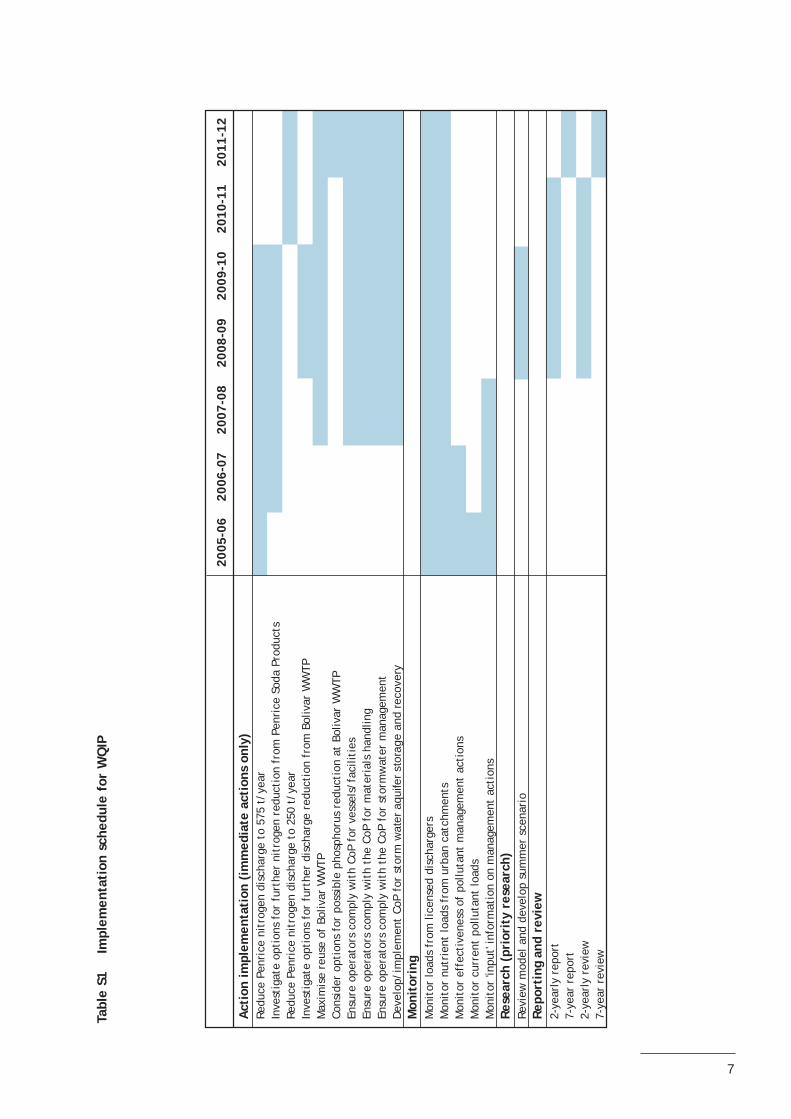
1 A range of actions to reduce pollutant contributions from point and diffuse sources were identified through consultations with stakeholders and scientific investigations (refer Table 3.1).
2 Licensed/regulated activities are under the direct control of the EPA. Improvements through licensing have a high certainty of success, as they are approved by the EPA if they are practical and achievable and licencees are legally bound to implement them. As programs to develop nutrient reduction are developed, they will be reflected in license conditions through Environment Improvement Programs and will be subject to the provisions of the Environment Protection Act.
3 Penrice have responded to the development of the WQIP by committing to a nitrogen reduction to 575 t/year by 2010 and have negotiated an amended license with the EPA to ensure this is achieved. They also aim to reduce their discharge to 250 t/year of nitrogen by 2015. Although no relevant cost-effective technology is presently available, research and development over the next five years will be
4
aimed at developing ways to achieve the required discharge reduction. Penrice will pursue nutrient load reductions under EPA licensing arrangements until agreed sustainable loads are achieved.
4 SA Water have recently completed a major capital works program that both removed high impact treated wastewater discharges directly to the Port River and upgraded the existing Bolivar WWTP. These works delivered a reduction in their discharge loading from 1,265 t N and 320 t P to 477 t N and 232 t P at a cost of over $200 m. The Environmental Levy, would have contributed to this cost. They are nevertheless committed to the ongoing management of their discharges to achieve a nutrient load that will meet community EVs for the waterways and the broader Adelaide coastal waters. When the results of the ACWS are available they will develop a costed strategy for any capital works necessary to address all these issues, consistent with environmental priorities.
5 Such a program will require support from the EPA, who will ensure that the program is adhered to by placing appropriate conditions in the operating licences of SA Water. Therefore, while the actions required of SA Water have not been costed or scheduled (refer Table 3.1), the reductions achieved in the Port waterways to date demonstrate a commitment to responsible environmental management of their discharges on behalf of the SA community.
6 Because of the long lead times needed to develop nutrient reduction technology in large plants, this WQIP proposes that a modest reduction in pollutant loads to the Port waterways of 245 t/year N is achieved in the first five years. It is therefore important that the WQIP be implemented over at least two cycles—14 years—if nutrients are to reduce sufficiently to enable EVs to be achieved.
7 It is expected that development of the water quality model and an improved understanding of the nutrient status of the waterways will result in final discharge targets being adjusted during the initial WQIP. Otherwise, dischargers may spend either too much—to reduce discharges below what is actually needed; or too little—whereby the community will see little improvement in water quality for considerable (but insufficient) expenditure.
Monitoring and research
1 The EPA’s ambient water quality monitoring program has been undertaken since 1996. This program is presently being reviewed to ensure that it is achieving its aims efficiently.
2 Monitoring of water nutrient quality across almost all the catchments that discharge to the Port waterways was achieved through a project associated with the development of the WQIP. Five new or significantly upgraded monitoring stations were developed as part of this work.
3 Water quality monitoring is required to allow appropriate management. This is achieved through determining (in order of priority):
• the effectiveness of management actions
• better estimates of current pollutant loads
• improvements in the predictive modelling ability of resource managers.
4 Quantifying the effectiveness of management actions will allow the plan to be modified as it is implemented. For example, if the effectiveness of management action priorities is shown to be less than anticipated, other measures may need to be adopted or accorded greater priority. If the rates of uptake of management actions fall short of acceptable targets, governments may pursue further incentives to enhance uptake.
5 The DSS containing the water quality model used in the preparation of this plan is proposed to be operated and improved over time by the EPA. A high degree of consultation will be undertaken between EPA modellers and stakeholders to ensure that capital programs to reduce nutrient loads are developed with access to the best available information. While the DSS has been developed with care, all parties
5
recognise the need for refinement and verification, involving examining summer scenarios, accounting for other important factors such as macroalgae and the long-term requirements for both nitrogen and phosphorus.
Reporting and reviewing
1 Reports will be produced two-yearly as part of the adaptive management approach. They will describe progress in plan implementation, results of monitoring and research activities, consultations with stakeholders and the public, actions of government agencies, and any externally generated changes affecting the Port waterways water quality. The reports will be provided for public inspection and comment through web-based means.
2 The WQIP will be reviewed two-yearly based on the reports, information from monitoring and evaluation of current and future management activities, and feedback from stakeholders and the public. Based on this information, the reviews will recommend changes in the plan implementation, if warranted, so as to maximise opportunities to more quickly and efficiently achieve the EVs of the waterways. These changes may include variation in implementation of, and adoption of new, management actions.
3 There will be a major review after five years to assess progress in meeting the load reduction targets, effectiveness of the management actions and appropriateness of the current load targets. A revised plan will be drawn up as a result of this review.
4 There is some minor uncertainty in the final target loads because of some assumptions used in the model. The target loads should be reviewed and, if necessary, modified during the life of the WQIP as better information becomes available from the monitoring program and advances in modelling in this area.
Adaptive implementation
1 The WQIP will initially be implemented by the EPA and the Australian Government in collaboration with SA Water, Penrice Soda Products and the A&MLR NRM Board.
2 The initial implementation of the WQIP will be heavily focused on the management of licences administered by the EPA. However, the continued reduction of wastewater discharges by SA Water at Bolivar will require a broad approach where a number of stakeholders work together to increase the amount of wastewater reused.
3 Oversight of the implementation of the WQIP (refer Table 5.1) is expected to be through joint management of both the Port waterways and Adelaide Coastal Waters.
4 There are current commitments for a limited number of priority implementation, monitoring and research activities. Funded priorities include:
• nitrogen reduction to 575 t/year from Penrice Soda Products
• continued management of the water quality model by the EPA
• continued undertaking of the EPA ambient water quality monitoring program.
5 Notable unfunded priority activities include:
• SA Water reduction in nutrient discharges
• Penrice reduction of N discharge to 200 t/year.
• continuation of the monitoring of flows from urban catchments to the Port waterways.
6
Tabl
e S1
Im
plem
enta
tion
sch
edul
e fo
r W
QIP
2005
-06
2006
-07
2007
-08
2008
-09
2009
-10
2010
-11
2011
-12
Act
ion
impl
emen
tati
on (
imm
edia
te a
ctio
ns o
nly)
Redu
ce P
enri
ce n
itro
gen
disc
harg
e to
575
t/y
ear
Inve
stig
ate
opti
ons
for
furt
her
nitr
ogen
red
ucti
on f
rom
Pen
rice
Sod
a Pr
oduc
tsRe
duce
Pen
rice
nit
roge
n di
scha
rge
to 2
50 t
/yea
rIn
vest
igat
e op
tion
s fo
r fu
rthe
r di
scha
rge
redu
ctio
n fr
om B
oliv
ar W
WTP
Max
imis
e re
use
of B
oliv
ar W
WTP
Cons
ider
opt
ions
for
pos
sibl
e ph
osph
orus
red
ucti
on a
t Bo
livar
WW
TPEn
sure
ope
rato
rs c
ompl
y w
ith
CoP
for
vess
els/
faci
litie
sEn
sure
ope
rato
rs c
ompl
y w
ith
the
CoP
for
mat
eria
ls h
andl
ing
Ensu
re o
pera
tors
com
ply
wit
h th
e Co
P fo
r st
orm
wat
er m
anag
emen
tD
evel
op/i
mpl
emen
t Co
P fo
r st
orm
wat
er a
quife
r st
orag
e an
d re
cove
ryM
onit
orin
gM
onit
or lo
ads
from
lice
nsed
dis
char
gers
Mon
itor
nut
rien
t lo
ads
from
urb
an c
atch
men
tsM
onit
or e
ffec
tive
ness
of
pollu
tant
man
agem
ent
acti
ons
Mon
itor
cur
rent
pol
luta
nt lo
ads
Mon
itor
'inp
ut' i
nfor
mat
ion
on m
anag
emen
t ac
tion
sRe
sear
ch (
prio
rity
res
earc
h)Re
view
mod
el a
nd d
evel
op s
umm
er s
cena
rio
Repo
rtin
g an
d re
view
2-ye
arly
rep
ort
7-ye
ar r
epor
t2-
year
ly r
evie
w7-
year
rev
iew
7

Port Waterways Water Quality Improvement Plan
1 INTRODUCTION
1.1 The Port waterways and its catchments
The Port waterways, consisting of the Port River, North Arm, North Arm Creek, Angas Inlet and Barker Inlet, is an area of major ecological, commercial and recreational importance. Its location and catchments are shown on Figure 1.1.
1.2 Nutrients and the ecological condition of the Port waterways
Development and subsequent pollution throughout the history of South Australia has resulted in a decline in ecosystem health. This is apparent to the general community through the large-scale loss of intertidal and subtidal seagrasses, mangrove decline and the occurrence of algal blooms including toxic species.
Considerable effort and investment has been put into resolving these issues, with substantial reductions in pollutant loads being achieved by a range of managers responsible for water quality, particularly since the early 1990s. However, the problems still remain and there are concerns for its future ability to support a sustainable ecosystem.
Studies into the environmental status of the waterways consistently report that nutrients, in particular nitrogen and phosphorus, are the key pollutants throughout the waterways. The focus of this water quality improvement plan (WQIP) is therefore nutrients.
Other pollutants, for example metals, hydrocarbons and faecal coliforms, are dealt with through other management processes such as EPA licensing, NRM catchment plans, Environment Protection Policies and Codes of Practice. Background information on the full range of pollutants is provided in the Stage 1 WQIP document (EPA 2005a).
With the substantial efforts that have already been made to improve the health of the Port waterways, it is important that focus is now on ensuring that further investment is properly targeted and adequate. If adequate a healthy sustainable ecosystem can be achieved.
1.3 The Water Quality Improvement Plan
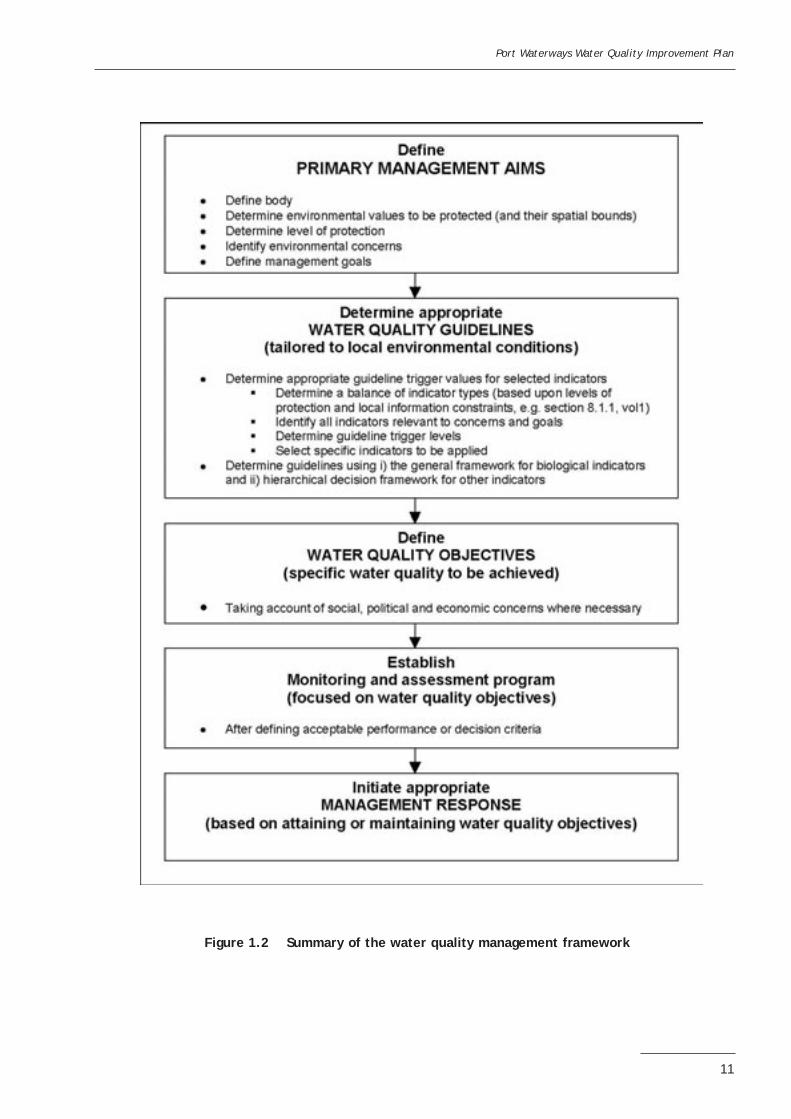
Water Quality Improvement Plans (WQIPs) are documents that detail strategies for water quality improvement in a defined area. WQIPs prepared through the Natural Heritage Trust (NHT) Coastal Catchments Initiative (CCI) are environmental management plans that codify and implement Australia’s National Water Quality Management Strategy (NWQMS) and the National Principles for the Provision of Water for Ecosystems.
A WQIP aims to:
• identify current ecological condition, water quality status and pollutant loads
• identify the environmental values (EVs) of water bodies, and the water quality objectives (WQOs) that will protect the EVs. WQOs are defined both as ambient concentrations and maximum allowable loads discharged
• identify and commit to a set of management actions to achieve and maintain those EVs and WQOs (Figure 1.2).
9
10
Figu
re 1
.1
Port
wat
erw
ays
loca
tion
and
cat
chm
ents
Port Waterways Water Quality Improvement Plan
Figure 1.2 Summary of the water quality management framework
11
Port Waterways Water Quality Improvement Plan
This Port Waterways WQIP has been developed as an implementation of the NWQMS, with the following aim:
Deliver a strategy and tools to ensure that nutrient levels in the Port waterways are consistent with community expectations.
The scientific studies undertaken as part of the WQIP define the levels of nutrient discharge reduction required, and further work undertaken to develop the WQIP has resulted in commitment from key stakeholders to the reductions necessary to achieve this aim.
The WQIP consists of two stages. Stage 1 (EPA 2005a) developed background information about the waterways. This Port Waterways WQIP (Stage 2) has since been developed, achieving the following:
• EVs and WQOs for the Port waterways
• estimates of recent and current loads of nutrients to the waterways from all identifiable sources
• computer model derived estimates of water quality improvement and associated load reductions from major point sources that will allow the EVs and WQOs for the Port waterways to be achieved
• a set of management actions that will take the first steps towards reducing the current nutrient loads, leading to achievement of sustainable pollutant levels
• commitment by a major discharger to reduce nutrient loads to the waterways through a legally enforceable Environment Improvement Program under the Environment Protection Act 1993
• development of modelling and monitoring systems and adaptive implementation strategies.
When implemented, the WQIP will be the principal tool guiding long-term ecologically sustainable nutrient loads to the Port waterways.
The WQIP will be administered by the South Australian Environment Protection Authority (EPA), given that the major discharges to the waterways are point sources with discharge licences administered by the EPA.
As the major point source loadings reduce, the focus of a revised WQIP is likely to shift towards the effect that other minor sources of nutrients have on the waterways. The WQIP has used the monitoring of discharges to the waterways from catchment sources. It is important that these discharges do not increase over time with continued development of the Adelaide metropolitan area.
The WQIP forms part of an integrated approach to the development of sustainable management of the water quality of metropolitan Adelaide. The Port waterways WQIP will form part of the Adelaide Coastal WQIP in the future as the outcomes of the Adelaide Coastal Waters Study (ACWS) are implemented.
The Australian Government considers implementation of WQIPs a core deliverable of the regional natural resources management (NRM) program. The integrated Adelaide Coastal Waters WQIP will be available to the Adelaide and Mount Lofty Ranges Natural Resources Management (A&MLR NRM) Board as it develops its strategic plan, which will be implemented through its business plans.
The EPA, with support from the Australian Government, has undertaken several other parallel projects that are of significance to the development of this WQIP:
• Code of Practice for Materials Handling on Wharves <www.epa.sa.gov.au/pdfs/cop_handling.pdf>
• Draft Code of Practice for Vessel and Facility Management (Marine and Inland Waters) <www.epa.sa.gov.au/pdfs/cop_vessel.pdf>
12
Port Waterways Water Quality Improvement Plan
• Pollution control load-based licensing (LBL) <www.epa.sa.gov.au/pdfs/Ifs_discussion.pdf.html>
• Feasibility study and possible development of a tradeable rights instrument to reduced nutrient pollution in the Port waterways. <www.epa.sa.gov.au/pdfs/pw_rights.pdf>
• Water Quality Monitoring for Execution and Review of the Water Quality Improvement Plan—a report of this work has been included as Appendix D of this WQIP.
The CCI has also funded other projects, managed by local government, to improve the quality of water entering the Port waterways:
• Review and Amendment of Council Development Plans—Northern Adelaide and Barossa Catchment Management Board
• Urban Stormwater Master Plan—City of Port Adelaide Enfield
• Gross Pollutant Trap on Dry Creek—City of Salisbury
• Rising Main to South Terrace Reserve Wetland—City of Salisbury
• Burton West Wetlands Project—City of Salisbury.
Section 3.1.3 of this WQIP contains further summaries of all the above projects.
Other relevant investigations and management strategies exist that relate to the water quality of the Port waterways, including catchment plans, the ACWS and other codes of practice.
1.4 Environmental values of the Port waterways
One of the first steps in the WQIP is defining the EVs that stakeholders value the area for.
Establishing EVs involves both the definition of particular segments of an area and what the stakeholders value within those segments. EVs and segments were defined for the Port waterways at the beginning of development of Stage 1 of this WQIP. The work (refer EPA 2005c for details) built on previous studies, in particular the Torrens Catchment Water Management Plan, updated with the more recent ANZECC (2000) National Guidelines. The EVs are outlined in Section 2.2.
1.5 Nutrient reduction to date
In recent years state and local government authorities, including the former Torrens and the former Northern Adelaide and Barossa Catchment Water Management Boards, and the Barker Inlet Port Estuary Committee (BIPEC), have been active in addressing these issues.
Licensing of discharges to the marine environment began in 1990, focusing considerable attention on the Port waterways. As a result of the regulation of major dischargers, there have been significant reductions in both the number of discharges and the loads discharged to the waterways. A relevant example has been the investment of over $200 m by the SA Government through SA Water to relocate the Port Adelaide Wastewater Treatment Plant (WWTP) to Bolivar, and the associated redevelopment of the Bolivar WWTP. This has reduced SA Water’s contribution to the nutrient load to the Port waterways by over 1,200 t of nitrogen (N) (70%) and 60 t of phosphorus (P) (17%). The work of catchment boards and State government agencies in catchment management strategies has so far resulted in a total reduction of 23.5 t N (31%) and 5 t P (26%) between 1995 and 2004.
13
Port Waterways Water Quality Improvement Plan
Overall, nutrient loads to the Port waterways from 1995 to 2004 have reduced from about 3300 t/year to less than 1,600 t/year N (51%) and from about 360 t/year to 270 t/year P (25%) (Table 2.4).
To prevent further ecosystem decline and/or allow recovery, further reductions in nutrient load are still required (refer Stage 1 report). To date, the extent of reduction required has not been clear, and further scientific investigation has been undertaken on this issue for the preparation of this WQIP (Stage 2).
Nutrient reductions are costly to implement and become more costly as very low levels of nutrient load are targeted. Without a clear understanding of and justification for these reductions, water quality managers would be hard pressed to pursue the research and appropriate investment to achieve further reductions.
Conversely, the work has shown that while the investment in nutrient reductions to date is likely to result in some improvement in the Port waterways, it will be of little value to the whole of the waterways unless it is supported by further efforts by the main dischargers.
The decision support system (DSS) will be further refined, in consultation with stakeholders, including the examination of summer scenarios, the role of macroalgae or defining long-term targets for both nitrogen and phosphorus.
1.6 Environmental flow management in the Port waterways
With respect to water flows, the Port waterways including the Barker Inlet are best described as an embayment rather than an estuary (refer Section 2). Because the waterways do not have significant riverine inputs, the issue of environmental flows is not as important in this system as it might be in other river catchments and estuaries.
A brief review of this issue undertaken for this WQIP is included in Appendix E.
1.7 Consultation processes used in developing the plan
The initial development of the WQIP comprised a program of consultation with key stakeholders and the wider community, focusing on the setting of EVs. The aim of developing a WQIP and the process that would be used to do this were also explained.
Stakeholders were kept informed of the process through regular presentation of information at the Port Adelaide Environmental Forum and the Barker Inlet Port Estuary Committee. Regular information was also presented to other stakeholder groups at their meetings over the time of development of the WQIP.
It became apparent during the early stages of the project that two EPA-licensed dischargers were responsible for a high proportion of the nutrient load to the waterways. This was communicated to them and the steering committee for the development of the WQIP (Table 1.1) invited them to become members. Information was regularly presented to different management levels in their organisations to ensure that they understood the implications of the WQIP and were able to be involved in its development.
The nutrient discharge targets derived from modelling present considerable challenges to the stakeholders as they require very low nutrient discharge loads to allow the water quality of the waterways to meet the EVs. A model workshop was held where key stakeholders and independent water quality and water modelling experts were able to explore the strengths and weaknesses of the model used to derive the targets. This increased confidence in the model outputs and also provided direction on how to better use the model results. It pointed to the work vitally needed to further develop the model to provide a better understanding of how to manage the waterways and better delineate any role of phosphorus discharges from Bolivar (refer Sections 3.7, 3.8 and 4.2.2).
14
Port Waterways Water Quality Improvement Plan
The WQIP will be communicated to key stakeholder groups including community groups, at their meetings to enable the issues to be considered within their groups. The web-based WQIP will also be made available to the general community through the EPA webpage.
1.8 Ongoing involvement with the Adelaide and Mount Lofty Ranges Natural Resources Management Board
The engagement of the A&MLR NRM Board is critical to the successful implementation of the WQIP. While initial development of the plan was undertaken with recognition of the likely range of the board’s role in water quality and flow management, full consultation was not possible as the board was not yet established. The future of the A&NLR NRM Board will be determined following the development of the more integrated Adelaide Coastal Waters WQIP and its regional NRM Plan Resources Condition Targets and related monitoring and evaluation programmes.
A memorandum of understanding was originally envisaged as the most appropriate instrument to define the roles of the EPA and the A&MLR NRM Board at the time that the WQIP was begun. With the formation of a local NRM Board during the development of this WQIP, further consultation with the NRM Board will occur, possibly through the Adelaide Coastal Waters Steering Committee with a view to defining the Board’s role.
1.9 Ongoing involvement with the Adelaide Dolphin Sanctuary
The Adelaide Dolphin Sanctuary Act 2005 was proclaimed to provide protection to the Port River and Barker Inlet community of dolphins. The Act requires the preparation of a Management Plan and achievement of objectives to protect dolphins and their habitat and improve water quality. The EPA and the Department for Environment and Heritage will work together to ensure that the common goals of both the sanctuary and the WQIP are efficiently achieved.
Table 1.1 Port waterways CCI Steering Committee member list
Vaughn Cox Australian Government Department of Environment and Heritage (02) 6274 1589 [email protected]
Gayle Greiger Adelaide and Mount Lofty Ranges Natural Resources Management Board BIPEC representative (08) 8285 2033 [email protected]
Verity Sanders City of Port Adelaide Enfield BIPEC representative (08) 8405 6765 [email protected]
Peri Coleman Delta Environmental Consulting BIPEC representative (08) 8280 5910 [email protected]
Murray Townsend Department for Environment and Heritage (08) 8124 4879 [email protected]
Vera Hughes Department for Environment and Heritage (08) 8124 4887 [email protected]
Peter Dolan Environment Protection Authority (08) 8204 2018 [email protected]
Sam Gaylard Environment Protection Authority (08) 8204 2068 [email protected]
Peter Pfennig Environment Protection Authority (08) 8204 2181 [email protected]
Paul Saliba Penrice Soda Products (08) 8402 7351 [email protected]
15

Port Waterways Water Quality Improvement Plan
Pat Harbison pH Environment BIPEC representative (08) 8522 4714 [email protected]
Karen Rouse SA Water (08) 8204 1979 [email protected]
Tim Kildea SA Water (08) 8259 0222 [email protected]
Rodney May Transport SA (08) 8204 8149 [email protected]
16
Port Waterways Water Quality Improvement Plan
2 WATER QUALITY—NUTRIENT OBJECTIVES AND LOADS
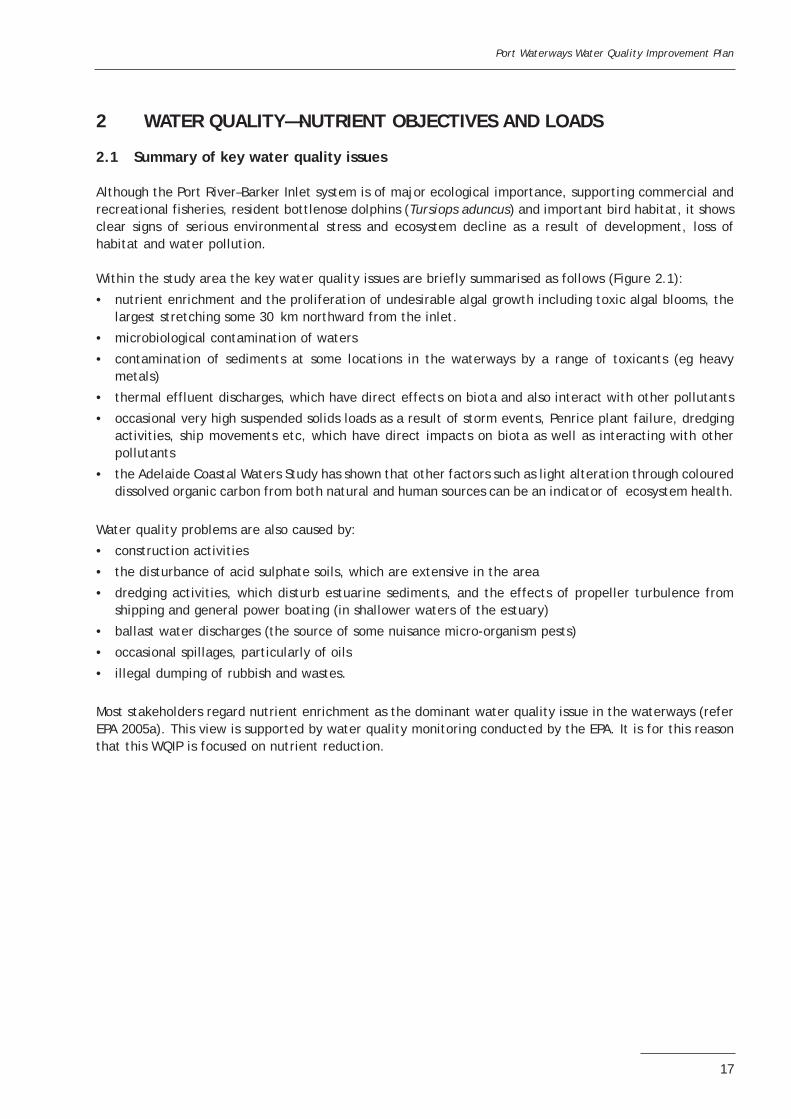
2.1 Summary of key water quality issues
Although the Port River–Barker Inlet system is of major ecological importance, supporting commercial and recreational fisheries, resident bottlenose dolphins (Tursiops aduncus) and important bird habitat, it shows clear signs of serious environmental stress and ecosystem decline as a result of development, loss of habitat and water pollution.
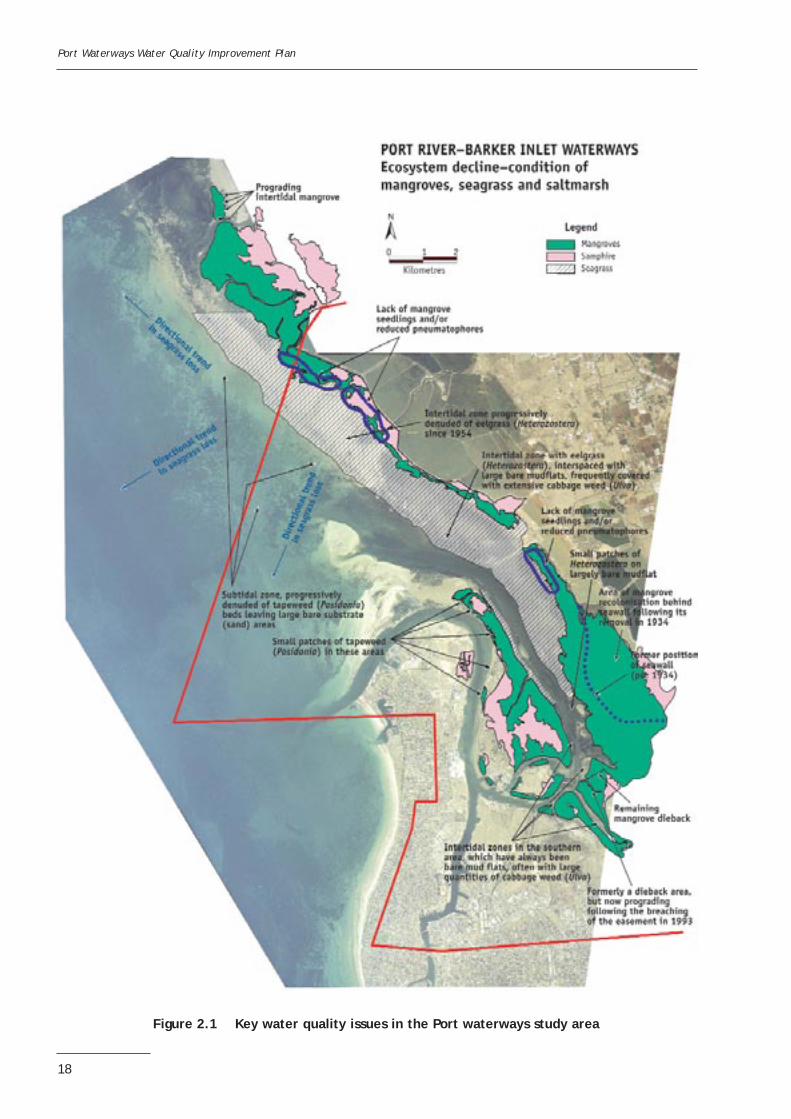
Within the study area the key water quality issues are briefly summarised as follows (Figure 2.1):
• nutrient enrichment and the proliferation of undesirable algal growth including toxic algal blooms, the largest stretching some 30 km northward from the inlet.
• microbiological contamination of waters
• contamination of sediments at some locations in the waterways by a range of toxicants (eg heavy metals)
• thermal effluent discharges, which have direct effects on biota and also interact with other pollutants
• occasional very high suspended solids loads as a result of storm events, Penrice plant failure, dredging activities, ship movements etc, which have direct impacts on biota as well as interacting with other pollutants
• the Adelaide Coastal Waters Study has shown that other factors such as light alteration through coloured dissolved organic carbon from both natural and human sources can be an indicator of ecosystem health.
Water quality problems are also caused by:
• construction activities
• the disturbance of acid sulphate soils, which are extensive in the area
• dredging activities, which disturb estuarine sediments, and the effects of propeller turbulence from shipping and general power boating (in shallower waters of the estuary)
• ballast water discharges (the source of some nuisance micro-organism pests)
• occasional spillages, particularly of oils
• illegal dumping of rubbish and wastes.
Most stakeholders regard nutrient enrichment as the dominant water quality issue in the waterways (refer EPA 2005a). This view is supported by water quality monitoring conducted by the EPA. It is for this reason that this WQIP is focused on nutrient reduction.
17
Port Waterways Water Quality Improvement Plan
Figure 2.1 Key water quality issues in the Port waterways study area
18
Port Waterways Water Quality Improvement Plan
Tabl
e 2.
1
Envi
ronm
enta
l va
lues
, w
ater
qua
lity
issu
es a
nd w
ater
qua
lity
obje
ctiv
es (
nutr
ient
s)
Envi
ronm
enta
l val
ues
Segm
ent
Des
irab
le e
nvir
onm
enta
lva
lues
A
re v
alue
sbe
ing
achi
eved
?
Wat
er q
ualit
y is
sues
N
utri
ent
pollu
tant
indi
cato
rs
Wat
er q
ualit
y ob
ject
ives
for
nutr
ient
s W
QIP
per
form
ance
indi
cato
rs
Nor
ther
nse
gmen
t Aq
uati
c ec
osys
tem
prot
ecti
on,
incl
udin
gpr
otec
tion
of
fish
bre
edin
gan
d nu
rser
y ha
bita
t,do
lphi
ns a
nd m
angr
oves
.N
o od
ours
fro
m d
ecay
ing
alga
l deb
ris
or W
WTP
s Re
crea
tion
– co
ntac
t ––
pass
ive
Har
vest
ing
of f
ish
and
shel
lfis
h fo
r hu
man
cons
umpt
ion
• • •
No
Yes
Yes
Yes
Loss
of
seag
rass
com
mun
itie
sLo
ss o
f m
angr
oves
• •
Exte
nt o
f Ulv
a gr
owth
Cont
inui
ngm
angr
ove
and
seag
rass
los
sH
igh
nutr
ient
conc
entr
atio
ns
• • •
Chlo
roph
yll
a 1µ
g/L
Phos
phor
us
Tota
l 25
µg/
L F
RP
10 µ
g/L
Nit
roge
n
Tota
l N
230
µg/
L N
itra
te a
ndni
trat
e N
5 µ
g/L
Am
mon
ia N
10
µg/
L
Ulv
a g
row
thsu
bsta
ntia
llyre
duce
dN
o fu
rthe
r de
clin
ein
sea
gras
s
No
furt
her
loss
of
man
grov
es
• • •
Cent
ral
Bark
erIn
let
segm
ent
Aqua
tic
ecos
yste
mpr
otec
tion
, in
clud
ing
prot
ecti
on o
f fi
sh b
reed
ing
and
nurs
ery
habi
tat,
dolp
hins
and
man
grov
es.
No
odou
rs f
rom
dec
ayin
gal
gal d
ebri
s or
WW
TPs.
Re
crea
tion
– co
ntac
t ––
pass
ive
Har
vest
ing
of f
ish
and
shel
lfis
h fo
r hu
man
cons
umpt
ion
• • •
No
Yes
Yes
Yes
Ulv
a pr
olif
erat
ion
Occ
asio
nal f
ish
kills
Loss
of
man
grov
esO
dour
s fr
omde
cayi
ng a
lgae
Pote
ntia
lre
mob
ilisa
tion
of
pollu
tant
s fr
omse
dim
ents
• • • • •
Hig
h nu
trie
ntco
ncen
trat
ions
Exte
nt o
f Ulv
a gr
owth
Cont
inui
ngm
angr
ove
and
seag
rass
los
s
Low
oxy
gen
cond
itio
ns
• • • •
Chlo
roph
yll
a 1
µg/
L
Phos
phor
usTo
tal
25 µ
g/L
FRP
10
µg/
L
Nit
roge
nTo
tal N
23
0 µg/
L N
itra
te a
ndni
trat
e N
5µg/
L A
mm
onia
N
10 µ
g/L
Ulv
a g
row
thsu
bsta
ntia
llyre
duce
d (b
y at
leas
t60
%)M
inim
al o
r no
odou
r fr
omde
cayi
ng a
lgae
Redu
ctio
n in
the
occu
ranc
e an
dex
tent
of
low
oxy
gen
cond
itio
ns
• • •
19
Port Waterways Water Quality Improvement Plan
Envi
ronm
enta
l val
ues
Segm
ent
Des
irab
le e
nvir
onm
enta
lva
lues
A
re v
alue
sbe
ing
achi
eved
?
Wat
er q
ualit
y is
sues
N
utri
ent
pollu
tant
indi
cato
rs
Wat
er q
ualit
y ob
ject
ives
for
nutr
ient
s W
QIP
per
form
ance
indi
cato
rs
Port
Riv
erse
gmen
t Aq
uati
c ec
osys
tem
prot
ecti
onRe
crea
tion
– co
ntac
t (i
nc.
safe
swim
min
g in
key
are
as)
– pa
ssiv
eH
arve
stin
g of
fis
h an
dsh
ellf
ish
for
hum
anco
nsum
ptio
n
• • •
No
No
No
No
Alga
l blo
oms
(occ
asio
nally
tox
ic)
Occ
asio
nal f
ish
kills
Amm
onia
tox
icit
y
Dis
colo
urat
ion
Odo
urs
from
deca
ying
alg
aePo
tent
ial
rem
obili
sati
on o
fpo
lluta
nts
from
sedi
men
tsAc
cum
ulat
ion
ofto
xins
in s
hellf
ish
• • • • • • •
Hig
h nu
trie
ntco
ncen
trat
ions
At t
imes
, hi
ghch
loro
phyl
l lev
els
oral
gal n
umbe
rs(b
loom
s)Lo
w o
xyge
nco
ndit
ions
Hig
h co
lour
,su
spen
ded
solid
san
d tu
rbid
ity
Hig
h am
mon
iale
vels
• • • • •
Chlo
roph
yll
a 1
µg/
L
Phos
phor
us
Tota
l 25
µg/
L F
RP
10 µ
g/L
Nit
roge
n
Tota
l N
230
µg/L
Nit
rate
and
nitr
ate
N
5 µg/
L A
mm
onia
N
10 µ
g/L
Redu
ced
freq
uenc
y, e
xten
tan
d du
rati
on o
fal
gal b
loom
sAm
mon
iaco
ncen
trat
ions
larg
ely
redu
ced
belo
w 2
00 µ
g/L
Min
imal
or
nood
ours
fro
mde
cayi
ng a
lgae
• • •
20
Port Waterways Water Quality Improvement Plan
Environmental values of the Port waterways
The national approach in water quality management is to recognise the particular environmental values (EVs) of water bodies, as defined in ANZECC (2000), as ‘values or uses of the environment that are important for a healthy ecosystem or for public benefit, welfare, safety or health and which require protection from the effects of pollution, waste discharges and deposits’.
The EVs of the Port waterways have been defined in a number of previous studies, in particular the Torrens Catchment Water Management Plan as summarised in the Stage 1 report (EPA 2005a).
Appropriate EVs for the Port waterways are:
• the protection and maintenance of aquatic ecosystems, as a result of the importance of the area
(refer Table 2.1)
• primary industries, in this case aquaculture/human consumption of aquatic foods
• recreation and aesthetics
• industrial water, in this case cooling water for power stations.
In addition, although not an ANZECC-defined environmental value:
• cultural and spiritual values.
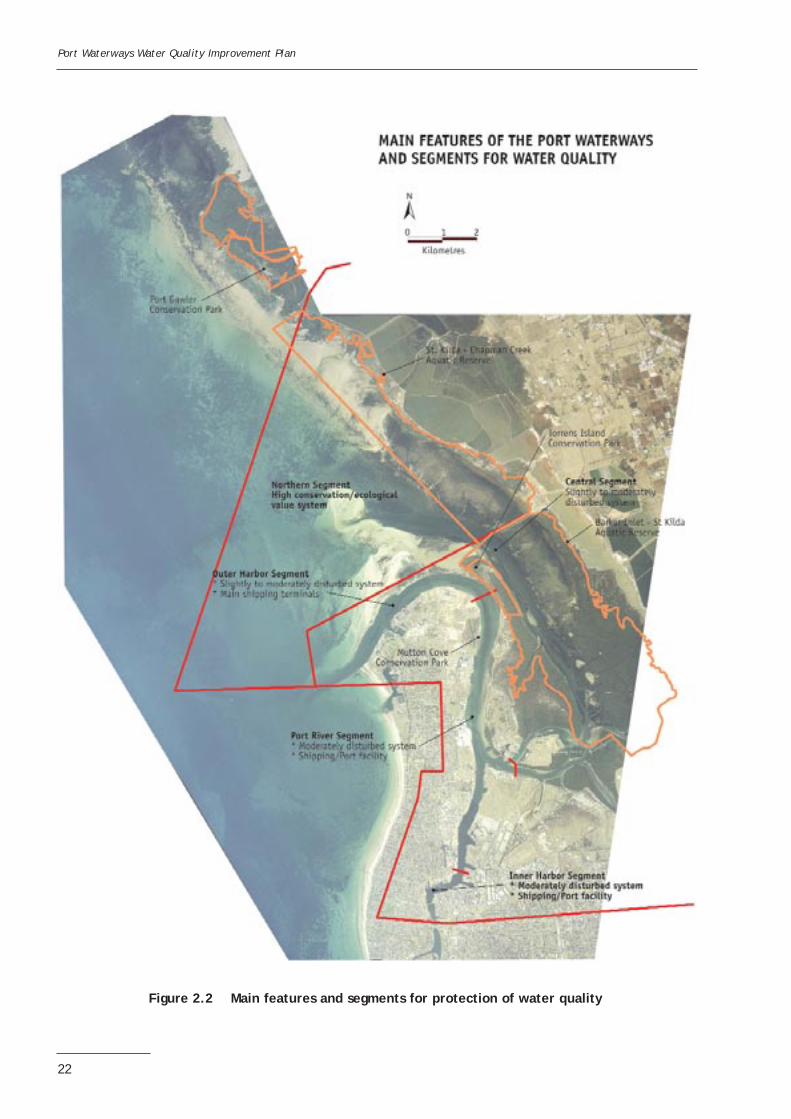
While the values are generally applicable throughout the study area, differences in emphasis are to be expected. ANZECC (2000) also defined different levels of protection depending upon condition and area sensitivities. Consistent with the national approach, and following further consultation with key stakeholders and the broader community, these general EVs have been confirmed. However, distinct segments of the waterways and their appropriate levels of protection have been more adequately redefined, based upon the results of modelling DSSs; (refer Section 4 and Appendix F) and input from key stakeholders and the wider community. The redefined segments of the study area and their appropriate levels of protection, as shown on Figure 2.2, are as follows:
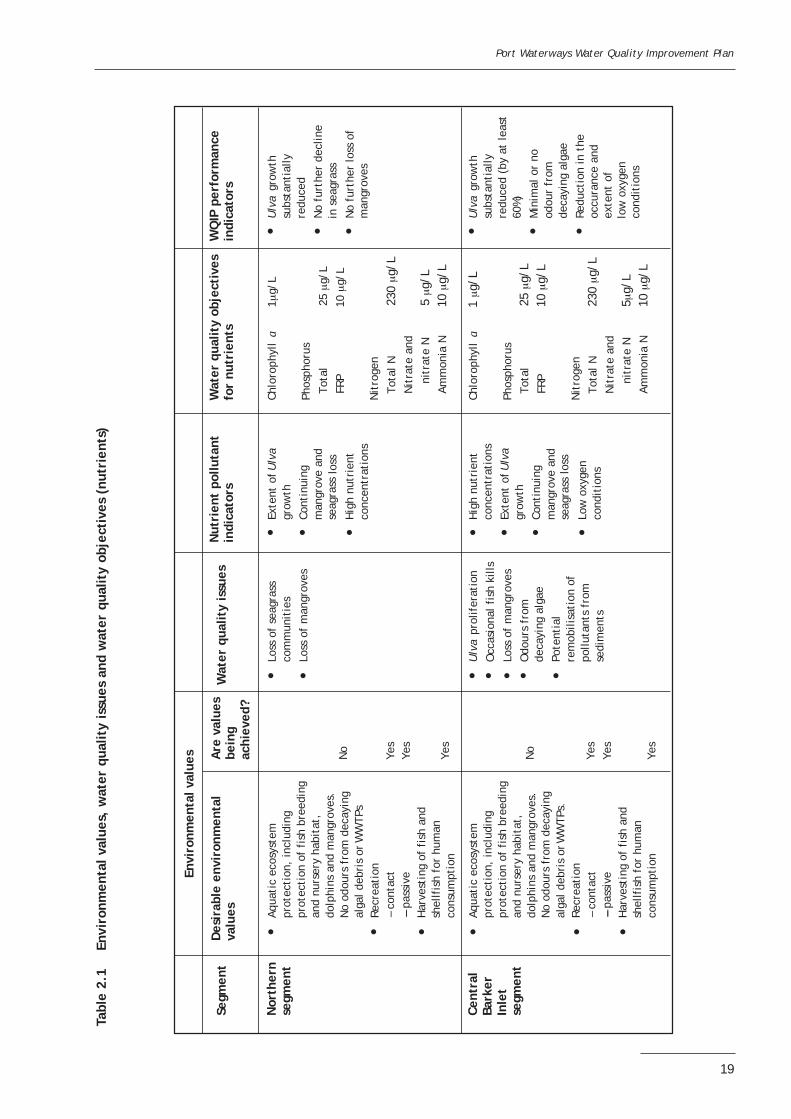
Northern segment, north of St Kilda and Torrens Island:
• This is a high conservation/ecological value system. As described in Section 3, it is an area severely impacted by nutrients, and the highest level of protection is considered appropriate.
Central Barker Inlet segment, south of St Kilda in Barker Inlet, Angas Inlet, North Arm and North Arm Creek:
• This is defined as slightly to moderately disturbed. Although there have been impacts due to poor water quality and development, much of the natural ecosystem remains. A very high level of protection is required for it to be maintained, but with the recognition that there is a limit on what can be achieved in returning to pristine conditions.
21
Port Waterways Water Quality Improvement Plan
Figure 2.2 Main features and segments for protection of water quality
22
Port Waterways Water Quality Improvement Plan
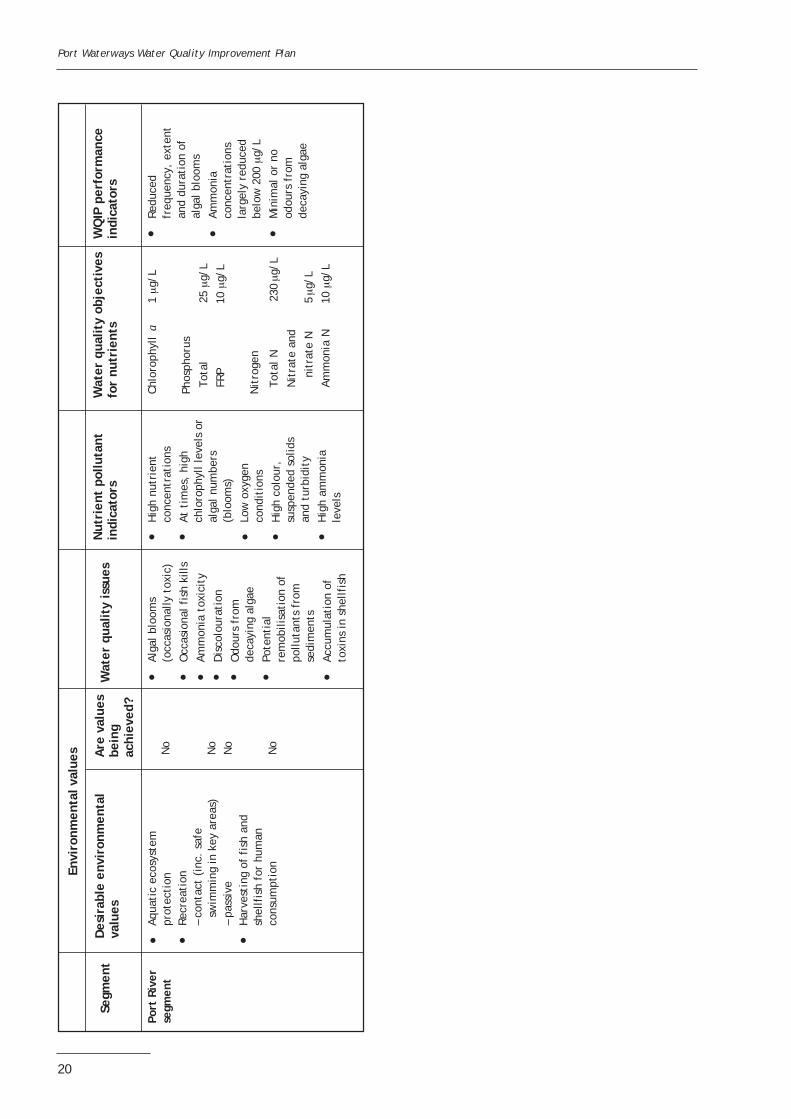
• The Port River segment: Because of the development of port facilities, this is a partially degraded area. While it has lower ecological value compared to the Northern or Central Barker Inlet segments, it nevertheless has important recreational value (eg boating, amenity, fishing). A reasonably high standard is required to maintain these uses. The inner harbour Section of the Port River is now being further developed as a residential area. Consequently, amenity and recreation, both contact and passive, are increasingly important to the community.
Five segments were originally defined during public consultation. With the benefit of the DSS output and further consultation with the community three segments are now defined. Water quality modelling of the waterways showed that the five could be simplified to three segments while still retaining the community-derived EVs for the area. The flow regime of the waterways has a dominating effect on the transport of nutrients and the resultant water quality, and these segments reflect the three areas of the waterways with markedly different flow characteristics.
For each defined segment Table 2.1 summarises:
• the desirable EVs, as defined by ANZECC (2000) and from input from the community
• whether the EVs are being achieved
• the key water quality issues as they relate to nutrients
• nutrient pollutant indicators
• the ambient WQOs for nutrients for each segment—these objectives use the ANZECC (2000) trigger values
• WQIP performance indicators for nutrient reductions.
The definition of WQOs (Section 2.3) is dependent on the water quality requirements necessary for maintenance of the above standards and to allow for ecosystem recovery.
23
Port Waterways Water Quality Improvement Plan
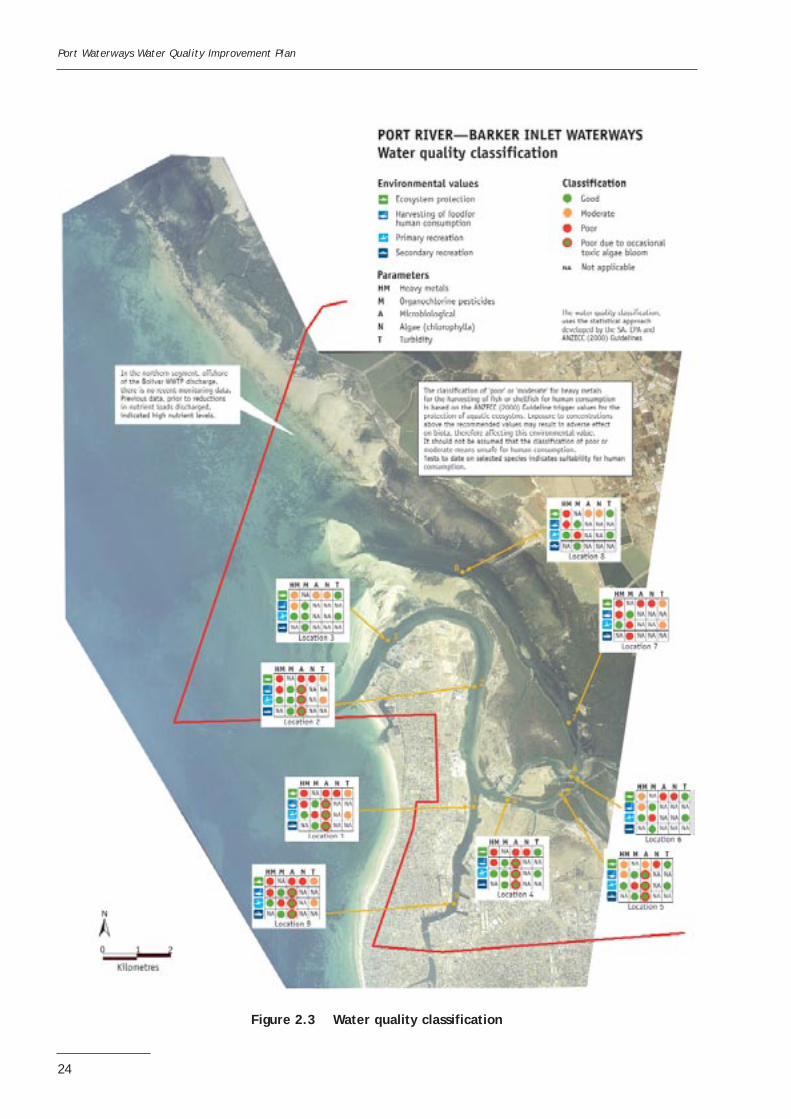
Figure 2.3 Water quality classification
24
Port Waterways Water Quality Improvement Plan
2.3 General water quality status prior to the WQIP
The EPA (2002) has described water quality in the Port waterways using data from its ambient water quality monitoring program undertaken during 1996–2000. These data broadly describe the area prior to the removal of the PAWWTP, and provides a reference point in time for the WQIP. It is also to be noted that the DSS modelling was undertaken at the time of the change. In EPA (2002), the following were used as broad indicators of quality:
• heavy metals (copper, lead, mercury, cadmium, chromium, aluminium, zinc and iron)
• water clarity (turbidity)
• nutrients (ammonia, total Kjeldahl nitrogen, nitrate, nitrite, phosphorus)
• chlorophyll a [indicator of algal (phytoplankton) biomass]
• faecal bacteria (E coli, total faecal coliforms, enterococci).
The first four indicators defined status in relation to ecosystem protection. The microbiological (fifth) indicator was used in relation to suitability for recreation activities involving primary contact with water such as swimming.
The EPA referred to the earlier ANZECC guidelines (1992) to define the indicators. In the Stage 1 report the EPA classification was revised using the more recent ANZECC guidelines (2000) to define water quality status in relation to:
• ecosystem protection
• the harvesting of fish and shellfish for human consumption
• recreation, including both primary contact (eg swimming) and secondary contact (eg boating, aesthetic enjoyment).
This classification has again been revised for nutrients, as shown on Figure 2.3, using the values defined in Table 2.2 (Section 2.4). During this period of monitoring, nutrient loads discharged into the waterways were much greater than they are at present (Section 2.4). In particular, the Port Adelaide wastewater treatment plant (WWTP) was discharging directly into the Port River. It is also important to note that:
• Periodic phytoplankton blooms (red tides) are also a very important factor in determining water quality status, both with respect to recreational use and the protection of aquatic ecosystems.
• The water quality classification shown on Figure 2.3 is based on physicochemical parameters, but amenity or aesthetic value is also an important measure. In addition to colour and turbidity, floating debris (eg cartons, bottles) has a major impact. The extensive growth of Ulva spp., shown on Figure 2.1, apart from its impact on ecosystems, is unsightly and frequently a source of offensive odours.
2.4 Water quality objectives (nutrients)
The values in the Environment Protection (Water Quality) Policy 2003 (WQ Policy) provide guidance to water quality managers in South Australia. Consistent with the direction provided by the WQ Policy, the water quality model developed for the WQIP has provided a better understanding of the concentrations of nutrients that should be present in the Port waterways. These are significantly lower than the values for nutrients provided in the WQ Policy.
The WQOs defined in this WQIP are based on the prevention of any further ecosystem decline as a result of nutrient enrichment, and are designed to assist ecosystem recovery. To achieve these objectives, maximum permissible nutrient discharge loads have been developed through the use of the water quality model (Section 2.6).
The water quality status described in Section 2.3 was based on ambient water quality data. However, nutrients, particularly the bioavailable forms, are removed from the water column as a result of uptake by plants. This uptake can be quite rapid, particularly in the spring–summer period. There is also some loss of
25
Port Waterways Water Quality Improvement Plan
nitrogen by de-nitrification, and of both nitrogen (N) and phosphorus (P) to sediments. The direct result of the presence of bioavailable nutrients in the water column is the growth of algae. Not all nutrients discharged into the waterways are bioavailable, but they can become so through various biological processes.
Relying on ambient concentrations alone as a measure of ecosystem health is therefore insufficient. Offshore from the Bolivar WWTP discharge, for example, one major effect contributing to the seagrass decline is prolific epiphyte growth on seagrass blades. The epiphytes act as a nutrient sink while shading the seagrass leaves from sunlight, thus contributing to their loss. Ambient water quality monitoring may detect elevated nutrients, particularly in close proximity to the discharge, but may not detect any significantly elevated nutrients in other areas which lead to damage to ecosystems. Other factors are also included, such as turbidity, suspended solids and colour (coloured dissolved organic carbon). These affected the transmission of light, which affects primary productivity.
General water quality objective (trigger) levels for nutrients and chlorophyll a are included in Table 2.2. The reductions in current discharge loads required to achieve these objectives are summarised in Section 2.6.
Table 2.2 Default trigger values for nutrients and chlorophyll a
Ecosystem type Chl α
(µg/L)
TP
(µg/L)
FRP
(µg/L P)
TN
(µg/L N)
NOx
(µg/L N)
NH4+
(µg/L N)
Marine 1 25 10 230 5 10
The reductions in trigger values are based on the following considerations:
• Although the Port River–Barker Inlet is variously referred to as an estuarine system, it is more appropriate to refer to water quality guideline values of marine waters because the majority of the area is more like a bay. Even the Port River has no major freshwater input or a salinity gradient typical of estuaries. It also now receives essentially marine water through flows from West Lakes (currently approximately 600 ML/day).
• The levels adopted for the Port Waterways WQIP in Table 2.2 for total N, NOx nitrogen, NH4, total P and filterable reactive P are based on a consideration of the lower values of southeastern and southwestern Australia (ANZECC 2000), and the background levels for Gulf St Vincent obtained from sampling and analysis as part of the development of the DSS (Section 4 and Appendix F). These are lower than the concentrations of total N and P provided as default trigger values for the south central region in ANZECC (2000) (provided by the EPA but were based on limited data). The default values in the WQ Policy are also too high. The WQ Policy recognises that changes to the default values will be required in time and provides for these changes to be made with appropriate consultation.
• Chlorophyll a is used as an indicator of ecosystem response and a measure of primary productivity. While it relates directly to algal growth, a principal water quality issue, the DSS currently does not account for Ulva or other macroalgae biomass. As the DSS continues to be refined this relationship will be addressed.
In ANZECC (2000) and the WQ Policy no distinction is made between seasons in the adoption of trigger values or criteria in defining WQOs. However, there are significant seasonal factors/differences, notably the potential for algal growth/blooms in the spring–summer period if an abundant nutrient supply is available. As indicated in Section 2.6, the water quality modelling covered a winter period. The concentrations indicated in Table 2.2 are low compared to those recorded by the EPA (2002) as shown in Table 2.3. Adopting these concentrations will ensure reduced algal growth potential, as indicated by low chlorophyll a levels.
26
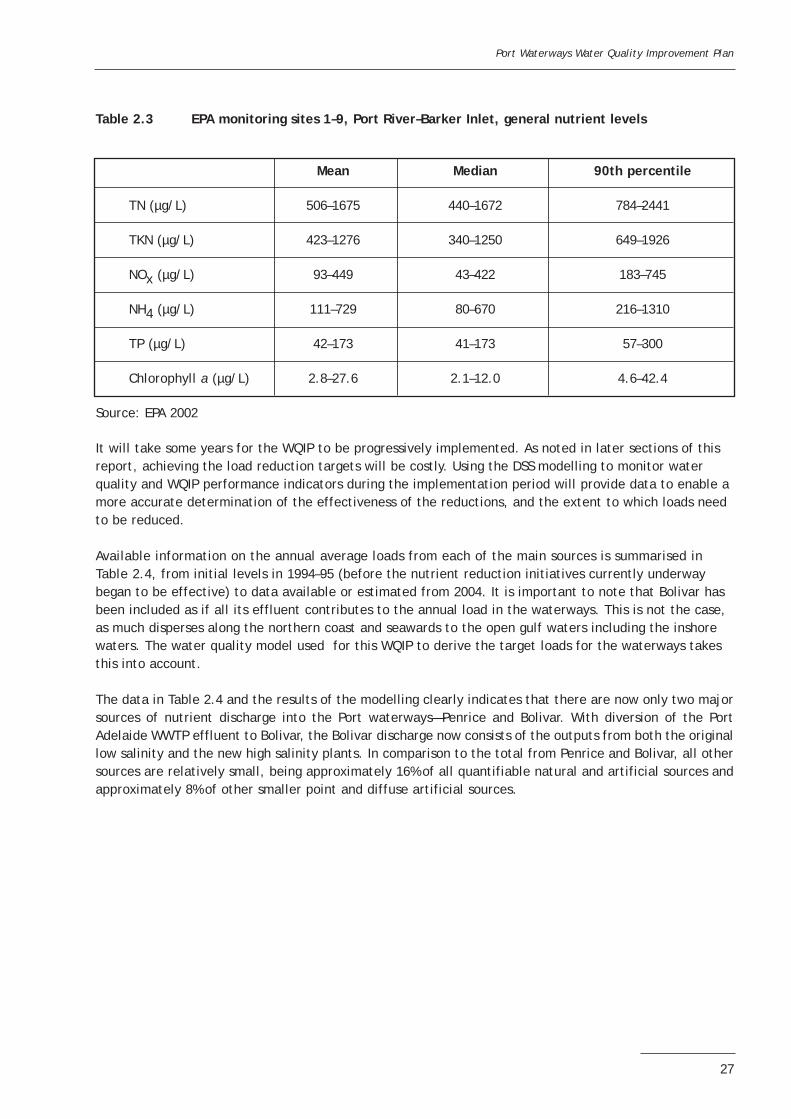
Port Waterways Water Quality Improvement Plan
Table 2.3 EPA monitoring sites 1–9, Port River–Barker Inlet, general nutrient levels
Mean Median 90th percentile
TN (µg/L) 506–1675 440–1672 784–2441
TKN (µg/L) 423–1276 340–1250 649–1926
NOx (µg/L) 93–449 43–422 183–745
NH4 (µg/L) 111–729 80–670 216–1310
TP (µg/L) 42–173 41–173 57–300
Chlorophyll a (µg/L) 2.8–27.6 2.1–12.0 4.6–42.4
Source: EPA 2002
It will take some years for the WQIP to be progressively implemented. As noted in later sections of this report, achieving the load reduction targets will be costly. Using the DSS modelling to monitor water quality and WQIP performance indicators during the implementation period will provide data to enable a more accurate determination of the effectiveness of the reductions, and the extent to which loads need to be reduced.
Available information on the annual average loads from each of the main sources is summarised in Table 2.4, from initial levels in 1994–95 (before the nutrient reduction initiatives currently underway began to be effective) to data available or estimated from 2004. It is important to note that Bolivar has been included as if all its effluent contributes to the annual load in the waterways. This is not the case, as much disperses along the northern coast and seawards to the open gulf waters including the inshore waters. The water quality model used for this WQIP to derive the target loads for the waterways takes this into account.
The data in Table 2.4 and the results of the modelling clearly indicates that there are now only two major sources of nutrient discharge into the Port waterways—Penrice and Bolivar. With diversion of the Port Adelaide WWTP effluent to Bolivar, the Bolivar discharge now consists of the outputs from both the original low salinity and the new high salinity plants. In comparison to the total from Penrice and Bolivar, all other sources are relatively small, being approximately 16% of all quantifiable natural and artificial sources and approximately 8% of other smaller point and diffuse artificial sources.
27
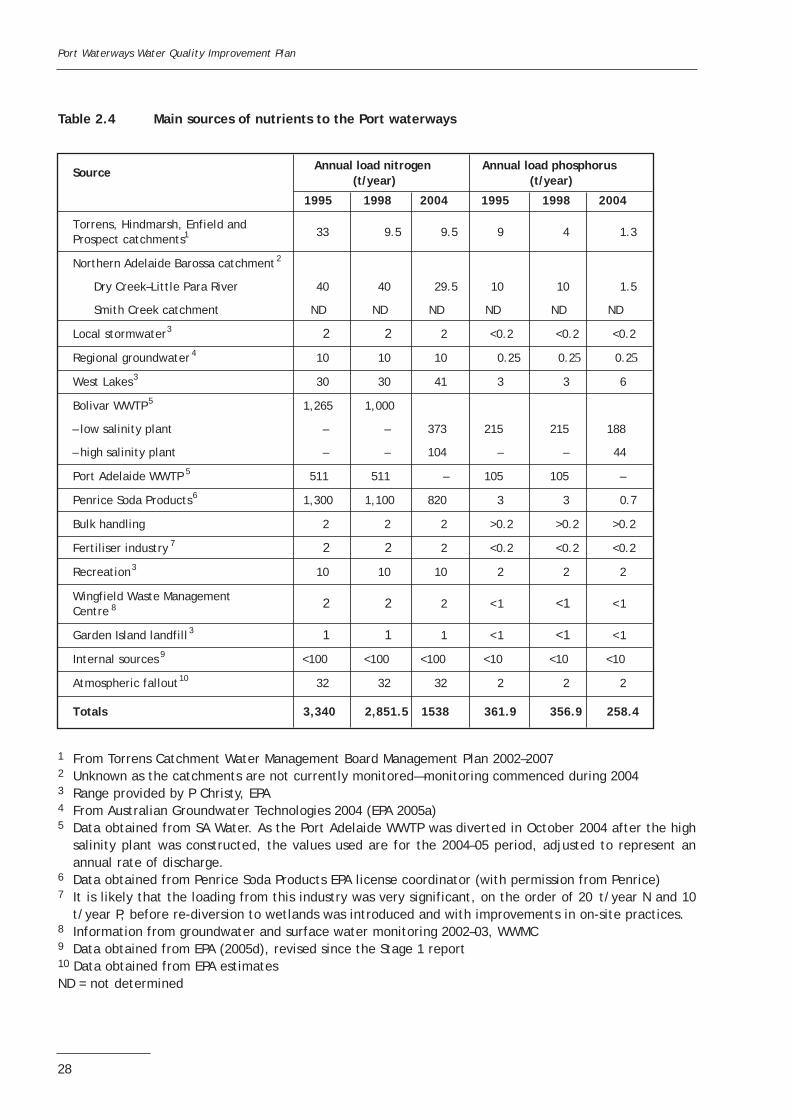
Port Waterways Water Quality Improvement Plan
Table 2.4 Main sources of nutrients to the Port waterways
Source Annual load nitrogen (t/year)
Annual load phosphorus (t/year)
1995 1998 2004 1995 1998 2004
Torrens, Hindmarsh, Enfield and Prospect catchments1 33 9.5 9.5 9 4 1.3
Northern Adelaide Barossa catchment2
Dry Creek–Little Para River 40 40 29.5 10 10 1.5
Smith Creek catchment ND ND ND ND ND ND
Local stormwater3 2 2 2 <0.2 <0.2 <0.2
Regional groundwater 4 10 10 10 0.25 0.25 0.25
West Lakes3 30 30 41 3 3 6
Bolivar WWTP5 1,265 1,000
– low salinity plant – – 373 215 215 188
– high salinity plant – – 104 – – 44
Port Adelaide WWTP 5 511 511 – 105 105 –
Penrice Soda Products6 1,300 1,100 820 3 3 0.7
Bulk handling 2 2 2 >0.2 >0.2 >0.2
Fertiliser industry 7 2 2 2 <0.2 <0.2 <0.2
Recreation3 10 10 10 2 2 2
8 Wingfield Waste Management Centre
2 2 2 <1 <1 <1
Garden Island landfill3 1 1 1 <1 <1 <1
Internal sources 9 <100 <100 <100 <10 <10 <10
Atmospheric fallout10 32 32 32 2 2 2
Totals 3,340 2,851.5 1538 361.9 356.9 258.4
1 From Torrens Catchment Water Management Board Management Plan 2002–2007 2 Unknown as the catchments are not currently monitored—monitoring commenced during 2004 3 Range provided by P Christy, EPA 4 From Australian Groundwater Technologies 2004 (EPA 2005a) 5 Data obtained from SA Water. As the Port Adelaide WWTP was diverted in October 2004 after the high
salinity plant was constructed, the values used are for the 2004–05 period, adjusted to represent an annual rate of discharge.
6 Data obtained from Penrice Soda Products EPA license coordinator (with permission from Penrice) 7 It is likely that the loading from this industry was very significant, on the order of 20 t/year N and 10
t/year P, before re-diversion to wetlands was introduced and with improvements in on-site practices. 8 Information from groundwater and surface water monitoring 2002–03, WWMC 9 Data obtained from EPA (2005d), revised since the Stage 1 report 10 Data obtained from EPA estimates ND = not determined
28
Port Waterways Water Quality Improvement Plan
2.5 Existing programs resulting in nitrogen and phosphorus load reduction improvements to date
In the past, industrial and urban development occurred with little understanding of water pollution or ecological issues. However, in recent years a number of significant management initiatives have been taken which have already reduced the nutrient loads discharged to the waterways. Further reductions will occur as programs continue to be implemented, including:
• environment improvement programs (EIPs) for industry
• EIPs for SA Water WWTPs and the Virginia Horticultural Area Reuse Scheme
• natural resource management plans
• EPA licensing to control discharges, and environmental management plans (EMPs) for major activities such as port activities and landfills
• planning, including improved standards for new development and upgrading of existing activities
• reuse of stormwater leading to a diversion of pollutants away from the marine environment.
Large industries that would likely have had a major impact on the pollutant loading in the Port waterways, but have closed down or relocated, include:
• Port Adelaide Wastewater Treatment Plant
• CSR (sugar works)
• sulphuric acid works
• Adelaide Wallaroo, Adelaide Chemical Works and Cresco Fertiliser companies
• Walter Morris timber works
• EWS foundry
• ICI chlorine plant.
There are major new residential and industrial developments on the Lefevre Peninsula and proposals are being prepared for industrial development in the Gillman area. Additional development need not result in increased pollutant loads, and with new standards for development, for example stormwater treatment, there could even be a reduction in existing pollutant loads.
As indicated in Table 2.4, from 1995 to 2004 there have been reductions of approximately 52% in total N and 31% in total P from known sources (ie point and diffuse catchment sources) into the Port waterways. This does not account for reductions from other industries that have either closed or relocated. The majority of these reductions occurred between 1998 and 2004, from approximately 3,035 t/year N in 1998 to 1,648 t/year in 2004, and from 346 t/year P in 1998 to 249 t/year in 2004. Although there have also been reductions from the minor sources, particularly in stormwater runoff, the changes have largely been due to:
• the removal of the Port Adelaide WWTP effluent, which discharged approximately 511 t/year N (mostly as ammonia) and 105 t/year P from the Port River, and its relocation to Bolivar
• a reduction in the N load discharged from Bolivar, even with the diverted Port Adelaide WWTP effluent, from 1,265 t/year in 1995 to 1180 t/year in 1998 and less than 500 t/year in 2004–05. This is as a result of improved treatment, with reduced concentrations in discharge water (from 35 mg/L to 5 mg/L) and the reuse of reclaimed water for irrigation in the Virginia area
• a small increase in the load of P discharged from Bolivar from 215 t/year in 1998 to 232 t/year in 2004–05
• a reduction in the load of N (as ammonia) discharged from Penrice from approximately 1,300 t/year in 1995 to 1,100 t/year in 1998 and 820 t/year in 2004.
29
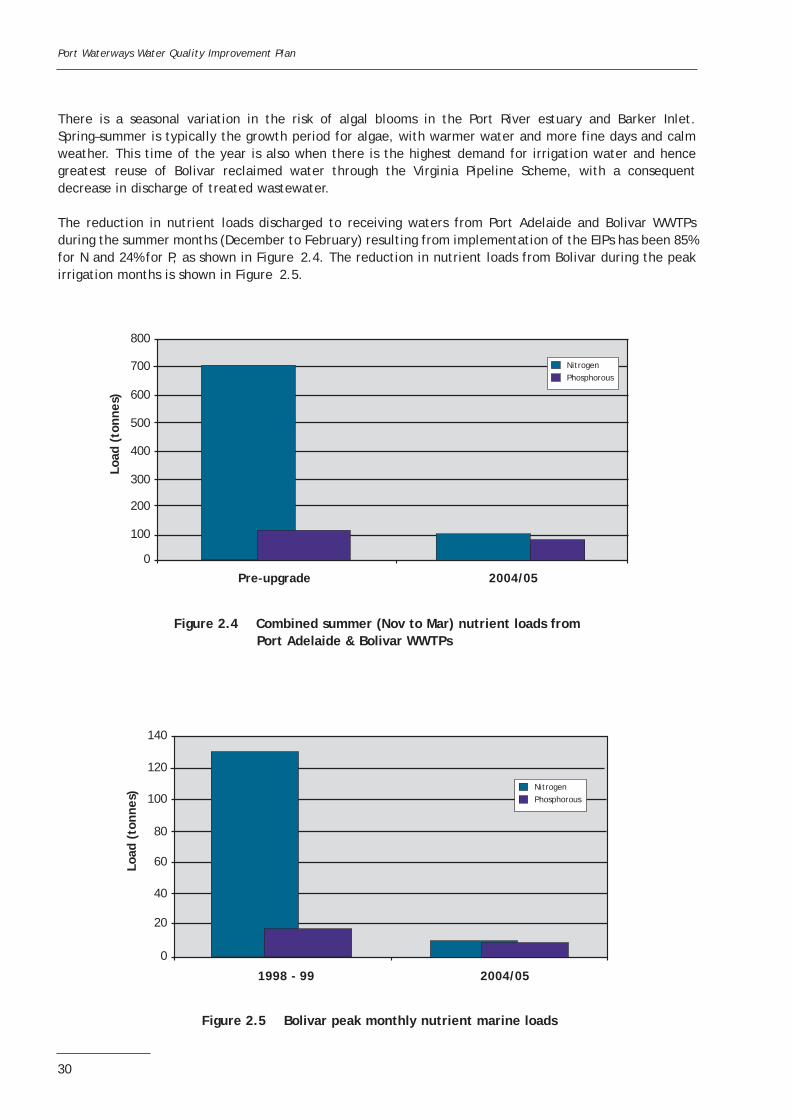
Port Waterways Water Quality Improvement Plan
There is a seasonal variation in the risk of algal blooms in the Port River estuary and Barker Inlet. Spring–summer is typically the growth period for algae, with warmer water and more fine days and calm weather. This time of the year is also when there is the highest demand for irrigation water and hence greatest reuse of Bolivar reclaimed water through the Virginia Pipeline Scheme, with a consequent decrease in discharge of treated wastewater.
The reduction in nutrient loads discharged to receiving waters from Port Adelaide and Bolivar WWTPs during the summer months (December to February) resulting from implementation of the EIPs has been 85% for N and 24% for P, as shown in Figure 2.4. The reduction in nutrient loads from Bolivar during the peak irrigation months is shown in Figure 2.5.
800
700
600
500
400
300
200
100
0
Load
(to
nnes
)
Nitrogen Phosphorous
Pre-upgrade 2004/05
Figure 2.4 Combined summer (Nov to Mar) nutrient loads from Port Adelaide & Bolivar WWTPs
140
120
100
80
60
40
20
0
Load
(to
nnes
) Nitrogen Phosphorous
1998 - 99 2004/05
Figure 2.5 Bolivar peak monthly nutrient marine loads
30
Port Waterways Water Quality Improvement Plan
As a result of other programs, notably the work of catchment water management boards and local government (Port Adelaide–Enfield and City of Salisbury), reductions have also occurred in nutrients in stormwater. Monitoring of the Barker Inlet, Magazine Creek and Range wetlands indicates they are achieving design objectives, removing approximately 80% of nutrients, with an overall reduction from 33 t/year to approximately 7 t/year. Other artificial wetland systems, particularly those constructed by the City of Salisbury (eg the Greenfields wetlands), are also likely to be removing substantial quantities from stormwater runoff. Overall, it is likely that in the Little Para and Dry Creek catchments significant improvements are being made as a result of the activities of the A&MLR NRM Board and local government.
While the contribution of nutrients from rivers and stormwater discharges is small compared to the major point sources, rivers and stormwater discharges are important because of the range of other pollutants that occur, including:
• heavy metals
• faecal micro-organisms
• oils and grease
• suspended solids/turbidity and coloured dissolved organic carbon
• organic carbon (potential oxygen depletion).
While these pollutants may also potentially affect EVs they are not addressed further in this WQIP because: • minor, local effects attributable to most of them are being presently overwhelmed by the
disproportionately large effect of nutrients.
• they are being dealt with at their individual sources.
• reductions in discharge loads for nutrients will also result in decreased loads of these to the waterway.
With regard to the relative contribution from point sources compared to stormwater and catchment sources, it is also important to note that the major point sources discharge all year, whereas stormwater is seasonal. While the pulsed nature of these inputs can have important consequences on an already impacted ecosystem, this effect will be localised around the outfall points. Also, most nutrients in stormwater (typically 60–80%) are associated with particulate matter and only a small fraction is immediately bioavailable. In the point sources the bulk of the nutrient discharge is bioavailable, typically 90% of the WWTP effluent and 100% of the Penrice discharge (ammonia).
A detailed discussion of the above load nutrient reductions between 1998 and 2004 in the three Port waterways segments is given in Appendix F.
2.6 Nutrient load reduction required to achieve the water quality objectives
The EPA has used a three-dimensional hydrodynamic model coupled to a computer-based nutrient model to develop load reduction information for the Port waterways. Reference to the description of the model is given in Appendix F, together with a summary of its output.
The hydrodynamic model determines water movements and dispersion using tidal information, wind data, and discharge data from power stations, industrial effluent streams and watercourses. The nutrient model uses nutrient concentrations of the various discharges into the Port waterways, both industrial and stormwater, and water quality data from Gulf St Vincent.
The nutrient model simulates the concentrations of N and P based on the dispersion, vertical mixing and residence time within the various parts of the waterways. It also calculates the losses and transformations of the nutrients that occur through biological, chemical and physical processes such as oxidation of ammonia, nitrification, uptake of nutrients by algae, and losses to the sediments. Comparing calculated nutrient concentrations or chlorophyll production with measured values validates the nutrient model.
31
Port Waterways Water Quality Improvement Plan
Because the greatest contribution of nutrients to the waterways is presently from two major point sources, these will be the major focus of the WQIP. Other discharges to the waterways have localised effects; however, as the major sources of nutrients to the waterways reduce their effects, these minor sources will become more apparent. Therefore, the existing initiatives described in Section 2.5 need to be ongoing.
2.6.1 Nutrient loads and water quality objectives
As indicated above, modelling has been used to examine a range of scenarios involving progressive reductions in the loads discharged from both Penrice and the Bolivar high and low salinity plants. The outcome of the analysis indicates that:
• Although there is a combined effect on the waterways from both Penrice and Bolivar, together with the other minor sources, the separate impacts of the major sources have to be considered as well. This is due to:
– the geographical location of the discharges, with Penrice having a greater impact in the southern, and Bolivar in the northern, area of the waterways
– the potential toxicity on biota from the large quantities of ammonia discharged by Penrice.
• To achieve the chlorophyll a WQO value of 1 µg/L in the Central Barker Inlet segment, the Penrice discharge needs to be reduced to approximately 200 t/year N. Even at this annual load, it is accepted that areas of the Port River and Angas Inlet will have elevated ammonia levels at times.
• To achieve the WQOs for nutrients and chlorophyll a (Table 2.2), even with Penrice reduced to 200 t/year N, total loads discharged from Bolivar need to be much lower than at present. In addition to the 1998 and 2004 situations, a large number of discharge scenarios have been examined involving progressive load reductions. Those which collectively identify the required degree of nutrient reduction are:
– Bolivar discharging at 2004 levels, but with Penrice reduced to 200 t/year
– Penrice discharging 200 t/year N, but with the Bolivar high salinity plant discharging at 2004 levels and the low salinity plant at 25% of 2004 levels
– Penrice discharging 200 t/year N, but with the Bolivar high salinity plant discharging at 2004 levels and the low salinity plant with a zero discharge.
• Nitrogen is usually regarded as the most significant nutrient in estuarine waters. However, the output from the DSS modelling has indicated that P loads also need to be reduced in order to reduce algal growth potential as indicated by chlorophyll a concentrations. There are only a few locations in the world in the marine–estuarine environment where nitrogen is not limiting, In this instance it is because of the large Penrice Source of nitrogen. The model demonstrates that under particular tide and wind-driven currents, effluent from Bolivar spreads southwards through the Central Barker Inlet segment and North Arm, with a smaller measurable effect on the Port River. There is also an extended retention time, with the introduced materials having a half-life of at least nine days. Even with Penrice reduced to 200 t/year, abundant N remains for plant growth; and even with additional reductions in the N discharge from Bolivar, it is not until P (the limiting nutrient) is also reduced that chlorophyll a concentrations significantly reduce. It is intended that this issue be further investigated and confirmed, which will occur as the DSS is further refined.
The effect of the target load reductions on chlorophyll a levels is shown in Figure 2.6, which compares the levels in 1998 (prior to major reductions), 2004 (the current situation) and the future condition when targets have been achieved. Similarly, a comparison is made for total N and ammonia in Figures 2.7 and 2.8 respectively.
2.6.2 Target load reductions and environmental values
In Table 2.1 WQIP performance indicators were defined. These are briefly discussed below in relation to protection or enhancement of the EVs following nutrient reductions.
32
Port Waterways Water Quality Improvement Plan
a) Algal growth
Toxic algal blooms
Occasional algal blooms were probably a natural part of the ecosystem of the waterways prior to European settlement. Currently, their minimisation in the Port waterways is an objective of the WQIP. Blooms also occur occasionally in West Lakes.
A reduction in nutrient supply is likely to produce a reduction in the frequency, extent and duration of blooms in the waterways when they do occur.
Ulva and other macroalgal growth
Similarly, with reduction of the nutrient supply, macroalgal growth potential is reduced, as indicated by the low chlorophyll a concentrations anticipated. The model outputs for the winter (Figures 2.9 and 2.10 —for Swan Alley and North Arm respectively) indicate an approximate 60% reduction in chlorophyll a, which may also be expected in Barker Inlet. Further north, offshore of Bolivar in the Northern segment, small changes in chlorophyll a are predicted in the modelling. However, the large volume exchange with gulf waters usually prevents the development of a large phytoplankton population in this area. The biomass and chlorophyll content in epiphytes on seagrass or macroalgae are not included in the calculations. This aspect is being addressed in the current ACWS.
Ulva and other macroalgal growth are relatively low during the winter months, increasing in spring and continuing throughout summer if nutrients are available. The diversion of effluent from Bolivar WWTP to reuse over summer reduces the availability of nutrients for growth. The annual pattern of effluent reuse can be inferred from Figure F29 (Appendix F), which shows the annual pattern of nutrient discharge. The marked reduction of discharge from November to March is a result of the effluent reuse.
However, macroalgal growth appears to increase from late winter, much earlier than the beginning of the irrigation season. This leaves a period of three months or more where significant amounts of nutrients are available for the growth of macroalgae. It is inferred that the overall impact on ecosystems and amenity/recreation will reduce further if minimal or no discharge can be achieved during this August–October period. Further modelling of this scenario will be required to confirm the likely effectiveness of this option.
Introduced species
The nutrient-rich environment is conducive to the spread of species such as Caulerpa taxifolia, providing them with a competitive advantage. While nutrient reduction and the achievement of the WQOs will not prevent their introduction and spread, reduced nutrient availability may reduce the rate of spread, improving the opportunity for containment and control.
Odours
As a direct result of the reduction in algal growth, there should be a corresponding reduction in the quantity of algal debris, a direct cause of odour.
Amenity
Amenity value is reduced by odours, extensive algal growth on intertidal flats, floating algal mats, algae within mangroves covering seedlings and pneumatophores, etc. The reduction in the extent of algal growth will improve the overall appearance of the area as well as reduce the ecological impacts.
33
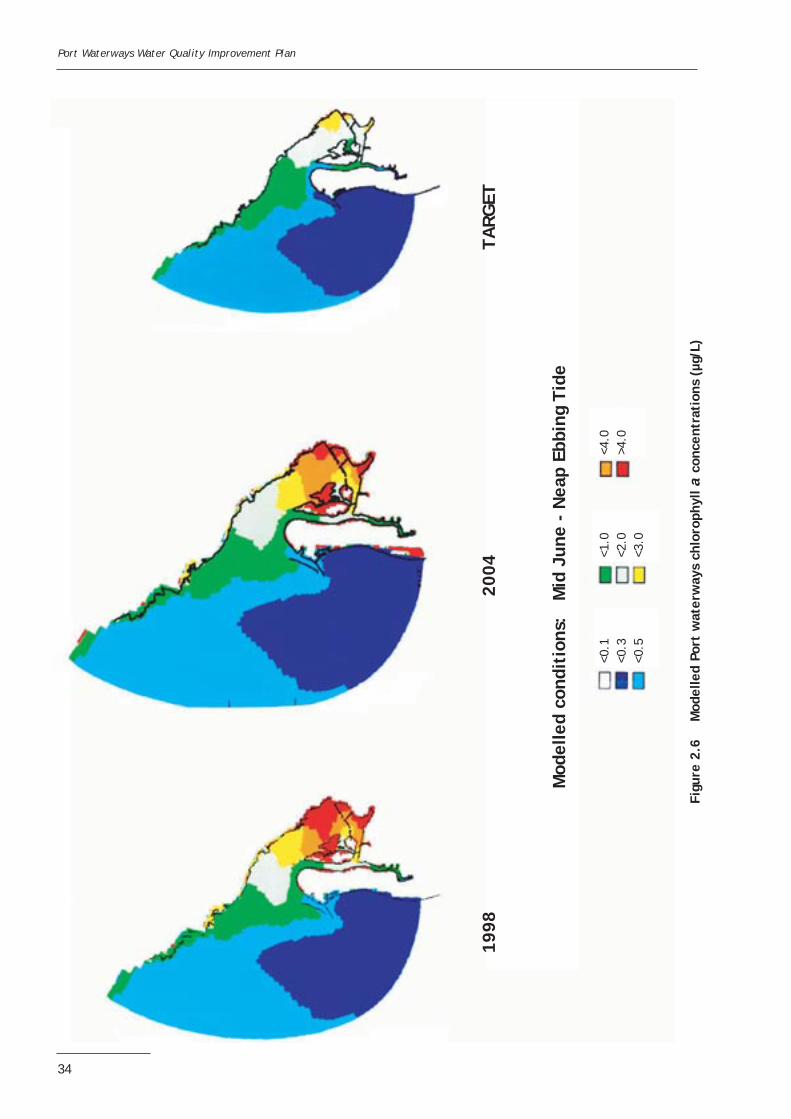
Port Waterways Water Quality Improvement Plan
1998
20
04
TARG
ET
Mod
elle
d co
ndit
ions
: M
id J
une
- N
eap
Ebbi
ng T
ide
<0.1
<1.0
<4.0
<0.3
<2.0
>4.0
<0
.5
<3.0
Figu
re 2
.6
Mod
elle
d Po
rt w
ater
way
s ch
loro
phyl
l a
conc
entr
atio
ns (
µg/L
)
34
Port Waterways Water Quality Improvement Plan
1998
20
04
TARG
ET
Mod
elle
d co
ndit
ions
: M
id J
une
- N
eap
Ebbi
ng T
ide
<0.1
8 <0
.30
<1.0
<3.0
0 <0
.20
<0.5
0<1
.50
<0.2
5 <0
.80
<3.0
0
Figu
re 2
.7
Mod
elle
d Po
rt w
ater
way
s to
tal
nitr
ogen
con
cent
rati
ons
(mg/
L)
35
Port Waterways Water Quality Improvement Plan
36
1998
20
04
TARG
ET
Mod
elle
d co
ndit
ions
: M
id J
une
- N
eap
Ebbi
ng T
ide
<0.0
02<0
.010
<0.0
20
<0.0
35<0
.050
<0.1
00
<0.2
00>0
.200
Figu
re 2
.8
Mod
elle
d Po
rt w
ater
way
s am
mon
ia c
once
ntra
tion
s (m
g/L)
Port Waterways Water Quality Improvement Plan
Chlorophyll - Barker Inlet nr Swan Alley
0.000
1.000
2.000
3.000
4.000
5.000
Chla
(µg/
L) Median
Minimum 80th percentile 90th percentile Maximum
0 100 200 300 400 500 600 700 800 900
Bolivar winter N discharge (annual load equivalent - tonnes)
Figure 2.9 Modelled winter chlorophyll a concentrations adjacent to Swan Alley as nutrients in the Port waterways reduce
Chlorophyll - North Arm (Nth Arm Creek)
0.000
1.000
2.000
3.000
4.000
5.000
Chla
(µg/
L) Median
Minimum 80th percentile 90th percentile Maximum
0 100 200 300 400 500 600 700 800 900
Bolivar winter N discharge (annual load equivalent - tonnes)
Figure 2.10 Modelled winter chlorophyll a concentrations at the North Arm as nutrients in the Port waterways reduce
37
Port Waterways Water Quality Improvement Plan
b) Ammonia toxicity
Although large quantities of ammonia have been discharged for many years, there is no data to document any direct toxic effects, distinguishing it from all the other impacts. Toxic impacts are likely, however, particularly on juveniles of the biota. The populations of some species in some areas may be maintained because of continuous recruitment from elsewhere. The fact that people can catch fish in the Port River and Angas Inlet, for example, does not in itself indicate that the area is healthy and there is no impact.
The target discharge of 200 t/year from Penrice is a compromise, and it is accepted that near the point of discharge concentrations will almost always be higher than the WQO value. However, the levels will be lower in the more ecologically sensitive areas, avoiding as much as possible lethal and sublethal toxic effects. This is consistent with the agreed EVs for this segment.
c) Minor sources
Smaller sources such as the stormwater outlets and creeks.
As mentioned previously, minor nutrient sources such as stormwater are important because of the range of other pollutants they carry, for example heavy metals, oils and pathogens. For this reason strategies are required to reduce their impacts, which will also result in nutrient reduction and minimisation of potential localised effects.
2.6.3 Adelaide Coastal Waters Study (ACWS)
The Adelaide Coastal Waters Study has developed the understanding and tools required to enable sustainable management of Adelaide’s coastal waters. It has done this by identifying the causes of ecosystem modification and the actions required to halt and reverse degradation. The study focused on seagrass loss, seabed instability and water quality degradation.
The work has shown that nutrient discharges from the Port waterways have significantly increased as the metropolitan area of Adelaide has grown. The key nutrient discharges to the metropolitan coast are now Penrice Soda Products and the wastewater treatment plants at Bolivar, Glenelg and Christies Beach. Physical processes along the metropolitan coast retain these discharges and other terrigenous loads of suspended solids in the near-shore, which is the area of the most significant seagrass loss.
The nitrogen reduction targets that have been identified for Penrice and Bolivar in this WQIP are consistent with those that have resulted from the separate work of the Adelaide Coastal Waters Study, which recommended a nitrogen reduction of 75% from 2003 levels—122 tonnes compared with 104 tonnes per year derived from the Port Waterways model.
2.7 Load reduction targets/load allocations
To achieve the key WQO values of 50 µg/L of ammonia and 1 µg/L of chlorophyll a (Table 2.2) across most of the waterways, particularly within the ecologically sensitive areas, it has been determined that the load of ammonia discharged by Penrice should be reduced to low levels. The modelling has indicated that this may need to be about 200 t/year. For Bolivar the targets could be achieved if there were no discharge from the low salinity plant and the discharge from the high salinity plant did not change from the current level, approximately 104 t/year N and 44 t/year P. Collectively, all other sources are relatively minor when compared to the combined load from Penrice and Bolivar. The load allocations for all sources are presented in Table 2.5. Comments are as follows:
• No further changes are assumed for the Torrens catchment area because of the known adequate efficiency of the established Gillman wetlands, which receive the majority of the stormwater runoff.
38
Port Waterways Water Quality Improvement Plan
• Even though the actions of local government and the A&MLR NRM Board are likely to result in significant improvements, only a small conservative 10% change is assumed for the Dry Creek, Little Para and Smith Creek catchments.
• No change is assumed for West Lakes, although water quality in the lake will improve as a result of the activities of local government and the A&MLR NRM Board. The through-flow of marine water is a dominant factor, and waters may be affected by other coastal discharges near the intake for the lake. This is likely to change as EIPs are implemented for these discharges, for example the Glenelg WWTP discharge.
• For other sources, including bulk handling, the fertiliser industry and recreation (boats in particular), small improvements are assumed as a result of the continuing implementation of EIPs, codes of practice and community education.
• Local stormwater input on Lefevre Peninsula, although only a minor source, could be significantly improved as redevelopment occurs. It is important to note that this and other sources (industry and catchment), while small for nutrients, are significant for a wide range of other pollutants, for example heavy metals, faecal bacteria and oils.
• As indicated previously, because the effect of the two major nutrient sources—Penrice Soda Products and Bolivar WWTP—extends outside the Port waterways, the findings of the ACWS may result in changes to load targets nominated in the WQIP.
Overall, the total reductions in nutrient loads would be approximately:
• between 1995 and 2004
– 51.5% N and 17% N.
• since 1995, with the load allocations as specified in Table 2.5
– 81.5% N and 69% P.
2.8 Margin of safety
Estimates derived from models are subject to some uncertainty. In developing the WQIP, assumptions have been made to ensure that the estimates derived from the water quality model are likely to err on the side of caution, rather than aim for loads that may be too high to achieve the environmental benefits nominated by the community.
Calibration of the water quality model with the prevailing conditions in the Port waterways, together with independent consideration of the model (Appendix F), provide confidence that achieving the currently modelled target loads will result in the required improvement in water quality. However, the required reductions will be technically challenging and will represent an additional cost to industry and the community. It is therefore important that an adaptive management approach is used to guide the implementation of the WQIP, rather than rigidly adhering to the reduction targets provided in this document. As the system is monitored and the water quality model is further developed, these targets will be reviewed and may be changed as a result of this process.
The approach of the WQIP to include a margin of safety has not been to develop a numerical addition to the modelled discharge targets, but rather to take into consideration the seasonality of discharges and the assumptions used to develop the water quality model. The modelled target loads therefore account for a margin of safety for the following reasons:
• The model has been based on winter conditions, when discharges from the major sources are presently greatest.
• The analysis of nutrient parameters under varying load scenarios was based on 90th percentile values rather than median values. If median values had been used, the modelled target loads would have resulted in the required water quality criteria (ie chlorophyll a, N, P) being exceeded on a regular basis —about 50% of the time. Using the 90th percentile values aims for a slightly lower discharge level where criteria are exceeded only about 10% of the time.
39
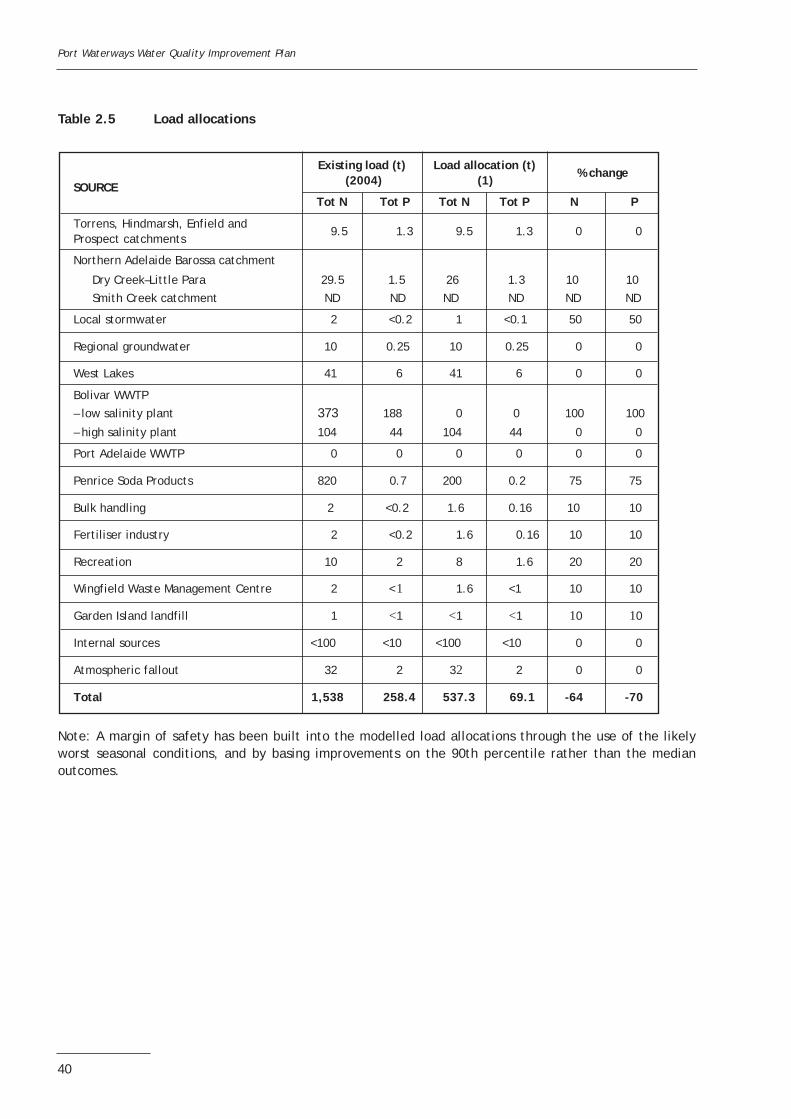
Port Waterways Water Quality Improvement Plan
Table 2.5 Load allocations
SOURCE
Existing load (t) (2004)
Load allocation (t) (1)
% change
Tot N Tot P Tot N Tot P N P
Torrens, Hindmarsh, Enfield and Prospect catchments
9.5 1.3 9.5 1.3 0 0
Northern Adelaide Barossa catchment
Dry Creek–Little Para 29.5 1.5 26 1.3 10 10
Smith Creek catchment ND ND ND ND ND ND
Local stormwater 2 <0.2 1 <0.1 50 50
Regional groundwater 10 0.25 10 0.25 0 0
West Lakes 41 6 41 6 0 0
Bolivar WWTP
– low salinity plant 373 188 0 0 100 100
– high salinity plant 104 44 104 44 0 0
Port Adelaide WWTP 0 0 0 0 0 0
Penrice Soda Products 820 0.7 200 0.2 75 75
Bulk handling 2 <0.2 1.6 0.16 10 10
Fertiliser industry 2 <0.2 1.6 0.16 10 10
Recreation 10 2 8 1.6 20 20
Wingfield Waste Management Centre 2 < 1 1.6 <1 10 10
Garden Island landfill 1 <1 <1 <1 10 10
Internal sources <100 <10 <100 <10 0 0
Atmospheric fallout 32 2 32 2 0 0
Total 1,538 258.4 537.3 69.1 -64 -70
Note: A margin of safety has been built into the modelled load allocations through the use of the likely worst seasonal conditions, and by basing improvements on the 90th percentile rather than the median outcomes.
40
Port Waterways Water Quality Improvement Plan
3 IMPLEMENTATION AND RESEARCH—MANAGEMENT MEASURES AND CONTROL ACTIONS
3.1 Current nutrient load reduction programs and actions
The Port waterways were degraded over time through a lack of understanding and many isolated management decisions. The improvement of the waterways will also take time, through management of the WQIP by a range of different groups working together through the steering committee. The groups include representatives from the two major point sources of nutrients to the waterways, and they are all committed to ensuring that the environmental values (EVs) for the waterways are achieved.
The following section describes the current activities being undertaken by those that discharge, or manage discharges, to the waterways. It also describes some of their considerable efforts to date to improve the waterways. The WQIP will build on these efforts, allow coordination of them, and provide initial modelled nutrient targets for the waterways.
The nutrient load allocations were included in Table 2.5 and discussed in Section 2.6. The bulk of future nutrient reduction will come from improvements in the SA Water Bolivar WWTP and Penrice discharges. A wide range of activities, including those of the EPA, Adelaide Dolphin Sanctuary, local councils and catchment water management boards, will bring about reductions in other smaller sources. All these activities are outlined in the following sections and summarised in Table 3.1.
3.1.1 SA Water
(a) Background
Historically, Metropolitan Adelaide has been served by four large wastewater treatment plants (WWTPs). The Bolivar WWTP has discharged treated wastewater into coastal waters at St Kilda at the northern end of the Barker Inlet since it was commissioned in 1964. The Port Adelaide WWTP began operations in 1931 and discharged treated wastewater into the head of the Port River until 2004 and sludge into Gulf St Vincent until 1993. Both plants have been expanded or modified at various times over the years.
The introduction of the Environment Protection Act and the Marine Environment Protection Act 1990 reflected increasing community concerns about environmental issues. This legislation gave EPA the power to regulate environmental discharges through environmental authorisations, and introduce improvements to environmental performance through Environment Improvement Programs (EIPs).
In November 1995 the EPA endorsed EIPs for each of the four major WWTPs in the Adelaide metropolitan area. The objectives of the EIPs were to reduce impacts on the Port River and the marine environment. The focus was on reduction of the amount of nitrogen (N) being discharged, this being the nutrient considered at that time to be of most concern in marine waters.
The contents of the EIPs have evolved over time as a result of consultations with the community and discussions with the EPA. In 1997 the EPA approved a revised EIP for the Bolivar WWTP to support development of the Virginia Pipeline Scheme (VPS) by providing high-quality treated wastewater for agricultural irrigation. This EIP included the construction of a filtration plant to enable recycling of treated wastewater. The Bolivar WWTP was also to be upgraded by replacing the biological filters with an activated sludge process (including enhanced N reduction) and odour control facilities. In 1998 the EIP for the Port Adelaide WWTP was revised to include relocation of the plant to Bolivar, with discharges of treated wastewater into the Port River to cease.
41
Port Waterways Water Quality Improvement Plan
The EIP of SA Water’s $260 m Metropolitan Adelaide WWTP was one of the largest capital works projects in the State and represents a significant investment in the environment by the state government for the future benefit of all South Australians. Through this project a total of $206 m has been spent since 2000, six years in eliminating treated wastewater discharges into the Port River, reducing the load of N discharged to coastal waters from the St Kilda outfall and developing one of the largest and most successful water reuse schemes in Australia.
The Bolivar site now contains two separate WWTPs. The 165-ML/day capacity Bolivar WWTP serves the northern part of the Adelaide metropolitan area from the River Torrens north to Gawler. The current plant was upgraded to enhance N removal at a cost of $72 m and was commissioned in 2002. The 32-ML/day Bolivar high salinity WWTP was commissioned in November 2004 and has replaced the Port Adelaide WWTP. The cost of the project was $98 m and included a new pumping station and a 17-km pipeline to transfer wastewater from the Port Adelaide plant to the Bolivar high salinity plant.
The larger Bolivar plant discharges treated wastewater in excess of that reused to Gulf St Vincent through a series of six lagoons and a 13km northerly outfall channel into mangroves near St Kilda. Between them, the two plants at the Bolivar site annually process about 65% of Adelaide’s wastewater, an average of about 169 ML of sewage daily.
Wastewater for reuse is extracted from the lagoons and undergoes further treatment at the St Kilda dissolved air flotation filtration (DAFF) plant, which produces good quality (Class A) treated wastewater suitable for non-potable domestic and agricultural reuse. The plant was built at a cost of $30 m and commissioned in 1999. SA Water contributed an additional $6 m to the cost of the pipeline system to ensure its commercial viability.
Most of the recycled water from the DAFF plant is used for the irrigation of horticultural crops in the Virginia area of the northern Adelaide Plains. A private company, Water Reticulation Services Virginia (WRSV), markets the water and maintains and operates the VPS infrastructure, which comprises a pumping station and pipelines to distribute the water to the market gardens.
In 2004–05, 28% of the treated wastewater produced by the Bolivar plant was reused. During the summer months (December to February) 42% was reused during the peak irrigation demand. Reuse of Bolivar treated wastewater has substantially reduced the quantities of nutrients (both N and phosphorus (P)) discharged to the sea.
The Bolivar high salinity plant treats highly saline wastewater (about 6,000 mg/L TDS). The increased salinity is due to infiltration of relatively small amounts of highly saline groundwater into the sewer network and it is considered impractical to reduce salinity to the low levels suitable for reuse. After treatment to a standard comparable to that of the main Bolivar plant this water is discharged into the St Kilda outfall channel downstream of both the lagoons and the DAFF plant off-take.
However, about 25% of the old Port Adelaide WWTP flow came from low salinity catchments. The low salinity wastewater from the Queensbury subcatchment near Port Adelaide has now been diverted into the Bolivar WWTP and has become available for reuse.
Discharges of treated wastewater directly into the Port River ceased in 2004, and no further nutrients will be discharged directly into the Port River from an SA Water WWTP.
(b) SA Water involvement with other government initiatives
In recognition of the importance of water to the state’s economy, the environment and almost every aspect of our daily lives, the South Australian Government has instituted the Water Proofing Adelaide project.
42
Port Waterways Water Quality Improvement Plan
The aim of the project is to develop a long-term strategy for the effective management and sustainable use of all the major water resources available to Adelaide and the surrounding semirural areas until 2025.
The future prosperity of South Australia depends on a secure water supply—its limits are a fundamental constraint that must be managed. A reliable supply of good quality water underpins sustainable industrial, agricultural, mining and urban development.
The project has considered the social, environmental, economic and agricultural uses of water. At the time of the development of the WQIP, it was also identifying and encouraging opportunities to take up innovative water technologies and practices including regulatory, policy and management measures. It was also considering more practical ways of achieving immediate benefits from existing water services and resources through education and technical support for innovative programs.
Increasing the quantities of treated wastewater reused is one of the options identified in the Water Proofing Adelaide project. The final report (WaterCare et al 2005) indicates that the following strategies, among others, will be pursued in the period 2005–25:
• Opportunities for further expansion of the VPS, which substitutes recycled water for groundwater use in some parts of the Northern Adelaide Plains, will be investigated. In 2004–05 approximately 15.4 GL of treated wastewater from Bolivar WWTP was reused by growers connected to the VPS.
• SA Water is further developing the VPS as part of its ongoing commitment for additional reuse. The approved VPS expansion to provide recycled water to growers in the Angle Vale area will be constructed in the near future. The amount of additional reuse will depend on uptake by growers, who are influenced by a range of local, regional and market factors including seasonal variations.
• Reclaimed water from Bolivar WWTP combined with treated stormwater is also being supplied to the Mawson Lakes development, where a dual reticulation scheme has been installed. As more houses are built, recycled water use will gradually expand.
• It will be difficult to achieve the Port Waterways WQIP nutrient load targets by reuse alone, unless all suitable recycled water from the main Bolivar WWTP (about 45 GL/year) can be reused. For this to be achieved, winter flows, when irrigation does not occur, would need to be stored. With the volumes involved, aquifer storage and recovery (ASR) schemes are considered to be the only viable approach.
The extent of reuse from Bolivar WWTP is presently driven by horticultural demand. Horticulture has been established in the adjacent Virginia region for about 50 years and, despite the range of factors that can have an impact on agribusinesses, has been successful over a sustained period on the northern Adelaide Plains. Land in this area and to the north is not a constraint to further growth of irrigated agribusiness, but water is.
Not surprisingly, the present VPS uses much of the reclaimed water that is available in the summer months, but less in spring and autumn and even less in winter. Use of significantly more reclaimed water that could enable up to 100% reuse to occur will be largely driven by the viability of seasonal storage.
The high cost and other disadvantages of surface storage were recognised as major impediments to the project’s vision of zero marine discharge during concept development of the VPS in 1993–94. This drove the state government and others to invest in laboratory and field research of ASR of reclaimed water. At that time ASR had already been successfully applied as a seasonal storage technique for surface water at several sites in South Australia including Scotch College and Clayton. Water authorities in other countries including The Netherlands, France and the United States had been practising ASR for a considerable time. Consequently, the hydrogeology and engineering aspects were well understood and continue to advance. However, research was needed in relation to the quality of the reclaimed water, the effect on the aquifer and the costs involved in ASR.
43
Port Waterways Water Quality Improvement Plan
Over the past decade groundbreaking work has been conducted in reclaimed water ASR trials at Bolivar. Considerable knowledge has been gained in relation to the fate of injected water; geochemical, geobiological and biochemical interactions; pathogen attenuation; the fate of disinfection by-products; clogging processes; and indicative cost estimation. The world-leading nature of some of this work resulted in the selection of Adelaide as the venue of the 4th International Symposium on Artificial Recharge in 2002, and the award in 2001 of a UNESCO prize for water resources innovation to CSIRO Land and Water and the SA Department of Water Resources.
The evidence collected indicates that reclaimed water ASR is technically feasible and there are sufficient target aquifers within a reasonable distance of the site to enable seasonal storage of the presently unused lower salinity water discharged from Bolivar. Further investigation is required, however, into the long-term environmental, social and economic sustainability of ASR at the scale required to enable significant further reduction in marine discharges from the plant.
The Adelaide Coastal Waters Study (ACWS) provided information on the extent to which discharges from stormwater and WWTPs are still affecting the marine environment in Gulf St Vincent. The aim of the study was to develop knowledge and tools to enable sustainable management of Adelaide’s coastal waters by identifying causes of ecosystem changes and the actions required to halt and reverse the degradation. The study commenced in 2004 and was released in February 2008. It focussed on seagrass loss, seafloor instability and water quality degradation.
Information about the study and many of the technical reports have been published, and are available through the EPA webpage <www.epa.sa.gov.au/acws.html>.
Further opportunities for large-scale recycled water projects, including further expansion of existing schemes, will be implemented where they are viable according to an economic, environmental and social impact assessment. If the strategies are implemented a key outcome will be an increase in the reuse of recycled water from current levels to more than 30 GL per annum. However, not all of this increase may be due to reuse from Bolivar and it may not be achievable until closer to 2025.
The Water Proofing Adelaide project is likely to be a key driver in the extent to which further schemes to increase reuse are implemented, subject to the requirements of the EPA and compliance with environmental legislation.
(c) Options for nutrient reduction
As part of the preparation of the WQIP, the EPA commissioned a report by Arup Pty Ltd (consulting engineers) (included as Appendix G), which examines the options available to SA Water to reduce nutrient levels in their discharge to the low concentrations required to achieve the environmental targets derived from the decision support system model (refer Section 4 and Appendix F).
The report examines the performance being achieved by other WWTPs discharging to similar receiving waters around the world, and the technologies (and their costs) which might reasonably be adapted for the SA Water plants at Bolivar. The work shows that while treatment options are available, they are costly to implement and require ongoing expenditure to operate. The options include:
Reuse
While 100% reuse is one of the most expensive options, a number of aspects of this approach make it attractive in the longer term:
• Incremental reuse expansion can assist with reducing environmental harm at a relatively low cost.
44
Port Waterways Water Quality Improvement Plan
• The high cost of infrastructure associated with full reuse is normally developed incrementally, with market forces ensuring that end users bear an appropriate proportion of the costs rather than SA Water (SA taxpayers) bearing the full direct cost.
• A strategic approach may allow reuse to be built into the cost of relevant developments such as dual reticulation systems for new houses.
Plant modifications to minimise phosphorus discharges
Plant modifications to minimise phosphorus discharges have been suggested as a possible way of reducing the effects of very high nitrogen concentrations in southern Barker Inlet. These should be considered only after the extent of re–use options are confirmed. If discharge loads are substantially higher than the long–term targets, phosphorus reduction may assist to allow improvement to the Port waterways to continue, although other methods such as flow management are more likely to be effective.
The use of biological processes to reduce phosphorus at Bolivar would require additional anaerobic tankage and would have major capital and operating implications.
Dosing of chemical coagulants such as alum or ferric chloride to the wastewater stream at the head of the plant has the potential to substantially reduce the concentration of phosphorus in the treated wastewater discharge.
Coagulant dosing precipitates the phosphorus, which can then be removed from the treatment process with the wasted sludge. However, this action will affect the sludge management process (ie thickening, anaerobic digestion, and lagoon and mechanical dewatering), which was not originally designed to accommodate chemical phosphorus removal. Also, the alum content of the biosolids may change its acceptability for use in soil conditioning of farmland. Sludge management facilities would need to be upgraded to deal with the increase in waste sludge. Capital costs would be significant and operating costs very high, as noted in the Arup report.
Alum dosing at the head of the plant may also lead to a requirement for pH control by addition of lime or caustic soda, as the activated sludge process can be upset by changes in wastewater pH. Maximising the process of chemical phosphorus removal would require dosing of chemicals to the treated wastewater stream followed by filtration, which would be very costly and beyond the scope of ‘plant optimisation’.
SA Water would need to assess the capital and annual costs and life-cycle environmental impacts of the chemical phosphorus removal options and investigate the feasibility and cost-effectiveness of this proposal in both the short and long terms, compared with other strategies prior to further consideration of phosphorus reduction.
Investigations of flow holding to minimise discharges
The holding of discharge flows has been suggested as a possibility for reducing loads to southern Barker Inlet.
If there is sufficient hydraulic capacity in the WWTP lagoons or the St Kilda discharge channel, discharge to Barker Inlet from the WWTP could be held up during times when, for example, a rising tide coincides with a strong northwesterly wind. This would require investigation into the capacity of the WWTP to hold discharge under the present operating constraints, and the effect of this held treated wastewater on other factors such as the growth of midges. This may not be a feasible option if the midge fly issue would result in abandonment of the lagoons.
There would be significant infrastructure requirements including raising the channel banks in the vicinity of the lagoons and installing flow control devices. These options should be modelled to determine the likely benefits before engineering investigations are carried out.
45
Port Waterways Water Quality Improvement Plan
(d) SA Water commitments to the Port waterways WQIP
SA Water is committed to working collaboratively to confirm and, where sustainably possible from an economic, environmental and social perspective, subsequently achieve ‘aspirational’ nutrient load targets for the Port waterways that will allow for appropriate WQOs to be met.
The need and sustainability case for any capital works can be developed as part of an overall strategic approach beginning in 2006, when the findings of the ACWS will be available to be input to the process.
Such a program will require support from the EPA, who will ensure that the program is adhered to by placing appropriate conditions in the operating licences of SA Water. Therefore, while the actions required of SA Water are not costed or scheduled at this time, the reductions achieved in the Port waterways to date demonstrate a commitment to responsible environmental management of their discharges on behalf of the SA community.
Prior to developing and implementing any further capital works program, SA Water will continue to minimise the effect of its discharge on the Port waterways. In addition to the investigations on P reduction and flow holding outlined above, it will work with relevant groups to increase sustainable reuse of wastewater, including those projects outlined in Section 3.1.1b.
It will be difficult to guarantee a firm timetable for expansion of reuse as a range of external drivers (eg market conditions, weather, consumer demands, competition from other areas, crop mix, transport costs and enterprise profitability) will all affect the demand for recycled water.
3.1.2 Penrice Soda Holdings Limited
a) Background
Established in the late 1930s by Imperial Chemical Industries (ICI), the Osborne site is now owned by Penrice Soda Holdings Limited, one of South Australia’s major employers and the only manufacturer of soda ash and sodium bicarbonate in Australia. In 2004 it supplied 74% of the soda ash and 88% of the sodium bicarbonate used by Australian industry.
Soda ash is predominantly sold into the Australian market for use in the manufacture of glass containers (typically wine bottles) and flat glass. Sodium bicarbonate is sold domestically as well as exported, with major end uses that include animal feed, food, kidney dialysis, personal care and pharmaceutical products.
The company also owns a limestone mine at Angaston, South Australia, and supplies a range of products to a variety of industries including glass, cement/lime, mining, metals, building and construction, and environmental control/water purification.
b) Current wastewater discharge
Penrice Soda Products (Penrice) is a major industry contributor to nutrient loading (ammonia and N) in the Port River (Penrice Soda Products 2001, 2002). It produces sodium carbonate using the Solvay process, and ammonia is reacted with brine and carbon dioxide to form alkali. The ammonia is converted to ammonium chloride, which is recovered. The distillation process recovers more than 99%. Most of the ammonia is recovered but a small proportion is discharged in the wastewater stream into the Port River.
Penrice discharges on average 70,000 kL of wastewater per day into the Port River, and the wastewater discharge has a weekly average concentration of 57 mg/L (in the range 22–177 mg/L) of ammonia (EPA 2002). Data reported to the EPA, in accordance with the conditions of their EPA operating license, indicates
46
Port Waterways Water Quality Improvement Plan
that Penrice’s 60-day moving average of ammonia concentration of their wastewater discharged to the Port River over 12 months (2004–05) had fluctuated between 16 and 35 mg/L.
The discharge from Penrice also has a significantly elevated salinity, and contains residual sediment from the process along with trace amounts of minerals that are part of the feed material to the plant from the Angaston quarry.
c) Recent work
As part of their EPA license conditions, Penrice was required to adhere to an EIP for site management and ammonia reduction, valid from December 2002 until December 2006. Also, Social and Ecological Assessments (SEA) has undertaken an annual environmental impact assessment that covers the impacts of nutrients and suspended solids on the Port River marine environment. The ammonia reduction EIP had the target of reducing the ammonia loss to the Port River from 1,220 t/year to 1,000 t/year (equivalent to 820 t of N) by 30 December 2004. This has been successfully achieved, primarily by plant equipment improvement and upgrades along with cleaner production, improved plant efficiency and operator awareness.
As previously reported Penrice also discharges residual sediment as suspended solids in their wastewater stream into the Port River. The sediment in the wastewater stream that enters the Port River has been reduced by up to 98% following the construction of a world-class solids recovery plant (SRP). This was developed in 2001 and now recovers and prevents 100,000 t/year of solid material from being deposited into the Port River. (Historically this solid material was all discharged direct to the local marine environment, from where it was then dredged every few years before being dumped to sea on the silt grounds.) The material is dried within the SRP and then used in a number of applications including land reclamation, environmental mound construction and clean fill. This has been a positive success for the environment and is unique to soda ash plants around the world. Running the SRP is an expensive exercise, with construction costs of around $4 m and annual operating costs of $2 m.
A five-year site EIP also commits Penrice to continually focus on plant improvements, including plant enclosures, dust suppression systems, equipment noise silencers and an extensive vegetation greening program. These improvements have helped generate a steep decline in community complaints received by Penrice over the last few years.
Other plant process residual products include ‘backstone’ (unburnt limestone from the kilns) and ‘grit’ (decomposed limestone from the kilns). Both these materials are either reused on site or have a valuable market. Grit is sold as ‘Nutrilime’ to the agricultural market as it includes a valuable component of free lime, and is also used in the annual preparation of the Dry Creek saltfield crystalliser floors.
d) Outlook
The production of soda ash by Penrice continues to be a profitable undertaking and the company is well positioned to retain this profitability in the longer term. Penrice are committed to remaining in their present location and continually improving their environmental performance at the site.
e) Options for further nutrient reduction
The Arup Pty Ltd report (Appendix G) also examines the options available to Penrice to reduce the nutrients in their discharge to the low levels required to achieve the environmental targets derived from the DSS modelling. Their report examines the performance being achieved by other soda ash manufacturers around the world and the kinds of technologies (and their costs) which might reasonably be considered for the Penrice plant at Osborne. The work shows that, under current cost structures, the use of existing technology to reduce nutrient discharges from Penrice to the required very low levels is not cost-effective.
47
Port Waterways Water Quality Improvement Plan
f) Penrice commitment to the WQIP
Penrice also aims to reduce its discharge to 250 t/year N by 2015. Although no relevant cost-effective technology is presently available, research and development over the next five years will be aimed at developing ways to achieve the required discharge reduction. Penrice will pursue nutrient load reductions under EPA licensing arrangements until agreed sustainable loads are achieved.
Penrice have responded to the development of the WQIP by committing to a N reduction to 575 t/year by 2010 and have negotiated an amended license with the EPA to ensure this is achieved. However, they are hopeful that by careful examination of options and a program of testing, significant additional reductions may be able to be made in the future. For this reason, they have adopted a resource recovery target of 250 t/year to work towards and achieve as soon as possible by constant innovation. They aim to achieve this target by 2015, a timing that Penrice have set for themselves. While it is not intended that this goal be reflected as a condition of their EPA license at this time, it may be incorporated in future EIPs as the load targets are better defined and Penrice become more confident of their ability to deliver the necessary load reductions while remaining a viable business.
g) Penrice EIP reductions
As mentioned above, Penrice have committed to reduce their ammonia and nutrient discharge to the Port River by almost 50% from the introduction of their first ammonia EIP in 2002. They will achieve these reductions by entering into a new EIP that will be tied in with their EPA operating license and conditions. The reductions will be 100 t in the first year (2006), followed by further reductions of 50 t/year up to 2010.
3.1.3 Generic management measures
a) EPA activities
In addition to its work with the major point sources indicated above, other EPA activities, undertaken in cooperation with the A&MLR NRM Board and local government, that will achieve significant nutrient reductions are:
EPA-licensed industry activities
As discussed in the Stage 1 report, there are around 130 companies within the Port Adelaide, Gillman and West Lakes areas that are licensed by the EPA. Large segments of the study area defined in Figure 1.1 are within catchment board areas. Within the areas adjacent to the waterways not covered by the catchment boards, there are activities that have license conditions for discharges to marine or inland waters, including inorganic chemical works, dredging, earthworks drainage and/or tanneries. These are summarised below.
Flinders Ports
In 2001 Flinders Ports became the private operator of the previously state-operated South Australian Ports Corporation. As part of the handover, Flinders Ports acquired a 99-year land lease and port-operating license for the port of Adelaide.
The wharfing industry is a fundamental component of the port, and the various bulk handling and shipping activities contribute to the nutrient load in the waterways, although the actual load is unquantified. In order to minimise the environmental impacts of the industry, as indicated above, the EPA have developed a Code of Practice for Wharf Handling in conjunction with Flinders Ports and with input from the stevedore companies.
48
Port Waterways Water Quality Improvement Plan
Flinders Ports has an environmental management system (EMS) certified to ISO 14001, which covers:
• ballast water management
• dredging and reclamation
• working from maintenance barges
• emergency response plans
• loading and unloading of ships
• land contamination
• stormwater management
• purchase and disposal of plant
• sewage and trade waste systems.
Flinders Ports, as part of its environmental commitment, encourages its tenants and the stevedores to adopt environmentally sensitive work practices and adhere to the principles of the WQ Policy. Additionally, it undertakes a bi-annual audit of its Port Adelaide facilities.
Flinders Ports also undertakes maintenance dredging of the shipping channels and is licensed by the EPA for this activity. A program of maintenance dredging commenced in about 2001. Prior to this there had not been any significant maintenance dredging for 10 years or more. Quantities of dredged material have generally been small, this current financial year being the largest at approximately 25,000 m3, and the average over the last five years being probably less than 10,000 m3/year. All dredged material in recent times has been disposed of at designated land disposal sites. In Port Adelaide there are disposal ponds at Snowdens Beach, No. 20 Berth, adjacent to Outer Harbour No. 7 Berth, and on the northern revetment mound at Outer Harbour. One is also currently under construction at No. 29 Berth.
Fertiliser companies
There are EPA-licensed fertiliser companies in the Port Adelaide area, including Incitec Pivot, Orica Australia and Hi-Fert. All the companies are involved in the handling of N and P fertilisers, both of which can enter the Port waterways in a number of ways: through stormwater runoff from the companies’ sites, during bulk handling losses or during transport.
Previously, stormwater from the fertiliser sites was discharged directly into the Port River and to the Torrens Road Drainage Authority (TRDA) basin. At present the fertiliser industries do not contain the stormwater generated on their sites but discharge it into the Magazine Creek wetland.
Discharges from these industries will continue to be controlled by the WQ Policy, and will be required to comply with discharge quality levels (at present the stormwater generated on these sites exceeds the WQ Policy levels for nutrients).
Incitec Pivot has developed an EIP for their operations in order to comply with the WQ Policy, and all the other fertiliser companies are aware of the policy and the need to change work practices. Discussion with the EPA indicated that these companies are being encouraged to develop enclosed in-house facilities for containment and treatment of stormwater.
Ausbulk
Ausbulk operates bulk grain storage and handling facilities adjacent to No. 27 Berth in the inner port. At present the stormwater generated is retained in basins on site, allowed to settle and then discharged into the Port River. Settling allows the bulk of solids to be removed from the stormwater, although some fines
49
Port Waterways Water Quality Improvement Plan
and grain husks would still be discharged. Ausbulk uses phosphine gas to treat the grain but does not use any other insecticides.
It is unknown whether the loading of grain contributes to nutrient loads; nevertheless, any load would be reduced through the introduction of the Code of Practice for Materials Handling on Wharves.
Power generation–thermal effluent
There are three power generation companies in the Port Adelaide area that are licensed by the EPA for discharge into marine or inland waters (in this case all are marine discharges): Osborne Cogeneration Pty Ltd, Pelican Point Power Ltd and TXU (South Australia) Pty Ltd (Torrens Island). Of these companies, TXU has an EIP as part of its license conditions and is required to undertake a monitoring program in relation to its discharges to the marine environment, particularly with respect to thermal load.
Dredging
There are four organisations that have licences for dredging in the Port Adelaide area: York Civil Pty Ltd, Penrice Soda Products Pty Ltd, the Minister for Transport and Flinders Ports Pty Ltd. There are no EIP conditions for dredging but these short-term activities are issued with licences that require strict compliance with relevant water quality criteria.
A major dredging of the Outer Harbour approach channel and turning circle was commenced in late 2005 and continued into 2006. This capital program saw the removal of over 3 m cubic metres of material, which was dumped to sea in a designated area close to the middle of Gulf St Vincent.
The dredging resulted in significant turbidity in and around the Port River, the shipping channel and nearby areas. While the long-term effects were still being examined at the time of the development of this WQIP, the dredging was not associated with any significant release of nutrients.
Earthworks drainage
There are three companies that regularly hold licences for earthworks drainage associated with dredge spoil from the Port River being brought to land for further disposal: York Civil Pty Ltd, Penrice Soda Products Pty Ltd and Flinders Ports Pty Ltd. These short-term activities are issued with licences that require strict compliance with relevant water quality criteria.
Tanneries and/or fellmongery
There are four companies with licences for tannery operations: Gary Polygerinos, Crompton Group Holdings, Vacel Leather Pty Ltd and T&R Pastoral Pty Ltd. These tanneries all discharge to the sewer and are subject to trade waste controls by SA Water. They have no discharge to the Port waterways.
Municipal landfills
Wingfield Waste Management Centre
The Wingfield Waste Management Centre (WWMC) was established in 1956 on the swampy land adjacent to the now defunct Dean Rifle Range and the North Arm Creek of Barker Inlet. The landfill has received both domestic and industrial solid waste throughout its operation, and between 1960 and closure was also used for liquid waste disposal. The Commonwealth leased the site to Adelaide City Council until 1986, when the council purchased it from the Commonwealth. Since this takeover, the landfill operations have been regulated under the Waste Management Act 1987 (repealed) and the Environment Protection Act.
50
Port Waterways Water Quality Improvement Plan
Landfill operations ceased in December 2004, although other waste recycling activities now operate over the site. A capping plan for the landfill is under development. Leachate retention basins have been created on the southwestern, southeastern and northeastern boundaries of the site and on–site surface water drainage is directed towards these basins. The basins provide storage for 1-in-5-year and 72-hour storm events. Discharge from the basins is directed to wetlands on the site.
Garden Island
The Garden Island landfill has also now closed. Land Management Corporation (LMC) retain responsibility for management of the site and have developed a closure and capping plan in 2005 in agreement with the EPA, who enforce adherence to the plan through an Environment Performance Agreement.
Through this agreement LMC are implementing an eight-year strategy to cap and revegetate the landfill site to reduce infiltration and manage stormwater runoff, thereby reducing the hydraulic gradient of groundwater and potential leachate infiltration. The strategy includes options to increase the area available for the spread of existing mangrove and samphire stands.
Eco-efficiency
The EPA runs an ongoing eco-efficiency program to assist businesses, which includes:
• cleaner production
• industry environment management systems
• environmental auditing
• public environmental reporting
• design for environment
• product stewardship
• life-cycle assessment
• supply chain management
• environmental accounting.
Load-based licensing of discharges
The development of a load-based component of EPA discharge licensing was initially investigated as part of the Coastal Catchments Initiative (CCI) range of projects (see below) to reduce the discharge of nutrients to the Port waterways. Partly through this work the EPA has identified that this licensing reform is a key initiative for the whole of South Australia. As a result of the development of the Port Waterways WQIP, the EPA intends to set discharge limits on point-sourced nutrient industrial discharges to the waterways that are consistent with the protection of WQOs and aimed at achieving agreed EVs across the waterways. This will be done by amending the WQ Policy.
Coastal Catchment Initiative projects
The EPA, with support from the Australian Government, has undertaken several other parallel projects that are of significance to the development of this WQIP:
• Code of Practice for Materials Handling on Wharves This code of practice applies to all people, organisations and agencies that own, operate and use wharf facilities and vessels for the purpose of materials handling within the marine and inland waters environment of South Australia. It does not address overall port operations, such as materials storage and maintenance, vessel regulation or dredging. These issues are managed through other codes, guidelines and regulations. The primary focus of this code is the handling of materials on wharves.
51
Port Waterways Water Quality Improvement Plan
• Code of Practice for Vessel and Facility Management (Marine and Inland Waters) This code of practice applies to people, organisations and agencies that own, operate and use vessels, vessel construction and maintenance facilities (including slipways and launch facilities), and vessel storage facilities (including dry dock boat yards, marinas, moorings, boat and yacht clubs) within or adjacent to the state waters of South Australia. State waters include inland waters, and estuarine and marine waters (which include coastal state and territorial waters vested in the state).
• Load-based pollution control licensing (LBL) Load-based licensing aims to make more EPA licencees pay a license fee based on their actual load to the receiving environment. At the EPA’s request, this project was terminated and the concept pursued for the whole of SA. A new license fee system that includes an increased emphasis on loads is in force.
• Feasibility study and possible development of a tradeable rights instrument to reduced nutrient pollution in the Port waterways Refer Section 3.4.
• Water quality monitoring for execution and review of the Water Quality Improvement Plan Discharge loads from catchments were previously based on estimates and some short-term monitoring in parts of the Port waterways. A monitoring project has been undertaken in which five additional monitoring stations were placed to measure water flows and nutrient levels discharged from catchments to the Port waterways. A report of this work has been included as Appendix D of this WQIP.
The CCI has also funded other projects, managed by local government, to improve the quality of water entering the Port waterways. These were:
• Review and Amendment of Council Development Plans—Northern Adelaide and Barossa Catchment Water Management Board Review of the Development Plans of seven of the nine councils that comprise the constituent councils of the board’s area. The work reviewed the provisions in councils’ Development Plans as they affect the management of water resources within the board’s area, and identified changes that could be implemented through a Planning Amendment Report to remove or minimise impacts on catchment health.
• Urban Stormwater Master Plan—City of Port Adelaide–Enfield Development of a number of Urban Stormwater Master Plans (USMP) for subcatchments in the Port Adelaide Enfield catchment and some shared catchments with the Cities of Charles Sturt and Prospect.
A USMP is a holistic approach to managing urban stormwater that links infrastructure considerations with planning, social and environmental imperatives. The plans consider a range of stormwater management options, including wetlands, detention and retention basins, onsite controls, potential aquifer storage and recovery locations, and gross pollutant traps, to ensure the best mix of strategies. This approach ensures that property is protected from flooding while the costs of infrastructure maintenance and repair are minimised, and the quality of stormwater runoff and the health of the environment is maximised.
• Gross Pollutant Trap on Dry Creek—City of Salisbury Construction of a major in-stream gross pollutant and sediment trap on Dry Creek to capture a large portion of the pollutants formerly discharging to Barker Inlet.
• Rising Main to South Terrace Reserve Wetland—City of Salisbury Design and construction of a rising main to draw water from a new sediment basin directly in front of the Dry Creek gross pollution trap and pump it to the existing South Terrace wetlands.
• Burton West Wetlands Project—City of Salisbury Construction of a treatment basin and wetland to reduce the gross pollutant load to the Barker Inlet.
52
Port Waterways Water Quality Improvement Plan
b) Adelaide and Mount Lofty Ranges Natural Resource Management Board
The A&MLR NRM Board manages a broad range of the natural resources of its part of South Australia, including having significant responsibilities for the management of water resources. It replaced the existing Catchment Water Management Boards (CWMBs) in early 2006. Among the goals of the NRM Boards there is a strong emphasis on protecting and improving water quality. The NRM Boards are developing an investment strategy to channel state and federal funds to address priority issues, including a number of strategies that will result in reduced nutrient loads to the Port waterways.
The activities of the CWMBs are detailed here to show what has been undertaken and the range of initiatives that have been planned by these groups. Many of these activities will be furthered through the A&MLR NRM Board.
Former Catchment Water Management Boards
The CWMBs have prepared catchment water management plans and, consistent with them, initiated projects which will result in considerable reductions in pollutant export and improve flow regimes to the Port waterways. The work of the boards is summarised below, together with that of Port Adelaide–Enfield Council, the EPA and other significant initiatives.
Torrens Catchment Water Management Board (TCWMB)
The TCWMB Catchment Plan (Tonkin Engineering and Science 2004) outlines seven goals aimed at achieving its vision:
Throughout the catchment achieve sustainable water resources and healthy ecosystems through integrated catchment management and a committed community.
Goal 1 is most relevant to this section of the report: to improve and maintain water quality in the catchment to a standard suitable for community use (including public water supply), for sustaining natural ecosystems and to reduce impacts on receiving waters. The strategies underpinning Goal 1 are:
• Strategy 1.1: Assign environmental values for water resources within the catchment and set appropriate improvement targets (there are five actions towards implementing this strategy)
• Strategy 1.2: Identify and support priority diffuse pollution control measures for activities in the catchment (three actions)
• Strategy 1.3: Develop and maintain constructed wetlands (five actions)
• Strategy 1.4: Eliminate waste water discharges to watercourses and receiving waters (four actions)
• Strategy 1.5: Control of excessive erosion of watercourses (two actions)
• Strategy 1.6: Install gross pollutant traps (five actions)
• Strategy 1.7: Create rural riparian buffer zones (two actions).
Over 2002–03 the TCWMB has been involved in the following projects relating to the Port waterways:
• ‘Street Smart River Clean’ North West Adelaide Stormwater Pollution Prevention Project. This project is run in conjunction with the Cities of Charles Sturt, Port Adelaide Enfield and Prospect and is located in the Port River and its environs. The TCWMB’s involvement includes providing project officer resources (a total of six) to the three councils. These project officers visit small business and industry to encourage ‘best practice environmental management’ (eg onsite pollution prevention, cleaner production, water and wastewater minimisation, and waste management).
53
Port Waterways Water Quality Improvement Plan
• the Grange Golf Club Wetlands and ASR Scheme. A feasibility study of the scheme has been undertaken. The scheme would see approximately 70% of the water from the adjacent catchment being diverted from the stormwater system into wetlands and then stored using ASR for golf course irrigation requirements. This scheme would reduce the amount of stormwater pollution entering West Lakes and improve water quality, including that of the outflow into the Port River.
• initial investigations into the possibility of developing a wetland and ASR scheme for the River Side Golf Course that would collect, treat and store the stormwater generated in the Neakin Road system
• various education and public awareness programs.
Gillman wetlands
There are three large constructed wetlands in the Port River area: the Range, Magazine and Barker Inlet wetlands. The Range and Magazine wetlands are within the Gillman area while the Barker Inlet wetlands are immediately to the east of the Gillman area and to the north and south of the Salisbury Highway. There is also the Salisbury Greenfield wetland system, which is adjacent to Dry Creek. The locations of the wetlands are indicated on Figure 1.1.
Developed prior to the TCWMB Catchment Plan, these wetlands were constructed to improve the water quality of the stormwater runoff draining through Gillman into the North Arm and North Arm Creek. The wetlands intercept and treat the polluted stormwater runoff from an area of approximately 60 km2, and are now an integral part of the water management strategy for the extended northern part of the TCWMB’s area.
The Barker Inlet site was a degraded site used for stormwater drainage, waste disposal and incorporated salt crystallisation ponds prior to its redevelopment. The Barker Inlet wetlands were constructed in 1996 at a cost of $10 m funded by the Commonwealth Government (PAR, Port Adelaide Enfield Council 2003). Flows are controlled by three separate gated structures at a levee wall, which are opened during low tides. The Range and Magazine wetlands were constructed at a cost of $7 m and handed over to the Port Adelaide–Enfield Council in 1999. The Magazine wetland discharges into the TRDA basin behind the levee bank, and then into the North Arm Creek during low tide via a gated structure at the levee wall. The Range wetland also discharges to the low-lying area behind the levee bank via a drainage channel; however, this estuarine area is sealed off from the Magazine and North Arm creeks by another levee bank.
Northern Adelaide Barossa Catchment Water Management Board (NABCWMB)
The NABCWMB (Sinclair Knight Merz 2001) lists eight goals in its plan aimed at achieving its vision:
A community working in partnership for clean waterways, sustainable water use and a biologically diverse catchment.
Goal 1 is the most relevant to this section of the report: to protect and improve the water quality of the resources in the catchment to meet the needs of users of the resource. The strategies underpinning Goal 1 include:
• Strategy 1.1: Identify point and diffuse pollution sources, including land use practices, and prioritise and implement actions to minimise their impacts on water quality (there are four actions towards implementing this strategy)
• Strategy 1.2: Develop and protect wetlands (two actions)
• Strategy 1.3: Control erosion and minimise sediment inputs to streams (three actions).
54
Port Waterways Water Quality Improvement Plan
Over 2002–03 the NABCWMB has been involved in the following projects relevant to the Port waterways:
• Dry Creek habitat restoration, Ladywood Drive Modbury North and Kingfisher Reserve
• Dry Creek, Little Para and Cobbler Creek erosion strategy
• Dry Creek, Little Para, Helps Road and Smiths Creek Regional Water Resource Plan
• Little Para Industry Partnership Program
• Be Stormwater Smart, Clean Site Industry Education Campaign, Local Government Stormwater Pollution Prevention Audit Scheme
• Burton West wetland
• Dry Creek gross pollutant trap
• Dry Creek restoration and wetland
• Little Para outfall wetlands—Stage 2.
The board funds three Stormwater Smart Pollution Prevention Project Officers based in the Salisbury, Tea Tree Gully and Playford council areas. The program educates small industry about the environmental and economic benefits of stormwater pollution prevention through industry visits and site assessments, information, advisory materials and demonstration sites.
c) Port Adelaide–Enfield Council (PAEC) activities
In addition to the ‘Street Smart River Clean’ project referred to above, the PAEC is involved in a range of activities aimed at assessing and improving water quality, including:
• the Environment Strategic Plan 2003–06 which provides details regarding council's planning and programmes for flood and water quality protection, in general—this Plan is undergoing review and updating for 2007
• the review and updating of the Wetlands Management Plans (2007) to ensure council is pursuing best practice in managing these critical assets, including monitoring of stormwater and discharge quality
• the preparation of Stormwater Management Plans for all catchments, under the auspices of the recent amendments to the Local Government Act 1999. The plans must incorporate detailed strategies for water quality improvements, and water conservation and harvesting activities
• Through the 'Street Smart River Clean' program (funded by the AMLR NRM Board), council-hosted officers have undertaken over 2,500 visits with non-EPA licensed businesses since the program commenced in 1998. Site visits are undertaken of businesses to assess the type of activity and how everyday practices or procedures may impact on the stormwater system. This information is recorded on a database for review during follow up visits. Businesses are informed of the Code of Practice for Industrial, Retail and Commercial Stormwater Management and their general environmental duty. Project officers focus on major industrial areas of Wingfield, Kilburn and Dry Creek and a range of businesses including mechanical, engineering and automotive industries.
d) Adelaide Dolphin Sanctuary
The study area is now part of the Adelaide Dolphin Sanctuary, the first of its kind in Australia. It was established by specific legislation—the Adelaide Dolphin Sanctuary Act 2005—proclaimed in June 2005. The purpose and objects of the Act are to provide the community of dolphins in the area with extra protection to ensure they remain in the Port River and Barker Inlet. To offer them this protection, it is necessary to make sure that the environment on which they rely is improved and protected to sustain healthy ecological processes. The Act lists six objectives as the means to achieving this protection.
The Act amends 11 other Acts by adding the requirement to further these objects and objectives where appropriate. By making their achievement part of the administration of these Acts, the Adelaide Dolphin
55
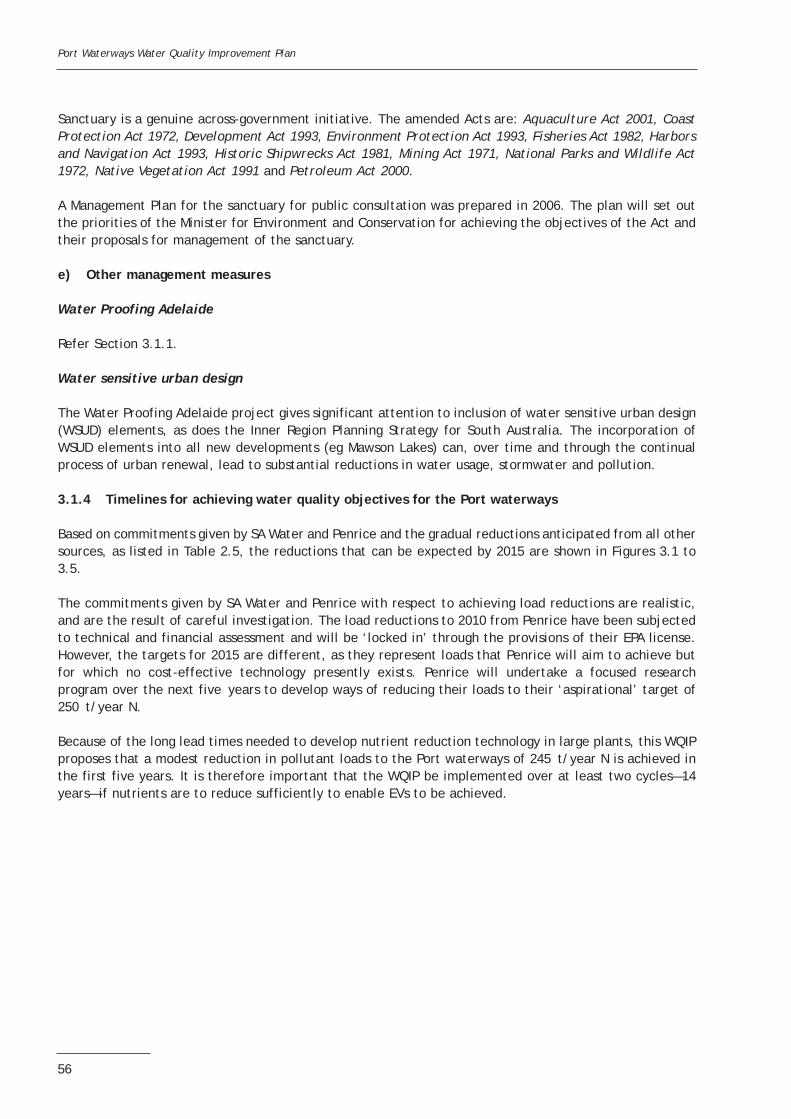
Port Waterways Water Quality Improvement Plan
Sanctuary is a genuine across-government initiative. The amended Acts are: Aquaculture Act 2001, Coast Protection Act 1972, Development Act 1993, Environment Protection Act 1993, Fisheries Act 1982, Harbors and Navigation Act 1993, Historic Shipwrecks Act 1981, Mining Act 1971, National Parks and Wildlife Act 1972, Native Vegetation Act 1991 and Petroleum Act 2000.
A Management Plan for the sanctuary for public consultation was prepared in 2006. The plan will set out the priorities of the Minister for Environment and Conservation for achieving the objectives of the Act and their proposals for management of the sanctuary.
e) Other management measures
Water Proofing Adelaide
Refer Section 3.1.1.
Water sensitive urban design
The Water Proofing Adelaide project gives significant attention to inclusion of water sensitive urban design (WSUD) elements, as does the Inner Region Planning Strategy for South Australia. The incorporation of WSUD elements into all new developments (eg Mawson Lakes) can, over time and through the continual process of urban renewal, lead to substantial reductions in water usage, stormwater and pollution.
3.1.4 Timelines for achieving water quality objectives for the Port waterways
Based on commitments given by SA Water and Penrice and the gradual reductions anticipated from all other sources, as listed in Table 2.5, the reductions that can be expected by 2015 are shown in Figures 3.1 to 3.5.
The commitments given by SA Water and Penrice with respect to achieving load reductions are realistic, and are the result of careful investigation. The load reductions to 2010 from Penrice have been subjected to technical and financial assessment and will be ‘locked in’ through the provisions of their EPA license. However, the targets for 2015 are different, as they represent loads that Penrice will aim to achieve but for which no cost-effective technology presently exists. Penrice will undertake a focused research program over the next five years to develop ways of reducing their loads to their ‘aspirational’ target of 250 t/year N.
Because of the long lead times needed to develop nutrient reduction technology in large plants, this WQIP proposes that a modest reduction in pollutant loads to the Port waterways of 245 t/year N is achieved in the first five years. It is therefore important that the WQIP be implemented over at least two cycles—14 years—if nutrients are to reduce sufficiently to enable EVs to be achieved.
56
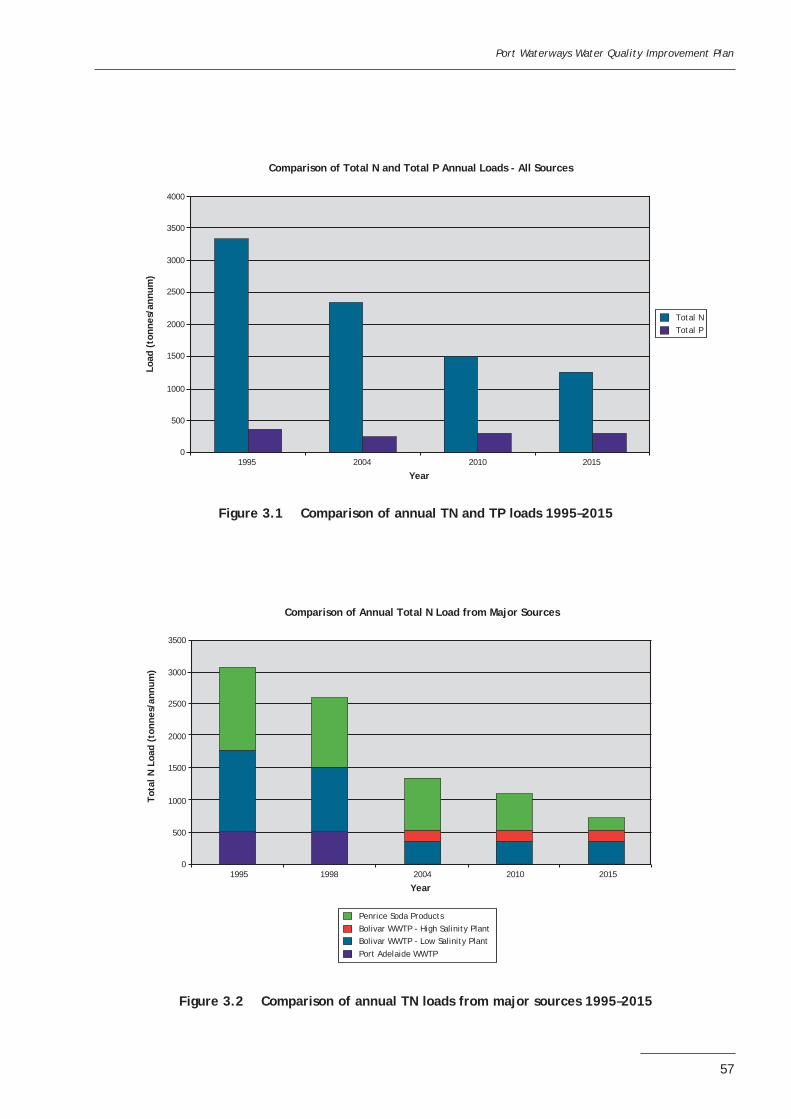
Port Waterways Water Quality Improvement Plan
Comparison of Total N and Total P Annual Loads - All Sources
4000
3500
3000
2500
2000
1500
1000
500
0
Load
(to
nnes
/ann
um)
Total N Total P
1995 2004 2010 2015
Year
Figure 3.1 Comparison of annual TN and TP loads 1995–2015
Comparison of Annual Total N Load from Major Sources
3500
3000
2500
2000
1500
1000
500
0
Tota
l N L
oad
(ton
nes/
annu
m)
1995 1998 2004 2010 2015
Year
Penrice Soda Products Bolivar WWTP - High Salinity Plant Bolivar WWTP - Low Salinity Plant Port Adelaide WWTP
Figure 3.2 Comparison of annual TN loads from major sources 1995–2015
57
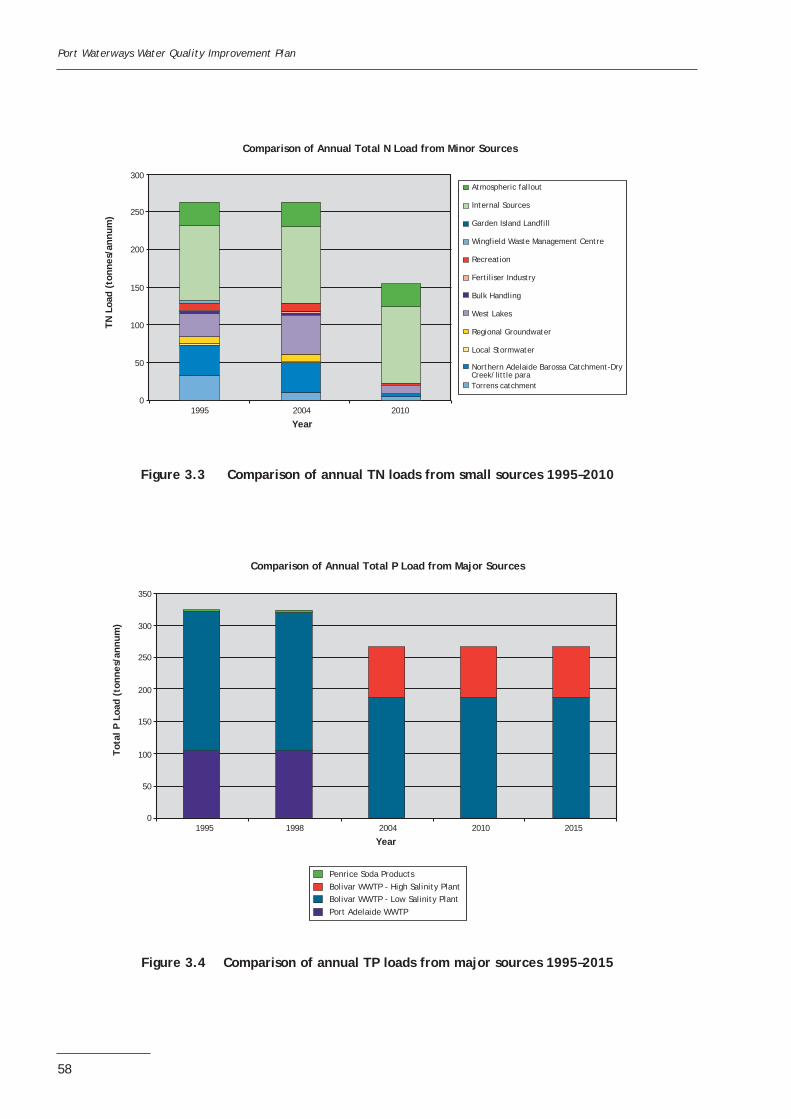
Port Waterways Water Quality Improvement Plan
Comparison of Annual Total N Load from Minor Sources
TN L
oad
(ton
nes/
annu
m)
300
250
200
150
100
50
0
Atmospheric fallout
Internal Sources
Garden Island Landfill
Wingfield Waste Management Centre
Recreation
Fertiliser Industry
Bulk Handling
West Lakes
Regional Groundwater
Local Stormwater
Northern Adelaide Barossa Catchment-Dry Creek/little para Torrens catchment
1995 2004 2010
Year
Figure 3.3 Comparison of annual TN loads from small sources 1995–2010
Comparison of Annual Total P Load from Major Sources
350
300
250
200
150
100
50
0
Tota
l P L
oad
(ton
nes/
annu
m)
1995 1998 2004 2010 2015
Year
Penrice Soda Products Bolivar WWTP - High Salinity Plant Bolivar WWTP - Low Salinity Plant Port Adelaide WWTP
Figure 3.4 Comparison of annual TP loads from major sources 1995–2015
58
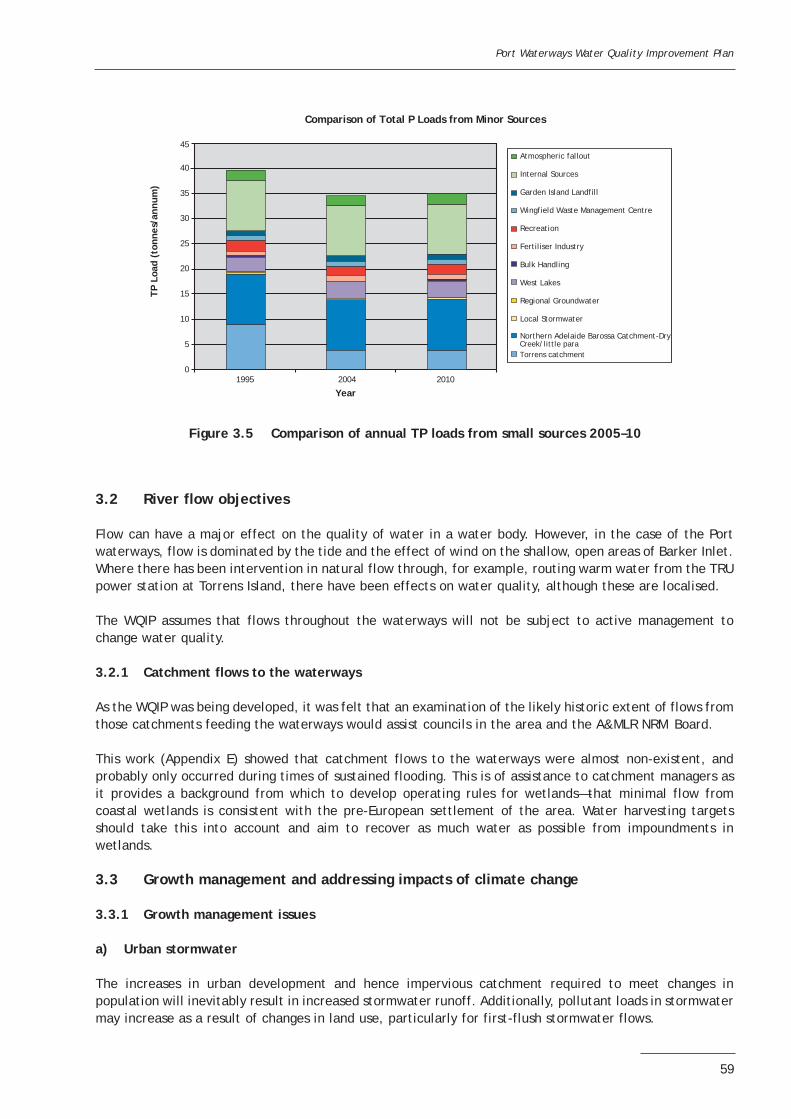
Port Waterways Water Quality Improvement Plan
Comparison of Total P Loads from Minor Sources
45 TP
Loa
d (t
onne
s/an
num
) 40
35
30
25
20
15
10
5
01995 2004 2010
Atmospheric fallout
Internal Sources
Garden Island Landfill
Wingfield Waste Management Centre
Recreation
Fertiliser Industry
Bulk Handling
West Lakes
Regional Groundwater
Local Stormwater
Northern Adelaide Barossa Catchment-Dry Creek/little para Torrens catchment
Year
Figure 3.5 Comparison of annual TP loads from small sources 2005–10
3.2 River flow objectives
Flow can have a major effect on the quality of water in a water body. However, in the case of the Port waterways, flow is dominated by the tide and the effect of wind on the shallow, open areas of Barker Inlet. Where there has been intervention in natural flow through, for example, routing warm water from the TRU power station at Torrens Island, there have been effects on water quality, although these are localised.
The WQIP assumes that flows throughout the waterways will not be subject to active management to change water quality.
3.2.1 Catchment flows to the waterways
As the WQIP was being developed, it was felt that an examination of the likely historic extent of flows from those catchments feeding the waterways would assist councils in the area and the A&MLR NRM Board.
This work (Appendix E) showed that catchment flows to the waterways were almost non-existent, and probably only occurred during times of sustained flooding. This is of assistance to catchment managers as it provides a background from which to develop operating rules for wetlands—that minimal flow from coastal wetlands is consistent with the pre-European settlement of the area. Water harvesting targets should take this into account and aim to recover as much water as possible from impoundments in wetlands.
3.3 Growth management and addressing impacts of climate change
3.3.1 Growth management issues
a) Urban stormwater
The increases in urban development and hence impervious catchment required to meet changes in population will inevitably result in increased stormwater runoff. Additionally, pollutant loads in stormwater may increase as a result of changes in land use, particularly for first-flush stormwater flows.
59
Port Waterways Water Quality Improvement Plan
An indication of the potential requirements for increased urban development may be derived from the following projected population changes in the main local government areas containing catchments that contribute to the Port waterways. Projections are based on the population projection inquiry system for the years 2001–16 found at <www.planning.sa.gov.au/pop_land_monitor/enquiry_test>:
• Port Adelaide Enfield—7% increase
• City of Salisbury—15% increase
• City of Playford—26% increase
• Tea Tree Gully—no change
• Barossa—10% increase
• Gawler—12% increase
• Light—7% increase
• Mallala—15% increase.
To minimise potential impacts on the Port waterways, management strategies to address additional stormwater flows and pollutant loads are expected to be included in the catchment management plans, for example:
• an integrated water management strategy for northern areas
• inclusion of WSUD for all new developments
• ongoing community education for stormwater pollution prevention
• ongoing catchment rehabilitation programs
• ongoing catchment care programs.
b) Municipal wastewater
It is anticipated that by 2015 there will be an approximate 10% increase in the volume of treated wastewater produced from the Bolivar WWTP compared to the current rate of production. The management of this increase is a component of the agreement between the EPA and SA Water and is not expected to result in any additional impacts on the waterways.
c) Industrial growth
It is anticipated that any new industry commencing in the catchments contributing to the Port waterways will be developed with licensing conditions that minimise the release of stormwater and prohibit wastewater discharges that may impact on the waterways.
3.3.2 Impacts of climate change
The main impacts of climate change on the Port waterways are expected to be:
• increasing sea levels
• changes to rainfall patterns that will include:
– reduced rainfall frequency resulting in longer, drier periods
– more intense rain events.
Any increase in sea level is considered unlikely to impact significantly on the mangrove communities as they will adapt to a change in sea level and will create their own coastline. A negative impact on samphire communities is likely to be more marked due to the lack of unoccupied land available for migration. This is a planning issue that should be addressed. In particular, should the Bolivar lagoons or Penrice saltfields
60
Port Waterways Water Quality Improvement Plan
be decommissioned for any reason in the future, allowance for future samphire colonisation should be included in the planning proposals for the land. The Port Adelaide–Enfield Council Development Plan requires that accession buffers be provided in coastal areas to accommodate sea level rise.
The impact of reduced rainfall frequency and longer, drier periods is that the first flush of urban stormwater will have an increased pollutant load. Stormwater management strategies will be required to consider these increases in order to prevent additional pollution entering the Port waterways.
Rain events with an increased intensity will result in the generation of higher volumes of stormwater over shorter periods of time at more infrequent intervals. Changes of this nature should be considered by catchment management plans such that stormwater management infrastructure is designed not to be exceeded during periods of high flow. Instead, flow should be mitigated such that treatment trains are capable of removing the required level of pollutants, and flows entering the Port waterways are not significantly altered.
3.4 Use of market-based instruments
As summarised in EPA (2005b), a feasibility study has been undertaken of the cost benefit of establishing a tradeable rights/market-based instrument to reduce nutrient pollution in the Port waterways.
The study involved quantifying all industrial discharge sources and estimates of diffuse-source pollution in the waterways. Approximate costs for nutrient abatement strategies at a number of industries and several diffuse sources were determined. Environmental economic consultants BDA Group were engaged to undertake an economic analysis of the suitability and benefits of such a scheme. Cost differentials were assessed against several proven economic market-based instrument models including formal nutrient offset schemes, bubble licensing and a hybrid model of negotiated licensing offsets. The BDA Group have reported that a tradeable nutrient discharge instrument would not have been feasible in 2004 in the Port waterways for the following reasons:
• Currently, only 7% of the N pollution comes from diffuse sources, with the remaining 93% made up entirely from two sources: SA Water’s Bolivar WWTP and Penrice’s soda ash production facility at Osborne. Similarly, 82% of the total P load comes from the Bolivar WWTP. These factors limit the potential trading options to the two parties, which severely restricts the potential market available.
• There was also concern over the equity between the two potential trading partners. One is a listed company and the other a government-owned monopoly utility. Therefore, very different economic models drive the finances available for pollution reduction of the two organisations, and equal trading between these two parties based on current spending on environmental improvements is seen to be inequitable.
• SA Water has completed a major upgrade of its facilities to reduce the environmental harm caused by its nutrient emissions, whereas Penrice is still at the feasibility stage. In order for market-based instruments to be of value, the major traders should be at or close to ‘best available technology that is economically achievable’ (BATEA) and have all available improvements scoped, in order for them to be considered during negotiations.
3.5 Institutional and organisational reforms
The introduction of legislation to allow for the development of defined Natural Resource Management Boards has resulted in a major change in focus for the allocation of investment in natural resource management in South Australia.
Boards are responsible for a range of activities, including the impact of discharges from catchments to the sea within their defined areas of influence. Thus, although the EPA will be responsible for the
61
Port Waterways Water Quality Improvement Plan
implementation of the nutrient load targets in the WQIP, the A&MLR NRM Board has assumed overall responsibility for most of the diffuse sources of nutrient loads to the Port waterways.
This is a major step forward. With the responsibility of the different agencies well defined, it is now far easier to plan and implement strategies for water quality improvement.
3.6 Regulatory reforms to support improved water quality and environmental flows
Development of the WQ Policy has resulted in a clear and powerful tool for the improvement of water quality in South Australia. Sections of the WQ Policy require mandatory compliance and give clear guidance to potential dischargers of their obligations.
Additionally, the policy provides for simple amendment of relevant water quality values where local information is available. This flexibility will be used during implementation of the WQIP, such that relevant values can be amended after appropriate scientific confirmation and stakeholder consultation.
3.7 Priority WQIP research and development activities
All parties involved in the development of the WQIP recognise that the basis for the nutrient targets is a computer model. While it has been developed with care and calibrated using real-time information, the model needs to be refined and subject to verification if it is to be relied on to guide definition of target nutrient loads.
It is expected that development of the water quality model and an improved understanding of the nutrient status of the waterways will result in final discharge targets being adjusted during the initial WQIP. Given the margin of safety (Section 2.8) built into the model predictions, target loads are likely to increase rather than decrease as better information is developed.
However, without careful review and development of the computer model, dischargers may spend either too much—to reduce discharges below what is actually needed; or too little—whereby the community will see little improvement in water quality for considerable (but insufficient) expenditure.
With this in mind, expert hydrodynamic and water quality modellers and local and interstate water quality experts subjected the model to critical examination at a workshop in May 2006. They also advised on whether the WQOs (chlorophyll a; Table 2.2) for the waterways were likely to be appropriate, and outlined the work needed to provide confirmation of the values chosen for the waterways.
The group provided the following advice about the model and its development to assist dischargers adjust final targets:
• given that the dischargers will need to undertake work over a long period of time to achieve the target loads, the nominated targets are suitable to guide this work at present
• to provide information about the target loads required for summer, the model should be run so as to achieve the EVs in summer (refer Section 3.7.1 below)
• the purchase and calibration of a module to directly examine the effect that macroalgae has on the uptake of nutrients in the waterways is recommended if sufficient funding can be sourced for local calibration.
3.7.1 Summer scenario modelling
The modelling to date has been of winter scenarios. However, strategies for further nutrient reduction include increased irrigation reuse of WWTP discharges, particularly in the spring–summer period. This is the
62
Port Waterways Water Quality Improvement Plan
time of increased algal growth and when decreased nutrient inputs to the waterways would be the most beneficial. Currently, Bolivar summer load inputs are much reduced because of reuse in the Virginia Horticultural Area.
It is important that these effects in summer are taken into account in later cycles of the WQIP as final targets for load reductions and likely costs of capital investment may be affected. The margin of safety (Section 2.8) built into the WQIP means that further understanding of the way in which water quality reacts to seasonal inputs of nutrients may result in some upward revision of targets.
3.7.2 Monitoring of Ulva/macroalgae
No data is available on the biomass of algal debris on the intertidal flats or in the mangroves. This data needs to be obtained because, with implementation of the WQIP and subsequent nutrient reduction, it is expected that the amount of debris will be greatly reduced and will therefore be a valuable performance indicator.
3.7.3 Interface with the Adelaide Coastal Waters Study
This study (refer Section 3.1.1b) has been running in parallel with the development of the WQIP and was released in February 2008. The two programs will be integrated, particularly with regards to the extent of the effects of the Bolivar and Penrice discharges.
3.7.4 Comparison with reference areas
To assist in refining the WQOs, data on background water quality should be obtained from other coastal embayments in South Australia (mangrove/samphire) which show relatively little effect of human impacts.
3.7.5 Future research
Further data will also be required on:
• atmospheric deposition
• groundwater inputs, particularly from known contaminated areas, which may result in localised effects
• the potential for nutrients from the Virginia Horticultural Area to reach coastal waters, for example via the Gawler River.
• changing internal sources.
3.8 Adaptive management for the Port Waterways WQIP
3.8.1 Introduction
The Port Waterways WQIP will not be a static strategy, but will change as the results of further monitoring and modelling is undertaken. This will be achieved using an adaptive management framework.
Adaptive management processes assist with incorporating methods of system improvement into a formal management framework that allows long-term planning to cement these processes in place.
An informal version of this process has been applied in the Port waterways over the last century. For example, as dischargers such as the former EWS realised the ‘sewage farm’ discharge to North Arm Creek was causing major odour and possible health problems, they developed an improved WWTP at Bolivar. The closing of the WWTP at Port Adelaide resulted from a better understanding of the environmental and amenity effects of that plant’s operations.
63
Port Waterways Water Quality Improvement Plan
With the high cost of achieving improvement in the Port waterways, better information needs to be used to guide decisions about capital expenditure or changes in operation of equipment. A more formal discipline than that applied in the past is needed, one that takes the interaction of different discharges into account.
3.8.2 Adaptive management approach and the WQIP
An adaptive management framework will be used to guide the development and implementation of the Port Waterways WQIP, including the use of tools that are being developed to manage the problem of nutrients. Additionally, it will provide stakeholders with a ‘road map’ so that the management can be communicated in a simple and transparent fashion.
Adaptive management in the WQIP aims to:
• find better ways of improving the health of the Port waterways
• identify key gaps in understanding of the system
• improve understanding of the ecosystem responses, thresholds and dynamics in order to adapt practices to fit changing social and economic values and ecological conditions
• integrate information about the whole of the waterways where appropriate, rather than focusing only on the immediate area around various discharges
• gain reliable feedback about the effectiveness of alternative policies/practices
• encourage innovation and learning
• pass on information and knowledge gained through experience
• foster an organisational culture that emphasises learning and responsiveness.
A schematic diagram of the adaptive management framework as it applies to nutrients in the Port waterways is shown in Figure 3.6. All six steps in the framework, as described below, must be undertaken for the successful application of adaptive management, and the omission of one or more will hamper the ability to learn from management actions.
In addition, documenting the key elements of each step and communicating results are crucial to building a ‘legacy of knowledge’. A revised WQIP will be developed toward the end of the present plan in 2011. However, it is important that the existing WQIP be monitored (refer Sections 4.3, 4.4) and managed and modified in the interim using this same framework in a review and reporting process (refer Section 4.2). The knowledge and experience that is being developed as monitoring and assessment of the waterways is undertaken needs to be available for use for some years—until the WQIP is reviewed and revised. The onus is on the EPA to undertake this management role for the Port Waterways WQIP.
Successful adaptive management of nutrients in the Port waterways will require that ongoing resources be applied to the WQIP to ensure that all stages of the cycle are undertaken on a regular basis. Failure to undertake this role will result in extra costs for:
• dischargers to the waterways, as nutrient reductions will not undertaken in an efficient manner
• the community, who will not have appropriate information available to judge whether the waterways are improving or not
• the ecosystem, as resources to improve the quality of the waterways may not be efficiently directed.
Conversely, diligent application of an adaptive management framework for the Port waterways will allow for achievement of agreed EVs in an efficient manner that is transparent to all stakeholders.
The WQIP will be implemented by the EPA in collaboration with SA Water, Penrice Soda Products, councils and the A&MLR NRM Board.
64
Port Waterways Water Quality Improvement Plan
Initial implementation of the WQIP will be heavily focused on the management of licences administered by the EPA. However, continued reduction of wastewater discharges by SA Water at Bolivar will require a broad approach where a number of stakeholders work together to increase the amount of wastewater reused. The Steering Committee should include members from all these stakeholders.
Oversight of the implementation of the WQIP (refer Table 3.1) will initially be provided through the existing Steering Committee. However, it is expected that there will joint management of the Port Waterways WQIP and implementation of the ACWS findings through a single steering group.
Objectives
Undertake Monitoring/ Modelling and Develop
Monitoring, including WQIP performance indicators to determine effectiveness of on-ground actions
Assess which actions have had the most impact
Report to community
Implement on ground works
Determine Environmental Values and Water Quality
Prioritised Action List
Figure 3.6 Adaptive management framework as it applies to nutrients in the Port waterways
65
Port Waterways Water Quality Improvement Plan Ta
ble
3.1
Su
mm
ary
of p
ollu
tant
man
agem
ent
acti
ons
1 Re
duce
Pen
rice
N d
isch
arge
to 5
75 t
/yea
r 20
06
2010
N
ot s
peci
fied
20
10 d
isch
arge
load
fro
mPe
nric
e at
575
t N
or
less
Pe
nric
e, E
PA
2 In
vest
igat
e op
tion
s fo
rfu
rthe
r N
red
ucti
on f
rom
Penr
ice
2006
20
10
Not
spe
cifi
ed
Prio
riti
sed
opti
ons
for
furt
her
disc
harg
ere
duct
ions
ref
lect
ed in
Penr
ice
EPA
licen
ceEn
viro
nmen
t Im
prov
emen
tPr
ogra
m
Penr
ice,
EPA
3 Re
duce
Pen
rice
N d
isch
arge
to 2
50 t
/yea
r 20
11
2015
N
ot s
peci
fied
20
15 d
isch
arge
load
fro
mPe
nric
e at
250
t N
or
less
Pe
nric
e, E
PA
4 In
vest
igat
e op
tion
s fo
rfu
rthe
r nu
trie
nt lo
addi
scha
rge
redu
ctio
n fr
omBo
livar
WW
TP
2007
20
09
Not
spe
cifi
ed
EPA
Boar
d ag
reem
ent
for
stra
tegy
for
nut
rien
tre
duct
ion
at B
oliv
arW
WTP
by
SA W
ater
SA W
ater
, EP
A
Max
imis
e re
-use
of
Boliv
arW
WTP
20
08
Ong
oing
N
ot s
peci
fied
N
ot d
efin
ed
SA W
ater
, EP
A AC
WS
6 D
efin
e op
tion
s fo
r P
redu
ctio
n fr
om B
oliv
arW
WTP
(if
req
uire
d)
2010
20
12
Not
spe
cifi
ed
Stra
tegy
for
P d
isch
arge
to
mee
t EV
s de
velo
ped
bySA
Wat
er
SA W
ater
, EP
A AC
WS
7 En
sure
tha
t co
des
ofpr
acti
ce a
imed
at
min
imis
ing
nutr
ient
s to
mar
ine
envi
ronm
ent
are
adhe
red
to
2007
O
ngoi
ng
Not
spe
cifi
ed
Not
def
ined
SA
Wat
er,
EPA
ACW
S
Lice
nsed
/reg
ulat
ed s
ourc
es a
nd a
ctiv
itie
s
# Po
lluti
on M
anag
emen
tA
ctio
n St
art
Fini
sh
Esti
mat
edco
sts
Mile
ston
es
Acc
ount
abili
ty
Part
ners
hip
linka
ge
ACW
S
A&M
LR N
RMB,
A&M
LR N
RMB,
A&M
LR N
RMB,
66
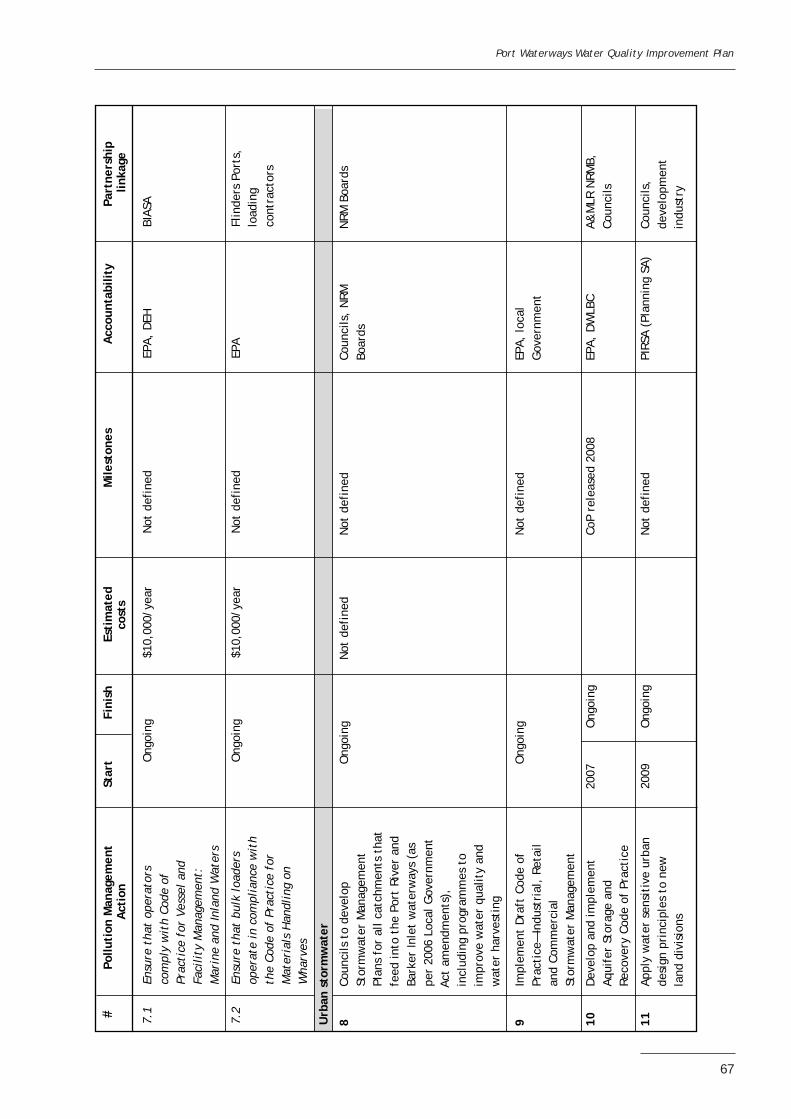
Port Waterways Water Quality Improvement Plan
# Po
lluti
on M
anag
emen
tA
ctio
n St
art
Fini
sh
Esti
mat
edco
sts
Mile
ston
es
Acc
ount
abili
ty
Part
ners
hip
linka
ge
7.1
Ensu
re t
hat
oper
ator
sO
ngoi
ng
$10,
000/
year
N
ot d
efin
ed
EPA,
DEH
BI
ASA
com
ply
wit
h Co
de o
fPr
acti
ce f
or V
esse
l an
dFa
cili
ty M
anag
emen
t:M
arin
e an
d In
land
Wat
ers
7.2
Ensu
re t
hat
bulk
loa
ders
Ong
oing
$1
0,00
0/ye
ar
Not
def
ined
EP
A Fl
inde
rs P
orts
,op
erat
e in
com
plia
nce
wit
hlo
adin
gth
e Co
de o
f Pr
acti
ce f
orco
ntra
ctor
s M
ater
ials
Han
dlin
g on
Wha
rves
Urb
an s
torm
wat
er
8 Co
unci
ls t
o de
velo
pO
ngoi
ng
Not
def
ined
N
ot d
efin
ed
Coun
cils
, N
RMN
RM B
oard
s St
orm
wat
er M
anag
emen
tBo
ards
Pl
ans
for
all c
atch
men
ts t
hat
feed
into
the
Por
t Ri
ver
and
Bark
er In
let
wat
erw
ays
(as
per
2006
Loc
al G
over
nmen
tAc
t am
endm
ents
),
incl
udin
g pr
ogra
mm
es t
oim
prov
e w
ater
qua
lity
and
wat
er h
arve
stin
g
9 Im
plem
ent
Dra
ft C
ode
ofO
ngoi
ng
Not
def
ined
EP
A, lo
cal
Prac
tice
—In
dust
rial
, Re
tail
Gov
ernm
ent
and
Com
mer
cial
Stor
mw
ater
Man
agem
ent
10
Dev
elop
and
impl
emen
t20
07
Ong
oing
Co
P re
leas
ed 2
008
EPA,
DW
LBC
A&M
LR N
RMB,
Aqui
fer
Stor
age
and
Coun
cils
Re
cove
ry C
ode
of P
ract
ice
11
Appl
y w
ater
sen
siti
ve u
rban
2009
O
ngoi
ng
Not
def
ined
PI
RSA
(Pla
nnin
g SA
) Co
unci
ls,
desi
gn p
rinc
iple
s to
new
deve
lopm
ent
land
div
isio
ns
indu
stry
67
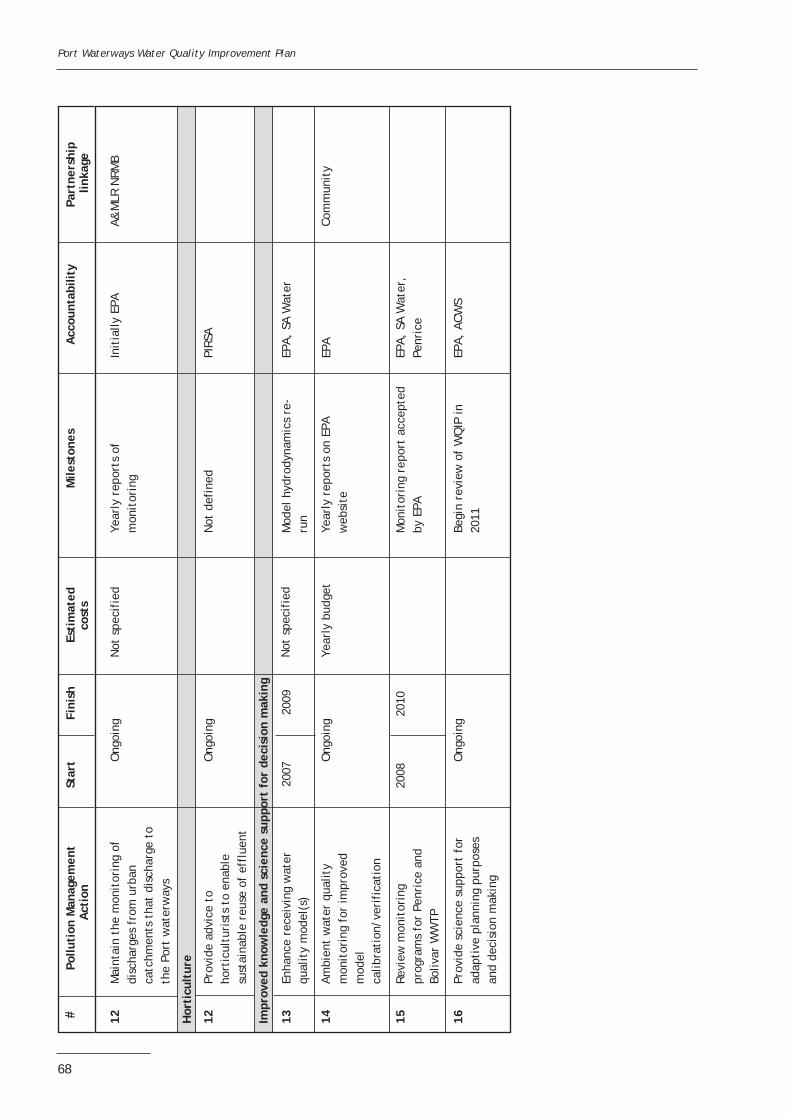
Port Waterways Water Quality Improvement Plan
# Po
lluti
on M
anag
emen
tA
ctio
n St
art
Fini
sh
Esti
mat
edco
sts
Mile
ston
es
Acc
ount
abili
ty
Part
ners
hip
linka
ge
12
Mai
ntai
n th
e m
onit
orin
g of
disc
harg
es f
rom
urb
anca
tchm
ents
tha
t di
scha
rge
toth
e Po
rt w
ater
way
s
Ong
oing
N
ot s
peci
fied
Year
ly r
epor
ts o
fm
onit
orin
g In
itia
lly E
PA
A&M
LR N
RMB
Hor
ticu
ltur
e
12
Prov
ide
advi
ce t
oho
rtic
ultu
rist
s to
ena
ble
sust
aina
ble
reus
e of
eff
luen
t
Ong
oing
N
ot d
efin
ed
PIRS
A
Impr
oved
kno
wle
dge
and
scie
nce
supp
ort
for
deci
sion
mak
ing
13
Enha
nce
rece
ivin
g w
ater
qual
ity
mod
el(s
) 20
07
2009
N
ot s
peci
fied
M
odel
hyd
rody
nam
ics
re
run
EPA,
SA
Wat
er
14
Ambi
ent
wat
er q
ualit
ym
onit
orin
g fo
r im
prov
edm
odel
calib
rati
on/v
erif
icat
ion
Ong
oing
Ye
arly
bud
get
Year
ly r
epor
ts o
n EP
Aw
ebsi
te
EPA
Com
mun
ity
15
Revi
ew m
onit
orin
gpr
ogra
ms
for
Penr
ice
and
Boliv
ar W
WTP
2008
20
10
Mon
itor
ing
repo
rt a
ccep
ted
by E
PA
EPA,
SA
Wat
er,
Penr
ice
16
Prov
ide
scie
nce
supp
ort
for
adap
tive
pla
nnin
g pu
rpos
esan
d de
cisi
on m
akin
g
Ong
oing
Be
gin
revi
ew o
f W
QIP
in20
11
EPA,
ACW
S
68
Port Waterways Water Quality Improvement Plan
4 MONITORING THE WQIP IMPLEMENTATION
4.1 Introduction
In the past, management of water quality in the Port waterways was focused on reducing nutrients to the maximum extent deemed achievable. This approach was successful as the nutrient loadings to the waterways were very high, and any possible reduction was a step in the right direction. Ambient monitoring of the waterways showed that the area was under stress, and nutrient load reductions clearly reduced this stress. Although this approach has resulted in very significant reductions in the nutrient loads to the waterways, it did not help in understanding the level of load that the waterways could sustain in the long term.
The WQIP has been developed from a slightly different point of view. It has begun by asking the community ‘what should the waterways environment be like?’. This has enabled clear definition of the gap between the present situation and the goal. Consistent with this approach, monitoring of the implementation of the WQIP will need to be different to that in the past. Rather than monitoring to see if stakeholders are doing as well as they can, the WQIP requires monitoring to inform us how close we are to the required loadings. Rather than ask ‘how far have we come?’ we are now able to ask ‘are we there yet?’, or ‘how far have we still to go?’.
To do this, monitoring must coordinate information about the following:
• the nutrient loads discharged to the waterway
• what the managers are doing about the loads
• the extent to which the waterways environment is reflecting its community-derived values.
In practice, this means that although much of the same information needs to be collected, the assessment and reporting of it will be better coordinated and communicated.
The coordinated system where this information is used to help decide how best to manage the water quality of the waterways is called a decision support system (DSS), which is any type of information system that supports decision making. For the WQIP, the DSS is the computer model.
4.2 Water quality modelling strategy
The existing model output is sufficient to allow the development of plans to reduce loads from the two major dischargers. However, Penrice and SA Water will need to have better information available to them as they implement the design of specific changes to their plants to reduce discharges.
This will require that the existing model be developed in the following ways:
• Run for summer scenarios to give an understanding of the optimum discharge flows in this season, supplementing the work already done on winter flows. This will be of particular importance to SA Water, where water reuse in summer substantially reduces the nutrient loading to the waterways. Design engineers need to understand the likely effect of this in order to work out the most cost-effective approaches to reduce nutrient loads at critical times.
• Re-run with flows that reflect the latest understanding of seasonal flows from local catchments and discharges.
In addition, information required to monitor the effectiveness of the implementation of the WQIP includes monitoring of Ulva/macroalgae. The WQOs developed for the Port waterways through public consultation list the reduction in the seasonal presence of large amounts of Ulva spp. as a key outcome.
69
Port Waterways Water Quality Improvement Plan
However, Ulva spp. and other macroalgae absorb large amounts of nutrients from the water in the Port waterways and convert this to biomass. The existing water quality model uses measurement of chlorophyll to assess nutrient uptake. Without direct measurement of the biomass, the nutrient concentration and the extent of Ulva spp. and other macroalgae, the effect of this uptake and release on the nutrient balance of the waterways derived from the DSS is likely to be inaccurate. Therefore, these additional measurements will be required. Information will also be required on the effects of changing physico-chemical conditions, particularly seasonal turbulence and light penetration.
Development of the DSS will therefore require that this be included.
4.3 Water quality monitoring programs
It is proposed that the DSS will be operated and improved over time by the EPA. A high degree of consultation will be undertaken between EPA modellers and stakeholders to ensure that capital programs to reduce nutrient loads are developed with access to the best available information.
Current monitoring programs, which are a source of information for reviewing the progress of WQIP implementation, include:
• An EPA marine ambient water quality monitoring program, which has been undertaken for the last 10 years. Monitoring locations for the program in the Port waterways are shown on Figure 4.1. As discharge loads are reduced, the observed concentrations of nutrients will be compared to those predicted by the DSS. Monitoring data will be continually reviewed and reported (refer Section 5) and the program modified as necessary. The locations of sampling sites offshore of the Bolivar WWTP discharge may be reviewed as a result of the findings of the ACWS.
• Monitoring of the major point sources, particularly Penrice and the Bolivar WWTP, which will continue in accordance with EPA license conditions.
• Catchment monitoring, with the current catchment monitoring and flow gauging programs providing information about the state of the catchment and the success of both the catchment water management plans and the large constructed wetlands at Gillman. The monitoring of water nutrient quality across most of the catchments that discharge to the Port waterways was achieved through a project associated with the development of the WQIP. Five new or significantly upgraded monitoring stations were developed as part of this work, which has delivered information about the loads of nutrients and other pollutants entering the waterways from diffuse stream-flow and stormwater sources from the northern section of the catchment.
As described in the Stage 1 report (EPA 2005a), previous investigations that have provided data on nutrient inputs to the waterways from specific activities include, for example:
• landfill studies, including Wingfield and Garden Island
• Gillman wetland studies (Magazine Creek, Range and Barker Inlet wetlands)
• various environmental impact statements (eg PASA Pipeline EIS) and specific studies (eg on heavy metals and dolphins).
4.4 Monitoring implementation of the WQIP
Water quality monitoring is required to allow appropriate management, and is achieved through determining (in order of priority):
• the effectiveness of management actions
• better estimates of current pollutant loads
• how to improve the predictive modelling ability of resource managers.
70
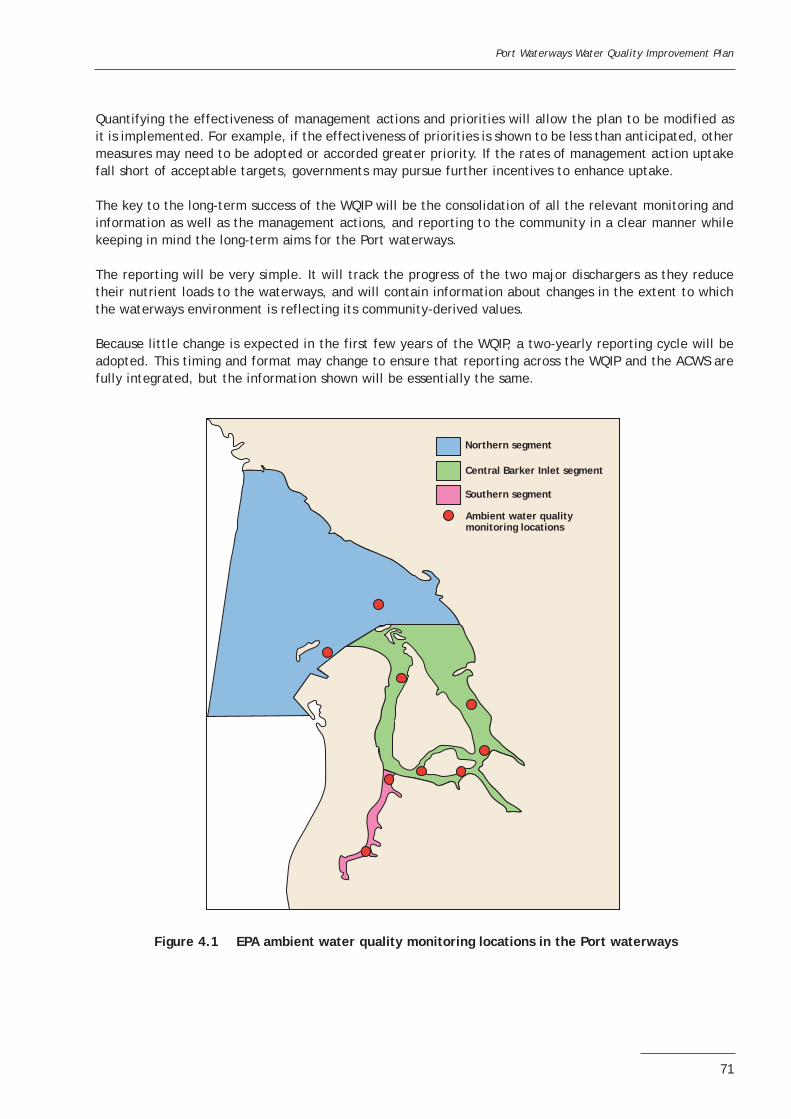
Port Waterways Water Quality Improvement Plan
Quantifying the effectiveness of management actions and priorities will allow the plan to be modified as it is implemented. For example, if the effectiveness of priorities is shown to be less than anticipated, other measures may need to be adopted or accorded greater priority. If the rates of management action uptake fall short of acceptable targets, governments may pursue further incentives to enhance uptake.
The key to the long-term success of the WQIP will be the consolidation of all the relevant monitoring and information as well as the management actions, and reporting to the community in a clear manner while keeping in mind the long-term aims for the Port waterways.
The reporting will be very simple. It will track the progress of the two major dischargers as they reduce their nutrient loads to the waterways, and will contain information about changes in the extent to which the waterways environment is reflecting its community-derived values.
Because little change is expected in the first few years of the WQIP, a two-yearly reporting cycle will be adopted. This timing and format may change to ensure that reporting across the WQIP and the ACWS are fully integrated, but the information shown will be essentially the same.
Ambient water quality monitoring locations
Northern segment
Southern segment
Central Barker Inlet segment
Figure 4.1 EPA ambient water quality monitoring locations in the Port waterways
71
Port Waterways Water Quality Improvement Plan
5 REPORTING AND REVIEW
5.1 Introduction
A regular reporting and review process is of great importance to the success of the WQIP over the next few years. It will enable use to be made of the growing understanding of the plan’s ability to efficiently target resources and reduce nutrients.
Successive reviews of the WQIP will be undertaken within the adaptive management framework outlined in Section 3.8. This framework will be used for tracking and managing the WQIP process within the review periods.
Without this level of management, decisions made on nutrient reduction strategies may be either insufficient or overdone. Both of these outcomes represent inappropriate use of resources by the range of stakeholders expected to make considerable commitments to implementation of the WQIP.
5.2 WQIP reporting and review process
Two-yearly reports will be produced as part of the adaptive management approach, describing progress in plan implementation, results of monitoring and research activities, consultations with stakeholders and the public, actions of government agencies, and any externally generated changes affecting the Port waterways water quality. The reports will be provided for public inspection and comment through web-based means.
The process will be as follows:
• The information compiled in the Stage 1 report will be reviewed at two-yearly intervals and communicated to the community using tools such as the report card being developed as part of the evaluation step (step 5) of the WQIP adaptive management cycle. An initial report will be compiled following the development of the WQIP in early 2009. Further reports in early 2011 will be necessary to keep stakeholders informed of the status of the waterways, although the development of an Adelaide coastal WQIP will likely result in an amended reporting strategy.
• This will provide an opportunity to assess and further understand developments such as incremental discharge reductions, the flux of nutrients to and from sediments, and discharges from catchments to the waterways. Monitoring of the development of blooms and nuisance organisms (eg Ulva spp., Caulerpa spp. and dinoflagellates) will also be used to review assessment of the waterways.
• There is some minor uncertainty in the final target loads because of some assumptions used in the model. The target loads should be reviewed and, if necessary, modified during the life of the WQIP as better information becomes available from monitoring programs and advances in modelling. The decision support system (DSS) will be revisited to compare the upgraded assessment with previous outputs. These reassessments would occur during 2009 and 2011 in line with the publishing of the reports, and any modifications to make the process more efficient will be negotiated. Further development of the DSS (through the provision of better data) will occur over the life of the WQIP, and will enable increasing understanding of the system to be used to finetune management actions and possibly reorder priorities.
• Monitoring of the waterways will continue, with new initiatives and any modification of monitoring programs guided by the aims of the WQIP. The development of monitoring systems to enable assessment of whether environmental values (EVs) are being protected and/or achieved will also be undertaken during implementation of the WQIP. This will require a review of the water quality objectives (WQOs) and key performance indicators.
The WQOs and EVs have been defined for three separate segments in the Port waterways (refer Section 2, Figure 2.2)
72
Port Waterways Water Quality Improvement Plan
The key performance indicators demonstrating that the defined WQOs are being achieved are:
• reductions in total nitrogen (N) and total phosphorus (P) concentrations in samples collected for the ambient water quality monitoring program of the Port waterways
• appropriate reductions in both the collective nutrient loads and the nutrient loads discharged in each of the three defined segments of the waterways
• industrial inputs to the waterways that meet license conditions:
– Penrice to reduce ammonia emissions to target levels or lower
– Bolivar WWTP to reduce total N and P loads in effluent discharged to Gulf St Vincent (Northern Barker Inlet).
• no further mangrove decline, and evidence of mangrove recovery in areas experiencing die-back
• continued presence of a healthy population of dolphins
• reduced number and severity of phytoplankton blooms
• reductions in the extent and biomass of Ulva spp.
While some of the monitoring may be carried out by the EPA, it is more likely that this work will be undertaken collaboratively with other organisations such as the Department for Environment and Heritage, the South Australian Research and Development Institute, A&MLR NRM Board, etc. It will also include assessment of the effects of urban, industrial and infrastructure development of the area.
• Monitored information will be compared with the predictions of the DSS and any emerging trends taken into account. Monitoring undertaken by a range of organisations for other aims may be able to be used to assist with understanding of the waterways as part of this regular evaluation process.
• Practices, objectives and the models (including the DSS) used to make forecasts will be adjusted to reflect new understanding. While this may well be based on technical issues associated with the indicators of the waterway’s health, this step needs to go further. The adjustment process will require all stakeholders to develop an understanding of how the waterways are responding to the management regime. This will therefore need to occur during 2008 and 2010 because Penrice and SA Water will be negotiating their discharge license requirements, and these will need to take into account and be assessed against the upgraded evaluation of the waterways. Development proposals for the area will also need to be evaluated for their effect on the nutrient processes in the waterways, and adjusted if necessary to ensure that work undertaken by other stakeholders is not compromised.
• As a result of the findings of the ACWS, SA Water will be developing a targeted strategy of treatment plant upgrades. The ACWS findings in 2008 will begin this process. It is expected that the 2009 report to the community will include details of any changes at Bolivar and their likely timing, which may have an impact on further reporting of the WQIP.
• A full review of the WQIP will be scheduled for 2011 although it is likely that the development of a WQIP to implement the findings of the ACWS will include the Port Waterways WQIP, resulting in amended timeframes and possibly amended activities. It is intended that the following elements of management of the water quality of the Port waterways will be reviewed:
– WQOs, load targets and load allocations. This will involve comprehensive consultation with all stakeholders and the review of other relevant factors in the waterways that may have emerged.
– Environmental flow objectives and regimes, and allocations. Although the present WQIP has not identified flow within the waterways as an issue, further information may be available at this time that may alter the priority of this aspect.
– The DSS, including updated discharge information and further developments in the understanding of factors that affect the water quality of the waterways.
– The monitoring of catchment and other non-point sources for confirmation of inputs to the WQIP.
This review will require significant public involvement as well as input from other stakeholders such as industries and management authorities.
73
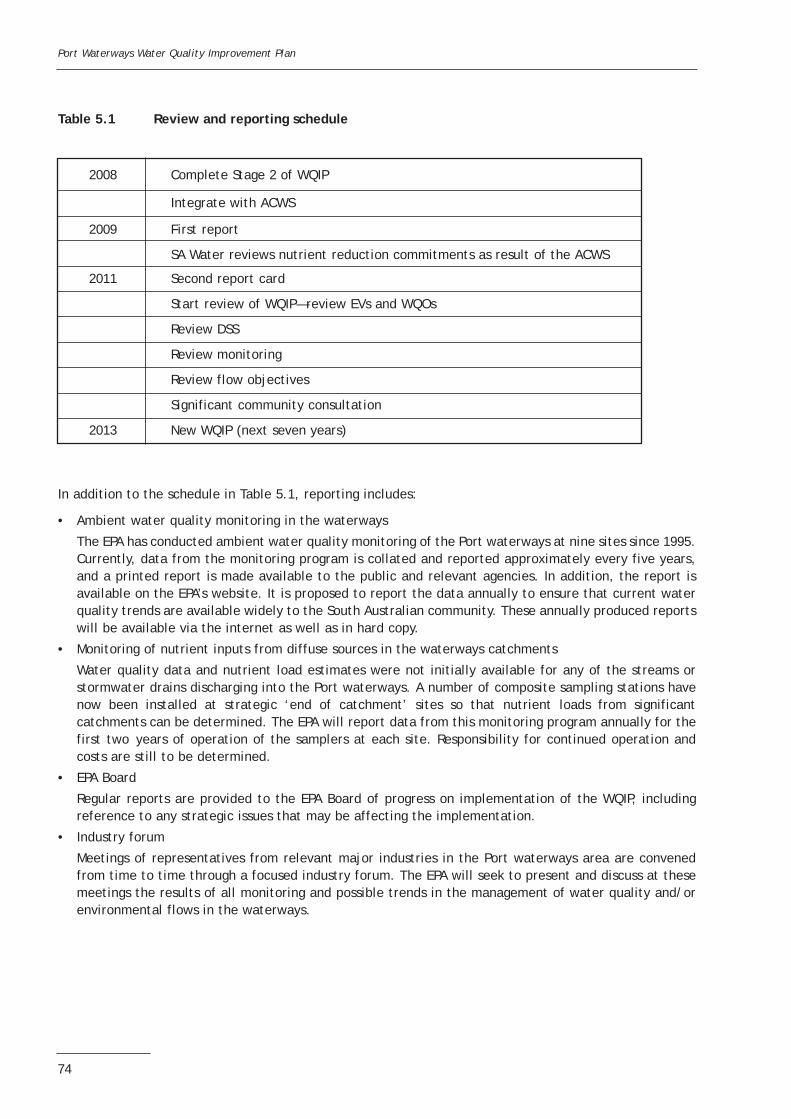
Port Waterways Water Quality Improvement Plan
Table 5.1 Review and reporting schedule
2008 Complete Stage 2 of WQIP
Integrate with ACWS
2009 First report
SA Water reviews nutrient reduction commitments as result of the ACWS
2011 Second report card
Start review of WQIP—review EVs and WQOs
Review DSS
Review monitoring
Review flow objectives
Significant community consultation
2013 New WQIP (next seven years)
In addition to the schedule in Table 5.1, reporting includes:
• Ambient water quality monitoring in the waterways
The EPA has conducted ambient water quality monitoring of the Port waterways at nine sites since 1995. Currently, data from the monitoring program is collated and reported approximately every five years, and a printed report is made available to the public and relevant agencies. In addition, the report is available on the EPA’s website. It is proposed to report the data annually to ensure that current water quality trends are available widely to the South Australian community. These annually produced reports will be available via the internet as well as in hard copy.
• Monitoring of nutrient inputs from diffuse sources in the waterways catchments
Water quality data and nutrient load estimates were not initially available for any of the streams or stormwater drains discharging into the Port waterways. A number of composite sampling stations have now been installed at strategic ‘end of catchment’ sites so that nutrient loads from significant catchments can be determined. The EPA will report data from this monitoring program annually for the first two years of operation of the samplers at each site. Responsibility for continued operation and costs are still to be determined.
• EPA Board
Regular reports are provided to the EPA Board of progress on implementation of the WQIP, including reference to any strategic issues that may be affecting the implementation.
• Industry forum
Meetings of representatives from relevant major industries in the Port waterways area are convened from time to time through a focused industry forum. The EPA will seek to present and discuss at these meetings the results of all monitoring and possible trends in the management of water quality and/or environmental flows in the waterways.
74
Port Waterways Water Quality Improvement Plan
REFERENCES
ANZECC 1992, Australian Water Quality Guidelines for Fresh and Marine Waters, Australian and New Zealand Environment and Conservation Council, Canberra.
ANZECC 2000, Australian and New Zealand Water Quality Guidelines for Fresh and Marine Waters, Environment Australia, Canberra.
South Australian Environment Protection Authority 2002, Ambient Water Quality Monitoring: Port River Estuary, September 1995–August 2000, EPA, Adelaide.
— —2003, Environment Protection (Water Quality) Policy and Explanatory Report 2003 EPA, Adelaide.
— —2005a, Port Waterways Water Quality Improvement Plan Stage 1, EPA, Adelaide.
— —2005b, A Tradeable Rights Instrument to Reduce Nutrient Pollution in the Port Waterways, EPA, Adelaide.
— —2005c, Setting Environmental Values for the Port Waterways, EPA, Adelaide.
— —2005d, Nutrient Flux Assessment in the Port Waterways, EPA, Adelaide.
Penrice Soda Products 2001, Penrice Soda products Osborne Manufacturing Facility 5–Year Environmental Improvement Program to the EPA.
— —2002, Annual Review November 2003 of Penrice Soda Products Osborne Manufacturing Facility Ammonia Reduction Environmental Improvement Program.
PPK Consultants 1992, Gillman/Dry Creek Urban Development Proposal Draft Environmental Impact Statement (for the Premier of South Australia), Prepared For EWS Dept.
Sinclair Knight Merz 2001, The Catchment Water Management Plan 2001–2006, Report prepared for the Northern Adelaide and Barossa Catchment Water Management Board.
Tonkin Engineering and Science 2004, Catchment Water Management Plan 2002–2007, Report prepared for Torrens Catchment Water Management Board.
WaterCare et al 2005, Water Proofing Adelaide—A Thirst for Change 2005–2025, Report for the Government of South Australia.
Wilkinson, J et al 2005, Adelaide Coastal Waters Study Technical Report 3, EPA, Adelaide.
75
Port Waterways Water Quality Improvement Plan
GLOSSARY
ACWS Adelaide Coastal Waters Study
A&MLR Adelaide and Mount Lofty Ranges
A&MLR NRM Board Adelaide and Mount Lofty Ranges Natural Resources Management Board
ANZECC Australian and New Zealand Environment and Conservation Council
ASR aquifer storage and recovery
BIASA Boating Industry Association of South Australia
BIPEC Barker Inlet Port Estuary Committee
CCI Coastal Catchments Initiative
CDM community discussion meeting
CWMB Catchment Water Management Board
DAFF dissolved air flotation filtration
DEH Department of Environment and Heritage
DSS decision support system
DWLBC Department of Water, Land and Biodiversity Conservation
EIP environment improvement program
EIS environmental impact statement
EMS environmental management system
EMP environmental management plan
EV environmental value
HEP Hindmarsh–Enfield–Prospect (drain)
LMC Land Management Corporation
NABCWMB Northern Adelaide and Barossa Catchment Water Management Board
NH4 ammonia/ammonium
NHT Natural Heritage Trust
NRM natural resources management
NWQMS National Water Quality Management Strategy
PAEC Port Adelaide Enfield Council
PAR plan amendment report
PASA Pipeline Authority of South Australia
76
Port Waterways Water Quality Improvement Plan
PIRSA Primary Industries and Resources South Australia
PWWQIP Port Waterways Water Quality Improvement Plan
EPA South Australian Environment Protection Authority
SRP solids recovery plant
t/year tonnes per year
TCWMB Torrens Catchment Water Management Board
TDS total dissolved solids
TN total nitrogen
TP total phosphorus
TRDA Torrens Road Drainage Authority
USMP urban stormwater management plan
VPS Virginia Pipeline Scheme
WQIP water quality improvement plan
WQO water quality objective
WRSV Water Reticulation Services Virginia
WSUD water saving urban design
WWMC Wingfield Waste Management Centre
WWTP wastewater treatment plant
77