Embed Size (px)
Citation preview
Port Terminal Operations Tomorrow Port investment and operations in the era of mega carriers and contested markets EATON SMART HONG KONG HOTEL 19 October 2012
Dr Jonathan Beard, Eric Jin Xiaobin, Jolke Helbing, Jamie Simpson

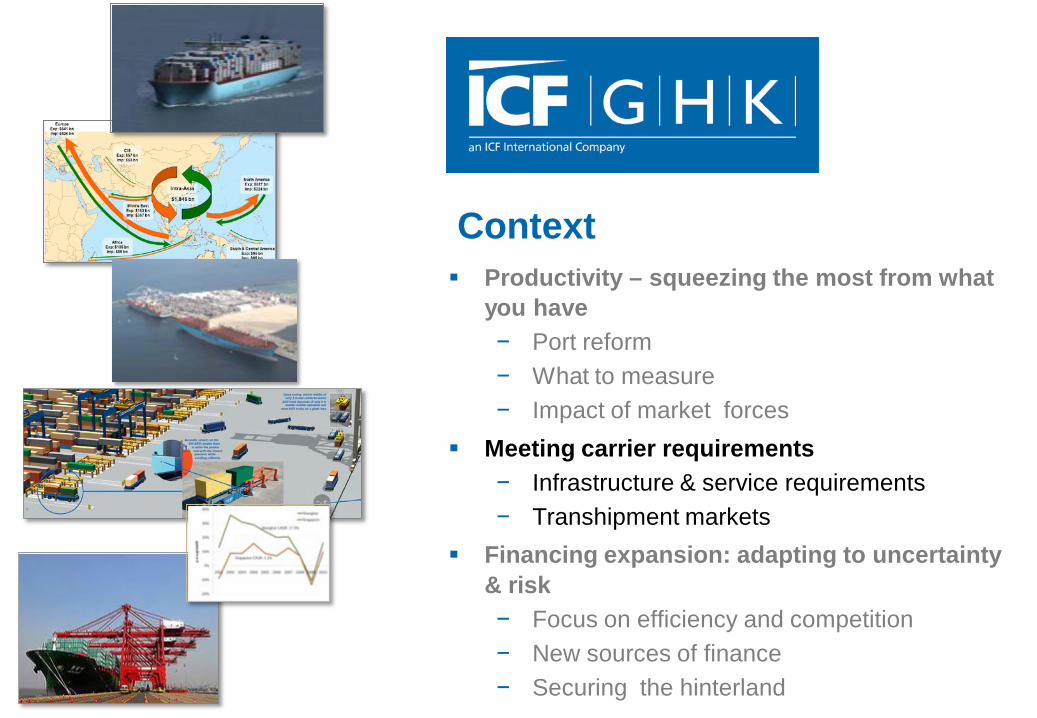
Productivity – squeezing the most from what
you have − Port reform − What to measure − Impact of market forces
Meeting carrier requirements − Infrastructure & service requirements − Transhipment markets
Financing expansion: adapting to uncertainty & risk − Focus on efficiency and competition − New sources of finance − Securing the hinterland
Context

icfi.com | ghkint.com icfi.com | ghkint.com
Port Performance
Global performance metric:
India – Nhava Sheva BOT Productivity 3x versus the state run alternatives Greater reliability & service levels
South China Private sector negotiated concessions with international terminal
operators (ITOs) Stimulate competition by multiple operators Most productive terminals in the world
1960s 2000s Productivity (‘000 mt/m of quay/yr) ~1,000 20,000+ % of ocean going ship time in port 60% 25%
Improvements across a range of markets
icfi.com | ghkint.com icfi.com | ghkint.com
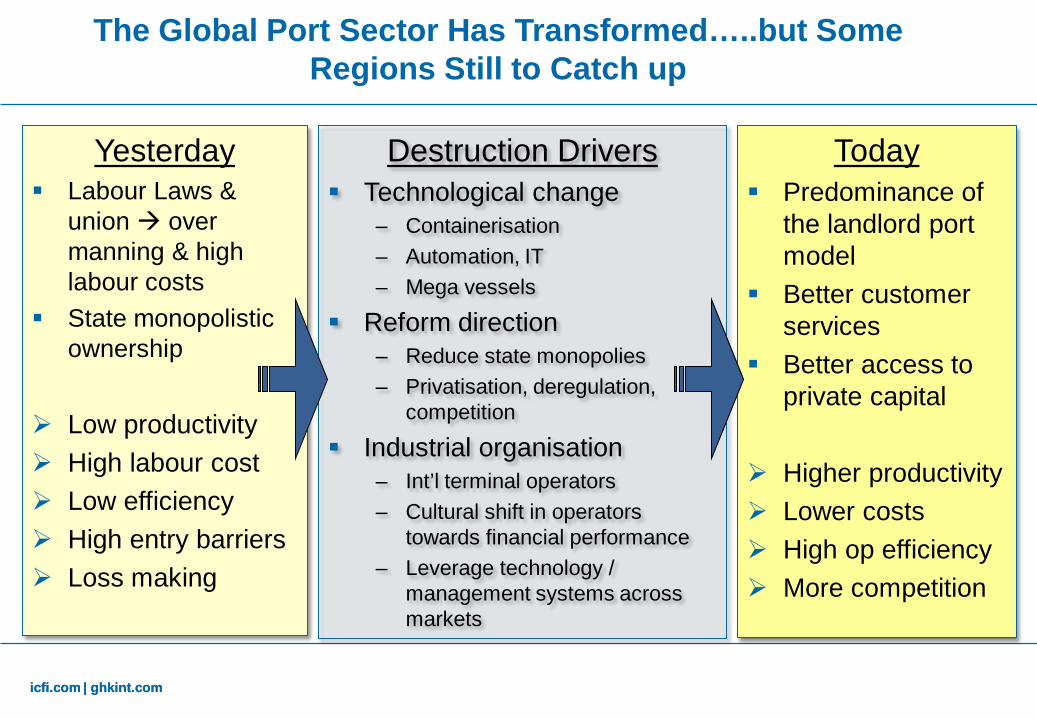
Today Predominance of
the landlord port model
Better customer services
Better access to private capital
Higher productivity Lower costs High op efficiency More competition
Yesterday Labour Laws &
union over manning & high labour costs
State monopolistic ownership
Low productivity High labour cost Low efficiency High entry barriers Loss making
Destruction Drivers Technological change
– Containerisation – Automation, IT – Mega vessels
Reform direction – Reduce state monopolies – Privatisation, deregulation,
competition
Industrial organisation – Int’l terminal operators – Cultural shift in operators
towards financial performance – Leverage technology /
management systems across markets
The Global Port Sector Has Transformed…..but Some Regions Still to Catch up
icfi.com | ghkint.com
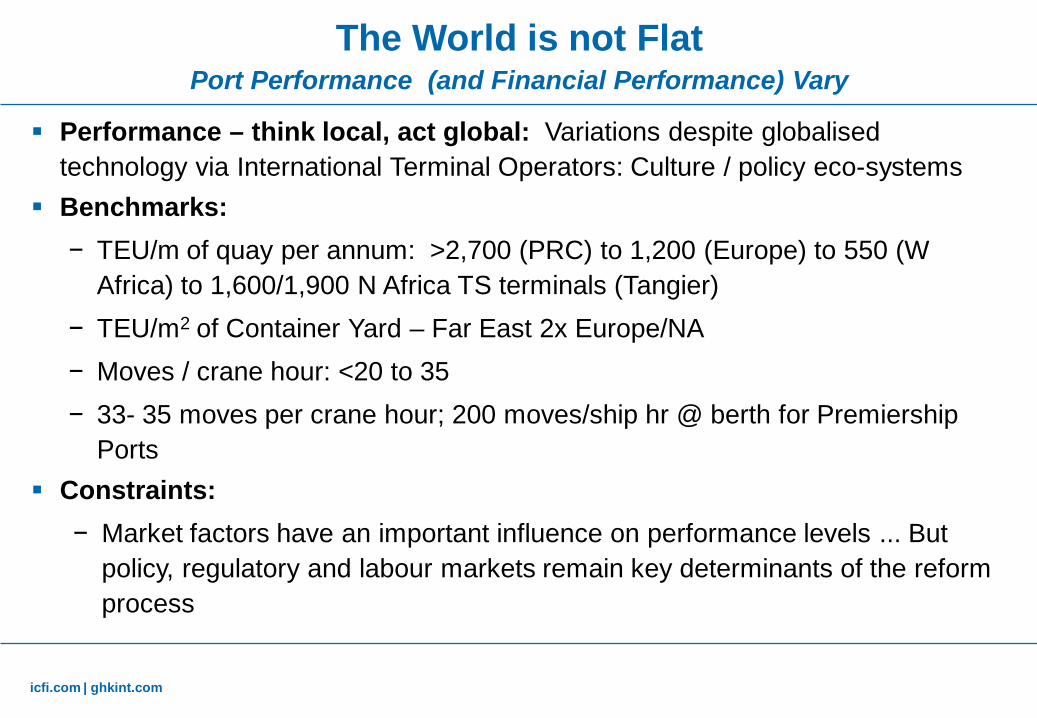
The World is not Flat Port Performance (and Financial Performance) Vary
Performance – think local, act global: Variations despite globalised technology via International Terminal Operators: Culture / policy eco-systems
Benchmarks: − TEU/m of quay per annum: >2,700 (PRC) to 1,200 (Europe) to 550 (W
Africa) to 1,600/1,900 N Africa TS terminals (Tangier) − TEU/m2 of Container Yard – Far East 2x Europe/NA − Moves / crane hour: <20 to 35 − 33- 35 moves per crane hour; 200 moves/ship hr @ berth for Premiership
Ports Constraints:
− Market factors have an important influence on performance levels ... But policy, regulatory and labour markets remain key determinants of the reform process
icfi.com | ghkint.com icfi.com | ghkint.com
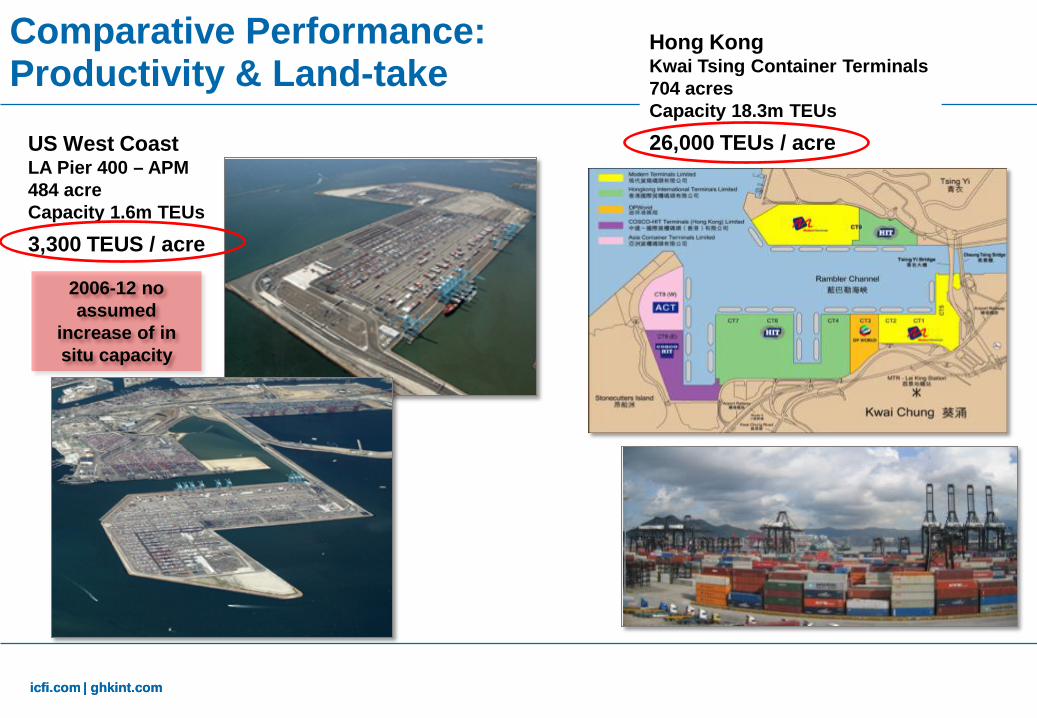
Hong Kong Kwai Tsing Container Terminals 704 acres Capacity 18.3m TEUs
26,000 TEUs / acre
US West Coast LA Pier 400 – APM 484 acre Capacity 1.6m TEUs
3,300 TEUS / acre
Comparative Performance: Productivity & Land-take
2006-12 no assumed
increase of in situ capacity
icfi.com | ghkint.com icfi.com | ghkint.com
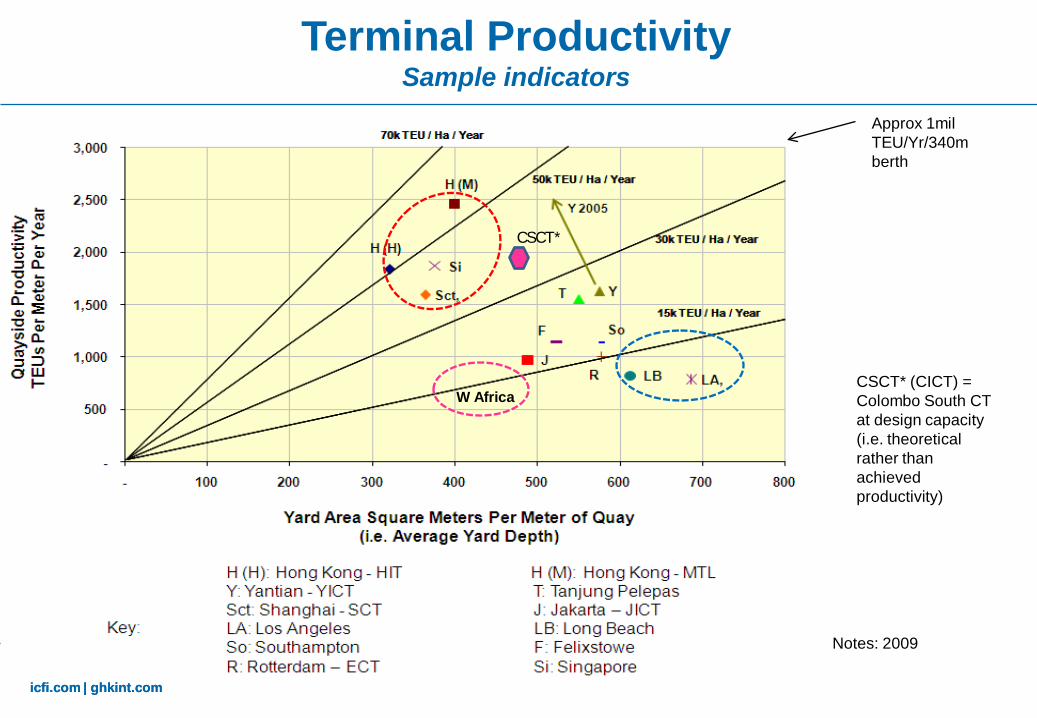
Terminal Productivity Sample indicators
Notes: 2009
Approx 1mil TEU/Yr/340m berth
CSCT*
CSCT* (CICT) = Colombo South CT at design capacity (i.e. theoretical rather than achieved productivity)
W Africa
icfi.com | ghkint.com
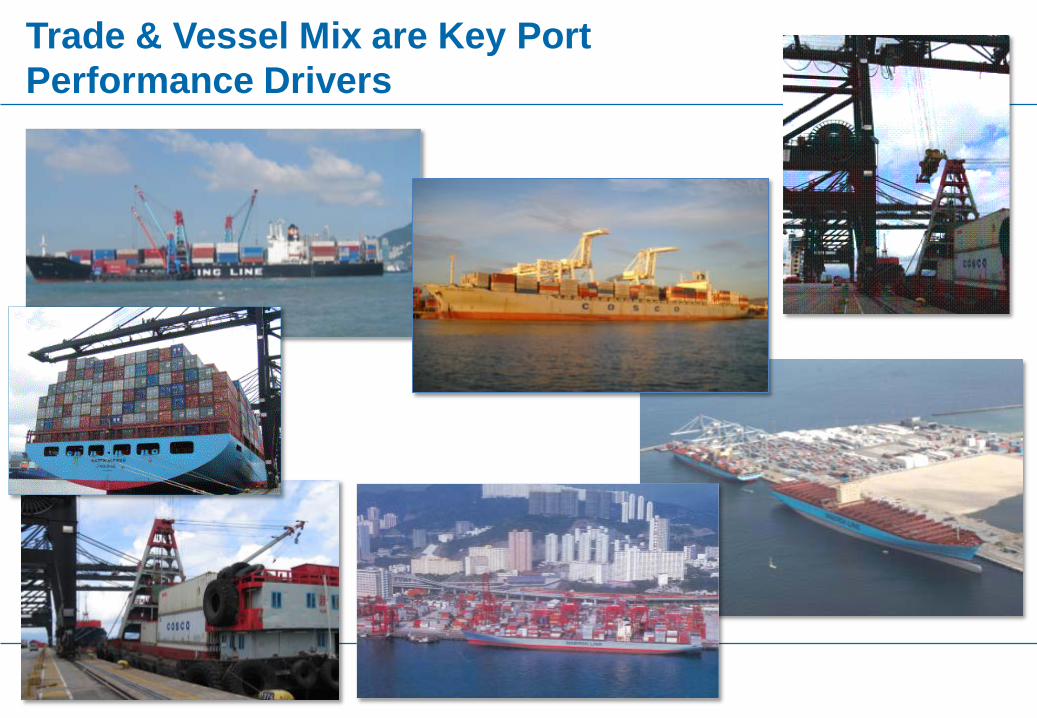
Trade & Vessel Mix are Key Port Performance Drivers
icfi.com | ghkint.com icfi.com | ghkint.com
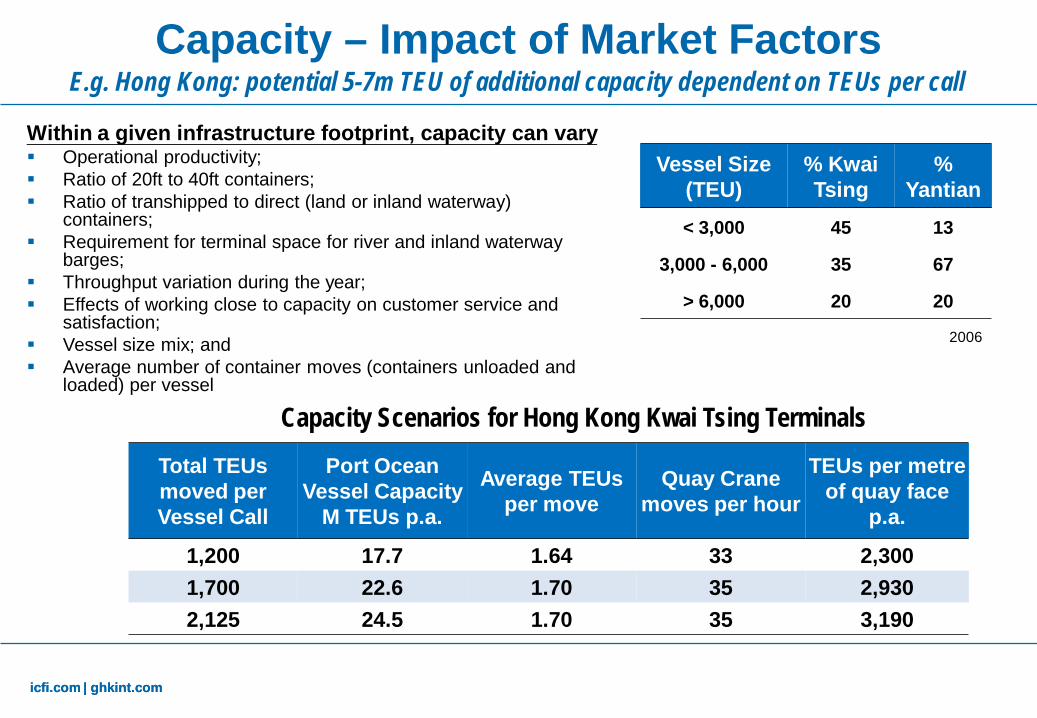
Capacity – Impact of Market Factors
Capacity Scenarios for Hong Kong Kwai Tsing Terminals
E.g. Hong Kong: potential 5-7m TEU of additional capacity dependent on TEUs per call
Vessel Size (TEU)
% Kwai Tsing
% Yantian
< 3,000 45 13
3,000 - 6,000 35 67
> 6,000 20 20
Total TEUs moved per Vessel Call
Port Ocean Vessel Capacity
M TEUs p.a.
Average TEUs per move
Quay Crane moves per hour
TEUs per metre of quay face
p.a.
1,200 17.7 1.64 33 2,300 1,700 22.6 1.70 35 2,930 2,125 24.5 1.70 35 3,190
Within a given infrastructure footprint, capacity can vary Operational productivity; Ratio of 20ft to 40ft containers; Ratio of transhipped to direct (land or inland waterway)
containers; Requirement for terminal space for river and inland waterway
barges; Throughput variation during the year; Effects of working close to capacity on customer service and
satisfaction; Vessel size mix; and Average number of container moves (containers unloaded and
loaded) per vessel
2006
icfi.com | ghkint.com icfi.com | ghkint.com
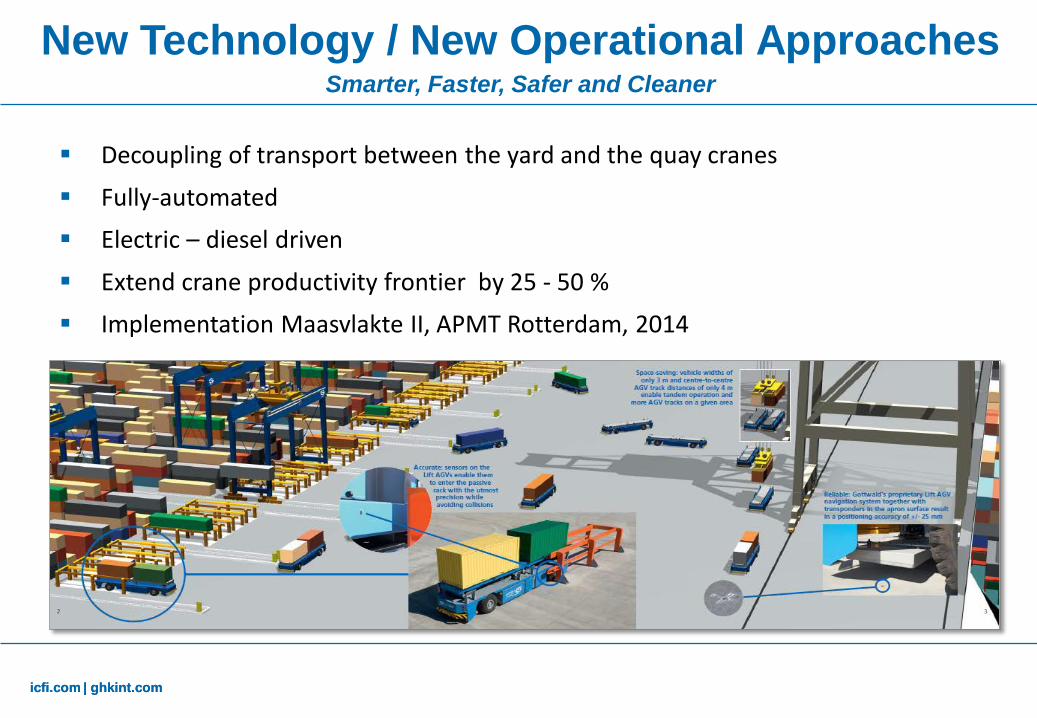
New Technology / New Operational Approaches Smarter, Faster, Safer and Cleaner
Decoupling of transport between the yard and the quay cranes
Fully-automated
Electric – diesel driven
Extend crane productivity frontier by 25 - 50 %
Implementation Maasvlakte II, APMT Rotterdam, 2014
Productivity – squeezing the most from what
you have − Port reform − What to measure − Impact of market forces
Meeting carrier requirements − Infrastructure & service requirements − Transhipment markets
Financing expansion: adapting to uncertainty & risk − Focus on efficiency and competition − New sources of finance − Securing the hinterland
Context
icfi.com | ghkint.com icfi.com | ghkint.com
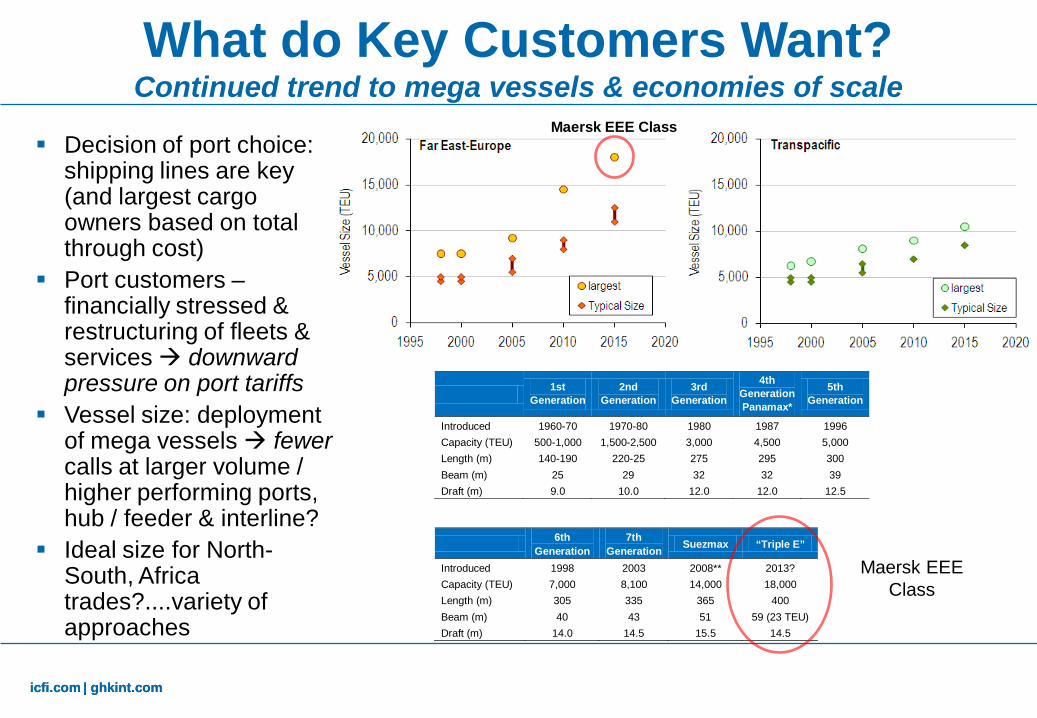
1st Generation
2nd Generation
3rd Generation
4th GenerationPanamax*
5th Generation
Introduced 1960-70 1970-80 1980 1987 1996 Capacity (TEU) 500-1,000 1,500-2,500 3,000 4,500 5,000 Length (m) 140-190 220-25 275 295 300 Beam (m) 25 29 32 32 39 Draft (m) 9.0 10.0 12.0 12.0 12.5
6th Generation
7th Generation Suezmax “Triple E”
Introduced 1998 2003 2008** 2013? Capacity (TEU) 7,000 8,100 14,000 18,000 Length (m) 305 335 365 400 Beam (m) 40 43 51 59 (23 TEU) Draft (m) 14.0 14.5 15.5 14.5
Decision of port choice: shipping lines are key (and largest cargo owners based on total through cost)
Port customers – financially stressed & restructuring of fleets & services downward pressure on port tariffs
Vessel size: deployment of mega vessels fewer calls at larger volume / higher performing ports, hub / feeder & interline?
Ideal size for North-South, Africa trades?....variety of approaches
Maersk EEE Class
Maersk EEE Class
What do Key Customers Want? Continued trend to mega vessels & economies of scale

icfi.com | ghkint.com
To Play the Game You Must Invest “Build it and they will come?”…but no guarantees biggest vessels will call
• Major shipping lines demand performance gains – 30+ moves per crane hour: 200 moves/ship hr @ berth for larger vessels – Reliable berth windows and turnaround time
• CAPEX for mega-vessels – 16-17m water depth – long straight quays (1,200 – 2,000 m) – outreach for 24 across – land (25ha/400m berth) – inland connectivity (for gateway ports)
• Major hub (and some gateway) ports must efficiently accommodate a variety of vessels sizes (e.g. from feeder / barges to mother vessels) - flexibility in design
• Risk/reward: investment requirements are higher but in the absence of significant Import/Export (I/E) cargo, incentives for largest vessels to call may be insufficient – challenge for transhipment hubs
icfi.com | ghkint.com icfi.com | ghkint.com
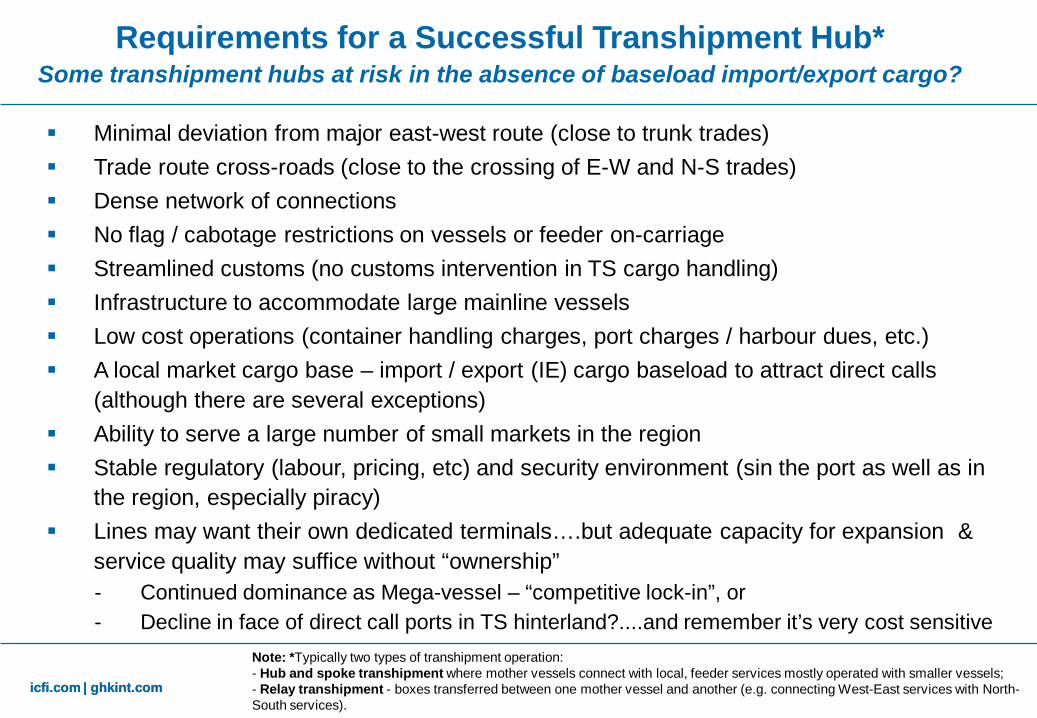
Requirements for a Successful Transhipment Hub* Some transhipment hubs at risk in the absence of baseload import/export cargo?
Note: *Typically two types of transhipment operation: - Hub and spoke transhipment where mother vessels connect with local, feeder services mostly operated with smaller vessels; - Relay transhipment - boxes transferred between one mother vessel and another (e.g. connecting West-East services with North-South services).
Minimal deviation from major east-west route (close to trunk trades) Trade route cross-roads (close to the crossing of E-W and N-S trades) Dense network of connections No flag / cabotage restrictions on vessels or feeder on-carriage Streamlined customs (no customs intervention in TS cargo handling) Infrastructure to accommodate large mainline vessels Low cost operations (container handling charges, port charges / harbour dues, etc.) A local market cargo base – import / export (IE) cargo baseload to attract direct calls
(although there are several exceptions) Ability to serve a large number of small markets in the region Stable regulatory (labour, pricing, etc) and security environment (sin the port as well as in
the region, especially piracy) Lines may want their own dedicated terminals….but adequate capacity for expansion &
service quality may suffice without “ownership” - Continued dominance as Mega-vessel – “competitive lock-in”, or - Decline in face of direct call ports in TS hinterland?....and remember it’s very cost sensitive
icfi.com | ghkint.com icfi.com | ghkint.com
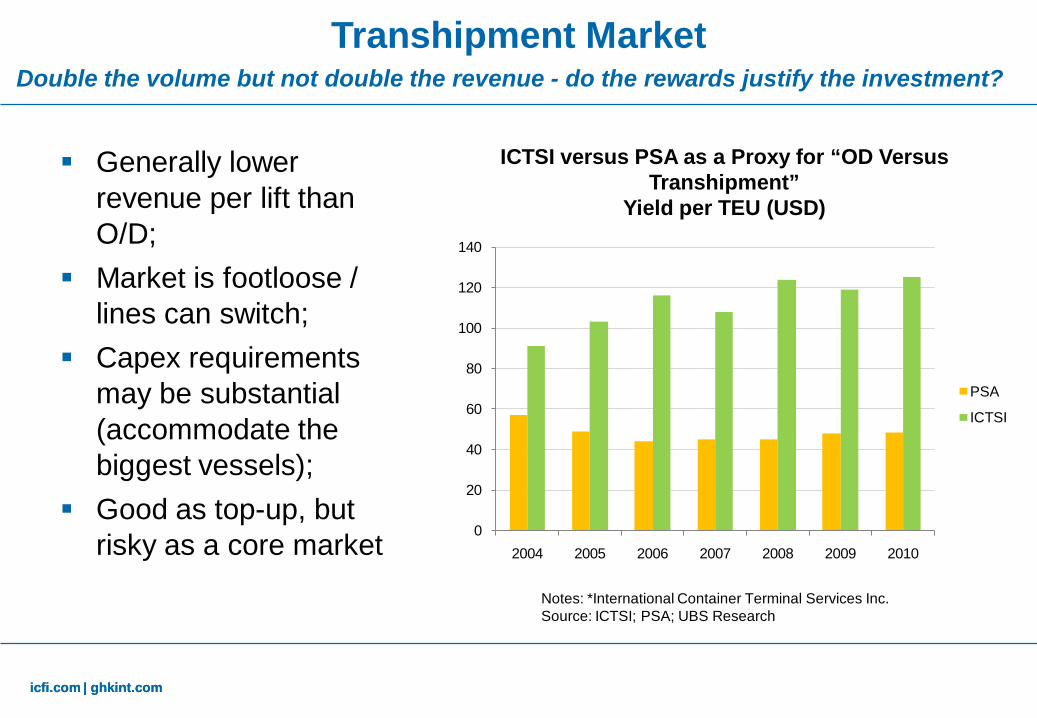
Transhipment Market Double the volume but not double the revenue - do the rewards justify the investment?
Generally lower revenue per lift than O/D;
Market is footloose / lines can switch;
Capex requirements may be substantial (accommodate the biggest vessels);
Good as top-up, but risky as a core market Notes: *International Container Terminal Services Inc.
Source: ICTSI; PSA; UBS Research
ICTSI versus PSA as a Proxy for “OD Versus Transhipment”
Yield per TEU (USD)
0
20
40
60
80
100
120
140
2004 2005 2006 2007 2008 2009 2010
PSA
ICTSI

Productivity – squeezing the most from what
you have − Port reform − What to measure − Impact of market forces
Meeting carrier requirements − Infrastructure & service requirements − Transhipment markets
Financing expansion: adapting to uncertainty & risk − Focus on efficiency and competition − New sources of finance − Securing the hinterland
Context
icfi.com | ghkint.com icfi.com | ghkint.com
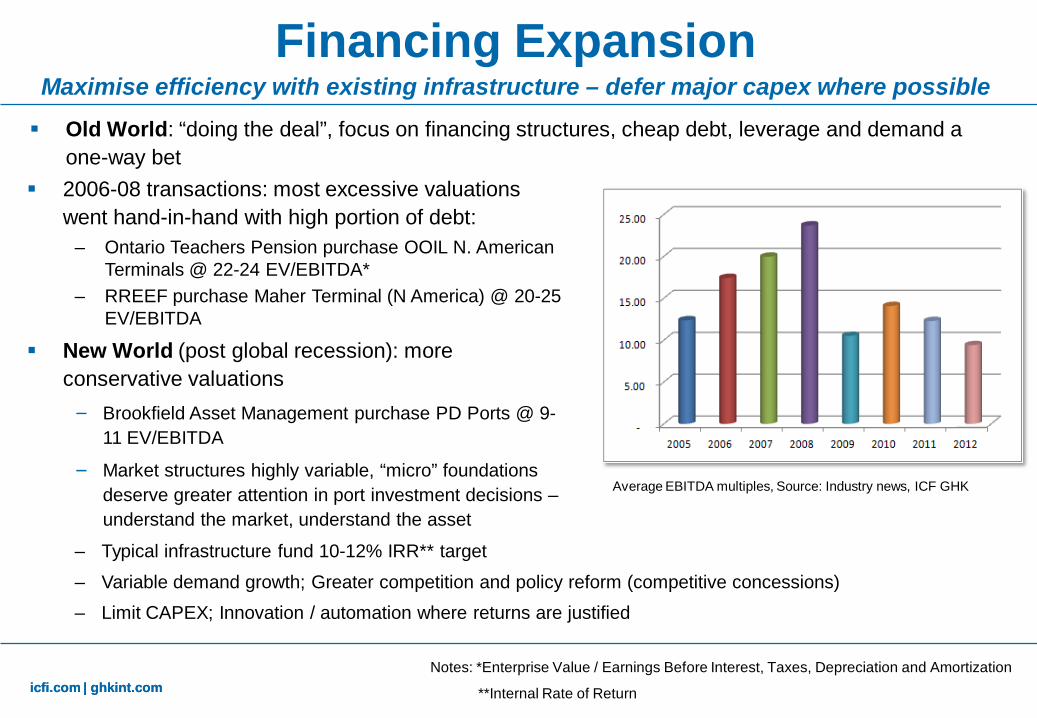
Financing Expansion Maximise efficiency with existing infrastructure – defer major capex where possible Old World: “doing the deal”, focus on financing structures, cheap debt, leverage and demand a
one-way bet
Notes: *Enterprise Value / Earnings Before Interest, Taxes, Depreciation and Amortization
**Internal Rate of Return
2006-08 transactions: most excessive valuations went hand-in-hand with high portion of debt:
– Ontario Teachers Pension purchase OOIL N. American Terminals @ 22-24 EV/EBITDA*
– RREEF purchase Maher Terminal (N America) @ 20-25 EV/EBITDA
New World (post global recession): more conservative valuations − Brookfield Asset Management purchase PD Ports @ 9-
11 EV/EBITDA
− Market structures highly variable, “micro” foundations deserve greater attention in port investment decisions – understand the market, understand the asset
– Typical infrastructure fund 10-12% IRR** target
– Variable demand growth; Greater competition and policy reform (competitive concessions) – Limit CAPEX; Innovation / automation where returns are justified
Average EBITDA multiples, Source: Industry news, ICF GHK
icfi.com | ghkint.com icfi.com | ghkint.com
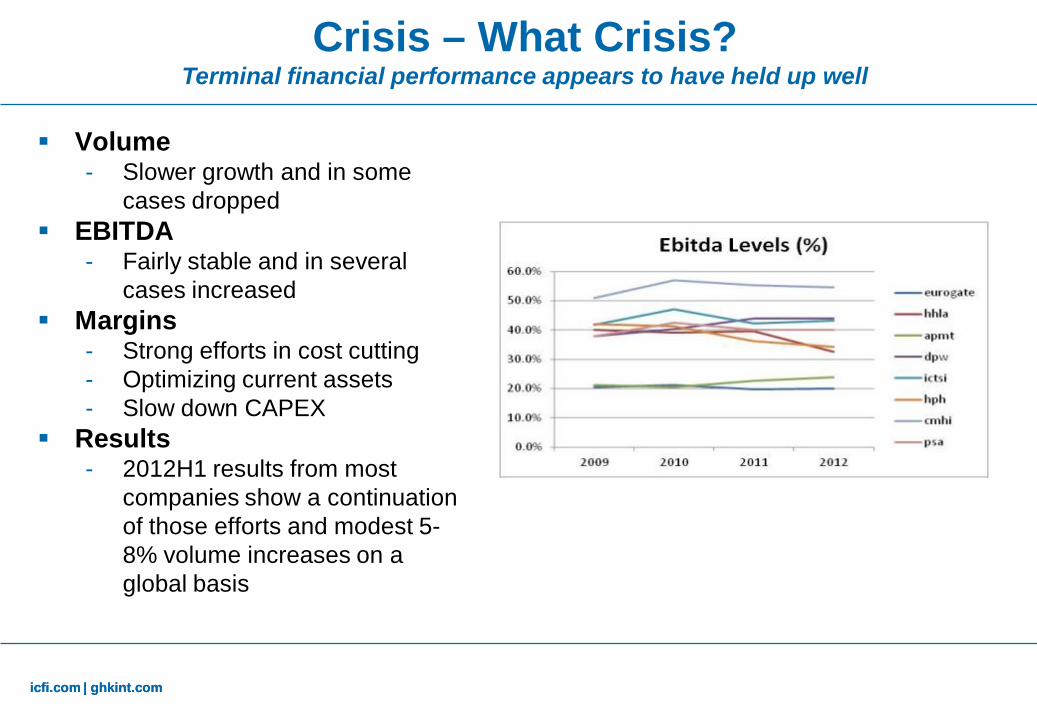
Crisis – What Crisis? Terminal financial performance appears to have held up well
Volume - Slower growth and in some
cases dropped EBITDA
- Fairly stable and in several cases increased
Margins - Strong efforts in cost cutting - Optimizing current assets - Slow down CAPEX
Results - 2012H1 results from most
companies show a continuation of those efforts and modest 5-8% volume increases on a global basis
icfi.com | ghkint.com icfi.com | ghkint.com
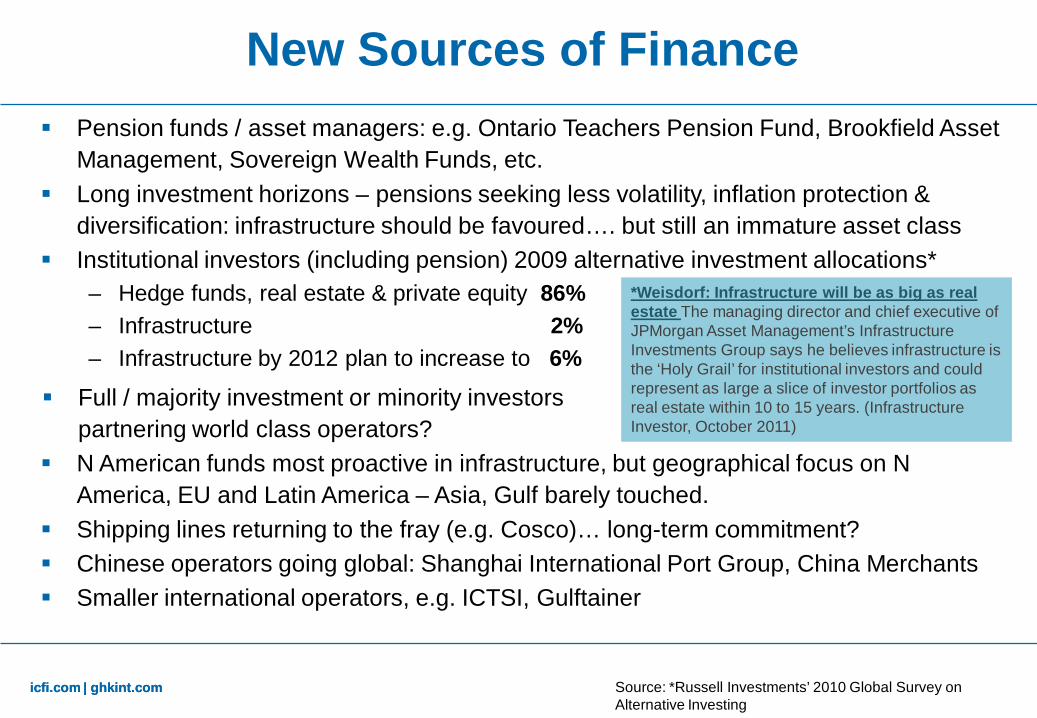
New Sources of Finance Pension funds / asset managers: e.g. Ontario Teachers Pension Fund, Brookfield Asset
Management, Sovereign Wealth Funds, etc. Long investment horizons – pensions seeking less volatility, inflation protection &
diversification: infrastructure should be favoured…. but still an immature asset class Institutional investors (including pension) 2009 alternative investment allocations*
– Hedge funds, real estate & private equity 86% – Infrastructure 2% – Infrastructure by 2012 plan to increase to 6%
Source: *Russell Investments’ 2010 Global Survey on Alternative Investing
*Weisdorf: Infrastructure will be as big as real estate The managing director and chief executive of JPMorgan Asset Management’s Infrastructure Investments Group says he believes infrastructure is the ‘Holy Grail’ for institutional investors and could represent as large a slice of investor portfolios as real estate within 10 to 15 years. (Infrastructure Investor, October 2011)
Full / majority investment or minority investors partnering world class operators?
N American funds most proactive in infrastructure, but geographical focus on N America, EU and Latin America – Asia, Gulf barely touched.
Shipping lines returning to the fray (e.g. Cosco)… long-term commitment? Chinese operators going global: Shanghai International Port Group, China Merchants Smaller international operators, e.g. ICTSI, Gulftainer

icfi.com | ghkint.com
You’re only as good as the weakest link
…and terminal operators do not control all the supply chain links
OPERATIONS NEAR PORT ‘PUBLIC-PRIVATE PARTNERSHIP’ OPERATIONS AT PORT
‘CUSTOMER FOCUS’
Quay Yard
IT
• Road • Inland shipping • shortsea feeder • International
trans-shipment • (Pipelines)
OPERATIONS AWAY FROM PORT
‘SECURING THE HINTERLAND’
Support facilities • Customs • Bank, Insurance, Legal • Freight forwarders, etc.
Infrastructure • Logistics parks • River-road centre • Rail-road centre, etc.
Maritime • Navigation channels • Piloting / towage • Ship repair, etc.
‘SEAMLESS CARGO MOVEMENT’
GOVERNMENT PARTNERSHIP
LOCAL REGIONAL NATIONAL

icfi.com | ghkint.com icfi.com | ghkint.com
Hamburg - HHLA direct involvement in rail services to large part
of the hinterland own trucking services network of inland depots
Rotterdam – ECT large inland depot network (focus on barges
and rail connectivity) Cargo acceptance at the depots Direct investments Operational involvement no rail investments (but service agreements)
Strategy: Reaching Out
icfi.com | ghkint.com icfi.com | ghkint.com
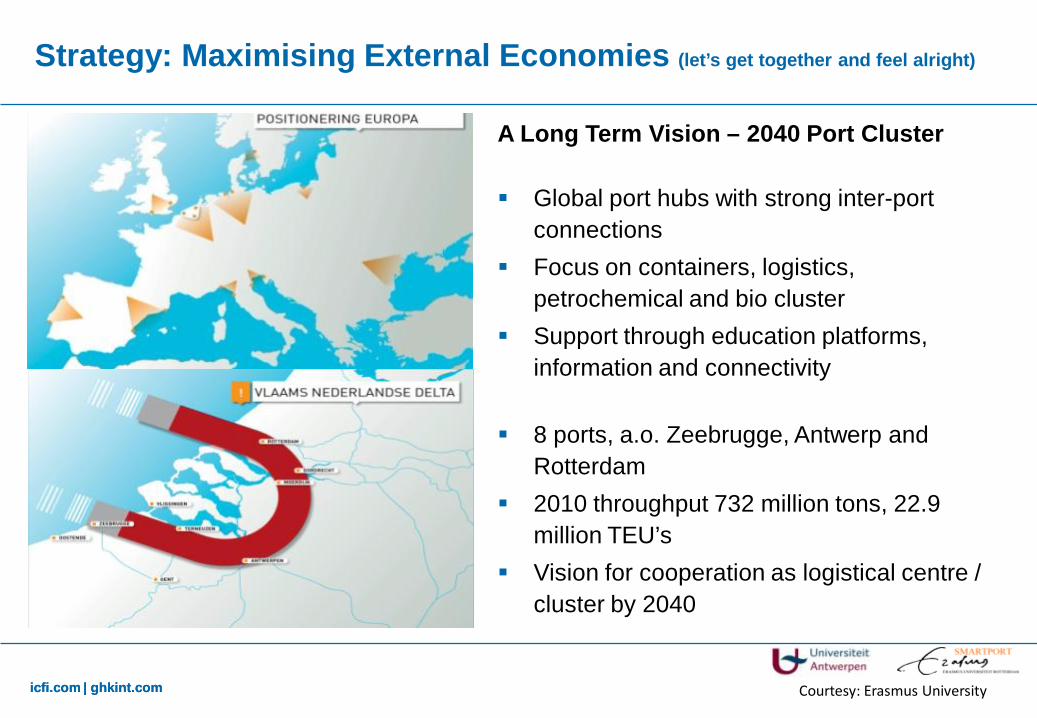
A Long Term Vision – 2040 Port Cluster Global port hubs with strong inter-port
connections Focus on containers, logistics,
petrochemical and bio cluster Support through education platforms,
information and connectivity 8 ports, a.o. Zeebrugge, Antwerp and
Rotterdam 2010 throughput 732 million tons, 22.9
million TEU’s Vision for cooperation as logistical centre /
cluster by 2040
Strategy: Maximising External Economies (let’s get together and feel alright)
Courtesy: Erasmus University
icfi.com | ghkint.com
Wrap: Improving Efficiency – “win-win” Ports are lumpy investments; significant environmental foot-print Emerging economies require substantial new-build, but must also focus on
improved efficiency within and outside terminal: “win-win” in terms of commercial and environmental performance – Enhancing terminal productivity: systems and operations – labour & regulatory
regime is critical – Enhancing efficiency of inland connectivity: trucking, barging….and rail (long-tem) – Regulatory – streamline labour, customs & trade regulations; stable & transparent
operational regime – Full allocation of costs to private sector wherever possible – Level playing field – terminal operators to compete / no collusion on price – Supplement with higher environmental standards: e.g. higher quality bunker fuel,
electrification of yard equipment, etc. Finance for acquisition / expansion increasingly focused on efficiency and better
appreciation of market risks Remember the primary objective for gateway ports: reduce costs for importers &
exporters
icfi.com | ghkint.com icfi.com | ghkint.com
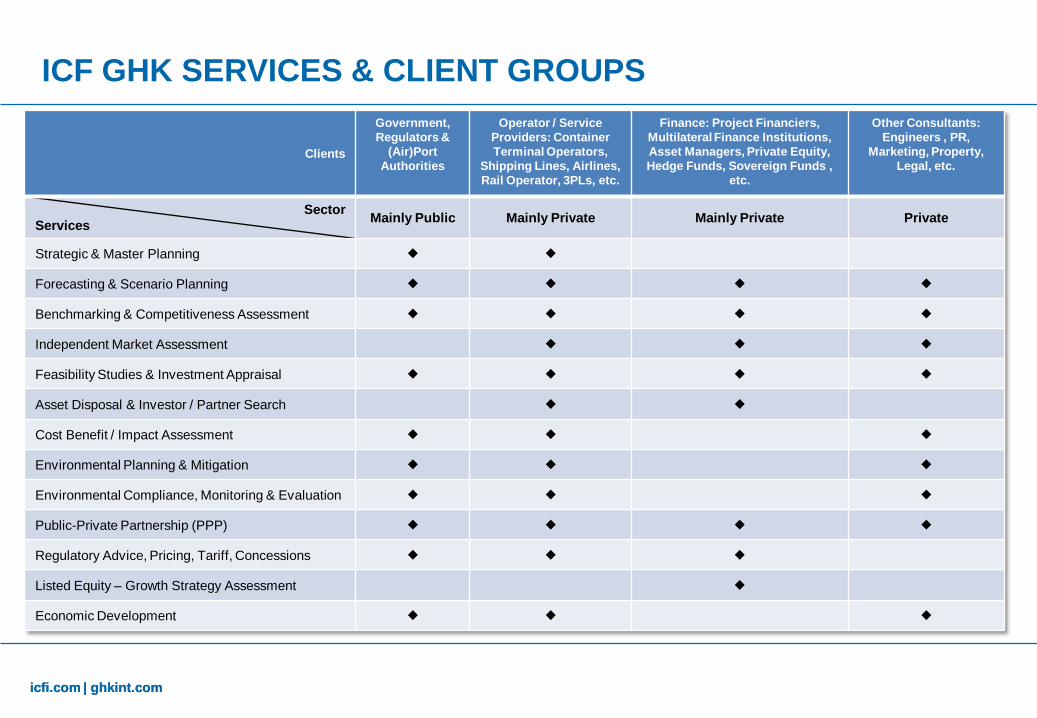
Clients
Government, Regulators &
(Air)Port Authorities
Operator / Service Providers: Container Terminal Operators,
Shipping Lines, Airlines, Rail Operator, 3PLs, etc.
Finance: Project Financiers, Multilateral Finance Institutions, Asset Managers, Private Equity, Hedge Funds, Sovereign Funds ,
etc.
Other Consultants: Engineers , PR,
Marketing, Property, Legal, etc.
Sector Services Mainly Public Mainly Private Mainly Private Private
Strategic & Master Planning
Forecasting & Scenario Planning
Benchmarking & Competitiveness Assessment
Independent Market Assessment
Feasibility Studies & Investment Appraisal
Asset Disposal & Investor / Partner Search
Cost Benefit / Impact Assessment
Environmental Planning & Mitigation
Environmental Compliance, Monitoring & Evaluation
Public-Private Partnership (PPP)
Regulatory Advice, Pricing, Tariff, Concessions
Listed Equity – Growth Strategy Assessment
Economic Development
ICF GHK SERVICES & CLIENT GROUPS
icfi.com | ghkint.com
ICF GHK - Selected Clients
Tiger Global Management, LLC
ICF GHK - Selected Clients
icfi.com | ghkint.com
Thank You – Any Questions?
Hong Kong 19th Floor Heng Shan Centre
145 Queen's Road East Wanchai, Hong Kong
T +852 2868 6980 F +852 2530 4302
London Clerkenwell House
67 Clerkenwell Road London, EC1R 5BL
T +44 (0)20 7611 1100 F +44 (0)20 7368 6960
Beijing China Overseas Plaza, Central Tower
20th Floor, Suite 2001 No. 8 Guanghua Dongli
Chaoyang District Beijing, China 100020 CN
T +86 10 6562 8300 F +86 10 6562 8301
Boston One Main Street
Cambridge, MA 02142 T + 1 617 218 3540 F + 1 617 218 3600
Delhi M-66 GK II 2nd Floor Near M Block Market
New Delhi 110048, India T + 91 11 2696 9553 F + 91 11 2696 6478