Embed Size (px)
Citation preview

A U.S. Department of Transportation University Transportation Center
Port Sustainability and Energy Security Workshop
March 1, 2013
Panel III: Port User and Third Part
Perspectives

Panel III: Port User and Third Party Perspectives >>
Participants
• Angela Billings-Soini, IKEA North America • William Goetz, CSX Transportation • Thomas Heimgartner, Best Transportation • Douglas P. Morgante, MAERSK • Reema Loutan, EPA Region 2
Facilitator Abbas Sarmad - AECOM
Topics
Corporate strategies, plans to work with ports, road maps to success

Angela Billings-Soini is Sustainability Manger for
IKEA Distribution Services with a responsibility for
North America. She is responsible for implementing the
IKEA global sustainability direction in North America
with all transport service providers and IKEA
warehouses. Her area of responsibility includes
exploring ways to reduce CO2 from transportation and
own buildings as well as environmental and social
audits of all North American carriers.
Formerly, Ms. Billings-Soini worked for Nokia in the
Corporate Social Responsibility department focusing
on CSR reporting and communications. Ms Billings-
Soini holds a BA in International Relations from the
University of the Pacific, a MSc in Environmental
Assessment and Evaluation from the London School of
Economics and a MSc in Environmental Science from
Lund University in Sweden.
Panel III: Port User and Third Party Perspectives >>

William G. M. Goetz is Resident Vice President with
CSX Transportation, a company operating the largest
railroad in the Eastern United States. Mr. Goetz
represents CSX with the City of New York, State of New
Jersey, and City of Philadelphia.
Mr Goetz’s 30-year railroad career has included projects
resulting in new terminals and infrastructure throughout
the Eastern United States, many of which were public-
private partnerships.
Mr. Goetz is a board member of the Schuylkill River
Development Corporation in Philadelphia and the
Transportation Research Forum’s New York City
Chapter.
He graduated from the Boston University School of
Management and the Wharton Graduate School of the
University of Pennsylvania. He and his wife Susan
reside in Pennsylvania and New York City.
Panel III: Port User and Third Party Perspectives >>

Panel III: Port User and Third Party Perspectives >>
Thomas Heimgartner is the President of Best
Transportation, which he founded in 1982 modestly as a
one-truck operation with Tom himself behind the wheel.
Through his insight and leadership, Best Transportation has
evolved into a major intermodal carrier now owning over 100
vehicles and servicing the northeast region through The Port
of New York and New Jersey
Tom has been an advocate for improving the work
environment, productivity, and safety of intermodal
transportation. As an industry leader, Tom has met with and
established relationships with many local, state, federal
officials and elected representatives in an ongoing effort to
resolve the problems of unsafe, poorly maintained intermodal
trailers and containers being driven on our highways. He
remains actively engaged in improving highway safety of the
Motor Truck Industry and promoting the growth and efficiency
of The Port of New York and New Jersey.
Tom holds a degree from Rutgers University and has more
than 35 years of transportation experience. He is a member
of the Board of Directors of The Intermodal Motor Carriers’
Conference of The American Trucking Association and the
Association of Bi-State Motor Carriers.

Panel III: Port User and Third Party Perspective >>
DOUGLAS P. MORGANTE was appointed Director of State
Government Relations of MAERSK Inc. in May 2005. As
Director, he works closely with business owners and
colleagues from A.P. Moller – Maersk and all affiliated
companies and departments, as well as with legislators and
staff members of state legislatures on a national basis to
positively influence Maersk Inc.’s legislative and regulatory
interests.
Mr. Morgante joined the A.P. Moller-Maersk Group in
January 1994. He has served in several management
positions for Maersk Line, including route management, and
as representative in Ocean Carrier Rate Conferences and
Discussion Agreements. Prior to his current position, he was
responsible for Regulatory Affairs.
Mr. Morgante currently chairs the Legislative Committee for
the Ocean Carriers Equipment Management Association
(OCEMA).
Education:
- Rutgers College, NJ, B.A. Political Science, 1988.
- Harvard University, John F. Kennedy School of
Government - Infrastructure in a Market Economy
program, Cambridge, MA, 2008.

Panel III: Port User and Third Party Perspective >>
Reema Loutan has worked in the Mobile
Source Section of EPA Region 2 for 10
years. Reema's program responsibilities
include ports, the SmartWay program,
fuels, inspection and maintenance, and
grants. Reema has a Masters in Chemical
Engineering from Manhattan College, and
Bachelor degrees in Chemistry and
Chemical Engineering from NYU and
Stevens Institute of Technology.

Towards More Sustainable Transportation
Angela Billings-SoiniIKEA Distribution Services, North America
2013-03-012013 03 01
At IKEA we are good in using Unit loadsT t t t t th d i t bl !- Transport starts at the drawing table!
Products developed to… …fit flat packages that are… …optimized for pallets that are…
…optimized for containers that can… …be unloaded directly to point of sales.

SCOPESCOPE
W t f d t & We secure movement of products & materials between IKEA associated locations including customers’ homeslocations including customers homes

OUR SCOPEin figures
• 1 3 million shipments per year >99% FL• 1.3 million shipments per year, >99% FL• 30 Million net m3
• 9 500 different articles, produced at 1000 suppliers1000 suppliers
• Transit through 26 DCs and 27 CPs• Making their way to >300 stores• Approx 20 000 units on the road/sea • Approx. 20 000 units on the road/sea
everyday• In addition, deliveries of materials and
deliveries directly to 5 million deliveries directly to 5 million customers’ homes
• Approx. 13 000 movements every day• All this in cooperation with 400 carriers• All this in cooperation with 400 carriers.

CO2 emissions reduction targetCO2 emissions reduction target
C d t th FY11 i iCompared to the FY11 emissions

Actions in reducing CO2
Equipment utilization
Actions in reducing CO2
Equipment utilization– New handling material– Filling rate– Optimal equipment
Inter modal set-ups25 000 i l – 25 000+ units last year
Direct deliveries– >50% shorter distances– >50% shorter distances
Regional sourcing Carrier fuel reduction Carrier fuel reduction Truck age

HM NOW – Phase out of wooden pallets
• IKEA has decided to phase out wooden pallets
HM NOW Phase out of wooden pallets
Phase out of wooden pallets• Lower costs & more sustainable:
– No return flows of empty wooden pallets– More efficient use of wood as raw material in recyclable paper pallets– Lower total cost– Less emissions
• HM NOW is an enabler for higher equipment
© Inter
HM NOW is an enabler for higher equipment– A combination of lower handling material and higher transport
equipment enables a reduction of number of transports.
IKEA
System
s B.V. 2011

Filling rate activities
27 Consolidation points
Filling rate activities
27 Consolidation points Transit set ups in DCs Co-loads & Milk Runs Load optimization tools at
suppliers
Combine heavy & light goods while fulfilling availability g ydemands

Combination of activities gives resultg
C40HC
+ + ++ + +
Utilization of the extra space is key

Green Freight Initiativesg

Thank you!y
© Inter IK
EA S
ystems B
.V. 2011

1 1
Railroads At Sustainable Ports March 1, 2013

Freight Rail’s Long-Term Fundamentals: Best in 50
Years.
Eisenhower Era 21st Century Rail Significance
Virtually Unlimited Supply of
Cheap Petroleum
Erratic Commodity Prices;
Long-Term Supply Questions
Compared to Long-Haul
Trucking, Rail Uses 1/4 Fuel
Environmental Insignificance Environmental Awareness Freight Rail: Part of the Solution
Not Part of the Problem
Rapid Growth of Limited Access
Highway System
Rising Highway Repair Cost;
Extensive New Untolled Route
Mileage Unlikely
Re-think Asphalt-Only
Strategies. Reconsider Rail and
Water Solutions
Sprawl Urban Rebirth Revival where Rail
Infrastructure is Strong
Railroad Management Mindsets
Shaped by WWII Railroad Industry Pragmatism
Customer-Driven Business
Strategy


4

Bergen Tunnel
Waldo Tunnel
Liberty Corridor Freightway

Waldo Tunnel Was Improved by Daylighting Its
South End
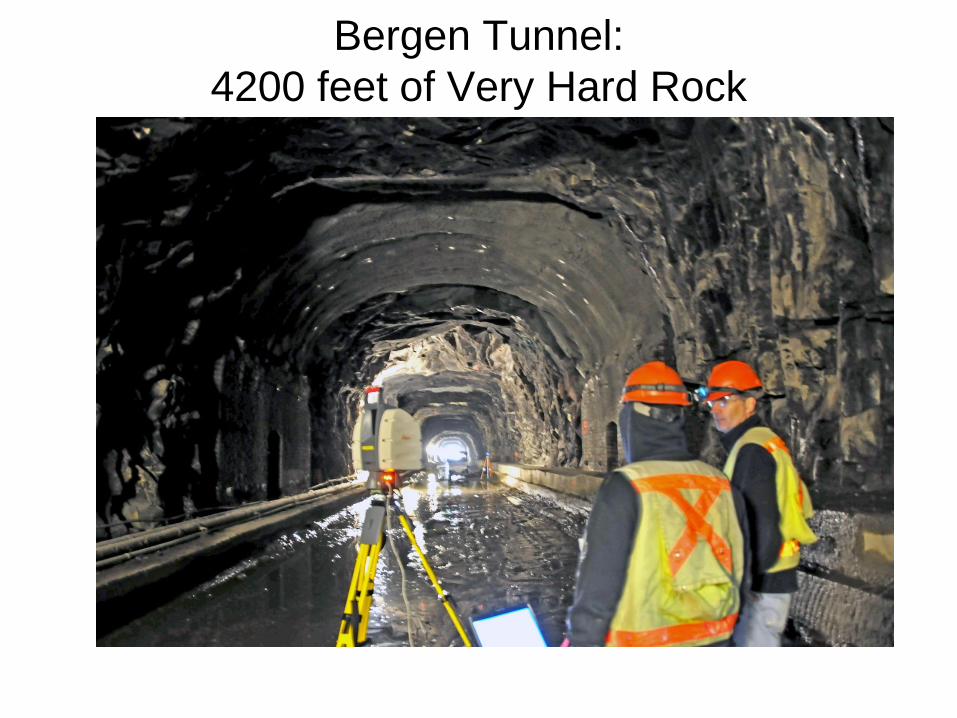
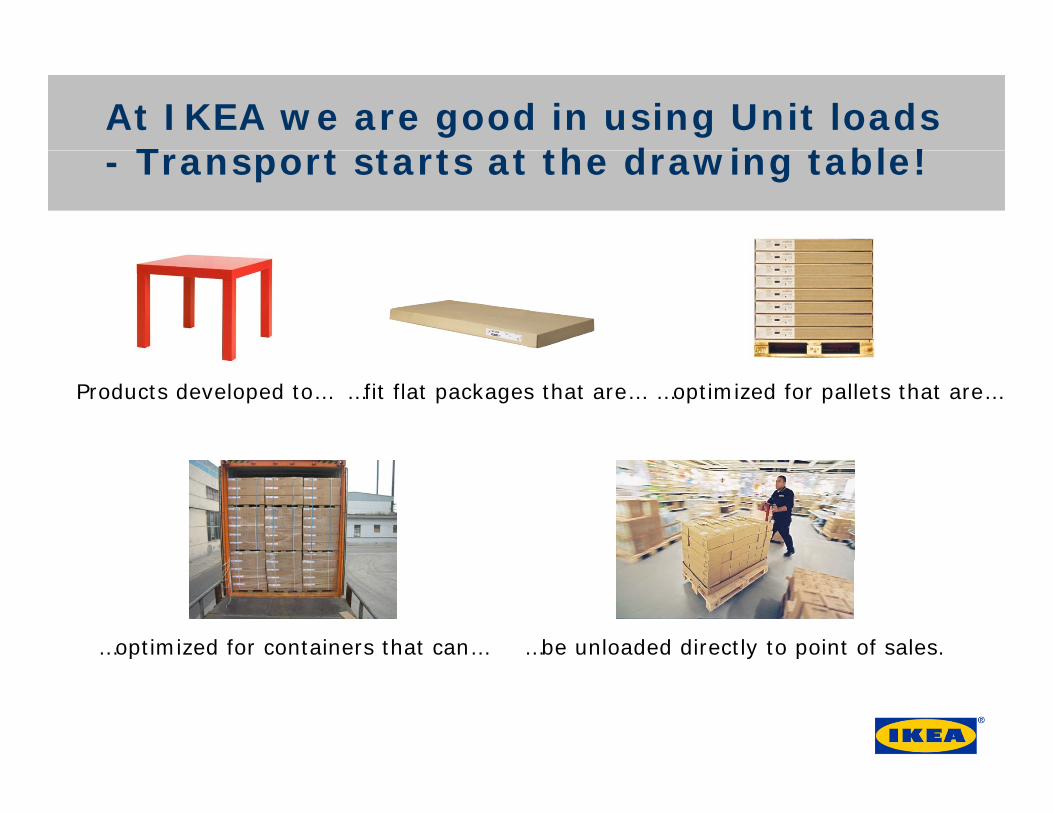
Bergen Tunnel:
4200 feet of Very Hard Rock

Bergen Tunnel:
Well Built…150 years ago

Construction Completed Under Budget
in One Construction Season
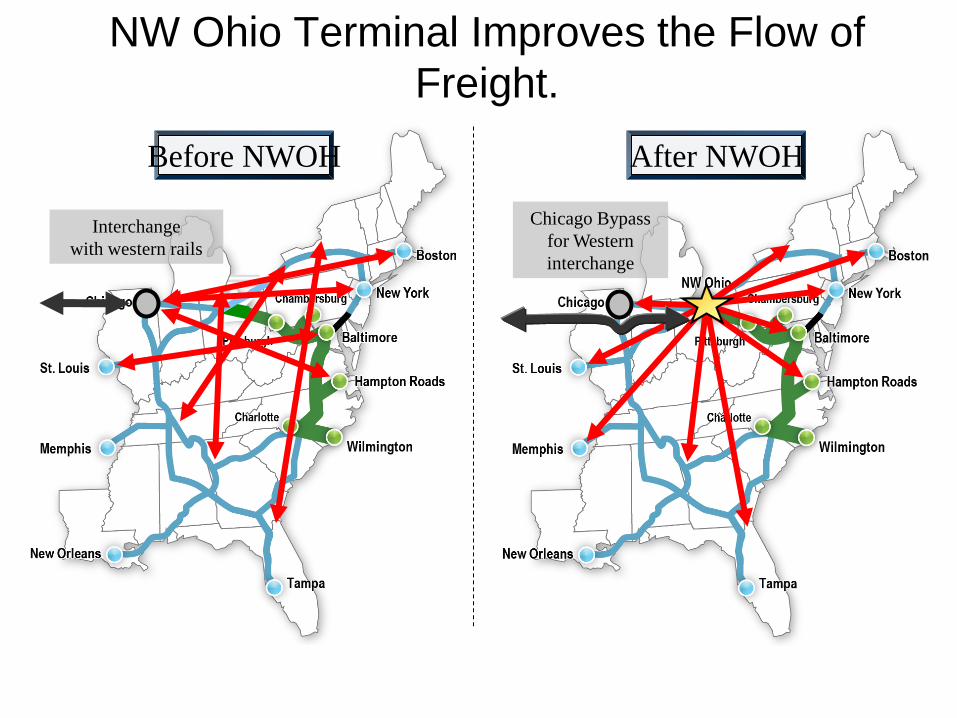
NW Ohio Terminal Improves the Flow of
Freight.
Interchange
with western rails
Before NWOH
Chicago Bypass
for Western
interchange
After NWOH

Opening of Northwest Ohio Terminal is a Major
Milestone.
• Opened February 22, 2011
• Cost: $175 million
• Construction Time: 18 months
• 500 acres
• 200 employees at opening
• 24,000 feet of working track
• 100,000 feet of block swapping track
• Parking for 280 units
• Five cranes spanning eight tracks
• Will process 30 trains daily when fully
network integrated
• CSX’s largest Intermodal terminal

Northwest Ohio Terminal Anchors National Gateway
and Other CSX Intermodal Corridors

GenSet Locomotives
• Replaces locomotive’s large diesel engine with two or three smaller engines, each with its own generator
• Locomotive only powers on engines sufficient for its pulling load
• Best suited for yard switching applications
• Cuts fuel consumption 25%
• Cuts CO2 emissions 25%
• Cuts NOx emissions 80%
• $1.5 million to retrofit an existing locomotive
Thank You

BEST TRANSPORTATION
Tom Heimgartner
President
Best Transportation LLC.
Port Newark, NJ
Rutgers Port Sustainability and Energy Security Workshop
Friday, March 1, 2012


BIAS ON OPEN WHEEL = HIGH ROLLING RESISTANCE
RADIAL ON HUB PILOTED WHEEL = LOW ROLLING RESISTANCE
CHASSIS TIRES
VS


Maersk Line:
Environmental and
Operations Perspectives
Port Sustainability & Energy Security Workshop Rutgers University -- 3/1/2013
Doug Morgante – Director, State Government Affairs Lee Kindberg - Director, Environment & Sustainability

Insert department name via
‘View/Header and Footer…’
Agenda
• Challenges we faced due to
Hurricane Sandy
• Operational challenges
• What we are doing about
climate change
• Emissions reduction on our
cargo vessels
1

Insert department name via
‘View/Header and Footer…’
Hurricane Sandy – aftermath
• Ports were closed over a week
• Vessels had few alternatives – Halifax?
• Maersk Line had 2785 containers in
Norfolk and 680 in Philadelphia that
needed to get to Port Elizabeth.
• Some containers were cleared and picked
up by customers. The rest moved in bond
to Newark.
• It took 26 days to clear the backlog.
• Cost est. $2.5M to Maersk Line and our
customers, truck, rail, extra bunker).
2
Possible Future Solutions: 1. Jones Act waiver in an emergency: The Jones Act requires that all goods
transported by water between U.S. ports be carried in U.S.-flag ships, built in the US, owned by US citizens, and crewed by US citizens/permanent residents. For the future a one-time waiver would allow faster recovery with Lower cost and environmental impact.
2. Review changes to the Stafford Act (Relief and Emergency Assistance

Insert department name via
‘View/Header and Footer…’
The Bayonne Bridge is an operational limitation for vessel operations.
• A solution is in place, the bridge will be raised.
• We already have problems getting under the bridge today.
• This is due to the vessel’s high air draft -- transit of the bridge is sometimes not
possible to meet the scheduled arrival.
• Less water draft = higher air draft. Full vessel = lower air draft.
• With 50+ feet of water depth and a raised bridge, we should not
experience delays.
Possible outcomes due to delays in project completion: Local cargo Discretionary cargo Panama Canal Expansion More cargo volume? Economies of scale: larger vessel mean more cost efficient moves per container – less emissions – increased volumes good for the economy.
3

Insert department name via
‘View/Header and Footer…’
Vessels are increasingly fuel efficient. This reduces fuel use, CO2 and other air emissions.
CO2 and other emissions were reduced 25% per TEU km from 2007 to 2012.
CO2 reduction goal has now been raised to 40% for 2020
Reductions were achieved through a combination of vessel size, technologies,
route planning and operational changes.
2007-2011 data was verified by:
45
50
55
60
65
70
75
80
2007 2008 2009 2010 2011 2012
Maersk Line CO2 Reductions
CO2 Emissions g/TEU*Km
Previous 2020 Targetreduction from 2007baseline
Revised 2020 Targetreduction from 2007Baseline
4
Met 2020 goal
for CO2
reduction 8
years early!

Insert department name via
‘View/Header and Footer…’
Innovation is essential for sustainability
Other Initiatives
Alternative fuel tests
New propulsion technologies
ISO 14001 certified
Crew awareness and engagement
Maintenance of hull and propeller
Voyage Efficiency System (VES)
Trim optimization
SOx scrubber studies
Antifouling hull paint
QUEST: Low energy
chilled containers
Modified bulbous bow
Micro bubbles
Ballast water optimization
and treatment systems
Propeller, hull & trim optimization
Waste heat recovery system
Slow steaming and super-slow steaming
5

Insert department name via
‘View/Header and Footer…’
Vessel environmental improvements take time and partnerships.
New vessels Existing fleet
• Identify or develop technologies
• Work with Charter vessel owners
• Partner with technology, software and
engine suppliers
• Identify the right mix for each vessel
• Optimize vessels for intended
services
• Potential energy efficiency
improvements 20-50%
• Work with shipyards, equipment
and fuel suppliers
• Long-term view plus short-term
impact
Personnel
•Vessel crews •Shore side teams •Structures, metrics, idea sharing
6
Insert department name via
‘View/Header and Footer…’
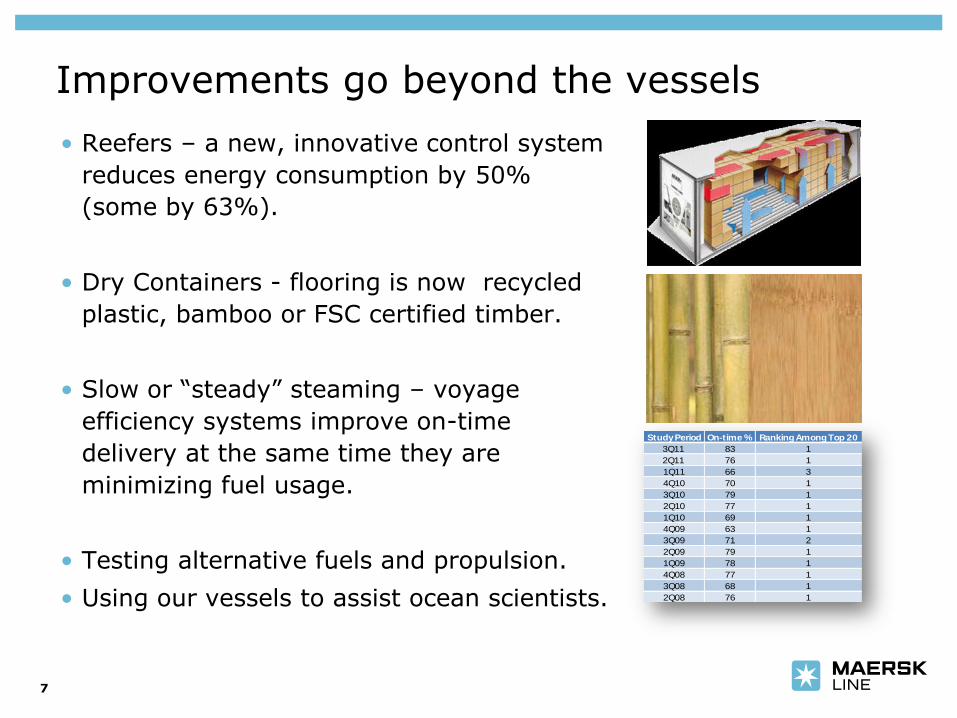
Improvements go beyond the vessels
• Reefers – a new, innovative control system
reduces energy consumption by 50%
(some by 63%).
• Dry Containers - flooring is now recycled
plastic, bamboo or FSC certified timber.
• Slow or “steady” steaming – voyage
efficiency systems improve on-time
delivery at the same time they are
minimizing fuel usage.
• Testing alternative fuels and propulsion.
• Using our vessels to assist ocean scientists.
Study Period On-time % Ranking Among Top 20
3Q11 83 1
2Q11 76 1
1Q11 66 3
4Q10 70 1
3Q10 79 1
2Q10 77 1
1Q10 69 1
4Q09 63 1
3Q09 71 2
2Q09 79 1
1Q09 78 1
4Q08 77 1
3Q08 68 1
2Q08 76 1
1Q08 63 3
7

Insert department name via
‘View/Header and Footer…’
Maersk Line Terminal Efficiency Project: Port Captains at larger ports work with terminals to reduce port stays through process improvements
Arrival at sea 1
Pilot time 2
Arrival (first line to first move) 3
Operations 4
Departure (last move to last line) 5
Pilot time 6
Buoy/pilot station
Previous port to Pilot A
Pilot to next port B
Example: performance (hours)
18,8
-26%
Best observed /Target
2,9 0,4
12,2
0,0
2012 Actual
25,3
3,2
1,1
16,5
1,0
3,5 0,1
3,0 0,2
Vessels on time
More timely
and accurate planning
Optimized port stay
and
Reduced emissions
8

Insert department name via
‘View/Header and Footer…’
Thank you
9

Insert department name via
‘View/Header and Footer…’
Mode selection is a major factor in supply chain environmental impact.
Graphic provided by Edgar
Blanco, MIT Center for
Transportation & Logistics
Ocean shipping has the
lowest environmental
impact for long distance
transportation…
Then rail…
Then truck…
And air has the highest
impact.
10

1
Reducing Drayage Emissions
U.S. EPA SmartWay Transport Partnership Program
Reema Loutan
Mobile Source Section
US EPA Region 2
Port Sustainability and Energy Security Workshop
Rutgers University
03/01/2013
• Goals:
– Improve the environmental and energy efficiency of goods movement
– Promote investment in clean, efficient technology and operational
strategies
– Enable and complement EPA regulation
• Outcomes:
– Achieved climate and air quality benefits - national and place-based
– Contributed to economic growth and energy independence
– Drove innovation and investments in clean truck, trailer & tire
technologies
– Leveraged existing market forces through collaboration and brand
value
2
Moving Goods the SmartWay

3
Businesses use SmartWay to Demonstrate
Commitments to Sustainability

A Few of SmartWay’s 3000+ Partners
4

Addressing Drayage Emissions
• Dray Trucks: Unique, Challenging
– Very old trucks
– Low income owner-operators
– Limited benefits from fuel-saving equipment
– PM, ozone and toxics are the major priority, not GHG
• Created SmartWay Drayage criterias that balance:
– Financial consideration
– Available emission reduction technologies
– Superior environmental performance
5

SmartWay Drayage Program
• SmartWay shipper and logistics Partners assess the emissions
performance of their carriers, including drayage carriers
• Drayage carriers commit to track and report their emissions on
an annual basis with SmartWay tools
• With access to environmental performance data
– Carriers can cut costs, benchmark internally and against competition,
and attract customers looking for greener choices
– Shippers can identify greener choices to reduce carbon footprint and
improve supply chain efficiency through carrier/mode selection
– Information supports competition & demand for top performers
6

EPA Commitments
• SmartWay commits to support our drayage partners by:
– SmartWay provides a network of proven technologies and driving
techniques that reduce emissions and fuel consumption
– EPA assists SmartWay drayage carrier Partners in developing and
meeting goals
– Drayage carriers gain access to SmartWay Partner Account Managers
who serve as important sources of personalized insight into how you can
improve performance
• For details on the SmartWay Drayage Program, visit:
– www.epa.gov/smartway/partnership/drayage.htm